TEN-T Delivering - Facts & figures - Connecting Europe
←
→
Page content transcription
If your browser does not render page correctly, please read the page content below
Delivering
TEN-T

Facts & figures
           SEPTEMBER 2017
                            designed by

 Mobility
 and Transport
  Mobility and
  Transport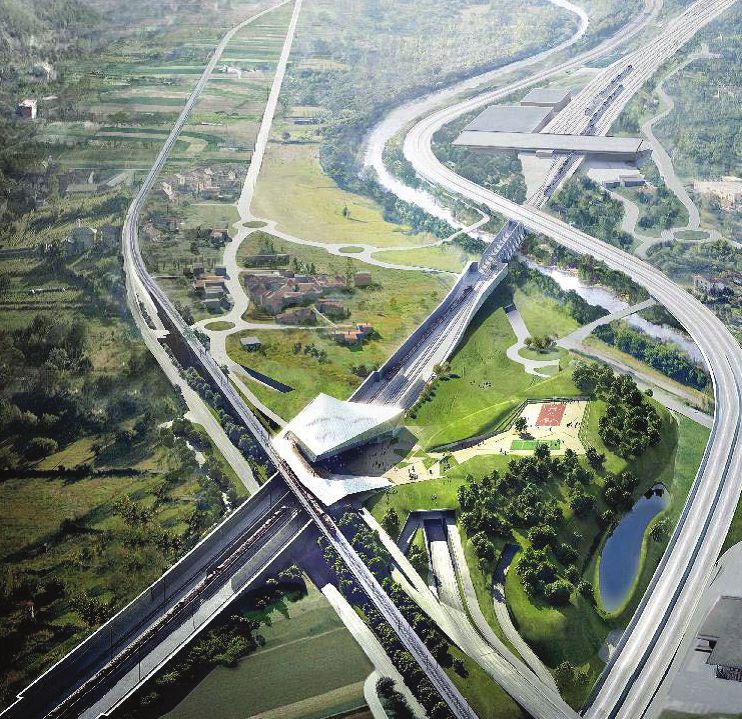

DELIVERING TEN-T
Table of content

•   Key facts about the transport sector and EU transport policy objectives
•   Estimated investment needs for transport infrastructure, framework conditions and
    related impacts
•   EU transport infrastructure – key results

Annexes
•   TEN-T Information Fiches:
       •   Core Network Corridors
       •   ERTMS deployment
       •   Motorways of the Sea
       •   Major TEN-T cross-border projects
       •   Examples of clean and innovative TEN-T projects
•   Execution of the CEF-Transport budget together with key performance indicators and
    results in terms of priorities
•   EIB lending-Execution of the EFSI, CEF-Debt and innovative financial instruments

                   MN U R
I. Key facts about the transport sector and EU transport policy
objectives

1.Transport policy objectives
Transport is a strategic sector of the EU economy. Prerequisite for most of the activities in the society, it has
a major impact on Europe’s social, economic and environmental development.
Transport contributes to economic growth and jobs, global competitiveness and trade, enabling people and
goods to move across Europe and beyond. Transport is the key enabler of the four freedoms of movement
defining the Single Market - people, goods, services and capital.
Transport directly affects everyone in Europe. Whatever age we are, and whatever activities we undertake,
transport and mobility play a fundamental role in today’s world. The Commission’s aim is to promote mobility
that is efficient, safe, secure and environmentally friendly, serving the needs of citizens and businesses.
In order to contribute to achieving the overall goals set at EU level, the Commission has set a number of
objectives for transport policies based on the priorities outlined by President Juncker1. Achieving a well-
interconnected, interoperable and efficiently managed transport system in Europe, able to support EU
economic growth and global leadership, requires a coordinated long-term approach at EU level. Transport
means connectivity and mobility. Europe’s competitiveness on the global scene will increasingly depend on
its level of connectivity and efficiency both inside and in respect to the rest of the world. Investment and,
especially infrastructure investment, is a major driver to strengthen the prosperity and cohesion in the Union,
and to fight climate change and negative externalities from transport activities. Adequate infrastructure,
innovative intelligent transport systems (ITS), measures to improve the safety, security and environmental
performance of the transport sector are essential.
Commissioner Bulc supports the vision of a Transport Union aiming at 2 priorities: (i) promoting efficiency in
the EU single market, and (ii) connectivity on a global scale. These goals are empowered by: decarbonisation,
digitalisation, investment, people’s benefits, innovation and global leadership.

1          EU transport policy and investment activities contribute actively in particular to the following 5 Priorities: Priority 1: "A New
Boost for Jobs, Growth and Investment", Priority 2: "A Connected Digital Single Market", Priority 3: "A Resilient Energy Union with a
Forward-Looking Climate Change Policy", Priority 4: "A Deeper and Fairer Internal Market with a Strengthened Industrial Base", Priority
9: "A Stronger Global Actor".

                                  MN U R
•   Decarbonisation: The objective is to move towards a zero emissions European transport system in a
    sustainable economy.
•   Digitalisation: The objective is to develop a seamless digital layer through the entire single European
    transport area.
•   Investment: The objective is to Connect Europe thanks to multi-modal transport infrastructure in Europe
    and beyond and to create an environment more conducive to private and public investments.
•   People’s benefits (rights, safety, security, jobs): The objective is to improve the wellbeing of EU
    citizens, thanks to affordable, accessible, reliable, and secure transport networks without unnecessary
    administrative burdens. Establish transport as an asset for competitiveness of the EU economy
•   Innovation: The objective is to make the EU a global leader in innovative, multimodal mobility solutions,
    harnessing automation.
•   Global leadership: the objective is that EU acts on the international scene as an influential partner.
    Collaboration and economic diplomacy will promote the EU vision and standards at the global scale.
The EU added-value is:
•   to promote EU and global cooperation and co-creation opportunities via multi-stakeholder engagement
    (political dialogue, business fora, connectivity platforms, transport dialogues, civil society) for sustainable
    solutions in mobility and connectivity;
•   to accelerate the shift to low-emission mobility solutions. Our engagement in research and pilot activities
    will need to be complemented with wider-scale deployment tools allowing to quickly reaching a critical
    mass and to include sector and areas not served by the market in a satisfactory manner;
•   to accelerate the shift to innovative and digital-based solutions to maximise efficiency, interconnectivity,
    scalability and adaptability;
•   to catalyse public and private finance towards the EU policy objectives, e.g. completion of the TEN-T
    core network by 2030 and the new low-emission mobility; to enable key investment where the costs are
    national/local and the benefits are tangible at European scale, e.g. cross-border sections, low-emission
    modes, interoperability systems;
•   to develop EU financing instruments to promote European investments inside and outside the EU, in
    close cooperation with EIB and other public financial institutions;

2. Key facts about the transport sector in the EU
•   Transport sector (services, manufacturing, maintenance, construction) accounts for more than 9% of EU
    Gross Value Added (GVA). Transport services alone account for around € 651 billion in GVA, or 5 % of
    total EU GVA in 2015.
•   Transport sector (services, manufacturing, maintenance, construction) employs more than 20 million
    people, or more than 9% of total EU workforce. Of this, transport services employ around 11 million
    persons, or around 5.1 % of the total EU workforce.
•   13% of household consumption expenditure (2015) is spent on transport items – second only to
    housing.
•   EU exports of machinery and transport equipment account for over 40% of goods exports, or €751
    billion in 2015. Exports of road vehicles accounted for € 202 billion of this amount, and other vehicles
    (ships, trains, planes) an additional € 94 billion.
•   EU export of transport services accounted for 17.3% for an amount of €143.6 billion in 2015. This left
    a trade surplus in this sector of €16.7 billion.

                           MN U R
The transport sector also generates significant additional economic benefits:
•    Efficient mobility services and global connectivity are the prerequisites for almost all other economic
     sectors to function, to enable social exchanges, tourism, competitiveness of EU businesses, and to foster
     innovation. For example, transport:
     •    addresses the mobility needs of more than 500 million European people;
     •    ensures the flows of goods from more than 11 million EU industries to their consumers;
     •    enables the smooth functioning of international trade, allowing the EU to export their products to the
          rest of the world for a total value of more than € 1700 billion per year.
•    IMF estimates that an increase in public investment in infrastructure of 1% of GDP leads to a 1.5 %
     increase in GDP over four years. If countries plan and execute infrastructure well, the return is even
     greater: 2.6 % over four years.

However, transport also generates negative external effects such as accidents, GHG emissions, air
pollution, noise and other environmental effects (illustrative figures from 2011-2016 studies2):
     •    25.500 lives were lost in 2016 and 135.000 people annually are seriously injured in road accidents
          in the EU;
     •    transport represents 24% of total GHG emissions (excl. intl. shipping) - approx. 1 billion tonnes CO2;
     •    air pollution amounted to costs approx. 0.43% of EU GDP in 20083;
     •    noise amounted to costs approx. 0.15% of EU GDP in 20083;
•    External costs due to transport have been evaluated to be equivalent in value to approx. 4% of EU GDP
     (excluding congestion, 2008)3.
     •    delay costs of road congestion: 1% of EU GDP (140 billion €/275€ per EU citizen in 2014)4; hours
          spent yearly in road congestion by the average driver: 29.5 hours (2015).

2         A complete report of these externalities will be available in 2019. The abovementioned costs are quantification in monetary
terms of non-market items (lives, health, air quality, time, etc.) merely expressed as % of GDP for an idea of their size; therefore they
cannot be compared to the share of transport in the economy as % of GVA.
3         Source: CE Delft, INFRAS, Fraunhofer ISI (2011). External Costs of Transport in Europe. Update Study for 2008.
4         Source: Ricardo, TRT (2017). Study on urban mobility – Assessing and improving the accessibility of urban areas

                                 MN U R
II. Estimated investment needs for transport infrastructure, framework
conditions and related impacts
The preparation of a new proposal for an investment instrument in support of the EU transport policies
(including trans-European networks) under the next multi-annual financial framework (MFF) requires a
thorough estimation of the investment needs.
Transport investment needs can be estimated in different ways:
(A) Assessment of the project pipeline by the Commission services and on the work carried out by the TEN-T
European Coordinators in the framework of the Core Network Corridor work plans;
(B) Following the request of Commissioner Bulc, Member States recently provided their own estimates of
the investment needs on the core and comprehensive network. Moreover, Member States provided feedback
on what could be done to enhance the regulatory framework, to boost the project pipeline and to develop
financial instruments with the help of the EU.

I. First Pillar. Estimated investment needs to implement the TEN-T
A. Investment needs according to the Core Network Corridor Work Plans
DG MOVE reviewed the project list with a view to refine the knowledge and prioritisation of the projects
necessary to complete the Core Network Corridors. This process was accompanied by further analysis on
the expected impact of the realisation of the corridors.
Following this analysis, it is expected that the investments from 2016 until 2030 needed for realising the core
network in its totality amounts to about EUR 750 billion5. Assuming that investments are spread equally over
the period, the needs for 2021-2030 to realise the core network would thus amount to about EUR 500 billion
for the EU28.

B. Investment needs according to Member States
Member States communicated their own estimate of investment needs on the core and on the comprehensive
networks. They also indicated the share of investment that would need EU grants and that would be suitable
for EU financial instruments (loans, guarantees, equity). 25 Member States have communicated their figures
and 3 Member States have indicated that estimates are not feasible at this stage.

The investment needs over the period 2021-2030 can be summed up to about EUR 500 billion6 for the
TEN-T core network (broadly in line with the Commission’s estimate, excluding UK) and about EUR
1.5 trillion including the TEN-T comprehensive network and other transport investments7.

5       Expressed in 2015 price levels. The figure for the Core Network Corridors alone amounts to EUR 607 billion for 2016-2030.
6       EUR 488bn for the 25 Member States which responded, including a broad estimate for the remaining two Member States and
        excluding the UK
7       Other transport investments include urban transport, intelligent transport systems, upgrade, etc. It should be noted that
        several Member States indicated growing needs for repair and maintenance of transport infrastructure.

                             MN U R
II. Appropriate EU funding and financing instruments to address investment needs
In their replies, Member States also reflected on the way that EU instruments provide support to transport
investments. They notably made proposals to simplify the rules and procedures for obtaining CEF grants
(incl. via blending with funds from public or private banks) and the monitoring thereof, to allow more flexibility
and to align CEF and other EU funds. While acknowledging the growing role of financial instruments, Member
States also insisted on the need for continued grant support to address market failures in terms of positive
and negative externalities of transport infrastructure investments.

A. EU help to develop financial instruments
Member States generally supported a wider application of the blending approach (not only under
CEF). They stressed the need for exchange of best practice and technical assistance, including for project
promoters.
Concrete proposals include: the expansion of the scope of EFSI and CEF blending calls (e.g. to include
the comprehensive network or longer and more complex projects), higher co-financing rates for projects
using IFIs, taking into account sectorial or geographical specificities, introducing comparable or similar rules
across different financial instruments, allowing the use of a wide array of financing options, reducing the
administrative burden, protecting investments from interest rate risks and economic cycles, developing
investment fund type of financing platforms (e.g. for cross-border projects, multimodal logistic platforms,
innovation and energy efficiency in transport, Motorways of the Sea), preparing toolkits for Member States to
disseminate information on financial instruments, conducting analyses of acceptable cost for infrastructure
users and possible private capital involvement in non-revenue projects.
Some Member States also proposed to evaluate financial instruments before introducing new ones.

B. Continuing need for grants
While there is general acknowledgement of the growing role of financial instruments, the majority of Member
States insisted on the need to continue or (significantly) reinforce the grant part of EU funds as the main
method of intervention. This message comes out particularly clearly for modes of transport such as railways
and inland waterways, as well as for cross-border projects for which financial instruments are not always
appropriate.
Grants are also seen as essential to attract private financing and to close the gap between cohesion and other
Member States. Smaller Member States highlighted the difficulty to implement PPP schemes in areas with
low traffic and limited population. Others feared disadvantages when not wishing to use financial instruments.
While some asked for attribution of funds based on merits, others would favour a fair geographical distribution.
Funding for comprehensive network should be expanded and better incentivised, according to one Member
State.
Several Member States stressed the need to reflect on possible support to maintenance and repair of the
network (where it has EU added value), as well as its modernisation and optimisation. New challenges such
as digitalisation and automation and the resulting investment needs in interoperable networks were also
highlighted. Some cohesion Member States insisted on the continued importance of road investments and
asked for transparent funding rules in this regard.
Some cohesion Member States proposed to eliminate the situation in which there is competition between or
doubling of financial resources from different EU funds and diverging requirements e.g. in terms of necessary
permits.

                           MN U R
C. Articulation between grants and financial instruments
The estimation of the share of grants and innovative financial instruments to respond to these investment
needs led to very different replies among Member States. More than half of the Member States did not
provide such estimates, judging that it could not be done on the basis of a solid methodology at this stage.
The proportion of investments using financing from EU grants was indicated at levels ranging from 9,4% to
100% for the core network, from 0,1% to 100% for the comprehensive network and from 0% to 100% for other
transport investments.
The proportion of investments that could be using financial instruments was estimated at levels ranging from
0% to 75% for the core network, from 0% to 50% for the comprehensive network, and from 0% to 50% for
other transport investments.
This shows that there is a large diversity in approach among Member States on the split between grants and
financial instruments to finance transport investments.

III. Second Pillar. Conditions to boost the project pipeline
Plans of Member States to boost the project pipeline generally involve the adoption and regular evaluations
or update of long-term transport strategies and plans (at different levels, based on traffic models and sector
trends), clear and stable prioritisation, consensus-building, pooling of investments as well as special attention
to the project preparation phase, collaboration between and appropriate capacities of the relevant parties.
Assessment of the viability and impact on the local population, as well as possible use of financial instruments
and using the European Investment Project Portal were also mentioned as ways to enhance the planning
of investments. One Member State adopted a strategy on accelerating planning procedures, following an
Innovation Forum on the topic.
In addition, Member States proposed to strengthen the regional and local presence of the European
Investment Advisory Hub, to provide technical assistance for project preparation and to promote exchange of
best practice on building mature project pipelines.

IV. Third Pillar. Enhancing the regulatory framework
Member States highlighted possible ways to improve the regulatory framework with a view to enhancing
the investment strategy. Member States considered that there is room for improvement of the regulatory
framework in the following areas:
•   Simplification of public procurement procedures: streamline and shorten procedures, stimulate
    competition, maximise transparency and quality dialogue with interested parties, reduce court proceedings,
    provide training for contracting authorities.
•   Simplification of permitting procedures: reduce the duration/introduce deadlines for permits, reduce
    the costs and risks, streamline or introduce a specific set of rules for cross-border projects/projects of EU
    added value, ensure that complaints are legitimate, align the timelines of various permitting procedures,
    set up special purpose agencies at national level, plan jointly larger corridor sections.
•   Public acceptance: de-risk and align consent processes as much as possible, give particular attention to
    public acceptance when translating the results of the permitting study into concrete measures, introduce
    more effective communication strategies to raise visibility and acceptability of investments.
•   Legal certainty: stable and predictable technical specifications, clear and predictable priorities and
    eligibility criteria for calls; common regulatory environment for port finance.
•   State aid control: simplify and accelerate procedures, improve consistency with TEN-T policy, clarify
    rules for PPPs, allow more investments in smaller airports, review state aid guidelines for ports and
    Motorways of the Sea , develop new incentive schemes for Motorways of the Sea.
•   Eurostat accounting under the Stability and Growth Pact: enter investments in public infrastructure
    into national accounts over a longer period of time, make ESA 2010 accounting rules less restrictive by
    allowing the investment clause to be used for projects with EIB involvement, amend fiscal and statistical
    rules to make PPPs more attractive.

                           MN U R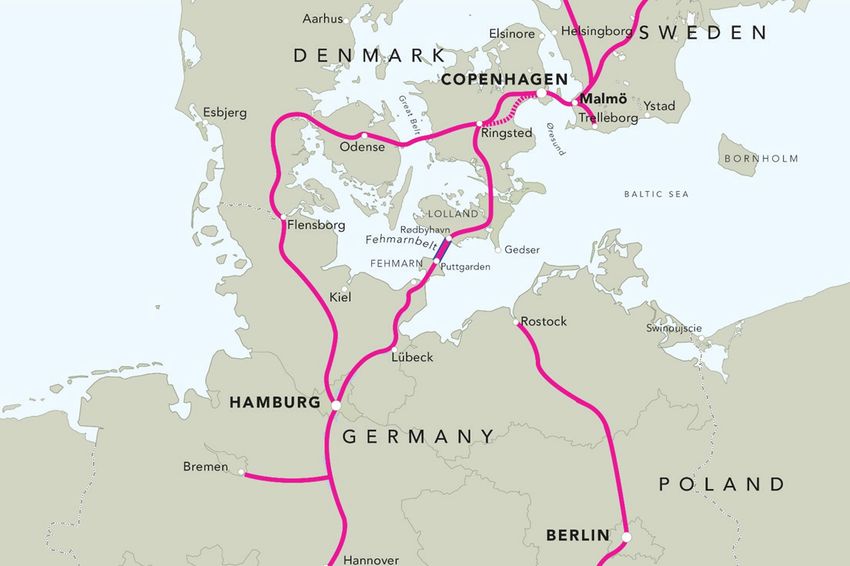
III. EU Transport Infrastructure - Key Results
The key results achieved through overall implementation of TEN-T policy since the entry into force of the
TEN-T Regulation (EU) N° 1315/20138 and the key results expected through the allocation of EU funding
under the Connecting Europe Facility9 since 2014 can be summarised as follows:

I. Developing the Trans-European Network for Transport (TEN-T)
A. Overall results of TEN-T implementation
The following status of TEN-T completion was reached by 2015:

Railways
•   Standard track gauge of 1435 mm is present on 77% of the rail core network and 76% of the comprehensive
    rail network;
•   Around 81% of the TEN-T (81.3% for the core and 80.6% for the comprehensive network) are electrified;
•   ERTMS is in operation only on 9.5% of core network corridors sections.

Roads
•   74.5% of the core network is compliant with the standards required in the TEN-T guidelines (i.e.
    motorway or expressway standard), whereas only 58.1% of roads of the comprehensive network fulfil
    this requirement.

Inland Waterways and ports
•   95 % of the inland waterway core network is compliant with the standards, corresponding to the CEMT
    requirements for class IV;
•   On 79.6% of the inland waterway core network, River Information System has been implementation in
    accordance with EU standards;
•   All seaports of the TEN-T (both core and comprehensive networks) are connected to the TEN-T railway
    network.

Airports
•   Out of 38 core airports falling under the obligation regarding a connection to the TEN-T rail network, 23
    (i.e. 60.5 %) are already compliant with this requirement.

On 21 June 2017, the Commission adopted the first Progress report on implementation of the TEN-T network
in 2014-201510.

8         Regulation (EU) N° 1315/2013 of the European Parliament and of the Council of 11 December 2013 on Union guidelines for
the development of the trans-European transport network
9         Regulation (EU) N° 1316/2013 of the European Parliament and of the Council of 11 December 2013 establishing the
Connecting Europe Facility
10        https://ec.europa.eu/transport/sites/transport/files/com20170327-progress-report-tent-2014-2015.pdf

                               MN U R
B. Benefits of the TEN-T corridor approach to generate EU added value
The TEN-T corridor approach is an innovative multi-level governance system for bringing Europe closer to all
stakeholders, primarily its citizens. It has proven to be effective to focus on delivering EU added value.
The Core Network Corridors are indeed a powerful instrument of communication, cooperation, collaboration
and coordination. In the framework of their mandate, the European Coordinators have engaged in a very close
cooperation with Member States, regions, infrastructure managers of all modes, users and stakeholders at
local, regional, national and European level.
In particular, the TEN-T corridor approach ensures that efforts are concentrated on the implementation of
cross-border projects but also allows encompassing several relevant aspects of transport investment across
different policy areas.
C. Expected impact of TEN-T infrastructure investments on jobs, economic growth and
decarbonisation
a) Impact on jobs and growth
On the basis of the on-going analysis for the third version of the Core Network Corridor work plans, the
investment necessary to develop the nine Core Network Corridors until 2030 could generate some EUR
4,500 billion of cumulated GDP over that period. This would mean 1.8% additional GDP in 2030 compared
to 2015.
The number of job-years created by the implementation of the 9 Core Network Corridors could reach around
13,000,000 job-years.
These are preliminary results based on a methodology developed by the consultancies M-Five, KombiConsult
and HACON11. To ensure the robustness of the analysis, DG MOVE has launched a more detailed study on
14 June 2017 that will run until 2018.
b) Impact on decarbonisation
The completion of the nine TEN-T corridors stimulates modal shift, especially through the implementation
of major rail and inland waterway projects as well as through the enhancement of a multi-modal transport
network. The development of the Core Network Corridors also includes, as integral part, components such
as alternative fuels infrastructure (charging equipment), intelligent and innovative transport systems etc.
Thereby, it plays an indispensable role as enabler for the decarbonisation of the transport system as a whole.
Preliminary estimates show that the completion of the Core Network Corridors in accordance with the latest
work plans is expected to lead to an overall reduction of CO2 emissions of about 7 million tons between
2015 and 203012. These preliminary estimates draw on the 2016 EU Reference scenario assumptions (i.e.
including policies related to infrastructure and other transport policy measures) and will be deepened in an
ongoing study, the results of which will become available in 2018.
11 Schade W., Krail M., Hartwig J., Walther C., Sutter D., Killer M., Maibach M., Gomez-Sanchez J., Hitscherich K. (2015): “Cost
of non-completion of the TEN-T”. Study on behalf of the European Commission DG MOVE, Karlsruhe, Germany.
12 the effects of the Scandinavian – Mediterranean corridor are excluded from the preliminary assessment for methodological
reasons
MN U RD. Specific TEN-T corridors results
TEN-T Information Fiches for the nine Core Network Corridors, major cross-border infrastructure projects
and a selection of innovative projects are provided in annex 1.
These TEN-T Information fiches illustrate the results and impacts on connectivity, efficiency, capacity,
decarbonisation, jobs and growth and illustrate human or local factors as well as success stories on the
corridors.
For instance, the TEN-T information fiches show that:
• The Baltic-Adriatic Corridor which interconnects the Polish ports in the Baltic Sea with the Italian and
Slovenian ones in the Adriatic Sea is expected to generate 1.56 million job-years and 535 billion EUR of
GDP until 2030;
• 217 projects have been identified on the Mediterranean Corridor that will provide a multimodal link to the
ports of the Western Mediterranean with the centre of the EU;
• Rail Baltica – EUR 5.8 billion investments - will link the capital cities of Estonia, Latvia, Lithuania and
Poland and is currently one of the biggest investments improving the mobility and travel opportunities as
well as developing business, trade, and tourism in the region;
• With Electric Vehicles Arteries (EVA+), 200 multi-standard fast charging stations are being installed on
key roads and motorways in Italy and Austria offering all the fast charging standards (CCS Combo 2,
CHAdeMO or AC charging).
• There are various success stories regarding the deployment of ERTMS. Some Member States have opted
for network-wide deployment such as Belgium, Luxembourg, the Netherlands, Denmark. Other important
sections of the rail network are equipped for instance in Spain and Italy. Cross-border cooperation is also
advancing for instance on the North Sea-Mediterranean Core Network Corridor.
II. Investment Plan for Europe – results in transport
A. First pillar: mobilise EU resources for investment
Since 2014, the Connecting Europe Facility (CEF) completed 3 series of transport calls for proposals in
2014, 2015 and 2016. Through CEF, grant support has been allocated to 604 projects, carried out by almost
2000 beneficiaries, accounting for CEF co-funding of EUR 21.4 billion. This represents over 90% of the total
grant budget, for a total investment (EU and other public and private support) of EUR 41.6 billion. These
projects are expected to deliver the following results:
• Independent studies on investment in the TEN-T allow estimating that such total investment will result in
job creation of over 900 000 man/ years and stimulate the European GDP with an amount of EUR
264 billion for the duration of the projects;
• Removal of 243 rail, road and inland-waterways bottlenecks by 2020 (30% on cross-border sections);
• 3088 new supply points for alternative fuels for road transport;
• 1790km of rail sections adapted to nominal gauge, 5788 km with ERTMS, 1753km electrified, 2804 km
freight lines improved;
• 3862 km of inland waterways upgraded;
• 138,082 rail wagons equipped with low noise brakes;
• 38 actions aiming at deploying intelligent transport systems on EU roads, ensuring the interoperability of
traffic management services and implementing ITS applications;
• Support to the coordinated and synchronized deployment of the Single European Sky air traffic
management (SESAR) involving 28 airports, 25 air navigation service providers, 14 airlines and 2
international organisations.
MN U RBesides, EUR 1 billion is expected to be committed under the current CEF blending call which was published
in February 2017. The purpose of this “pilot” call is to maximise the leverage of private involvement and
capital in the delivery of CEF Transport projects, while at the same time pursuing the ultimate objective of the
CEF programme, i.e. completing the TEN-T core network and its corridors by 2030 and the comprehensive
network by 2050.
At the first cut-off date in July 2017, this first transport blending call has shown a strong interest with 68
submitted proposals from over 110 applicants from 22 EU Member States. The requested CEF funding under
this blending call was more than twice the budget available.
In addition, around EUR 70 billion have been programmed in EU co-funding from the European Structural
and Investment Funds (ESI Funds) for the period 2014-2020, e.g. Cohesion Fund (CF) and the European
Regional Development Fund (ERDF). This includes EUR 34 billion for TEN-T infrastructure and EUR 36
billion for transport investment projects which connect to or complement the TEN-T projects. This includes
investment e.g. in clean transport and alternative fuels, in sustainable urban mobility, in smart transport (e.g.
the deployment of ITS solutions) or in active modes of transport such as cycling and walking.
• In the 2014-2020 period, the following achievements from cohesion policy support are expected:
• 1136 km of new TEN-T railway lines, including 571 km on the TEN-T;
• 9680 km of improved railway lines, including 4636 km on the TEN-T;
• 3414 km of new roads, including 2022 km on the TEN-T;
• 9742 km of improved roads, including 798 km on the TEN-T;
• 977 km of inland waterways;
• 748 km of new or improved tram and metro lines.
From its launch in 2015 until July 2017, the European Fund for Strategic Investments (EFSI) approved
47 operations contributing to transport objectives, expected to mobilise close to EUR 21.4 billion investment
value. In addition, 4 programmes have been preapproved, including the 2 green shipping programmes with
potential to mobilise additional EUR 3.5 billion of investment.
As of the end of 2016, the CEF Debt Instrument and its legacy instruments LGTT (the Loan Guarantee
Instrument for TEN-T) and PBI (Project Bonds Initiative) mobilised more than EUR 13 billion of additional
investment in TEN-T, out of which around EUR 4.5 billion since 2014.
More details on the execution of EU instruments to provide funding support to transport infrastructure projects
is presented in annexes 2 and 3.
B. Second Pillar: help investment projects reach the real economy
As of 31 July 2017, transport represents 23.3% of the 408 project-specific requests to the European
Investment Advisory Hub (EIAH) and is a leading sector in terms of a number of requests (followed by energy
with 20.3%).
As of 12 June 2017, more than 276 projects have been submitted to the European Investment Project Portal
(EIPP), out of which 161 have been published on the portal with EUR 60.9 billion total investment proposed
(sum of all projects). As a primary sector transport represents 33% of the published projects.13
13 EIPP Project Promoters can select one or two sectors from a choice of 25 sectors in line with Article 9.2 of (the "EFSI")
Regulation 2015/1017. With a second sector included, transport accounts for 28%.
MN U RC. Third pillar: Improve the investment environment
Important progress has been made to improve the investment environment of transport projects. Certain long-
term infrastructure financing has been made more attractive through amendment of Solvency II Delegated
Regulation. Investments with better risk characteristics than other infrastructure (“qualifying infrastructure
investments”) benefit from an appropriate risk calibration which will ultimately lead to a lower capital charge.
In the area of state aid, the Commission published guidance on when public spending falls within, and outside,
the scope of EU state aid control. As a result, the “Notice on the notion of state aid” will help public authorities
and companies to identify when public support measures can be granted without needing approval under EU
state aid rules. Furthermore, the General Block Exemption Regulation was amended by extending its scope
to aid for port and airport infrastructure.
In September 2016, Eurostat issued a guide in cooperation with EPEC, the European PPP Expertise Centre,
to promote a clear and coherent approach on the statistical treatment of PPPs. The guide has received
positive feedback from stakeholders and is expected to have a positive impact on project pipeline in the
medium term.
In addition, the Commission carried out and published a ‘Study on permitting and facilitating the preparation
of TEN-T core network projects’ in 2016. Building on the results, the Commission is envisaging an initiative
on streamlining authorisation procedures for infrastructure projects. An impact assessment to evaluate the
various options proposed by the study is on-going and a public consultation has been launched on 1 August
2017 running until 9 November 2017.
On 15 June 2017, the relevant Commission services jointly organised a first workshop with promoters of
cross-border TEN-T projects focused on public procurement issues. A second workshop will be organised
on 21 September in Tallinn to cover governance issues, state aid and financing issues. A third workshop
is expected to take place mid-October 2017 to address permits, environmental assessments and public
consultations.
Furthermore, as required by the ex-ante conditionality for receiving financial support from ESI Funds under
Thematic Objective 7 (sustainable transport), comprehensive national and regional transport plans, were
developed in 20 Member States, including mature project pipelines and measures to strengthen the capacity
of administrations and beneficiaries.
In this context it is also noteworthy that the Commission had presented in 2013 a new concept for the
development of Sustainable Urban Mobility Plans. In the programming period 2014-2020, many EU urban
areas will benefit from Cohesion Fund and ERDF support in the development and implementation of such
plans.
The reinforced planning at all levels – EU, national, regional and local – will facilitate coordinated and coherent
transport investments in the years to come and enhance the planning security for both public and private
investors.
MN U RTrans European Transport Network
Core Network CorridorsJobs The completion of the Corridor is expected to generate:
Growth • 2.06 million job-years until 2030
• 715 billion EUR of GDP until 2030
Funding Needs
• 8 Member States
• 17.4% of EU’s GDP generated by
Corridor’s regions
Features • 14.5% of EU’s population living in
the Corridor’s countries 520 projects identified:
130 road, 127 rail, 76
maritime, 75 airport, 36
inland waterway, 18 MoS,
16 ERTMS projects
98.7 billion EUR of
estimated investment:
32.5 billion EUR for road
37.9 billion EUR for rail
Efficiency
CONNECTIVITY
The North Sea Baltic Corridor is the only Corridor situated The Corridor will make transport more
exclusively in the North of Europe. It joins the Baltic Sea Region efficient by eliminating the missing
with the low countries of the North Sea Region by way of Helsinki, cross-border links, solving bottleneck
the Baltic States, Poland and Germany. problems at Amsterdam Sea Lock,
building the hinterland connection to the
main ports, improving efficiency of urban
“
nodes connectivity.
Success
The main success of the Corridor has Stories
been the integration of the Eastern
and Western markets in the North of
Europe and developing an important
catalyst of continued economic
development.
Low Emission
© Eiropas Dzelzceļa līnijas
The Twin-Port projects enable Helsin- Emissions will be lowered by developing the
ki and Tallinn to run their passenger Corridor through harmonised TEN-T standards,
harbours more smoothly. In a way,
increased share of inland waterway transport,
Helsinki and Tallinn have merged. The
connection has created an entirely modal shift from road to rail and further
deployment of alternative fuels infrastructure.
new dimension and passenger num-
“
designed by
bers have increased at an incredible
rate.
© Port of Helsinki
Mobility and
TransportJobs The completion of the Corridor is expected to generate:
Growth • 2.2 million job-years until 2030
• 743 billion EUR of GDP until 2030
• 6 Member States
• Switzerland (and an inland Funding Needs
port in Luxembourg)
• 19% of EU’s GDP generated by Corridor’s
Features regions
• 13% of EU’s population living in the 318 projects identified:
Corridor’s 110 projects concern rail
41 projects concern inland
waterways
37 projects are in Switzerland
100 billion EUR of estimated
investment:
73.4 billion EUR for rail
5.2 billion EUR for inland
waterways
41 billion EUR for Swiss projects
Efficiency
Access routes to the Swiss rail
tunnels:
• Karlsruhe-Basel in the north
CONNECTIVITY • Chiasso-Milan, Domodossola-
Novara in the south.
Capacity restrictions on the
The Rhine-Alpine Corridor is one of the busiest freight extension of the Betuwe route
routes in Europe, connecting key North Sea ports of Belgium into Germany between Zevenaar –
and the Netherlands with the Mediterranean port of Genoa. The Emmerich –Oberhausen
regions it encompasses are among the most densely populated and
economically advanced in Europe.
Success Stories
“ Gotthard base tunnel – the long-
est and deepest rail tunnel in the
world, allowing high-speed trains Low Emission
and the cut in journey time from
Zurich to Milan by 30 minutes
Achieving compliance of the Corridor
with the TEN-T standards
Betuwe route – a dedicated, high- by 2030 will ensure a stable dominant
capacity freight line, linking the position of inland waterways in
largest European port of Rotterdam
“ international freight transport (50.3%)
designed by
with the industrial Ruhr region in while the share of rail will increase to
Germany 22.2% from 20.4 in 2010
Mobility and
TransportJobs The completion of the Corridor is expected to generate:
• 1.56 million job-years until 2030
Growth • 535 billion EUR of GDP until 2030
• 6 Member States: Poland, Czech Republic,
Slovakia, Austria, Italy, Slovenia
Funding Needs
• The Corridor regions represent 18.5% of
EU GDP and 23% of EU population
Features 535 projects identified:
170 rail and ERTMS projects
99 road projects
115 maritime, IWW and MoS
projects
74.5 bn EUR of estimated
investment:
37.9 bn EUR for rail and ERTMS
20.1 bn EUR for roads
9.2 bn EUR for maritime, IWW, MoS
Efficiency
ERTMS: technology installed on
18% of the corridor, including most
of the Slovenian lines; projects
under development in all Member
States; works ongoing in the
Czech and Slovak Republics which
cover most of the corridor links
CONNECTIVITY Last mile connections of ports:
Improvements ongoing at the maritime
ports to further promote competitiveness
of multimodal operations at terminals,
The Baltic-Adriatic Corridor interconnects the Polish ports in the Baltic and MoS
Sea with the Italian and Slovenian ones in the Adriatic Sea. It crosses the
industrialised areas between Southern Poland, Czech Republic and Slovakia
and interconnects Vienna and Bratislava, the Eastern Alpine region and
Northern Italy.
Success Stories
“Railway Eastern Branch in PL
Modernisation at TEN-T standards of
railway line E65 between the core ports
Low Emission
of Gdynia and Gdańsk, and Warsawa
Achieving compliance of the Corridor
Cross-border sections with the TEN-T standards by 2030 will
Bilateral letters of intent and memoranda keep railway transport competitive with a
of understanding have been signed in market share of 36%. The implementation
2016 for the development of each of the “ of rail transport supporting policies would
designed by
eight critical cross-border sections further increase the rail modal share
of the Baltic-Adriatic Corridor. up to 39% compared to 35% in 2014.
Mobility and
TransportJobs The completion of the Corridor is expected to generate:
Growth • 1.97 million job-years until 2030
• 622 billion EUR of GDP until 2030
• 6 Member States: Hungary, Slovenia, Funding Needs
Croatia, Italy, France, Spain
• 17% of EU’s GDP generated by Corridor’s
regions
Features • 13% of EU’s population living in the
Corridor’s area
217 projects identified:
124 projects concern rail & ERTMS
28 projects concern inland
waterways
104 billion EUR of estimated
investment:
77.7 billion EUR for rail
6.0 billion EUR for inland
waterways
Efficiency
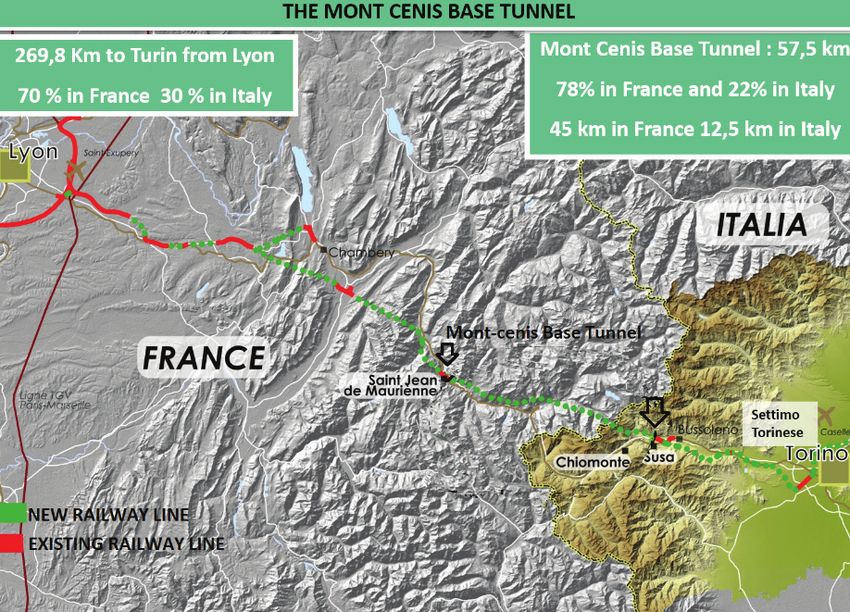
The Lyon-Turin railway link, with the
57,5 km Mont Cenis base tunnel
as its major component, is the
main missing link in the corridor
creating the only east-west freight
corridor south of the Alps. It aims
at connecting southwestern Europe
with the central and eastern
CONNECTIVITY European Countries.
The Mediterranean Corridor will provide a multimodal link to
the ports of the western Mediterranean with the centre of the EU.
It will create an east-west link through the southern part of the EU,
contributing to intermodality in sensitive areas such as the Pyrenees and
the Alps and connecting some of the major urban areas of the EU with
high speed trains..
Success Stories
“The Madrid-Barcelona high-speed line
line reduced the journey time between
the two cities from 5 hours in 1996 to 2
Low Emission
hours 38 minutes today
Achieving compliance of the Corridor
with the TEN-T standards by 2030 will
Avignon node – RRT & IWW
Creation of a tri-modal platform IWW- double the share of rail transport( from
13% to 27%) thus shifting important
rail-road by upgrading and integrating
“
designed by
existing port facilities on Courtine area volumes of freight from road to rail.
and RRT of Champfleury
Mobility and
TransportCopyright and Photo Sources: (1) CFR S.A. (2) Roman Bönsch / theo hotz partner | architekten / .baunetz.de; (3) Wikimedia CC BY-SA 3.0 Cppyright by Uwarf;
Jobs The completion of the Corridor is expected to generate:
Growth • 1.49 million job-years until 2030
• 517 billion EUR of GDP until 2030
• 9 Member States incl. Cyprus as remote Funding Needs
area
• 11.2% of EU’s GDP generated by
Corridor’s regions
Features • 14.1% of EU’s population living in
the Corridor’s regions (Status 2012) 415 projects identified:
177 projects concern Rail, RRT &
ERTMS
24 projects concern IWW
68 billion EUR of estimated
investment:
40.4 billion EUR for Rail, RRT,
ERTMS
2.2 billion EUR for IWW
Efficiency
Elbe and Weser Rivers have
underused capacity but less
reliability.
Rail capacity restrictions are
frequent in DE, SK and HU nodes.
Bottlenecks: HU – RO – BG – EL
stretches must be adapted to TEN-T
standards.
Administrative border-crossing
CONNECTIVITY obstacles are to be minimized.
The Orient/East-Med Corridor is a long north southeast corridor
that connects central Europe with the maritime interfaces of the
North, Baltic, Black and Mediterranean seas, making the best of
Motorways of the Sea ports, It will foster the development of those
ports as major multimodal logistic platforms and will improve the
multimodal connections of major economic areas in Europe to the
coastlines, using rivers and channels in Germany and the Czech
Republic.
Success Stories
“Vienna Main Station – this new
passenger rail hub connects three
Core network corridors (Baltic-Adriatic,
Low Emission
Rhine-Danube and OEM) and features Achieving compliance of the Corridor with
a new urban quarter. the TEN-T standards
by 2030 will reduce the dominance of
road transport in international freight
High speed link between Athens/ transport (56.8% from 59,5%), while
“ the share of rail is forseen to increase
designed by
Thessaloniki almost completed by
2018 giving fast access between the to 33.1% (from 27.1% in 2010).
2 ports areas in the north and south of
Greece
Mobility and
TransportJobs The completion of the Corridor is expected to generate:
• 1.09 million job-years until 2030
Growth • 419 billion EUR of GDP until 2030
• 4 Member States: PT-ES-FR-DE Funding Needs
• The corridor crosses regions which represent
12% of EU’s GDP
• 11% of EU’s population living in the
Features Corridor regions 217 projects identified:
112 projects concern rail/ERTMS
40 projects concern maritime
44 billion EUR of investment:
26 billion EUR for rail
4 billion EUR for rail
Efficiency
Missing Links: Évora-Mérida border
missing link between Madrid and Lisbon
Gauge differences: coexistence of
Iberian and UIC gauges as a major
bottleneck in the border ES-FR
Bottlenecks in crossing major cities:
rail capacity bottlenecks in the crossing
of Paris and Madrid urban nodes
CONNECTIVITY
The Atlantic Corridor connects the Europe’s South-Western
regions towards France and Germany, including also the Seine as
inland waterway. Its main potential is linked to the exploitation of
the maritime dimension enhancing the connectivity of the Atlantic
Coastline with the central regions of Europe. Better port rail
connections and rail interoperability are strategic to achieve that
potential. This will also help to de-isolate the Iberian Peninsula
Success Stories
“ Continuity of the sea corridor–
almost parallel to the inland corridor:
intra corridor sea flows continue
Low Emission
Achieving compliance of the Corridor
growing (16% since 2010) with TEN-T standards by 2030 will
contribute to better connect the Atlantic
maritime front to the rail network and to
enhance competitiveness and progress
Conclusion of the Tour–Bordeaux in promoting environmentally friendly
HSR, the biggest PPP ever, a remarka-
“ modes.
designed by
ble case of blending for a large-scale
green-field project, entering in opera-
tion July 2nd 2017
Mobility and
TransportJobs The completion of the Corridor is expected to generate:
Growth • 1 million job-years until 2030
• 299 billion EUR of GDP until 2030
• 6 Member States: BE, FR, IE, LU, NL, and
UK Funding Needs
• 26% of EU’s GDP generated by Corridor’s
regions
Features • 20% of EU’s population living in the
Corridor’s
350 projects identified:
92 projects concern rail
116 projects concern waterways
70 billion EUR of estimated
investment:
33 billion EUR for rail
11 billion EUR for waterways
Efficiency
Bottlenecks in major cities:
Rail capacity bottlenecks in Paris,
Brussels and Lyon.
Missing Links: Lack of
connections between French
waterway basins and the Rhine/
CONNECTIVITY Meuse network.
Accessibility:
Peripherality of northern UK and
Irish regions for passengers and
The North Sea Mediterranean Corridor freight.
is one of the busiest freight and passenger
transport corridors in Europe, containing
three of Europe’s top five airports and
four of the top-ten seaports. It is strongly
characterised by the role being played by
waterborne transport, both maritime and
inland navigation.
Success Stories
“ High Speed Rail Network – long-
Connecting major cities of London, Low Emission
Amsterdam, Paris, Brussels, and
Marseille via TGV, Thalys and Eurostar
networks.
Achieving compliance of the Corridor
with TEN-T standards by 2030 will
High Capacity Inland Waterway expand the network of high-capacity
Network – linking major Dutch, inland waterways and enhance the
Belgian and French seaports to a
“ competitiveness of rail services,
designed by
network of inland ports and terminals, continuing the progress in promoting
logistics hubs and onwards multimodal environmentally friendly modalities.
connections.
Mobility and
TransportJobs The completion of the Corridor is expected to generate:
• 4.2 million job-years until 2030
Growth • 1 468 billion EUR of GDP until 2030
• 7 Member States and Norway
• 20% of EU’s GDP generated by Corridor’s
regions
Funding Needs
• 15.2% of EU’s population living in the
Features Corridor’s regions
666 projects identified:
167 projects concern rail+
ERTMS
204 projects concern
maritime and Motorways of
the Sea (MoS)
202.4 bn EUR of
estimated investment:
132.5 bn EUR for rail +
ERTMS
10.8 bn EUR for maritime
and MoS projects
Efficiency
CONNECTIVITY When the Fehmarnbelt Fixed link
is in place, it will be possible to take
a direct train from Copenhagen to
The Scandinavian-Mediterranean Hamburg in two and a half hours.
Core Network Corridor is the
largest – in terms of the length The new Brenner Base Tunnel
- corridor in Europe, connecting will increase railcapacity up to 400
Scandinavia with Germany, Austria trains per day and reduce travel time
and Italy including Malta. The regions between Munich and Verona from 5.5
it encompasses are among the most to 3 hours.
densely populated and economically
advanced in Europe.
Success Stories
“ Øresund fixed link – the 15.9 km
long Øresund Bridge opened on 1 July
2000 and is a fixed combined bridge
Low Emission
and tunnel link between Denmark and
Sweden.
Achieving compliance of the Corridor
with the TEN-T standards
Combined passenger and truck ferry by 2030 will ensure sustainable
“Stena Germanica” is the first ferry transport modes becoming more
running on methane along the
“ important. With “green cities” e.g. Greater
designed by
corridor route Kiel – Göteborg since Copenhagen, also the urban nodes will
2015 thereby respect the Emission contribute to reducing GHG emissions.
Control Area targets.
Mobility and
TransportJobs
Growth The completion of the Corridor is expected to generate:
• 2 million job-years between 2015 and 2030 in the MS
• 725 billion EUR of GDP between 2015 and 2030
• 9 Member States Funding Needs
• 14% of EU’s GDP generated by Corridor’s
regions
• 13% of EU’s population living in the
Features Corridor’s regions
563 projects identified:
141 projects concern rail
65 projects concern inland
waterway
118 projects concern ports
91.9 billion EUR of
estimated investment:
54.7 billion EUR for rail
4.2 billion EUR for inland
waterways
2.6 billion EUR for ports
Efficiency
Completion of the high priority railway line
connections by 2030:
- between Black Sea and Rhine
- Southern Germany and SK/UA border
Inland waterway transport along the Danube
CONNECTIVITY - By measures improving the navigability
The Rhine-Danube Corridor is the main East-
West link between continental European
countries,connecting France, Germany, Austria, Czech
Republic, Slovakia, Hungary, Croatia, Romania and
Bulgaria all along the Main and the Danube rivers to
the Black Sea by improving (high speed) rail and inland
waterway interconnections
Success Stories
“
Low Emission
Vienna Main Station – this new Improvements into energy efficiency
passenger rail hub ensures: measures will help to reduce the
- intersection between Baltic-Adriatic, emissions in traffic flows: Total GHG
Rhine-Danube and Orient-East Med emissions are expected to fall from 20.4
rail Corridors million tonnes of CO2 equivalent to 19.7
million tonnes across the selected traffic
flows, by 2030
High Performance Green Port
Giurgiu – Transformation into the Photo Sources © | Vienna Main Station: ÖBB/Roman
first “Green Danube Port” based on
“ Bönsch (www.wien.info )
designed by
Port Giurgiu: Presentation ILR Logistica Romania SRL (16th
integrated energy-efficiency concepts
March 2016, Brussels)
and comprehensive environmental Danube (right picture): viadonau/Johannes Zinner (viadonau.
measures for intermodal ports. org)
Mobility and
TransportTrans European Transport Network
Cross-Border Infrastructure ProjectsMediterranea
Orient
East Med
Cross-Border Infrastructure Projects Rhine
Danube
HIGH–SPEED RAIL LINK DRESDEN – PRAHA
Connectivity Decarbonisation
The existing rail line between Praha and Dresden (200 The new Dresden – Praha line will improve rail freight
km) is in operation since the 1850‘s and follows its capacity and reduce noise emission in the picturesque
natural routing along the rivers Elbe and Vltava. Between Elbe Valley.
Pirna and Děčín (51 km), it is limited to 2 tracks and a For the Czech Republic, the line carries the majority of
speed of 100 km/h. Narrow river valley, environmental the exported rail transport volume to the North and is
protected areas, curves and existing noise emission key for the rail connection to German seaports. In 2015,
prohibit a line extension. A border crossing new high- more than 220 daily trains, thereof 127 for freight, used
speed link between Dresden and Ústí n.L. of 35 km is the link. Until 2030, this number might increase up to
planned, shortening the overall distance from 82 to 56 178 trains (+40%), especially from/to the German Ports
km. including a base tunnel of 26 km, designed for 200 (e.g. containers and car transport), and this section could
– 230 km/ speed and mixed traffic. A complementary become a capacity bottleneck. Already today, the border
Czech high-speed passenger rail link from Ústí n.L to crossing between Bad Schandau and Děčín is the second
Praha shall allow for 250 – 350 km/h and reduce the most used among all German rail border crossings.
route from 114 to 84 km, thereof 80 km new tracks.
This section will be dedicated for passenger operations
only. Passenger rail travel time could be shortened from
2:15h to 1h while distance could be reduced by 50 km.
Timeframe
Dresden – Ùstí n.L HSR cross-border section
2015: Founding of a European Group of Territorial Cooperation for
the New Rail Line Dresden – Praha 2035
2016: Presentation of the Detailed Preparatory Study,
co-financed by TEN-T
2017: Decision on Investment (Potential Need German
BVWP2030)
2018-2019: Bilateral Agreement between CZ and DE
2019: Completion of Feasibility Study for Czech section Praha -
Usti n.L.
2022: Regional Planning Approval
2028: Start of construction works
2018 2035: Operation of Dresden – Ústí n.L.
Funding needs
The total cost of the project is estimated to amount to 4.5b€. The German part is
estimated at € 1.3 bn, the Czech border crossing part until Ústí n.Labem. at €1.0 bn,
€4.5 bn
and the complementary route Praha – Ústí n.L. may cost up to € 2.2bn.
investments
designed by
MN U R
Mobility and
TransportMediterranea
Orient
East Med
Cross-Border Infrastructure Projects Rhine
Danube
HIGH–SPEED RAIL LINK DRESDEN – PRAHA
Local - social - human factors
The new High-speed rail link will ensure:
• Reduction of travel time
• Increase of rail capacity
• Foster modal shift from road to rail through higher capacity and reliability
• Connection to the European high-speed railway network
• Flood-safe rail connection, reduce noise generally and especially in the Elbe River valley and its
touristic values
• Reduce environmental impact compared to road traffic
• Reduce GHG emission due to high efficient electrical operation and reduced
dependence from hydrocarbon fuels.
12.300
jobs years
Jobs and growth
View of existing track in the Elbe Valley works Creation of 12.300 jobs annually and a GDP increase by 5,6
b€ in the next 15 years.
Dan Ťok,
Minister of Transport of the Czech
Republic
Martin Dulig,
Saxon State Minister for Economic
Affairs, Labour and Transport:
“ The new high-speed rail line Dresden – Prague
is one of the most important railway projects in
Central Europe… It is a vital part of the Orient/
East-Med Corridor of the TEN-T, which connects
“
the North and Baltic Seaports and economic
centers in Southeast Europe.
designed by
MN U R
Mobility and
TransportYou can also read