ESKOM: THE ROOTS OF A CRISIS AND AVENUES FORWARD - OCTOBER 2020 by Sonia Phalatse For the Institute for Economic Justice Contributions by Gilad Isaacs
←
→
Page content transcription
If your browser does not render page correctly, please read the page content below
ESKOM: THE ROOTS OF A CRISIS AND
        AVENUES FORWARD

                 OCTOBER 2020

                       by
                 Sonia Phalatse

      For the Institute for Economic Justice

                Contributions by
                  Gilad Isaacs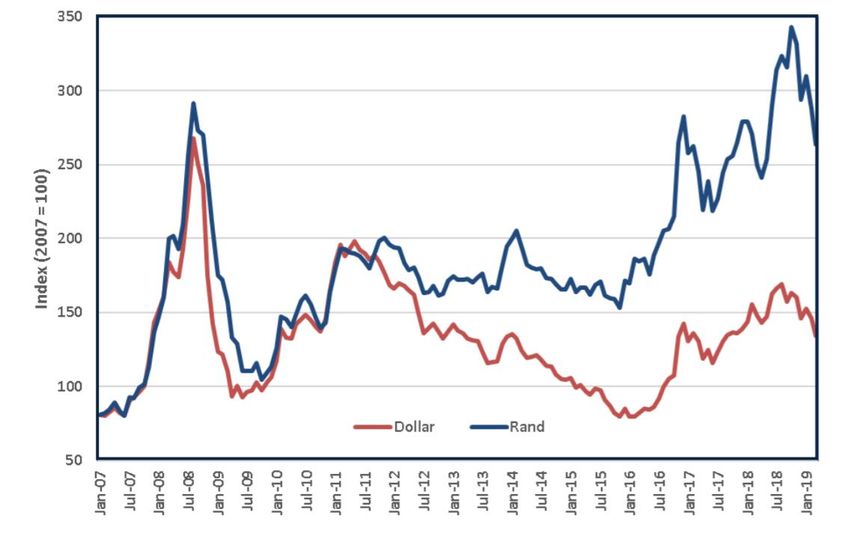
ABOUT THE AUTHOR(S) AND ACKNOWLEDGMENTS

Sonia Phalatse is a researcher at the Institute for Economic Justice where she works on the
Finance for Development programme.

Gilad Isaacs is the Co-Director of the Institute for Economic Justice and contributed to this
paper.

CORRESPONDING AUTHOR:

Sonia Phalatse – sonia.phalatse@iej.org.za

KEYWORDS:

Eskom, electricity, energy, South Africa, Just Transition, REIPPP.

RECOMMENDED CITATION

Phalatse, S. (2020). Eskom: Historical background to its current crises. Institute for Economic
Justice Working Paper Series, No 4.

ISBN

© Institute for Economic Justice, 2020

For further information contact: info@iej.org.za
Eskom: The roots of a crisis and avenues forward
Working Paper Series: Number 4
October 2020

EXECUTIVE SUMMARY
This paper provides an overview of the intersecting crises at Eskom and offers an analysis
on the proposed energy reforms.

THE CREATION OF A STATE-OWNED ENTERPRISE AND THE MINERALS-ENERGY
COMPLEX

Eskom, South Africa’s state-owned monopoly energy provider, is in dire straits. A confluence
of institutional and external factors has culminated in a number of extended national
blackouts and an unsustainable debt level of over R460 billion at the end of 2019. In addition,
the global energy market has changed significantly, calling into question the sustainability of
Eskom’s reliance on fossil-fuel powered electricity.

THE VARIOUS DIMENSIONS OF ESKOM’S CRISIS

Financial mismanagement and unsustainable debt levels – Prior to 2007 Eskom achieved
significant profits; between 1995 and 2006, its net profit margin averaged 12.2% compared to
the economy-wide average for non-financial corporations of 7.8% in the same period.
However, Eskom’s total debt has steadily risen over the past 13 years, from a total of R77
billion in 2006 to R604 billion, as of its 31 March 2019 financial statements. This represents
an estimated 17% of total sovereign debt, 62% of which is guaranteed by the state.

Medupi and Kusile – The much-lauded build programme has been mired in corruption and
mismanagement scandals. As of August 2020, only four units out of the six generating units
are operational at Medupi. The total costs of construction, including interest costs, amounts
to over R200 billion, compared to the projected planned expense of R90 billion in 2009. Both
mega power stations are expected to be completed by 2023 and it is estimated that an
additional R18 billion will be needed to for this.

Coal price – Global coal prices are at record lows, owing to the growing push for less fossil
fuel production, which has deleterious effects on the environment. As global demand for coal
declines, this should reflect as lower tariffs. However, because of Eskom’s costly build
programme, the average energy cost has increased. South Africa’s coal industry is also
undergoing substantial changes that will have ramifications for Eskom.

PROPOSALS TO SAVE ESKOM

Unbundling revisited – In December 2018, President Cyril Ramaphosa appointed an Eskom
Sustainability Task Team to advise the government on strategies to resolve Eskom’s
operational, structural and financial challenges. By February 2019, the task team

                                                   3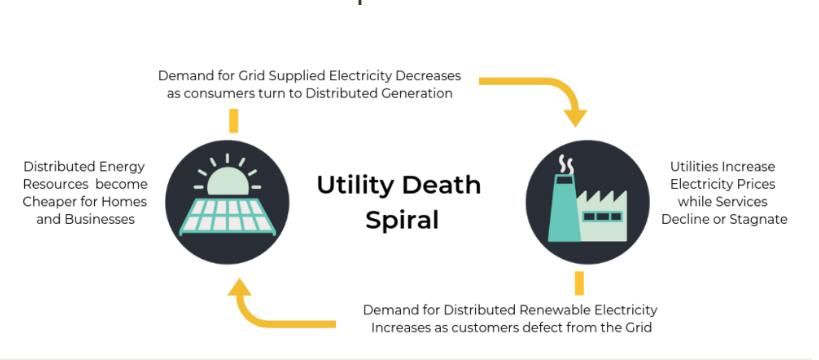
Eskom: The roots of a crisis and avenues forward
Working Paper Series: Number 4
October 2020
recommended that Eskom be fully unbundled by 2022, mirroring the policy plans suggested
in the 1998 White Paper. A proposed intervention for the medium- to long-term was
establishing an independent transmission and systems operator (ITSO), initially as an Eskom
subsidiary, and later to become a stand-alone SOE. A roadmap for restructuring Eskom was
released later that year, in October 2019, and outlines, in greater detail, the planned transition
to an unbundled transmission system; beginning with the appointment of a Chief
Restructuring Officer (CRO) in July 2020.

Energy market reform via unbundling is not a novel phenomenon, and was part of a broader
approach in the 1980s towards greater economic liberalisation. Over 106 countries have
adopted unbundling reforms in their electricity sectors. The first wave of transmission
unbundling began in the 1980s, beginning with Chile (1985), Britain (1990), Norway (1992),
Argentina (1992) and Peru (1992). Material conditions in the global energy sector has changed
significantly, and generally, higher-income countries have pursued unbundling in the context
of excess generation capacity and stable institutions. South Africa originally proposed
unbundling in its 1998 White Paper on Energy. This was eventually dropped due to opposition
to privatisation.

In Africa, most of power utilities remain vertically integrated monopolies. However, four
countries (Uganda, Kenya, Zimbabwe and Egypt) have embarked on energy reform over the
past century. Case studies from Kenya and Uganda illustrates that electricity reform requires
committed and stable institutions to effectively carry out the reforms. This includes strong
regulatory institutions that keep private actors and government officials in check. Power-
sector reform is a long-term undertaking, and takes years for outcomes to be visible. As in
the case of Kenya and Uganda, it is important for a coherent framework for planning and
implementation, with clear steps and timelines to guide the sequencing of the reform. It is
equally important that the reform approach be responsive to the constantly changing political
and economic context.

However, energy reforms that rely on private sector participation could lead to perverse
outcomes, especially for the most vulnerable households. Despite the overwhelming
narrative that the private sector is more efficient at providing services, there is little evidence
to support this. These claims must be contextualised within the broader political and
economic structures that exist. Energy reforms that have allowed a greater role for private
actors (especially international multi-nationals) has led to higher prices, in particular if the
role and capacity of the energy regulator is weak. South Africa’s own attempt to include more
private investors in renewable energy generation via the Renewable Energy Independent
Power Producer Procurement Programme (REIPPP) remains a contested space in which
beneficiaries of the energy transition maintains influence and access to only a few.

International donor climate finance - A proposed solution to Eskom’s debt crisis, which
transitions it towards renewable energy provision, is to make a transaction that combines

                                                   4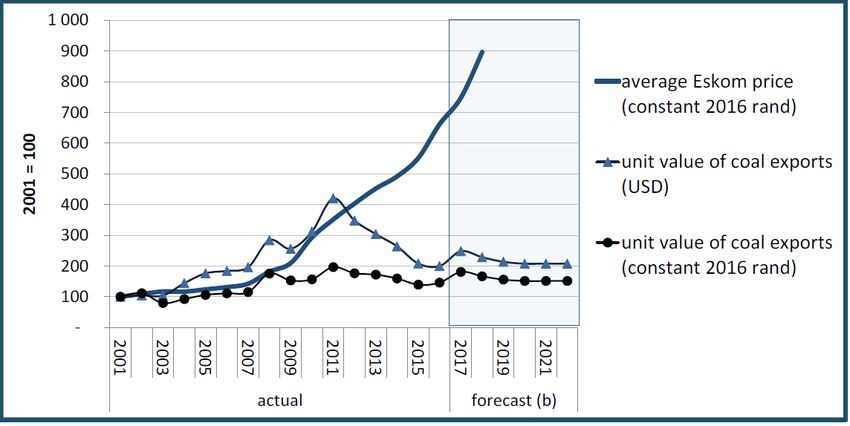
Eskom: The roots of a crisis and avenues forward
Working Paper Series: Number 4
October 2020
raising international donor climate finance to lower its debt, while simultaneously
contributing to a climate change mitigation fund. Members from the Eskom Task Team have
argued that Eskom could raise between R150 billion and R200 billion from climate change
mitigation funding through a special purpose financing vehicle at discounted interest rates,
in return for Eskom accelerating its shift away from coal-based power generation.

Government Employee Pension Fund surplus - Cosatu has proposed using the Government
Employee Pension Fund (GEPF), with an estimated asset base of R2 trillion, to bailout the
unsustainable debt held by Eskom. Specifically, it suggests that the Public Investment
Corporation (PIC) – which manages money on behalf of the Government Employees’ Pension
Fund (GEPF) – as well as the Industrial Development Corporation (IDC) and the Development
Bank of Southern Africa (DBSA) to take on R254 billion of Eskom’s debt.

A JUST TRANSITION

A Just Transition – defined as a people-led transition to a zero-carbon economy that creates
jobs and reduces inequality – is possible only through well-co-ordinated government
policies that seeks to structurally transform Eskom and the economy. The economy’s
reliance on less productive industries has perpetuated concentrated ownership and wealth
patterns in sectors such as mining and fossil fuels production, thus contributing to greater
inequality. The effects of climate change will have particularly harsh impacts on more
vulnerable sections of the population in South Africa, especially in surrounding coal
communities that have experienced decades of water and air pollution. A Just Transition will
be imperative to diversify the economy to sustainable methods of production, as well as
create employment, alleviate poverty and ensure shared prosperity.

                                                   5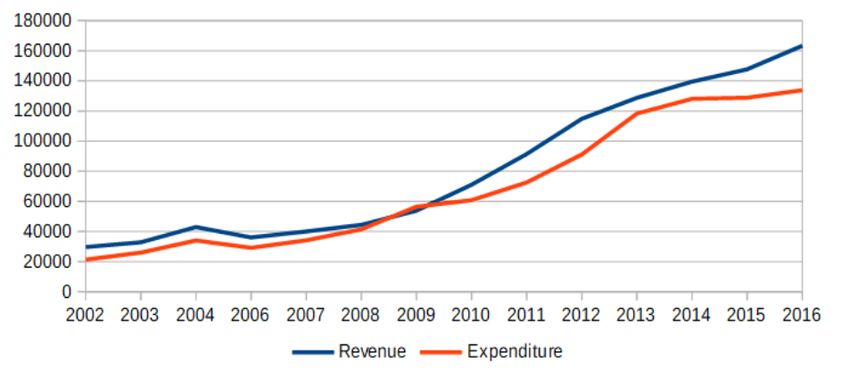
Eskom: The roots of a crisis and avenues forward
Working Paper Series: Number 4
October 2020

TABLE OF CONTENTS
Executive summary .............................................................................................................................. 3
Table of contents.................................................................................................................................... 6
List of Abbreviations............................................................................................................................. 7
1       Introduction .................................................................................................................................... 8
2       The creation of a state-owned enterprise ........................................................................... 9
  2.1 Minerals-Energy Complex............................................................................................. 10
  2.2 From ESCOM to Eskom ................................................................................................. 11
3    Policies, planning and decision-making at Eskom ........................................................... 13
  3.1 The RDP and GEAR........................................................................................................ 13
  3.2 The 1998 White Paper on Energy ................................................................................. 15
  3.3 The Farm Inn Summits .................................................................................................. 20
4    The various dimensions of Eskom’s crisis .......................................................................... 21
  4.1 Financial mismanagement ............................................................................................ 21
  4.2 Coal sector .................................................................................................................... 23
  4.3 Eskom’s build programme: Medupi and Kusile ............................................................ 26
  4.4 Summary of Eskom’s debt as of its 2019 financial year ............................................... 27
  4.5 Corruption at Eskom ..................................................................................................... 29
  4.6 Utility death spiral ........................................................................................................ 30
5    Transitioning to renewable energy ........................................................................................ 31
  5.1 Privatising utilities (PPPs and REIPPPs)......................................................................... 32
6    Unbundling revisited ................................................................................................................. 34
  6.1 What is unbundling? ..................................................................................................... 35
  6.2 International experience with unbundling ................................................................... 38
  6.2.1 Kenya ............................................................................................................................ 38
  6.2.2 Uganda .......................................................................................................................... 39
  6.2.3 Lessons learnt from unbundling utilities in Africa and alternatives to unbundling ..... 40
7    Finding a path to sustainability .............................................................................................. 42
  7.1 The Just Transition ........................................................................................................ 42
  7.2 The role of international climate funds in alleviating Eskom’s debt problem ............. 43
  7.3 Lifting R250 billion debt using public pension funds .................................................... 44
8    Conclusion .................................................................................................................................... 45

                                                                                 6
Eskom: The roots of a crisis and avenues forward
Working Paper Series: Number 4
October 2020
LIST OF ABBREVIATIONS
CDF Capital Development Fund
CRO Chief Restructuring Office
DPE Department of Public Enterprises
DME Department of Minerals and Energy
ECB Electricity Control Board
ESCOM Electricity Supply Commission
ESI Electricity Supply Industry
EPP Electricity Pricing Policy
ERC Electricity Regulatory Commission
IPP Independent Power Producer
IRP Integrated Resource Plan
MEC Minerals- Energy Complex
NER National Energy Regulator
NERSA National Energy Regulator of South Africa
SALGA South African Local Government Association
SEB State Energy Board
RED Regional Electricity Distributor
REIPPP Renewable Energy Independent Power Producer Procurement
RDP Reconstruction and Development Policy
VFP Victoria Falls Power Company
7Eskom: The roots of a crisis and avenues forward
Working Paper Series: Number 4
October 2020
1 INTRODUCTION
Eskom, South Africa’s vertically-integrated, state-owned monopoly energy provider, is in
dire straits. A confluence of institutional and external factors have culminated in a number
of extended national blackouts and an unsustainable debt level of over R460 billion at the
end of 2019. In addition, the global energy market has changed significantly, calling into
question the sustainability of Eskom’s reliance on fossil-fuel powered electricity.
Eskom has historically been at the centre of economic development in South Africa. It was
integral to supporting the advancement of the colonial and apartheid governments’ economic
and political strategies through the provision of low-cost inputs, through the minerals-
energy complex, to the burgeoning mining industry. Post-apartheid, Eskom remains in state
ownership and continues to be central to the development of the economy, providing up to
96% of South Africa’s total energy supply.1 However, this dependence on Eskom, in its current
state, has translated into a crisis resulting in significant economic costs (up to an average of
R1 billion a day), a consequence of rolling blackouts.
As a result, several plans have been proposed, in addition to a series of bailouts, including
the revival of a failed 1998 energy sector reform. President Cyril Ramaphosa’s February 2019
State of the Nation address called for the restructuring of Eskom into three separate entities
(termed ‘unbundling’). This proposal, previously tabled in 1998, would unbundle Eskom into
its generation, transmission and distribution components. This restructuring has garnered a
spectrum of responses. This paper explores these proposals, offering insight from the 1998
White Paper’s proposal in the context of a changed economic landscape. Utility unbundling is
not a novel proposition, as over 100 countries have implemented some form of energy utility
unbundling. This paper will also provide examples and lessons from two African countries
that have instituted this reform.
In addition, this paper situates Eskom’s current financial and managerial malaise within its
broader history, by tracing the key events that have shaped the energy state-owned
enterprise (SOE) into what it is today. Using the minerals-energy complex (MEC) as a
framework for unpacking the causes of the crisis, this paper teases out Eskom’s history, and
unpacks the policies and key planning decisions made by the government and Eskom’s
management. It also maps out Eskom’s current crisis, explaining the gravity of Eskom’s debt
in relation to its business model as well as the effect this has on the sovereign debt. Lessons
are drawn from other countries that have adopted Independent Power Producers (IPPs) and
greater private-sector access in energy generation.
1
Styan, B. (2015). Blackout: The Eskom Crisis. Jonathan Ball Publishers.
8Eskom: The roots of a crisis and avenues forward
Working Paper Series: Number 4
October 2020
2 THE CREATION OF A STATE-OWNED
ENTERPRISE
In 1882, Kimberley - as the largest diamond mining hub in the world - became the first city
in the Southern Hemisphere to power electric street lights.2 By 1905, several gold mines in
Johannesburg owned their own generators and supplied neighbouring communities with
electricity. As mining industrialisation developed over the next two decades, demand for, and
supply of, electricity increased substantially. By the end of 1910, there were up to 58 private
electricity producers in South Africa, regulated by the Power Act of 1910, which came into
operation three days before the creation of the Union of South Africa.3
The transition to a consolidated SOE, from an electricity sector in which power generation
consisted of a variety of suppliers was a result of a series of major events. Prior to World
War I (WWI), electricity was supplied by a mixture of municipal and private utilities, governed
by several bylaws.4 The first shift in the South African energy sector was prompted by the
end of WWI. A global slump in the gold mining industry in 1912, owing to high inflation and a
fixed global gold price, led to a decline in global electricity demand. The resulting excess
capacity provided an opportunity for South African Railways and Harbours (SAR)5 to shift
away from steam engine technology to electricity-powered engines. ESCOM was thus
created to primarily supply cheap electricity for the railway industry. The SAR wanted a
state-owned electricity supply industry (ESI) because it gave them unlimited access to a
cheap supply of electricity from one centralised source. Both the state and SAR feared that
private companies did not have the capacity to prevent or quell labour action.6 Thereafter,
after a series of major wage strikes between 1919 and 1923, aggravated by the dire economic
situation post-WWI, both the state and SAR were incentivised to create a centralised
electricity provider.
ESCOM was consequently created as a SOE in 1922 and a government appointed electricity
regulator, the Electricity Control Board (ECB),7 was established and governed by the newly
established Electricity Act. The ECB regulated and licensed electricity, and ESCOM provided
2
Ibid.
3
van der Heijen, T. (2013). ‘Why the lights went out: Reform in the South African energy sector.’ UCT Graduate
School of Development Policy and Practice. Retrieved from: https://www.gtac.gov.za/Publications/160-
casestudy_eskom_300413.pdf.
4
Ibid.
5
SAR was created after the amalgamation of the Central South African Railways, the Cape Government
Railways and the Natal Government Railways, after an Act passed by Parliament in 1910.
6
The SAR were notorious for their extreme dislike for labour organising, to the extent that they enacted a Law
that prohibited SAR employees from any protestant action, or face jail-time or a severe fine.
7
van der Heijen, T. (2013). Op cit.
9Eskom: The roots of a crisis and avenues forward
Working Paper Series: Number 4
October 2020
cheap electricity under a single electrification network. ESCOM raised capital by issuing
bonds, and was exempt from corporate income tax as it was a SOE and not a profit-making
institution. By 1933,8 ESCOM owned five power stations and increased its supply of national
energy production by 62%. However, about 80% of its sales were distributed by a private
power company, Victoria Falls Power Company (VFP).9
2.1 MINERALS-ENERGY COMPLEX
A strategic coordination between ESCOM, private businesses and industry and the state, laid
the basis for economic development skewed towards servicing the white community in South
Africa and was weighted towards a particular amalgam of business interests. The Minerals-
Energy Complex (MEC)10 provides a useful framework for understanding the institutional role
mining and minerals processing played in the development of the South African economy
and the centrality of electricity and ESCOM therein. As Baker explains:11
“The MEC […] lies at the core of the South African economy, not only by virtue of its weight in
economic activity but also through its determining role throughout the rest of the economy.
Referring to a system of accumulation dating back to the 1870s, the MEC is central to the
country’s historical dependence on cheap coal and cheap labour along racially oriented
divisions for cheap electricity. Such a system has in turn served national economic
dependence on core mining and minerals-beneficiation sectors, and the interests of export-
oriented industry.”
The MEC, therefore, refers to a system of accumulation that emerged as the mining industry,
mining-linked manufacturing, and financial sectors coalesced around a common strategic
goal to exercise significant economic and political power.12 This meant that linkages between
these sectors and the rest of the economy was critical in shaping economic development. It
also conditioned the relationship between private capital and the state, and the
implementation of macroeconomic and industrial policy.13 Key activities of the MEC include
8
Clark, N. (1987). ‘South African state-owned enterprises: Death knell of economic colonialism?’ Journal of
Southern African Studies. Vol.14, No.1, pp. 99-122.
9
Ibid.
10
Fine, B. and Rustomjee, Z. (1996). ‘The Political Economy of South Africa: From Minerals-Energy complex to
Industrialisation.’ C.Hurst & Co. Publishers.
11
Baker, L. (2015). ‘Renewable energy in South Africa’s minerals-energy complex: a ‘low carbon’ transition?’
Review of Political Economy. 42:144, 245-261, page 248. Retrieved from:
https://doi.org/10.1080/03056244.2014.953471.
12
Parliamentary Budget Office. (2017). ‘Analysis of Eskom’s financial position.’ Retrieved from:
https://www.parliament.gov.za/storage/app/media/PBO/Analysis_of_Eskom_finances_Report_to_SCOA_prese
nted_8_March_2017.pdf
13
Fine, B. and Rustomjee, Z. (1996). Op cit.
10Eskom: The roots of a crisis and avenues forward
Working Paper Series: Number 4
October 2020
coal, gold, diamond and other mining activities; non-metallic mineral products; iron and steel
basic industries; and fertilisers, pesticides, plastics, basic chemicals and petroleum.
The strong economic and institutional relationships between the state, SOEs, and large
private businesses laid the basis for almost all economic activity in South Africa.14 ESCOM’s
central role in this network was to support the requirements of energy-intensive, heavy
industries, particularly mining and minerals processing. This was primarily done by
supporting industrial and big-business ventures by providing electricity at cost (which
ESCOM was also legally bound to do under the mandate of the Electricity Act).15
These heavy-industrial sectors continue to have influence over the state and the direction of
the economy and have been “attached institutionally to a highly concentrated structure of
corporate capital, state-owned enterprises and other organisations such as the Industrial
Development Corporation (IDC) which have themselves reflected underlying structure and
balance of economic and political power”.16
2.2 FROM ESCOM TO ESKOM
By 1930, ESCOM’s 100MW Witbank power station produced among the cheapest electricity in
the world, owing mostly to the exploitation of Black labour and abundant deposits of cheap,
low-grade coal.17 By the end of 1970, 16 new power stations (from initially only owning three)
were built to meet the increase in electricity demand from mining as well as residential
areas, including Hendrina, Komati, Camden and Grootvlei power stations, all of which still
operate today.18 This large growth in capital investment coincided with the global energy
crisis in the early 1970s, precipitated by the wars in Vietnam and the Middle East.19 The
increase in the global oil prices triggered the increased use of coal for power generation (as
an oil substitute), leading to unprecedented growth in the electricity supply (or, reserve
margin20).
14
Ibid.
15
Ibid.
16
Fine, B. (2007). ‘State, Development and Inequality: The Curious Incidence of the Developmental State in the
Night-time.’ Draft text as basis for contribution to SANPAD conference, Durban, June 26-30, 2007, page 11.
Retrieved from: https://eprints.soas.ac.uk/5611/1/sanpad.pdf
17 van der Heijen, T. (2013). Op cit.
18
Styan, J. (2015). Op cit.
19
Parliamentary Budget Office. 2017. ‘Analysis of Eskom’s financial position.’ Retrieved from:
https://www.parliament.gov.za/storage/app/media/PBO/Analysis_of_Eskom_finances_Report_to_SCOA_prese
nted_8_March_2017.pdf.
20
The reserve margin is the difference between the available supply of electricity and the expected peak
demand.
11Eskom: The roots of a crisis and avenues forward
Working Paper Series: Number 4
October 2020
By 1984, ESCOM’s monopoly status was solidified by its purchase of South Africa’s largest
private electricity producer, the Victoria Falls Power Company (VFP). The acquisition of VFP
not only secured ESCOM as a monopoly in the generation market, but across the entire value
chain; ESCOM owned high-voltage transmission lines and most distribution centres. It also
secured long-term contracts with surrounding privately-owned coal mines in Witbank.21
However, around the same time, apartheid sanctions had a dampening effect on the South
African economy. Growth rates fell from 2.9% in 1978, to -2.5% in 1983 and -1% in 1985.22 In
addition, the inflation rate averaged 13.5% per year between 1980 and 1984; ESCOM’s tariffs
increased three times by an average of 20% between 1976 and 1977 alone, leading to
widespread outrage at the escalating cost of electricity.
The high inflation, coupled with high electricity prices, induced a large political push for a
reformed ESCOM. This pressure culminated in the establishment of a government-appointed
commission of inquiry into the electricity industry in 1983, the De Villiers Commission, to
investigate the harmful effects of ESCOM’s monopoly power.
The Commission made several recommendations regarding ESCOM’s governance and
financial management. It was recommended that it should be restructured into a two-tier
control structure – a full-time executive management board and an Electricity Council.23 The
management board would report to the Council, which comprised of representatives from
major electricity consumers, municipal distributors, and government representatives.
ESCOM’s accounting system would also be replaced with standard accounting business
practices and its Capital Development Fund was subsequently dissolved in 1984.24 These
reforms were carried out in full, and to further rebrand the company, ESCOM’s name was
officially changed to Eskom.
The changes improved Eskom’s financial performance for a short while (as will be explained
later in this paper) but did not temper its monopoly power. This was because the amended
Act specifically exempted Eskom from being licensed by the ECB, thus exempting its prices
from being regulated.
21
The largest coal reserves in South Africa were in Witbank.
22
Styan, J. (2015). Op cit.
23
Eberhard, A. (Nd). The political economy of power sector reform in South Africa. Available:
https://www.gsb.uct.ac.za/files/StanfordPSREberhardSep2004final.pdf
24
Despite this, Eskom was still exempt from taxes and dividends.
12Eskom: The roots of a crisis and avenues forward
Working Paper Series: Number 4
October 2020
3 POLICIES, PLANNING AND DECISION-
MAKING AT ESKOM
It was at this stage in Eskom’s history that its financial performance began to decline (into
what it is today), due to poor energy planning. The combination of the aggressive build
programme in the early stages of its growth (increasing its supply capacity) and the
sanction-led decline in economy (decreasing demand) from the mid-1980s, translated into
an electricity sector that went from a forecast shortage to excess capacity in a relatively
short period of time.25 Both the supply and demand of electricity was affected: to limit the
expected excess capacity, construction of new plants were delayed in 1985; plans for new
stations were cancelled; and older plants were decommissioned or mothballed. To spur
greater demand, Eskom began extending more low-priced energy contracts to energy-
intensive users such as platinum mines and aluminium smelters.26
By 1991, the political terrain had shifted substantially, with significant implications for
Eskom’s lack of energy capacity by 2007. The apartheid government finally succumbed, and
the newly-elected government sought to expand access to basic services, including access
to electricity. Eskom’s excess capacity (as high as 31%) was essential for the extensive
electrification programme. However, by 1996, it was forecasted that Eskom would run out of
generating capacity by 2007, if it was to fulfil the increased demand.
Between this period and the first load-shedding event in 2008 a number of policies and
planning decisions were made that have shaped the contours of the current crisis. This
section will highlight the key policies, processes and decisions that have contributed to
Eskom’s complicated predicament.
3.1 THE RDP AND GEAR
The democratically-elected government inherited a SOE in 1994 that, as a result of apartheid
and the structure of the MEC, provided cheap electricity predominantly to heavy industry as
well as white residences and businesses. The goal of Eskom, under the democratic
government, was to provide affordable electricity to the rest of the previously-excluded
population. Concurrently, and against the backdrop of global economic liberalisation that
would ultimately undermine this, the Reconstruction and Development Programme (RDP),
described as an “integrated, coherent socio-economic policy framework”,27 was formalised
into national policy. Improving access to electricity was emphasised as an important
25
Eberhard, A. (Nd). Op cit.
26
van der Heijen, T. (2013). Op cit.
27
Ibid.
13Eskom: The roots of a crisis and avenues forward
Working Paper Series: Number 4
October 2020
component of the RDP objectives of eradicating poverty and promoting sustainable economic
and social development.28
The electrification drive was relatively successful, with the proportion of households with
access to electricity rising from one-third in 1993 to nearly 70% in 2004.29 Between 1994 and
2001, three million households were electrified. About two-thirds of these connections were
conducted directly by Eskom and the remainder by local municipalities. Tariffs for rural and
low-income residential customers were cross-subsidised from industrial tariffs and
surpluses earned on sales to municipalities. The larger municipalities, in turn, made an
additional profit from reselling Eskom’s electricity, which enabled them to subsidise property
rates and to finance other municipal services. However, many of the smaller municipalities
faced debt and non-payment by a substantial proportion of their low-income consumers.30
Despite the policy drive for structural economic changes, electricity provision continued to
fulfil its role in maintaining the architecture of the MEC. Eskom continued to serve the
interests of majority, white-owned businesses, and leading mining companies had access to
cheap electricity. Various multi-national companies within this network maintained special
pricing agreements with Eskom. By 2000 the Energy Intensive User’s Group - whose 36
members include internationalised resource and mining conglomerates such as BHP Billiton,
Anglo American and Xtrata - consumed around 44% of the electricity sold in South Africa31 at
heavily discounted electricity prices. While electricity prices were still low for residential
consumers during this period, the large-scale electricity distribution programme resulted in
significant increases in energy use.
Concurrently, conservative economic policies came to dominate the policy terrain. The RDP
was replaced by the Growth, Employment and Redistribution (GEAR) policy in 1996. GEAR
was a conservative, macroeconomic policy, in the mould of the Washington Consensus and
structural adjustment programmes, which prioritised a neoliberal approach to economic
development, such as fiscal austerity, financialisation and privatisation. This approach also
shaped energy policy, which reflected trends in energy policy globally – enforced by
conditions set by international financial institutions like the IMF and the World Bank – that
emphasised market liberalisation and increased competition in electricity production.
28
Eberhard, A. (ND). Op cit.
29
van der Heijen, T. (2013). Op cit.
30
Eberhard, A. (ND). Op cit.
31
Baker, L. (2012). Power shifts in South Africa’s minerals-energy complex: from coal crunch to wind rush?
https://www.researchgate.net/publication/273446955_Baker_L_2012_Power_Shifts_in_South_Africa's_Minerals
-Energy_Complex_From_Coal_Crunch_to_Wind_Rush
14Eskom: The roots of a crisis and avenues forward
Working Paper Series: Number 4
October 2020
3.2 THE 1998 WHITE PAPER ON ENERGY
In the context of GEAR, a 1998 White Paper set out proposed changes in electricity policy, as
the prevailing economic policy at the time. The White Paper claimed it would curtail the vast
inequities inherited from the apartheid government through a liberalisation programme that
prioritised attracting private investment into the energy sector. The main argument mirrors
most neoliberal policies at the time: increased competition promotes efficiency in the context
of market forces leading to the most optimal outcome (lowest price).32 The model of the
power sector in the White Paper was one of vertical and horizontal unbundling, separating
out the potentially competitive components of the industry (generation) from the ‘natural
monopoly’ (such as transmission) components.
In addition, the Eskom Conversion Bill of 2001 replaced the Eskom Act of 1987 with
subsequent amendments: Eskom was to be converted into a public company in 2002
(corporatisation), with its share capital held by the state33 and was consequently responsible
for paying dividends and taxes. A consequence of the corporatisation of Eskom is that the
capital subsidies for the connection of low-income consumers are no longer funded
internally by Eskom, but derive from fiscal allocations to a national electrification fund. The
Eskom Conversion Bill also replaced the two-tier governance structure with a single board.
In May 2001, the Cabinet approved the proposals for the reform of the Electricity Supply
Industry (ESI) suggested in the White Paper. The policy stated its intention to unbundle
transmission and guarantee third-party access, sell at least 50% of Eskom’s generation
capacity, and introduce competition through a multi-market model, allowing small and large
energy generators.
Major opposition to the White Paper, including from labour unions, was lodged and
alternative models presented to the government, with alternative models for distribution that
would preserve a more prominent role for Eskom as a vertically integrated monopoly. For
example, Cosatu opposed privatisation – and the liberalisation in general – and argued that
Eskom should remain a vertically-integrated, publicly-owned utility and be strategically
utilised by government to meet development goals in South Africa, in addition to providing
low-cost electricity services to all, especially lower-income areas.
Unbundling was never fully realised, including because of a lack of political will and Eskom’s
use of its monopoly power. The unbundling process which did occur took place only at the
accounting/administrative level: independent business units were established as separate
32
Ibid.
33
Eberhard, A. (2013). Op cit.
15Eskom: The roots of a crisis and avenues forward
Working Paper Series: Number 4
October 2020
entities, each with their own CEOs and boards; and Eskom’s head office was scaled down as
staff were moved across country to the new business units. The Eskom board supported
competition in principle, but resisted any proposals that it should divest more than 30% of its
generation stations and its leadership expressed alarm at the extent of the reform
proposals,34 particularly a recommendation to reduce Eskom’s share of the generation
market to 30%. It began to lobby government at the highest levels, drawing on its reputation
for delivering low prices, for supporting the government’s RDP goals and its vision of an
African renaissance embodied in early versions of the New Partnership for African
Development (NEPAD).35
Despite Eskom’s involvement in developing the White Paper, the leadership at Eskom began
to push back against the restructuring process. Then Eskom CEO, Thulani Gcabashe, was
reported to have said that he did not believe that the radical restructuring and partial sale of
Eskom was a good idea, he argued: “Eskom has the lowest electricity price in the world, and
an excellent technical performance when benchmarked against the rest of the world. We
need clear objectives as to why we are going this route”.36
The following sections give more detail on the proposals contained within the 1998 White
Paper, particularly relevant to today’s debates.
3.2.1 RESTRUCTURE OF THE GENERATION INDUSTRY
Prior to the release of the White Paper, Eskom dominated the ESI, as discussed in Section 1,
supplying most of South Africa’s electricity generation requirements in 1996. About 91% of the
electricity was generated from coal, with nuclear energy accounting for 6.5%, and hydro and
emergency gas turbines making up the remaining 2.5%.37 Eskom had 24 power stations,
dominated by 10 large coal-fired stations – most of the 24 comprised 600MW units and are
situated on coal mines in the north-east of South Africa.
The White Paper projected that growth in electricity demand was to be fully utilised, if not
surpassing supply, by 2007. This was partly because of the effect on capacity caused by the
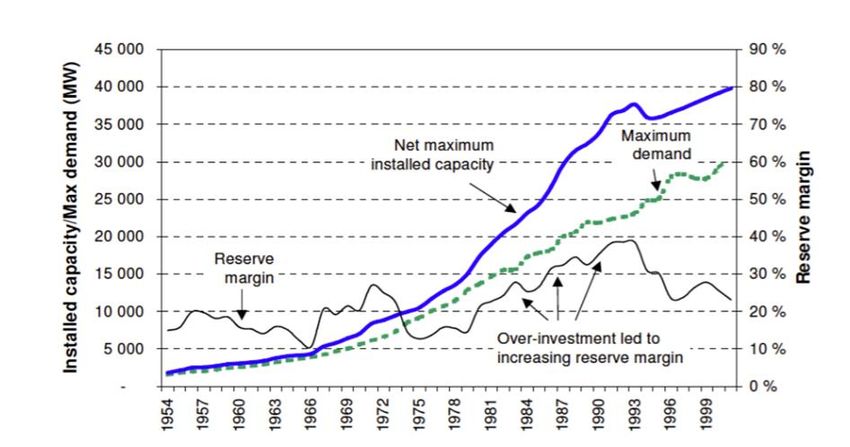
extensive build and electrification programme after 1994. As seen in Figure 1, in 1985, nominal
generating capacity38 was 37 840MW, while its total net maximum capacity39 was 35 926MW,
34
Lloyd, P. (2018). Restructuring South Africa’s Electricity Supply Industry. [Online] Available:
https://hsf.org.za/publications/focus/focus-64/PhillipLlyod64.pdf
35
Ibid.
36
AllAfrica (2001). Retrieved from: https://allafrica.com/stories/200110010307.html
37
Eberhard, A. (ND). Op cit.
38
Nominal capacity indicates the maximum output of electricity a generator can produce without exceeding
design thermal limits.
39
Net maximum capacity refers to the electric output an electricity generator can produce under specific
thermal conditions.
16Eskom: The roots of a crisis and avenues forward
Working Paper Series: Number 4
October 2020
and its peak electricity demand was approximately 24 798 MW, meaning that the reserve
margin40 was 31%. From 1993, the reserve margin declined steadily as demand increased.
FIGURE 1: GROWTH IN MAXIMUM DEMAND AND CAPACITY IN ESKOM
Source: Eberhard, 2017.
The White Paper argued for greater private-sector investment in the generating sector,
arguing that the only way to increase capacity was through increased competition in the
generation market to meet projected demand by 2007. The government planned to provide
customers the option of choosing their preferred energy suppliers; to permit “open and non-
discriminatory access to the transmission system”;41 and to “encourage private-sector
participation”.42 The planned changes in the local electricity generation market can be
summarised as:
There would be the entry of multiple players into the generation market, and a
generation company – separated from transmission – would be established. In 2001,
Cabinet approved proposals that Eskom would retain 70% of the existing electricity
generation market, with 30% being marked for sale to private investors (including an
initial aim of transferring 10% of this share to black ownership). Given the role that
coal-based generation had on significant pollution emissions, with potential long-
40
The reserve margin is the difference between expected generation capacity (supply) less expected maximum
peak demand.
41
van der Heijen, T. (2013). Op cit.
42
Ibid.
17Eskom: The roots of a crisis and avenues forward
Working Paper Series: Number 4
October 2020
term effects on the environment, Independent Power Producers (IPPs) were also
admitted into the generation market for renewable energy.
To prevent over-investment in new generation capacity, new investment decisions
would be located within a detailed integrated resource planning (IRP) process that
would include all sector stakeholders. This would “ensure that utilities avoid or delay
electricity supply investments, or delay decommissioning decisions, when it is
economical to do so, by optimising the utilisation of existing capacity and increasing
the efficiency of energy supply and consumption”.43 The White Paper stated that
responsibility for integrated energy planning should lie with the government, rather
than any sector participant. Thus, Eskom would no longer have the sole authority to
plan for electricity generation – the Department of Minerals and Energy (DME) had
the mandate for policy development, including the IRP process, and overseeing the
restructuring of the electricity sector. In line with this proposition, Eskom closed
down its new works department in 2001. It did not, however, close down its planning
department, even though that function was supposed to be taken over by the
government, as stipulated in the White Paper.
In 2003, the government began to revise its plans to privatise part of Eskom’s generation
assets, although restructuring of the sector was still favoured. After its win in the 2004
elections, the ANC stated that it would not sell the core assets of Eskom. Alec Erwin (Minister
of Public Enterprises at the time) announced that the government had changed its focus from
a competitive wholesale market to ensuring security of supply. It was at this time that the
strategy to introduce new participants into the market was changed to specify that only a
maximum 30% of new generation capacity would be supplied by IPPs (without privatisation
of existing Eskom capacity).
3.2.2 RESTRUCTURING OF THE TRANSMISSION INDUSTRY
Eskom owns the national, integrated transmission grid and the 1996 White Paper proposed
that transmission would remain within the ambit of the state, and was to take the form of a
separate independent company. To ensure non-discriminatory and open access to the
transmission lines, this transmission company would be independent of Eskom’s (or any
other) generation and retail businesses. Initially this transmission company would be a
subsidiary of Eskom Holdings and would be established as a separate state-owned
transmission company before any new investments were made in generation capacity.
However, Eskom attempted to delay the separation of transmission services. On occasion, it
argued that placing transmission into a subsidiary company within the Eskom group would
43
Department of Minerals and Energy, 1998. White Paper on the energy policy in the Republic of South Africa.
(page 53).
18Eskom: The roots of a crisis and avenues forward
Working Paper Series: Number 4
October 2020
yield ‘sufficient’ unbundling. It also presented alternative models for distribution that would
preserve a more prominent role for the firm as a vertically integrated monopoly.
3.2.3 RESTRUCTURING DISTRIBUTION NETWORKS
In terms of restructuring distribution functions, the 1998 White Paper proposed that the
sector would move to cost-reflective tariffs with separate, transparent funding for
electrification and other municipal services. More than 400 distributors, mainly municipal
electricity departments, comprising 55% of total distribution (that were not Eskom) supplied
electricity to end-users. The primary challenges identified in the distribution sector included:
About 40% of all homes in South Africa and about ten thousand schools and clinics
were without ready access to an electricity supply.
With more than 400 distributors, the distribution sector was highly fragmented,
resulting in low efficiencies, high costs, wide disparities in tariffs, and poor financial
viability.
The distribution industry experienced high levels of non-payment and electricity theft,
resulting in increasing arrears and payment defaults.
The electrification programmes of most municipal distributors were limited by
difficulties in accessing affordable finance.
The White Paper supported a strategic decision to “restructure the energy market by first
reorganising the distribution sector”. It was envisaged that the distribution industry would be
restructured into five state-owned regional electricity distributors (REDs). Each RED would
“require the right balance of below-cost (low-income residential) and above-cost
(commercial and industrial) users”.44 This, as with other aspects of the White Paper, was
considered a controversial proposal by unions and Eskom management. As further
articulated by Eberhard:45
“The ruling ANC was split on the issue – its leadership asserted the importance of a national
solution to the problems of electricity distribution, but those involved in local government feared
losing their influence. With so many divided loyalties, distribution reform did not have a political
champion, which slowed down the process”.
44
Department of Minerals and Energy, 1998. White Paper on the energy policy in the Republic of South Africa.
45
Eberhard, A. (nd), page 7. Op cit.
19Eskom: The roots of a crisis and avenues forward
Working Paper Series: Number 4
October 2020
3.3 THE FARM INN SUMMITS
In 2001, Eskom began organising a series of meetings with various public and private sector
stakeholders to convey its concerns about the ESI reform programme. Held at Farm Inn near
Pretoria, the meetings became known as the ‘Farm Inn Summits’. In an agreement which
originated at the first Farm Inn Summit in October 2001, and which was signed on 15 March
2002, the DME, the DPE, the South African Local Government Association (SALGA), the
National Energy Regulator (NER) and Eskom reached broad consensus on the next steps on
ESI reform.46
It was planned that an ESI restructuring committee, chaired by the DPE, would be
established. Eskom would ring-fence its generation stations into clusters, or portfolios, for
internal competition. The agreement further suggested that Eskom Holdings establish
subsidiary companies for Eskom Generation and Eskom Transmission (although this was
later contested by Eskom).
The DPE subsequently established an ESI restructuring office and detailed studies were
undertaken by government-led, interdepartmental and stakeholder committees, and
external consultants. A follow-up Farm-Inn summit in March 2004, comprising DME, DPE,
SALGA, the NER and Eskom, plus additional government departments (National Treasury, the
Department of Trade and Industry, the Department of Provincial and Local Government, and
the Competition Commission and EDI Holdings), confirmed the reform steps, but agreed to
significantly delay target dates. For example, a portion of Eskom’s generation assets that
should have been divested in 2003 was shifted to 2006–2007. Although there had been
general briefings to the Parliamentary Portfolio Committees, and workshops were held with
industry stakeholders on the proposed market design, few details of the Farm-Inn agreement
and the reform timetable have been made public.
In 2003, the government began to revise its plans to privatise part of Eskom’s generation
assets. This was solidified after its win in the 2004 elections; the ANC stated that it would not
sell Eskom’s core assets and Eskom would remain a vertically integrated monopoly. During
this time, because of the policy uncertainty, no additional capacity was being produced, the
effects of which would culminate into its first load-shedding by 2008.
46
Ibid.
20Eskom: The roots of a crisis and avenues forward
Working Paper Series: Number 4
October 2020
4 THE VARIOUS DIMENSIONS OF ESKOM’S
CRISIS
Eskom’s current predicament stems from a confluence of unresolved historical internal
problems and myopic energy and administrative planning, exacerbated by fluctuations in the
global economy. After a period of excess supply capacity of 13% in the mid-1980s, by 2008 the
reserve margin fell to 6%. This was partly because of delayed initiatives to maintain existing
and bring on line new capacity during periods when it was making its highest profits,
exacerbated by international environmental pressures, increasing coal costs. By 2008,
Eskom implemented rolling blackouts (load-shedding) throughout the country owing to an
under-supply of electricity.
The next sections will explore the different facets of Eskom’s current crisis. It will focus on
the financial mismanagement at Eskom, analysis of the coal industry, Eskom’s build
programme and its tariff structure.
4.1 FINANCIAL MISMANAGEMENT
Prior to 2007, Eskom achieved significant profits; between 1995 and 2006, its net profit margin
averaged 12.2% compared to the economy-wide average for non-financial corporations47 of
7.8% in the same period.48 After profits began declining from 2007, its net profit margin
averaged 4% (including losses between 2007 and 2009), compared to non-financial
corporations which saw an average profit margin of 9% over the same period.49
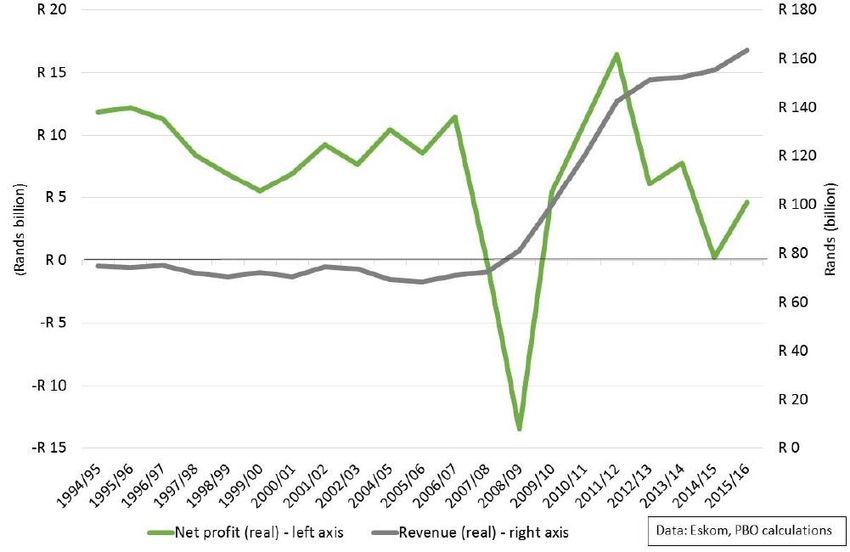
The decline in Eskom’s profitability since 2007 occurred despite sustained increases in
revenue. Figure 2 shows that between 2007 and 2016, Eskom’s revenues grew by an annual
average of 9.7% in real terms (nominal: 16.9%), while profits fell by an annual average of 9.6%
in real terms.50 Importantly, the significant increase in Eskom’s revenues since 2008 was not
due to increased electricity sales – total electricity sales declined after 2008 in response to
the effects of the global financial crisis, country-wide load-shedding and sustained lower
economic growth.
47
Non-financial corporations are subject to control by government units and whose principal activity is market-
oriented production of goods and services.
48 Merten, M. (2019). ’Eskom is in a deep hole.’ Daily Maverick. Available:
https://www.dailymaverick.co.za/article/2019-02-13-eskom-is-in-a-deep-hole-it-will-take-decades-and-
serious-financial-wizardry-to-dig-it-out/#gsc.tab=0
49
Saunders, N. (2017). ‘Eskom financials: summary report.’ The Eton Group. Retrieved from:
http://www.eton.io/wp-content/uploads/2017/09/Eton_EskomFinancialsSummaryReport_20170908.pdf.
50
Ibid.
21Eskom: The roots of a crisis and avenues forward
Working Paper Series: Number 4
October 2020
The significant increase in Eskom’s revenues since 2007/08 has primarily been a result of
large increase in electricity tariffs. As shown in Figure 2, Eskom’s revenues from 2008
steadily increases from R44.4 billion to R177.4 billion by 2018. However, this did not translate
into greater electricity output capacity, which remained steady over the same period.
Between 2008 and 2016, average electricity tariffs increased by 374% (real: 168%) – a nominal
annual average increase of 16.8% (real: 10.4%). This reversed the trend of the preceding
decade (1997-2007) wherein electricity tariffs decreased in real terms.51 In this period,
average electricity tariffs decreased by 21.6% (real: -62.2%) – an annual average decrease of
2.4% (real: -9.4%). The reasons for the real decrease in average electricity tariffs prior to
2007/08, and the subsequent sudden increases since, was due to the timing and size of
Eskom’s investments, as well as changes to the tariff-setting methodology.
FIGURE 2: ESKOM’S DECLINING PROFITABILITY
Source: South Africa Parliamentary Budgetary Office, 2018.
Although rising prices for electricity increased Eskom’s revenue, despite falling sales in
volume terms, its profits have become increasingly unstable. Figure 3 shows the escalation
of Eskom’s revenue and expenditure between 2002 and 2016. The largest contributor to
Eskom’s expenses is the build programme for Medupi and Kusile, along with other operating
expenses, such as expenditure items such as “Managerial, Technical and Other Fees”,52 which
increased by 140% in the same period. Along with many other irregular expenditures, this
amount can be attributed to consulting fees paid to McKinsey and Trillian (discussed below).
51
Mnguni, G., Amra, R., & Mohamed, S. (2018). 'Analysis of Eskom Finances'. Parliamentary Budgetary Office.
52
Eskom Financial Statements. (2017). Available: eskom.co.za
22Eskom: The roots of a crisis and avenues forward
Working Paper Series: Number 4
October 2020
The following sections will delve more into the different aspects of Eskom’s financial issues
including its massive build programme, Kusile and Medupi, the price of coal and corruption.
FIGURE 3: TRAJECTORY OF ESKOM’S REVENUE AND EXPENDITURE BETWEEN 2002 AND 2016
Source: BusinessTech, 2017.
4.2 COAL SECTOR
A key player in the MEC is South Africa’s coal industry, which currently supplies coal for over
80% of the country’s electricity generation.53 Historically, most of the country’s coal supply
has been controlled by five main private monopolies that have disproportionately benefitted
from access to cheap electricity from Eskom: Anglo American Corporation, Exxaro, South32
(formerly BHP Billiton), Xstrata and Sasol. While Eskom is their biggest customer for coal
supply, they in turn are amongst Eskom’s biggest customers for electricity. They wield
considerable influence over the utility with regards to setting the terms of coal supply,54 and
also have significant influence over policies governing the electricity generated by coal.
However, the global coal industry is in decline as the world becomes increasingly conscious
of the effects of climate change. There have been significant divestments from coal
companies that were previous beneficiaries of the coal boom. At the same time, major coal
importers like India, Pakistan and South Korea – which make up more than 50% of South
Africa’s coal exports – are also either transitioning away from coal or have limited their
53
McDaid, L., Austin, B., Bragg, C. (2010). ‘Power to the people: raising the voice of civil society in electricity
planning-Integrated Resources Plan 2010 inputs and departmental responses.’ Cape Town: WWF, South
African Faith Communities Environment Institute for Security Studies, October.
54
Eberhard, A. (2011). Op cit.
23Eskom: The roots of a crisis and avenues forward
Working Paper Series: Number 4
October 2020
growth forecasts.55 For example, India’s56 stated economic policy is to reduce its reliance on
coal imports by at least 60% by 2030.
Ideally, as global demand for coal declines, this should translate into lower tariffs, but
because of Eskom’s costly build programme, the average energy cost has increased. Figure
4 shows that the average Eskom price between 2001 and 2020 increased significantly while
the unit value of coal exports declined steadily. This is because, in addition to its debt
servicing costs, Eskom has not adequately contained its coal costs.57 In its 2018/9 tariff
application to NERSA, it anticipated that its total coal costs, including handling, would
increase by 9%, which is about 3% above inflation forecasts. Added to this, there are a number
of irregular coal contracts that have contributed to its overall coal costs. For example, in
2018 Eskom paid Glencore double the price it paid a smaller supplier for the same quality of
coal, reflecting a loss of R1.4 billion.58
FIGURE 4: INDICES OF ESKOM’S AVERAGE PRICE COMPARED TO EXPORT PRICE OF COAL IN
CONSTANT (2016) RAND (A) AND US DOLLARS
Source: Makgetla, 2016.
South Africa, which exports about 49% of its mining production, is a price-taker in the market,
and the Rand denominated coal price is exposed to currency fluctuations, as shown in Figure
5. Dollar denominated coal price moved closely in tandem with export prices but diverged
55
Institute for Energy Economics and Financial Analysis, 2019. Retrieved from:
http://ieefa.org/energyfinance2019/.
56
This is also unfortunate for South Africa’s coal industry because India is South Africa’s largest export market
for coal.
57
Ibid.
58 https://mg.co.za/article/2019-04-05-00-eskom-loses-billions-on-coal-contracts/
24You can also read