HOW MANY EGGS, IN HOW MANY BASKETS? AN UPDATE ON NZ-CHINA TRADE PATTERNS - Author: New Zealand China ...
←
→
Page content transcription
If your browser does not render page correctly, please read the page content below

HOW MANY EGGS, IN HOW MANY BASKETS?
 AN UPDATE ON NZ-CHINA TRADE PATTERNS

  A u t ho r :

  C o m m i ss i o n e d b y
H O W M A N Y E G GS , I N HO W M A N Y B AS K E T S ? A N U P D AT E O N N E W Z E A L A N D - C H I N A T R A D E P A T T E R N S

Executive summary
The New Zealand China Council (NZCC) has engaged Sense Partners to provide an independent
assessment of New Zealand’s trade relationship with China.

This report seeks to contribute facts and figures to the recurrent debate around whether New
Zealand is too economically dependent on China, and if so, what might be done about it.

China has accounted for over 60% of New Zealand’s goods export growth over the past decade,
reflecting China’s strong income growth, changing consumer preferences for primary products,
reduced trade barriers arising from the bilateral Free Trade Agreement, and trust and institutional
linkages built up over time.

There is no denying that for some export and import products, China accounts for a very large
share of New Zealand’s global trade. Should export demand decline or supply chain disruptions
occur for these products, some firms will be exposed.

And the recent Australian experience demonstrates that political risks can present significant
challenges for exporters to China, although political risks are not limited to China alone (as French
cheesemakers or Scotch whisky producers exporting to the US will attest).

Yet it is hard to imagine New Zealand firms are not aware of the risks of concentrating too much
effort in one market, be that China or any other. They are best placed to determine whether the
rewards of trading with China outweigh the concentration risks, including political risks.

In considering whether New Zealand is too dependent on China, there are many unanswered
questions.

      •      What is the ‘correct’ level of trade with China? Who decides?

      •      What are the economic and political risks associated with exporting to other markets? Will
             diversification always be net beneficial?

      •      Are there other large, fast-growing markets out there that really want what New Zealand
             produces? Why aren’t we selling to them already?

      •      Are those markets willing to reduce their tariffs and non-tariff barriers to provide greater
             opportunities for Kiwi exporters?

The government has an important role in providing future diversification options for New Zealand
exporters, by continuing to negotiate improved access in other large potential markets such as the
EU, UK, US and India. But this will not be easy or fast, despite our negotiators’ best efforts.

New Zealand businesses need to be clear-eyed about engaging with China. Selling a portfolio of
products that is highly concentrated in a single market is obviously risky. There will be bumps along
the commercial road, some of which will be out of their control.

But there will be considerable opportunities too for those who invest in long-term relationships and
demonstrate their value to Chinese buyers.

                                                                                                                                      i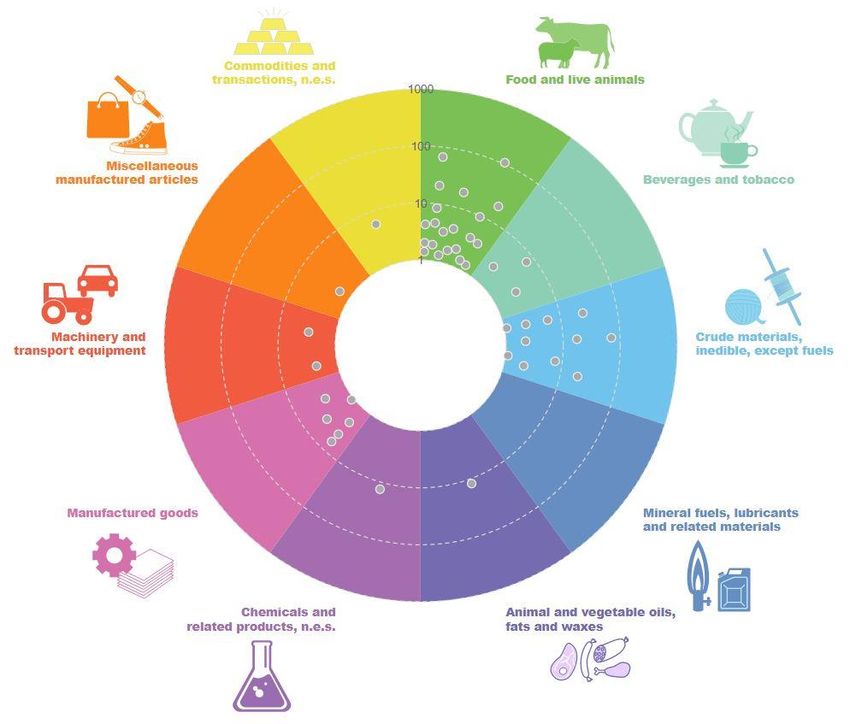
H O W M A N Y E G GS , I N HO W M A N Y B AS K E T S ? A N U P D AT E O N N E W Z E A L A N D - C H I N A T R A D E P A T T E R N S

Key findings
China has accounted for over 60% of New Zealand’s goods export growth in
the past decade
     •    China has accounted for $12.9 billion (62.5%) of New Zealand’s goods export growth of
          $20.7 billion over the past 10 years.

     •    Exports to other traditional markets such as the US and Japan have also grown, albeit at a
          much slower rate, and exports to Australia and the UK have fallen slightly over this period.

     •    This export growth to China has been driven by rapid income growth and urbanisation in
          China, along with changing dietary preferences.

     •    The New Zealand-China Free Trade Agreement (FTA), and the rules-based structure it has
          delivered for firms and institutions, has also played a part.

     •    China has also accounted for 23.1% of New Zealand’s total services export growth since
          2010, with a strong contribution in education services (46.2% of education exports) and
          personal travel services (i.e. tourism) (30.7%).

New Zealand and Chinese economies are highly complementary
     •    The two economies are complementary, with New Zealand having a strong Revealed
          Comparative Advantage (RCA) in primary products and China in manufactured goods.

     •    These RCAs have increased over time: New Zealand increasingly tends to produce what
          China is not particularly good at producing, and vice versa.

New Zealand’s overall exposure to China is relatively high; we are not alone
FIGURE 1 GOODS IMPORT AND EXPORT EXPOSURE TO CHINA: ALL COUNTRIES

SOURCE: UN COMTRADE

                                                                                                                                      ii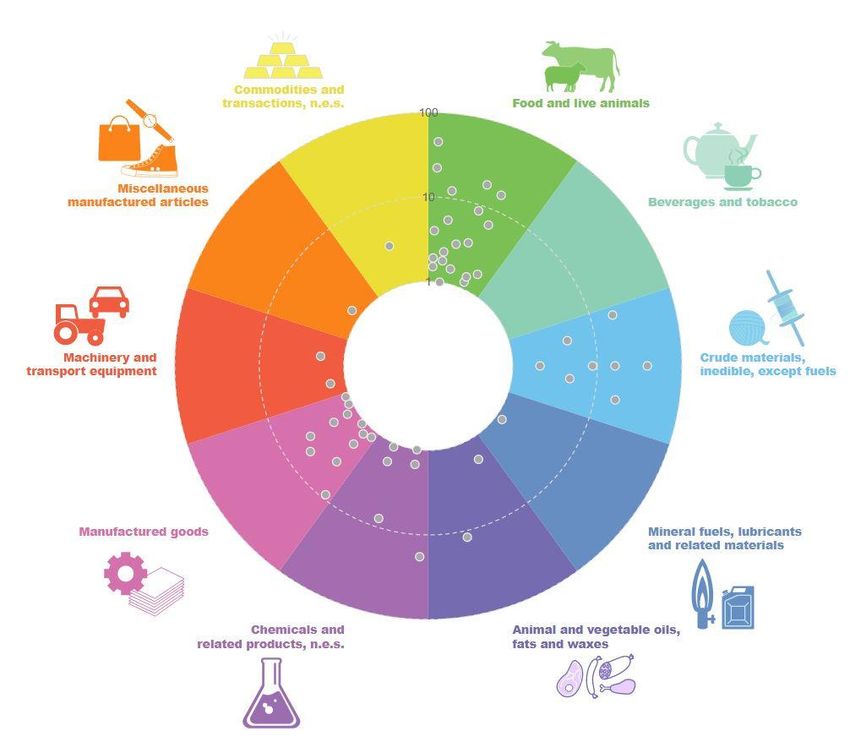
H O W M A N Y E G GS , I N HO W M A N Y B AS K E T S ? A N U P D AT E O N N E W Z E A L A N D - C H I N A T R A D E P A T T E R N S

     •    New Zealand’s 2018 goods export (24.2%) and import exposure (19.8%) to China are
          relatively high.

     •    APEC members Hong Kong (55.2%), Australia (34.7%), Chile (33.5%), Peru (27.6%) and Korea
          (26.8%) all had a higher share of their goods exports directed to China in 2018.

China’s importance for New Zealand exporters has increased rapidly
     •    China’s share of New Zealand’s goods exports increased from 11.1% in 2010 to 24.2% in
          2018.

     •    The only developed country to have become more export dependent (in terms of change in
          export dependency) on China than New Zealand since 2010 is Uruguay.

     •    Our import share from China has not changed as much – from 16.0% in 2010 to 19.8% in
          2018.

Exports have diversified slightly in recent years
     •    New Zealand’s exports to China diversified rapidly over the early-1990s to mid-2000s period.

     •    In the early 1990s, New Zealand exported only a handful of HS4 products valued at more
          than $10 million, with wool accounting for 45% to 60% of New Zealand’s total goods
          exports. By the mid-2000s, this had risen to around 25.

     •    New Zealand’s exports to China then became sharply more concentrated from 2008 to 2013.
          Around 50% of the growth in New Zealand’s exports to China over this period was in one
          HS4 product line: HS0402, milk powder.

     •    This milk powder export growth was partly due to the bilateral FTA improving market access,
          but also due to very strong Chinese import demand following domestic food safety breaches
          (melamine).

     •    Since 2013, our exports to China have become slightly more diversified, largely due to:

            o     rapid growth (over $40 million increase) in a range of products over the past 5 years,
                  including various types of logs, frozen beef, frozen lamb, infant formula, woodpulp,
                  cream, gold kiwifruit, unsalted butter, rock lobsters, frozen squid, grated cheese, UHT
                  milk, dairy-based food preparations, cheddar cheese, honey, tripe and Pacific Queen
                  apples1 (see Appendix E for the 50 largest growth products).

            o     a sharp drop in exports of milk powder (following the false alarm over botulism-
                  contaminated milk powder), a $150 million fall in wool exports and a $96 million drop
                  in sheep and lamb raw skins.

     •    In 2019, New Zealand exported 1,904 HS10 products to China, compared to 1,681 in 2010,
          589 in 2000 and 115 in 1990.

     •    New Zealand’s goods exports to the UK are more concentrated than its exports to China.

1
 Exports of ice cream ($3.6 million in 2014 to $29.8 million in 2019) and skin care products ($4.2 million to $23.2
million) have also grown rapidly.
                                                                                                                                      iii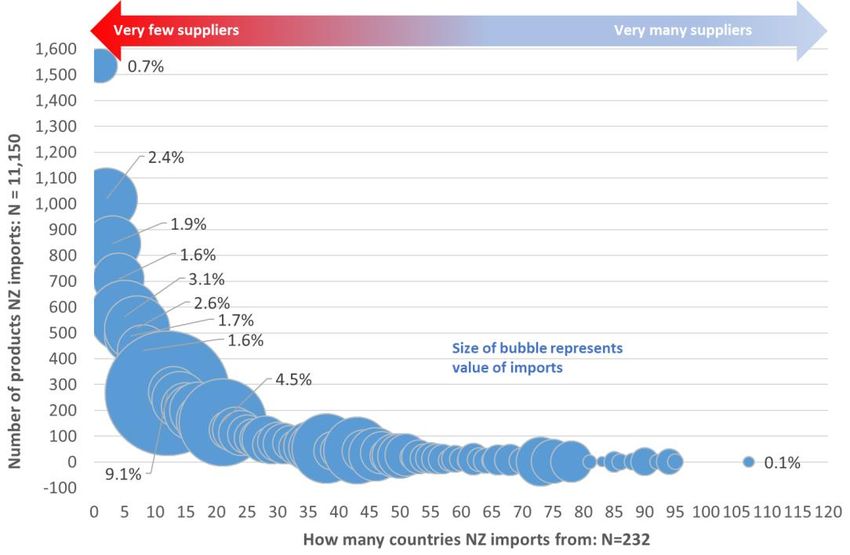
H O W M A N Y E G GS , I N HO W M A N Y B AS K E T S ? A N U P D AT E O N N E W Z E A L A N D - C H I N A T R A D E P A T T E R N S

Chinese demand accounts for a large share of total New Zealand exports for
many products
      •   Half of the total value of our bilateral goods exports comprises products where China
          accounts for at least 50% of our global exports (i.e. where China has a more than 50% export
          share).

      •   23% of our goods exports to China by value are in products where China accounts for over
          80% of New Zealand’s global exports.

      •   In 2019, China was the sole export market for 52 products, with a combined value of $135.7
          million (0.81% of New Zealand goods exports of $16.7 billion).

      •   China accounts for 80% of New Zealand's $3.4 billion exports of logs.

      •   China accounts for 95% of New Zealand's $346 million exports of rock lobsters, as was
          starkly highlighted during the early stages of the Covid-19 pandemic.

      •   China accounts for high export shares of several dairy products, including unsweetened and
          sweetened milk and cream and infant formula.2

      •   Some meat products are also highly dependent on China including frozen beef, sheep and
          goat meat, and offal, in which China accounts for at least 40% of exports.

China is a key source of many imported goods
      •   Around 2/3 of our bilateral imports by value are in products where China has a greater than
          50% share of New Zealand’s imports from the world.

      •   22% by value of our Chinese imports are in product lines in which China accounts for at least
          80% of New Zealand’s imports from the world.

      •   China is the sole supplier of imports for 367 products, collectively valued at $109.2 million.
          (Australia is the sole source of imports valued at $149.9 million).

      •   Most of these 367 products are transport, metal, rubber, and construction products, along
          with oddities like badminton feather shuttlecocks. Medical supplies do not feature
          prominently.

Is this China concentration a problem?
      •   It is easy to say that New Zealand is too reliant on China. This report shows that for some
          exports and imports, New Zealand is indeed highly exposed to China.

      •   There is no denying concentration carries risks. An unforeseen slowdown in Chinese demand
          or production – as occurred with Covid-19 – will leave some firms exposed to revenue
          declines or supply chain challenges.

      •   But asserting that New Zealand is “too” economically reliant on China implies it is possible to
          define somehow the “correct” size of the trading relationship.

      •   Put another way: how much should New Zealand be trading with a huge, fast-growing
          market that wants what we produce and export, offers tariff preferences over other large
          markets, and specialises in producing items we want to import?

      •   There is no obvious right or wrong answer to the question of how much New Zealand
          should export to or import from China, or any other market for that matter, either at the

2
    See box story on Fonterra’s approach to the Chinese market for more context.
                                                                                                                                      iv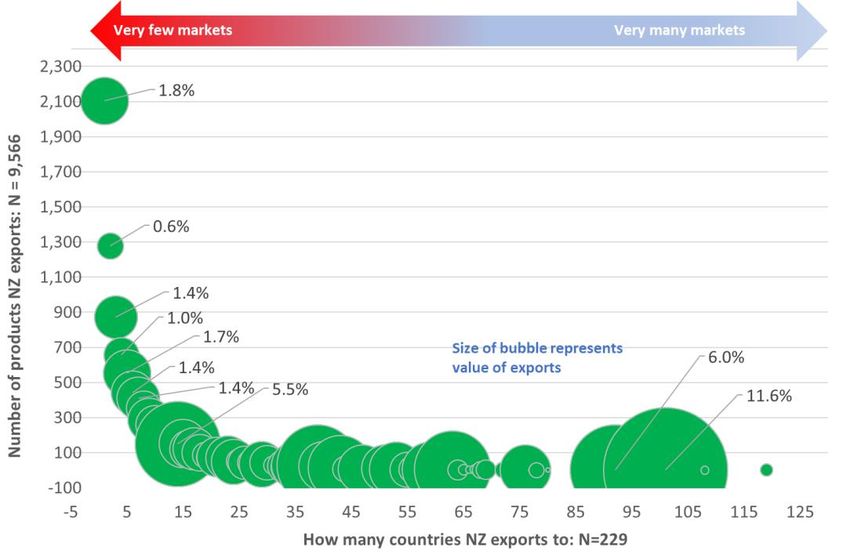
H O W M A N Y E G GS , I N HO W M A N Y B AS K E T S ? A N U P D AT E O N N E W Z E A L A N D - C H I N A T R A D E P A T T E R N S
aggregate level or product level; just as there is no obvious right or wrong answer to how
much risk we should bear.
• The aggregate trade data disguise the decisions of thousands of New Zealand businesses.
They are responding to their commercial incentives and presumably trading with China
because the benefits of doing so exceed the costs.
• It seems unlikely that New Zealand firms are unaware of the risks of focusing heavily (or
solely) on the Chinese market.
• And if they weren’t aware before Covid-19, they will be now.
• The lack of alternative markets that are fast-growing, large and willing to provide ready
access for New Zealand’s key exports also explains New Zealand’s focus on China.
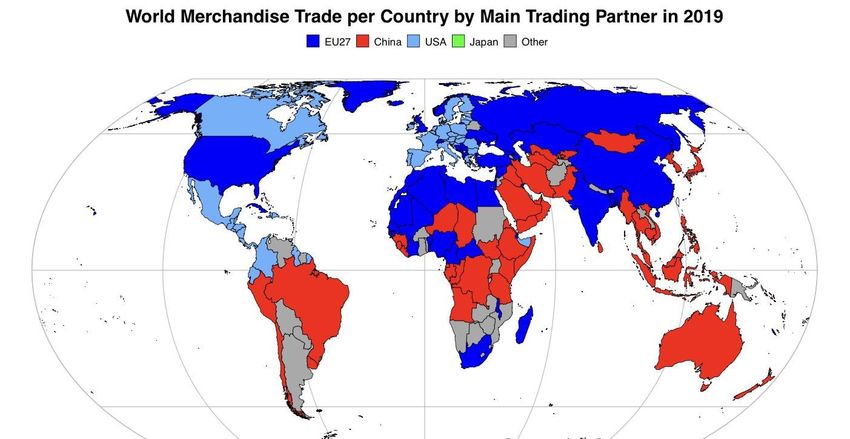
New Zealand’s export concentration with China is different to that with the
UK in the mid-20th century
• As Figure 2 shows, our current export concentration in China is much lower than when New
Zealand was the UK’s ‘market garden’ from the 1860s to the 1970s. The UK accounted for
between 70% and 90% of New Zealand’s goods exports between the 1870s and the 1940s.
• The diversification of New Zealand’s export partners had been taking place for some time
before the UK joined the EEC in 1973. This was in part due to the relatively slow growth of
the UK economy. Clearly this is not the case with China today.
• There are differences in industry exposure too. As NZIER (2020) notes, in 1973 the UK was
taking 90% of New Zealand’s butter, 80% of our cheese and 80% of our lamb. Trade was
concentrated in a few products, as opposed to the spread of products we now sell to China.
FIGURE 2 MARKET SHARES OF NEW ZEALAND’S GOODS EXPORTS, 1857-2018
SOURCE: NZIER 1850 WEBSITE, STATS NEW ZEALAND
NOTE: CHINA INCLUDED IN ‘OTHER’ BEFORE 1988.
v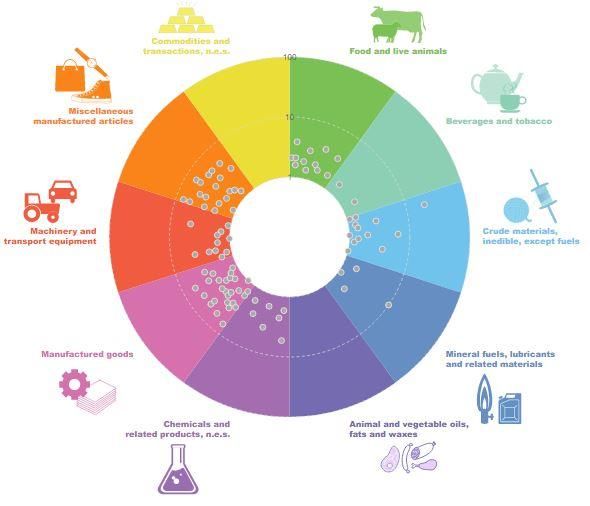
H O W M A N Y E G GS , I N HO W M A N Y B AS K E T S ? A N U P D AT E O N N E W Z E A L A N D - C H I N A T R A D E P A T T E R N S

Kiwi firms need to take the rough with the smooth
     •    If exporters are eager to profit from trade with China rather than other export markets, then
          they must also accept the accompanying market concentration risks, including geopolitical
          ones.

     •    They will prosper in China’s good times and suffer in bad times; and shouldn’t look to
          government to cover the risk of the latter.

     •    Firms could of course spread their risks by exporting to a wider range of markets. But this
          would presumably come with (on average) higher costs, due to the fixed costs of market
          entry.

     •    Whether a business is prepared to give up some profitability to mitigate concentration risks
          is up to them, depending on their tolerance for risk.

Government can help by giving firms more options over time
     •    Government’s role in supporting exports and imports is most appropriately about removing
          barriers to trade, improving certainty, and helping firms overcome information problems.

     •    This gives firms more options in terms of finding commercially beneficial buyers and sellers,
          and potentially spreading risks across more markets.

     •    The government’s current trade policy and offshore representation focus is designed to do
          just this. There will always be arguments that it is not doing enough or doing it fast enough.

     •    But New Zealand is generally not in a strong position to demand market access concessions
          from larger economies. We cannot simply pick and choose who will open their markets to
          us, or when.

     •    If government succeeds in reducing trade barriers and improving certainty in markets like
          the EU, UK, US and India, it will provide Kiwi businesses with a wider range of large, hopefully
          fast-growing markets to potentially trade with.

     •    This could lead to what Laurenceson and Zhou3 call a “China-and-“ set of opportunities for
          our exporters.

     •    Some of these trade negotiations (e.g. EU, UK) are on ambitious schedules, but additional
          agricultural market access will be challenging to secure and likely to be slowly phased in
          over time for the most sensitive products. Other FTA targets (e.g. India, US) could be many
          years away, despite our best endeavours.

     •    So, it is unrealistic to think China’s importance to New Zealand exporters – and the
          accompanying rewards and concentration risks – will decrease in a hurry.

3
 Laurenceson, J. and M. Zhou. 2020. ‘COVID-19 and the Australia-China relationship’s zombie economic idea’.
Australia-China Relations Institute, University of Technology Sydney.
                                                                                                                                      vi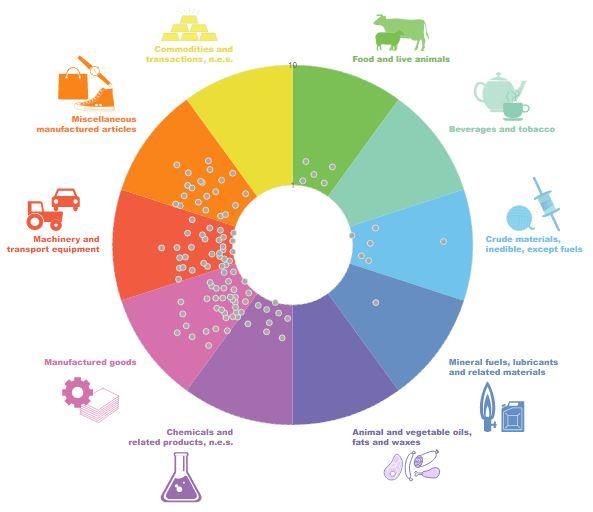
H O W M A N Y E G GS , I N HO W M A N Y B AS K E T S ? A N U P D AT E O N N E W Z E A L A N D - C H I N A T R A D E P A T T E R N S

Contents
    Executive summary ........................................................................................................i
    Key findings ................................................................................................................... ii
1. Purpose and scope ........................................................................................................ 1
2. China’s role in NZ’s export growth ................................................................................ 2
    2.1. China’s contribution to export growth since 2010 ................................................. 2
    2.2. Drivers of New Zealand’s exports to China ............................................................ 2
    2.3. The outlook for key markets .................................................................................. 6
    Box story: Fonterra: Dairy isn’t a product, it’s a portfolio ............................................. 7
3. Export exposure ............................................................................................................ 8
    3.1. Export exposure at the country level ..................................................................... 8
    3.2. NZ’s exports to China by market share bands ...................................................... 10
    3.3. APEC economies’ major export markets .............................................................. 11
4. Industry export exposure to China .............................................................................. 13
    4.1. Industry exposure for goods ................................................................................ 13
    4.2. Industry exposure for services ............................................................................. 15
    4.3. NZ's exports by number of markets ..................................................................... 18
5. Import exposure .......................................................................................................... 20
    5.1. Import exposure at the country level .................................................................. 20
    5.2. NZ’s imports from China by market share bands ................................................. 22
    5.3. NZ's imports by number of suppliers ................................................................... 22
    5.4. APEC economies’ major import sources .............................................................. 24
6. Bringing it all together................................................................................................. 25
7. Diversification of exports ............................................................................................ 27
    7.1. Export diversification across markets .................................................................. 27
    7.2. Export diversification across products ................................................................. 29
8. Revealed comparative advantage ............................................................................... 31
    8.1. Complementary economies ................................................................................. 31
    8.2. Changes in comparative advantage over time ..................................................... 32
9. Discussion: what – if anything – should we do? .......................................................... 35
Appendix A Industries in Figure 13 and Figure 14 ........................................................... 38
Appendix B Products for which China is New Zealand’s sole export market................... 42
Appendix C Products for which China is New Zealand’s sole import supplier ................. 44
Appendix D RCA data ...................................................................................................... 46
Appendix E Exports to China showing strong growth since 2014 .................................... 52

                                                                                                                                          vii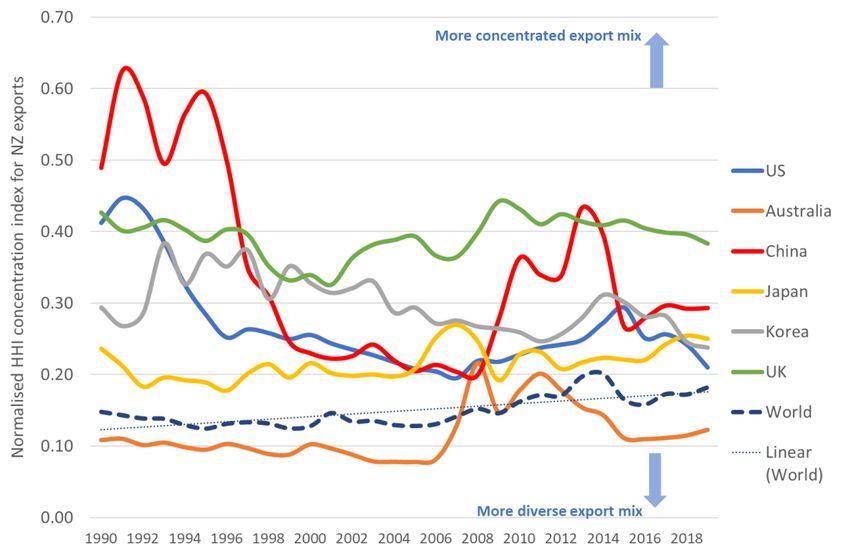
H O W M A N Y E G GS , I N HO W M A N Y B AS K E T S ? A N U P D AT E O N N E W Z E A L A N D - C H I N A T R A D E P A T T E R N S

1. Purpose and scope
The New Zealand China Council (NZCC) has engaged Sense Partners to provide an independent
assessment of New Zealand’s trade relationship with China.

This analysis seeks to contribute facts and figures to the recurrent debate around whether New
Zealand is too economically dependent on China, and if so, what might be done about it.

Our report focuses on just one aspect of the wider bilateral relationship – trade in goods and
services. We recognise that New Zealand’s interactions with China span a much wider range of
economic, political and security dimensions, but those aspects are much harder to analyse
empirically, so we leave them to foreign policy experts to dissect.

We hope this report contributes to a more informed discussion around New Zealand’s trade ties
with China and prompts further research into this important topic.

                                                                                                                                      1
H O W M A N Y E G GS , I N HO W M A N Y B AS K E T S ? A N U P D AT E O N N E W Z E A L A N D - C H I N A T R A D E P A T T E R N S

2. China’s role in NZ’s export growth
2.1. China’s contribution to export growth since 2010
China has accounted for $12.9 billion of New Zealand’s total goods export growth of $20.7 billion
over the past decade to March 2020, or 62.5%.

Exports to other traditional markets such as the US and Japan have also grown over this period,
albeit at a much slower rate, and exports to Australia and the UK have fallen slightly.

FIGURE 3 CONTRIBUTION TO NEW ZEALAND’S GOODS EXPORT GROWTH SINCE 2010

SOURCE: STATS NEW ZEALAND

Over the past five years, China’s contribution has been 70.2%, or $8.2 billion out of the additional
export value of $11.7 billion.

2.2. Drivers of New Zealand’s exports to China
Several structural drivers sit beneath the role of China in New Zealand’s export growth.

First, China’s income per capita has grown very rapidly since at least 1990 (Figure 4 and Figure 5).
This growth has been from a very low base, and China’s per-capita GDP (US$9,349 in 2018) remains
less than one quarter of the developed economy average (US$43,769). But as the Chinese
population has grown richer and its economy opened up to a wider range of imported products, its
tastes have changed.

Second, China’s population has also urbanised rapidly since the 1980s (Figure 6). This has led to
improved access to imported products, especially foodstuffs, relative to those available to the rural
population.

                                                                                                                                      2
H O W M A N Y E G GS , I N HO W M A N Y B AS K E T S ? A N U P D AT E O N N E W Z E A L A N D - C H I N A T R A D E P A T T E R N S
FIGURE 4 CHINA’S REAL INCOME PER CAPITA GROWTH VS. THE WORLD
Index, 1970 = 100
FIGURE 5 REAL INCOME PER CAPITA GROWTH: CHINA VS. OTHER KEY EXPORT MARKETS
Compound average growth rate, 1970-2018
SOURCE: UNCTAD
3H O W M A N Y E G GS , I N HO W M A N Y B AS K E T S ? A N U P D AT E O N N E W Z E A L A N D - C H I N A T R A D E P A T T E R N S
FIGURE 6 URBANISATION TRENDS OVER TIME
SOURCE: UNCTAD
Third, the Chinese demand for proteins – and especially animal-based proteins – has risen as
income levels rise.
Figure 7 shows how income and protein demand are positively related, and Figure 8 shows how
China’s protein needs have multiplied 2.5 times over the past 60 years.
FIGURE 7 PROTEIN FROM ANIMAL-BASED FOODS VS. GDP PER CAPITA
SOURCE: HTTPS://OURWORLDINDATA.ORG/
4H O W M A N Y E G GS , I N HO W M A N Y B AS K E T S ? A N U P D AT E O N N E W Z E A L A N D - C H I N A T R A D E P A T T E R N S
FIGURE 8 DAILY PER-CAPITA PROTEIN SUPPLY IN CHINA VS. WORLD
SOURCE: HTTPS://OURWORLDINDATA.ORG/
Fourth, bilateral foreign and trade policy settings and the policy choices of other countries have
supported strong growth in New Zealand’s exports to China.
The New Zealand-China Free Trade Agreement was implemented in 2008, which improved New
Zealand’s market access and lifted New Zealand’s profile within China. The FTA also served to
deepen the links between the countries’ institutions, which is important for developing trust.
The conclusion of the FTA in 2008 was the last of the “four firsts”, as they were frequently described
at the time. New Zealand was the first developed country to:
1. support China’s WTO accession;
2. recognise China as a market economy;
3. commence FTA negotiations with China;
4. conclude FTA negotiations with China.
At around the time as the FTA was implemented, other agricultural producers were constrained in
their ability to meet surging Chinese demand for animal proteins, due to the lingering effects of the
GFC and rising feed prices driven in part by biofuels subsidy programmes in the US and EU.
China’s accession to the World Trade Organisation in 2001 also contributed to improved
productivity, as reforms allowed firms to enter and exit markets more freely.4
These structural drivers, along with the complementary nature of the two economies (see section
8.1 later), provide a solid backdrop for the trade growth experienced over the past two decades.
4
Brandt L, J Van Biesebroeck and Y Zhang. 2012. "Creative accounting or creative destruction? Firm-level
productivity growth in Chinese manufacturing," Journal of Development Economics, 97, 339–351.
5H O W M A N Y E G GS , I N HO W M A N Y B AS K E T S ? A N U P D AT E O N N E W Z E A L A N D - C H I N A T R A D E P A T T E R N S
2.3. The outlook for key markets
Covid-19 will have a significant negative impact on the global economy for at least the next few
years. The scale of these impacts is challenging to determine, not least due to the risks of second
and third waves of infection further affecting consumer spending and business investment and
employment intentions.
Current projections from international organisations such as the OECD and World Bank show sharp
declines in economic activity in 2020, with a partial bounce-back in 2021.
Figure 9 shows the World Bank’s projections, suggesting global GDP growth will fall by 5.2% in
2020, with 4.2% growth in 2021. No country escapes the global recession, although China’s and Viet
Nam’s GDP growth remains positive (just) in 2020.
As such it is not obvious that there will be a significant shift in New Zealand’s export destinations in
the short term based on the economic outlook across markets. Indeed, since China fares less badly
than other markets, it could play an important role in supporting New Zealand’s exports as the
global economy recovers.
While New Zealand’s exports – especially in the primary sector – have held up well to date, the
magnitude of the global recession will almost inevitably lead to lower export volumes and/or prices.
FIGURE 9 WORLD BANK GDP GROWTH PROJECTIONS
SOURCE: WORLD BANK GLOBAL ECONOMIC PROSPECTS, JUNE 2020
Looking past the next few years, we would expect structural drivers of growth to start dominating
the outlook for New Zealand’s exports. Unless Covid disproportionately affects China in the medium
term, it is hard to see its importance for New Zealand’s export demand waning considerably.
6H O W M A N Y E G GS , I N H O W M A N Y B AS K E T S ? A N U P D AT E O N N E W Z E A L A N D - C H I N A T R A D E P A T T E R N S
Box story: Fonterra: Dairy isn’t a product, it’s a portfolio
Fonterra’s recent experience in China with the Covid-19 outbreak has demonstrated the value of the
company selling a diversified portfolio of dairy products.
With restaurants closed, its $1 billion foodservices line (e.g. mozzarella, whipping cream cheese),
which services over 300 cities, unsurprisingly slowed. Yet its ingredients business (e.g. yoghurt,
infant food, milk powders), barely suffered, as most contracts are settled well in advance. And there
were shifts in buying behaviour for its smaller consumer products sales channel, with a surge in
sales of UHT milk, butter and frozen dairy goods as Chinese people stayed at home and had more
opportunities to cook.
Initial indications are that Covid has prompted a surge of interest in health and wellness, food safety
and quality. Fonterra is confident these trends will support further growth in its functional foods,
nutraceuticals, and paediatric products.
So, while it is common to think of “dairy” as one product, the reality is Fonterra services several
differentiated markets in China through several different sales channels. Overall, Fonterra accounts
for 36% of China’s imports of dairy products.
Fonterra has had a presence in China for over 40 years and now employs over 1,500 staff in-market.
It sees itself as a part of China’s dairy system rather than a remote supplier, with an R&D centre to
be launched in August in Shanghai, strong institutional links and a strong emphasis on
collaboration and innovation. It has partnerships with Chinese online channels such as Alibaba,
TenCent and JD.com.
It hopes that these supply chain linkages and trusted institutional relationships will provide a
degree of insurance against the risks of Chinese market fluctuations.
Fonterra also sells dairy products to over 100 markets globally, accounting for around 75% of its
business, so there are alternatives should demand slow in China.
However, alternative large markets do not yet offer the same degree of market access and income
growth as China. Many have their own domestic dairy sectors, so the gap between the demand for
dairy products and domestic supply is smaller than in China.
SOURCE: INTERVIEW WITH FONTERRA STAFF
7H O W M A N Y E G GS , I N HO W M A N Y B AS K E T S ? A N U P D AT E O N N E W Z E A L A N D - C H I N A T R A D E P A T T E R N S
3. Export exposure
3.1. Export exposure at the country level
In 2018, China accounted for 24.2% of New Zealand’s goods exports (Figure 10). This places New
Zealand 13th of the 127 countries for which cross-country comparable data is available.
APEC members Australia (34.7%), Chile (33.5%), Peru (27.6%) and Korea (26.8%) all had a higher
share than New Zealand of their goods exports directed to China in 2018.
China’s goods export share has increased to 28.5% for New Zealand in the year to March 2020. We
do not yet have internationally comparable data to determine whether this would see New Zealand
move left on Figure 10. It is possible that other countries’ export exposure will also have risen.
Figure 11 overleaf shows the change, in percentage points, in China’s share of goods exports
between 2010 and 2018.
China’s share of New Zealand’s goods exports increased from 11.1% in 2010 to 24.2% in 2018. The
only developed country to have had a greater increase than New Zealand in its share of goods
exported to China from 2010-2018 was Uruguay, another country that predominantly exports
agricultural products (e.g. beef, wood, wool, dairy).
8H O W M A N Y E G GS , I N HO W M A N Y B AS K E T S ? A N U P D AT E O N N E W Z E A L A N D - C H I N A T R A D E P A T T E R N S
FIGURE 10 CHINA’S SHARE OF GOODS EXPORTS: 50 HIGHEST RANKED EXPORTERS BY SHARE
SOURCE: UN COMTRADE
FIGURE 11 CHANGE IN CHINA’S MARKET SHARE, 2010-2018: 20 LARGEST CHANGES
SOURCE: UN COMTRADE
9H O W M A N Y E G GS , I N HO W M A N Y B AS K E T S ? A N U P D AT E O N N E W Z E A L A N D - C H I N A T R A D E P A T T E R N S
3.2. NZ’s exports to China by market share bands
Figure 12 below shows New Zealand’s export dependence on China split across dependency
deciles, aggregated over 9,566 export products.5
For example, $0.4 billion of New Zealand’s $16.7 billion of goods exports in 2019 were in products
where China accounts for between 0% and 10% of New Zealand’s total exports of those products.
The chart shows New Zealand’s exports to China are concentrated in products where China takes
40% to 60% of New Zealand’s exports of those products.
Half of the value of our bilateral exports is in products where China accounts for 50% or more of
New Zealand’s total exports of those products; and 23% of our exports are in products where China
accounts for over 80% of New Zealand’s exports.
A more detailed analysis of industry exposure is in section 4.
FIGURE 12 NEW ZEALAND’S EXPORTS TO CHINA, BY DEPENDENCE, 2019
SOURCE: GLOBAL TRADE ATLAS
5
This is at the Harmonised 10-digit level of aggregation, the most detailed data available.
10H O W M A N Y E G GS , I N HO W M A N Y B AS K E T S ? A N U P D AT E O N N E W Z E A L A N D - C H I N A T R A D E P A T T E R N S
3.3. APEC economies’ major export markets
Table 1 shows each APEC member’s6 top three goods export destinations, ranked by the most
dependent destination. It demonstrates New Zealand’s reliance on China is not unusual; nor is it
unusually high.
TABLE 1 APEC ECONOMIES’ TOP 3 GOODS EXPORT MARKETS, 2018
Economy Largest Share, % 2nd largest Share, % 3rd largest Share,
export export export market %
market market
Mexico US 76.5% Canada 3.1% China 1.6%
Canada US 75.0% China 4.7% UK 2.8%
Hong Kong China 55.2% US 8.1% India 3.2%
Australia China 34.7% Japan 16.4% Korea 7.0%
Brunei Japan 34.7% Thailand 10.5% Korea 9.4%
Chile China 33.5% US 13.8% Japan 9.3%
Peru China 27.6% US 16.7% India 5.2%
Korea China 26.8% US 12.1% Vietnam 8.0%
New Zealand China 24.2% Australia 15.9% US 9.6%
Japan China 19.5% US 19.1% Korea 7.1%
Vietnam US 19.3% China 16.5% Japan 7.8%
China US 19.2% Hong Kong 12.1% Japan 5.9%
US Canada 18.0% Mexico 15.9% China 7.2%
Philippines US 15.6% Hong Kong 14.2% Japan 14.0%
Indonesia China 15.1% Japan 10.8% US 10.3%
Malaysia Singapore 13.9% China 13.9% US 9.1%
Russia China 12.4% Netherlands 9.6% Germany 7.6%
Singapore China 12.2% Hong Kong 11.8% Malaysia 10.9%
Thailand China 12.0% US 11.1% Japan 9.9%
SOURCE: WORLD BANK WITS
NOTES: EXCLUDES ‘UNSPECIFIED COUNTRIES’ AS EXPORT PARTNER; DATA FOR PNG AND TAIWAN NOT AVAILABLE;
VIETNAM DATA IS FOR 2017
6
We use APEC economies as a reference group simply due to convenience. As always, identifying a natural set
of economies against which to compare New Zealand’s data is challenging.
11H O W M A N Y E G GS , I N HO W M A N Y B AS K E T S ? A N U P D AT E O N N E W Z E A L A N D - C H I N A T R A D E P A T T E R N S
Of course, it is easy to explain away some of the highest dependencies shown – of course Mexico
and the Canada will rely heavily on the US, due to contiguity and NAFTA-driven supply chains. And
Hong Kong will naturally have a very high reliance on China.
But that highlights an important point. Trade between countries is largely driven by economic size
and distance, along with considerations of historical and cultural ties, and trade barriers. These
drivers have been empirically confirmed time and time again.
So it should be no surprise that China is so important for many countries, including New Zealand, as
an export destination. It is both very large and – for many APEC economies at least – relatively close
geographically. It has also been growing more rapidly than just about any other economy.
12H O W M A N Y E G GS , I N HO W M A N Y B AS K E T S ? A N U P D AT E O N N E W Z E A L A N D - C H I N A T R A D E P A T T E R N S
4. Industry export exposure to China
4.1. Industry exposure7 for goods
To provide greater detail on New Zealand’s export exposure, we have looked at China’s market
share of New Zealand’s goods export at the 4-digit level of the Harmonised System classification
(HS4).8
We have split the analysis into two bands: HS4 exports to China of $10 million to $100 million; and
exports greater than $100 million. These are arbitrary thresholds, chosen to allow a clear graphical
representation of the analysis, and to identify industries which are both large and exposed.9
Figure 13’s vertical axis shows China’s share of New Zealand’s total exports for HS4 categories of
over $100 million of exports to China in calendar year 2019. The horizontal axis shows the value of
New Zealand’s exports to China in those categories. The red dashed line shows China’s share of
New Zealand’s goods exports overall (28.5% in 2019).
The closer to the top right of the figure, the larger and more export-exposed the HS4 category.
FIGURE 13 INDUSTRY EXPORT EXPOSURE TO CHINA: >$100M EXPORTS, 2019
SOURCE: GLOBAL TRADE ATLAS
7
The phrase “industry exposure” is shorthand for “the sum of the exposure of firms that export these products”.
Many firms, however, export several products to several markets – it is important to note that the product
exported to China may be part of a portfolio of products send to multiple destinations.
8
We selected this level of aggregation as it is detailed enough to provide insights into specific industries’
exposure (1,138 product codes) but also manageable in terms of presenting the results. We have also looked at
China’s market share for the HS10 level of detail (11,150 products), but it is challenging to present those results
in a meaningful way in a written report.
9
New Zealand recorded zero exports to China in 593 categories and less than $10 million in a further 490
categories.
13H O W M A N Y E G GS , I N HO W M A N Y B AS K E T S ? A N U P D AT E O N N E W Z E A L A N D - C H I N A T R A D E P A T T E R N S
Standout results10 include:
• 95% of New Zealand’s $346 million exports of rock lobsters (HS30611) are destined for
China, as was highlighted during the early stages of the Covid-19 pandemic.
• China accounts for 80% of New Zealand’s $3.4 billion exports of logs (HS4403). Chemical
woodpulp (4703) is also more-than-averagely exposed to China.
• Several dairy products appear here, including milk and cream (HS401 and 402) and infant
milk formula (HS1901). Cheese and curd (HS406), butter (HS405), and casein (HS3501) are
large export products, but not overly exposed to China.
• Meat products are also prominent, including frozen beef (HS202), sheep & goat meat
(HS204), and offal (HS504).
Figure 14 presents the same chart, but for exports to China of between $10 and $100 million.
FIGURE 14 INDUSTRY EXPORT EXPOSURE TO CHINA: $10M TO $100M EXPORTS, 2019
SOURCE: GLOBAL TRADE ATLAS
Appendix A again provides the HS4 full descriptions. Of note are:
• ‘Bovine Animals, Live’ (HS102), in which New Zealand exported almost every single dollar
of its 2019 $77.3 million global exports to China alone.
• Mineral water (unsweetened) (HS2201), in which China accounts for almost ¾ of New
Zealand’s total exports of $60 million.
• Woodpulp from mechanical/chemical pulping (HS4705), in which China accounts for $81
million of New Zealand’s total exports of $146 million.
10
A table summarising the data in Figure 13 and Figure 14, including full HS4 descriptions, is in Appendix A.
11
Note zeros are missing from the start of any 3-digit code in the charts, so 102 is in fact 0102.
14H O W M A N Y E G GS , I N HO W M A N Y B AS K E T S ? A N U P D AT E O N N E W Z E A L A N D - C H I N A T R A D E P A T T E R N S
4.2. Industry exposure for services
New Zealand exported $3.1 billion of services to China in the year to March 2020, on top of the
$16.7 billion of goods exports.
China accounts for 12.5% of New Zealand’s services exports, and as Figure 15 shows has a
particularly strong market share in education travel services (i.e. export education) and ‘Other
personal travel services’ (i.e. tourism).
FIGURE 15 SERVICES EXPORT VALUE MARKET SHARES, YEAR TO MARCH 2020
SOURCE: STATS NZ
China has played an important part in the growth of the New Zealand services export sector over
the past decade, accounting for:
• 23.1% of total services export growth
• 46.2% of total education travel services export growth
• 30.7% of other personal travel export services growth.
(see figures overleaf).
New Zealand’s exports of commercial services are limited: $6 million for pension services, $25
million for financial services, $10 million for IT services and $25 million for ‘Other’ business services.
15H O W M A N Y E G GS , I N HO W M A N Y B AS K E T S ? A N U P D AT E O N N E W Z E A L A N D - C H I N A T R A D E P A T T E R N S
FIGURE 16 CONTRIBUTION OF CHINA TO TOTAL SERVICES EXPORT GROWTH, 2010-2020
SOURCE: STATS NEW ZEALAND
FIGURE 17 CONTRIBUTION OF CHINA TO EDUCATION SERVICES EXPORT GROWTH, 2010 -2020
SOURCE: STATS NZ
16H O W M A N Y E G GS , I N HO W M A N Y B AS K E T S ? A N U P D AT E O N N E W Z E A L A N D - C H I N A T R A D E P A T T E R N S
FIGURE 18 CONTRIBUTION OF CHINA TO PERSONAL TRAVEL SERVICES (TOURISM) EXPORT
GROWTH, 2010-2020
SOURCE: STATS NZ
17H O W M A N Y E G GS , I N HO W M A N Y B AS K E T S ? A N U P D AT E O N N E W Z E A L A N D - C H I N A T R A D E P A T T E R N S
4.3. NZ's exports by number of markets
Looking at New Zealand’s export data at a highly detailed level (HS10; 9,556 products), we can get a
more granular understanding of New Zealand’s export exposure to China and other markets.
Figure 19 shows how many products (vertical axis) New Zealand exported to how many markets
(horizontal axis) in calendar year 2019.
The bubbles represent the sum of export values for the number of export sources, with the labels
showing the share of total goods exports.
The chart shows that $1.05 billion (or 1.8%) of New Zealand’s total goods exports are sent to just
one market, spanning 2,104 products.
China accounts for 52 of these products, with a combined value of $135.7 million (see Appendix B
for detail on these products). These sole market exports are dominated by:
• Dairy breeding cattle ($77.3 million)
• A specific type of log12 ($50.0 million).
FIGURE 19 HOW MANY EXPORT MARKETS DOES NEW ZEALAND SELL TO?
SOURCE: GLOBAL TRADE ATLAS
12
Full product name: “Wood; Coniferous Species, Of Fir (Abies Spp.) And Spruce (Picea Spp.), In The Rough,
Whether Or Not Stripped Of Bark Or Sapwood, Or Roughly Squared, Untreated, Of Which Any Cross-Sectional
Dimension Is 15 Cm Or More; Saw Logs And Veneer Logs”.
18H O W M A N Y E G GS , I N HO W M A N Y B AS K E T S ? A N U P D AT E O N N E W Z E A L A N D - C H I N A T R A D E P A T T E R N S
Box story: Kono: A kaleidoscope of opportunities
Kono is family-owned Māori food and beverage producer from the top of South Island, making and
exporting wine, cider, beer, seafood, fruit, hops and natural fruit bars.
The name Kono comes from the basket of produce that Māori offer to guests in a tradition of
honour and hospitality, and the company sells its basket of products to over 25 countries, including
China.
Kono’s key exports to China include mussels, wine and fruit bars, though is dominated by mussels
at this point. The key to Kono’s China strategy is being in for the long haul, accepting the
complexity of doing business there and diversifying their mussel sales through different channels to
different parts of the market.
It knows there will be ups and downs in commercial conditions in China and recognises that it can
only “control the controllable”. It has invested considerable sunk costs in China as “you can’t negate
the power of the market”, according to Rachel Taulelei, Kono CEO.
It focuses on maintaining its authenticity and brand values of rangatiratanga (excellence in all we
do), manaakitanga (we rise by lifting others), whanaungatanga (together we are more), kaitiakitanga
(our duty, our heritage, our legacy), hihiritanga (doing things better, doing better things) and pono
(we do as we say).
Indeed, Kono doesn’t see itself trading “with China” as a whole; rather it forms relationships based
on these values with key importers and distributors across a range of cities.
Ms Taulelei says that the business recognises the risks of being “all in on China”, and spreads risks
by having different key markets for its various products, such as the US, Australia and New Zealand
for fruit bars; and the US, Netherlands and New Zealand for its wine. It also sells mussels to 15 other
markets across Asia, Europe and Middle East and North America.
As part of its planning, Kono seeks to understand the risks across its market and product space and
has prepared backup plans in case of challenges with any individual product or market. This
scenario planning, plus having several sales options for all of its products, allows it to adjust to
changing market conditions.
SOURCE: INTERVIEW WITH MS RACHEL TAULELEI, KONO CEO
19H O W M A N Y E G GS , I N HO W M A N Y B AS K E T S ? A N U P D AT E O N N E W Z E A L A N D - C H I N A T R A D E P A T T E R N S
5. Import exposure
5.1. Import exposure at the country level
Figure 20 shows various economies’ reliance on China for imported goods, again for 2018.
New Zealand imported around 20% by value of its goods from China.13 Across the 136 economies
in the data set, China accounted for 14.8% of imports on average.
Developed economies with a greater dependence on China than New Zealand include Hong Kong
(44.8%), Brunei (39.4%), Australia (24.5%), Chile (23.6%), Peru (23.3%), Japan (23.2%) and the US
(21.6%)
FIGURE 20 CHINA’S SHARE OF GOODS IMPORTS: 50 HIGHEST RANKED IMPORTERS BY SHARE
SOURCE: UN COMTRADE
China’s share of New Zealand’s imports increased by 3.8 percentage points between 2010 and 2018,
from 16.0% to 19.8%.
So, it is true to say New Zealand is becoming more reliant on China as a source of goods imports
over time.
Over the same period, 50 other countries experienced a larger percentage point increase in their
import dependence on China (see Table 2 overleaf).
13
In the years to March 2019 and 2020, China’s import share remained at 19.8%.
20H O W M A N Y E G GS , I N HO W M A N Y B AS K E T S ? A N U P D AT E O N N E W Z E A L A N D - C H I N A T R A D E P A T T E R N S
TABLE 2 CHANGE IN IMPORT DEPENDENCY ON CHINA, 2010-2018
SOURCE: UN COMTRADE
21H O W M A N Y E G GS , I N HO W M A N Y B AS K E T S ? A N U P D AT E O N N E W Z E A L A N D - C H I N A T R A D E P A T T E R N S
5.2. NZ’s imports from China by market share bands
The 19.8% of imports that New Zealand sources from China, some $12.5 billion in calendar year
2019, is spread across 11,150 product (HS10) categories.
Figure 21 shows the distribution of China’s import share across these 11,150 products:
• Around 2/3 of our imports by value are in products where China has a greater than 50%
share of New Zealand’s imports.
• 22% by value of our Chinese imports are in product lines in which China accounts for at
least 80% of New Zealand’s total imports.
FIGURE 21 NEW ZEALAND’S IMPORTS FROM CHINA, BY DEPENDENCE, 2019
SOURCE: GLOBAL TRADE ATLAS
5.3. NZ's imports by number of suppliers
In general, New Zealand’s exposure to imports from only a small number of sources is limited.
The top chart in Figure 22 shows how many products (vertical axis) New Zealand imported from
how many import sources (horizontal axis). The bubbles represent the sum of import values for
number of import sources, with the labels showing the share of total goods imports.
New Zealand imported 1,536 products from just one supplier in 2019, valued at $451.1 million, and
1,108 from two suppliers, valued at $1.45 billion.
China is the sole supplier of imports for 367 products, collectively valued at $109.2 million. By
comparison, products in which Australia is the sole source of imports are valued at $149.9 million.
Table 7 in Appendix C records the 30 most significant (in terms of value) products which New
Zealand imported solely from China in 2019. The vast majority are transport, metal, rubber and
construction products, along with oddities like badminton feather shuttlecocks.
22H O W M A N Y E G GS , I N HO W M A N Y B AS K E T S ? A N U P D AT E O N N E W Z E A L A N D - C H I N A T R A D E P A T T E R N S
FIGURE 22 HOW MANY IMPORT SOURCES DOES NEW ZEALAND HAVE?
SOURCE: GLOBAL TRADE ATLAS
The bottom chart in Figure 22 shows the value of imports from each number of import sources.
Twelve seems to be the magic number in terms of import markets, accounting for 9.1% of New
Zealand’s goods imports.
The product New Zealand imports from the most countries, 107 no less, and valued at $50.4 million
in 2019 is ‘Rubber; vulcanised (other than hard rubber), gaskets, washers and other seals, of non-
cellular rubber'.
23H O W M A N Y E G GS , I N HO W M A N Y B AS K E T S ? A N U P D AT E O N N E W Z E A L A N D - C H I N A T R A D E P A T T E R N S
5.4. APEC economies’ major import sources
Table 3 lists APEC economies’ three largest goods import sources, for 2018. It is ordered by the
share of the most important import source.
All APEC economies, aside from the US-dominated Canada and Mexico, have China as their largest
import source, with China’s import share accounting for between 13.4% and 44.8%. New Zealand’s
reliance on China (19.8% of imports) is not particularly high, based on this comparator group.
TABLE 3 APEC ECONOMIES’ TOP 3 IMPORT SOURCES, 2018
Economy Largest Share, % 2nd largest Share, % 3rd largest Share,
source of source of source of %
imports imports imports
Canada US 51.5% China 12.8% Mexico 6.2%
Mexico US 46.6% China 18.0% Japan 3.9%
Hong Kong China 44.8% Singapore 6.4% Korea 5.7%
Brunei China 39.4% Singapore 13.8% Malaysia 13.2%
Vietnam China 27.5% Korea 22.0% Japan 7.9%
Australia China 24.7% US 10.5% Japan 7.4%
Indonesia China 24.1% Singapore 11.4% Japan 9.5%
Chile China 23.6% US 18.9% Brazil 9.0%
Peru China 23.3% US 21.3% Brazil 5.6%
Japan China 23.2% US 11.2% Australia 6.1%
Russia China 21.7% Germany 10.6% Belarus 4.4%
US China 21.6% Mexico 13.4% Canada 12.5%
Thailand China 20.3% Japan 14.3% US 6.2%
Malaysia China 20.0% Singapore 11.7% US 7.4%
Korea China 19.9% US 11.0% Japan 10.2%
New Zealand China 19.8% Australia 11.5% US 10.2%
Philippines China 19.6% Korea 10.0% Japan 9.9%
Singapore China 13.4% Malaysia 11.5% US 11.4%
China Korea 10.3% Japan 9.1% US 7.8%
SOURCE: WORLD BANK WITS
24H O W M A N Y E G GS , I N HO W M A N Y B AS K E T S ? A N U P D AT E O N N E W Z E A L A N D - C H I N A T R A D E P A T T E R N S
6. Bringing it all together
Combining the country-level analysis in sections 3.1 and 5.1, we can create a scatter plot showing goods export and import exposure to China for 2018 for the each of
the 136 economies for which data is available from COMTRADE.
FIGURE 23 IMPORT AND EXPORT EXPOSURE TO CHINA: ALL COUNTRIES
The further to the right, the more a
country is reliant on China for its
exports.
The closer to the top, the more reliant
a country is reliant on China for its
imports.
The dashed orange lines show the
average export and import shares
across all countries.
The key message here is that while
New Zealand is more than averagely
exposed to China, we are far from
alone in being reliant on China: 31
countries are in the upper right
quadrant.
SOURCE: UN COMTRADE
25H O W M A N Y E G GS , I N HO W M A N Y B AS K E T S ? A N U P D AT E O N N E W Z E A L A N D - C H I N A T R A D E P A T T E R N S
The map below shows similar information. China is the main trading partner for those countries shaded red. The Lowy Institute estimates that of 190 economies, 128
trade more with China than they do with the US.14
FIGURE 24 MAP OF WORLD TRADE BY MAIN TRADING PARTNER, 2019
SOURCE: ECIPE
14
https://www.lowyinstitute.org/the-interpreter/chart-week-global-trade-through-us-china-lens
26H O W M A N Y E G GS , I N HO W M A N Y B AS K E T S ? A N U P D AT E O N N E W Z E A L A N D - C H I N A T R A D E P A T T E R N S
7. Diversification of exports
7.1. Export diversification across markets
Figure 25 shows how New Zealand’s (and a selected few other countries’) goods exports have
diversified over time (1989-2017) in terms of the markets to which we export. The higher the market
concentration index score, the fewer markets the country exports to.15
It shows New Zealand’s export markets became much more diversified from the late 1980s to the
early 2000s, as UK became gradually less important.
New Zealand’s export markets have become more concentrated in the past decade, but this trend is
a common one. Other developed countries such as Australia, Korea and Chile have experienced far
greater increases in their market concentration, and China will be a large part of that story.
FIGURE 25 EXPORT MARKET CONCENTRATION INDEXES
SOURCE: WORLD BANK WITS
Parallels between New Zealand’s dependence on the UK in the 20th century and its exposure to
China are often made. But the picture is quite different.
China currently accounts for 28.5% of New Zealand’s goods exports. The UK accounted for between
70% and 90% of New Zealand’s goods exports between the 1870s and the 1940s. This dropped
steadily to around 35% by 1970 and 27% by 1973.
15
The metric used here is the Herfindahl-Hirschman Market Concentration Index, which provides an indication
of the dispersion of export markets. A value of zero shows a country is trading equally with its export partners; a
number closer to one indicates very high export market shares for a small number of markets. See
http://wits.worldbank.org/WITS/docs/TradeOutcomes-UserManual.pdf p.26 for more detail.
27H O W M A N Y E G GS , I N HO W M A N Y B AS K E T S ? A N U P D AT E O N N E W Z E A L A N D - C H I N A T R A D E P A T T E R N S
As Figure 26 shows, the diversification of New Zealand’s export partners had been taking place for
some time. The UK joining the EEC accelerated the trend.
There are differences in industry exposure too. As NZIER (2020) notes, in 1973 the UK was taking
90% of New Zealand’s butter, 80% of our cheese and 80% of our lamb.16 Trade was concentrated in
a few products, as opposed to the spread of products we now sell to China.
Another key difference is that by the 1960s, the UK economy was growing relatively slowly. Clearly
this is not the case with China today.
FIGURE 26 MARKET SHARES OF NEW ZEALAND’S GOODS EXPORTS, 1857-2018
SOURCE: NZIER 1850 WEBSITE, STATS NEW ZEALAND
NOTE: CHINA INCLUDED IN ‘OTHER’ BEFORE 1988.
16
NZIER. ‘Land-based industries help see New Zealand through tough COVID times’. NZIER Insight, 90-2020.
https://nzier.org.nz/static/media/filer_public/e0/2f/e02f3f0c-a26f-4a0c-8acf-
5737423ef337/nzier_insight_90_land-based_industries.pdf
28H O W M A N Y E G GS , I N HO W M A N Y B AS K E T S ? A N U P D AT E O N N E W Z E A L A N D - C H I N A T R A D E P A T T E R N S
7.2. Export diversification across products
We can also look at changes over time in the diversity of New Zealand’s goods exports across
products and markets.
Figure 27 shows the product concentration index17 for New Zealand exports into key markets and
the World. The higher the concentration index, the more New Zealand’s exports are focused on just
a few products into the market in question.
FIGURE 27 EXPORT PRODUCT CONCENTRATION INDEXES – KEY MARKETS
SOURCE: GLOBAL TRADE ATLAS
Key points from this chart are:
• New Zealand’s overall goods export profile to the World has become more concentrated
over the past 20 years.
• New Zealand’s goods exports to the UK are more concentrated than its exports to China.
• New Zealand’s export product concentration to China dropped sharply over the 1990 to
mid-2000s period as trade thickened. In the early 1990s, New Zealand exported only a
handful of HS4 products valued at over than $10 million, with wool accounting for 45% to
17
The metric is the Herfindahl-Hirschman Product Concentration Index, which provides an indication of the
dispersion of export products. A value of zero shows a country is spreading its exports equally across various
products (i.e. fully diversified); a number closer to one indicates exports are focused on a few products. See
http://wits.worldbank.org/WITS/docs/TradeOutcomes-UserManual.pdf p.24 for more detail. We used HS4 digit
data (1,262 products).
29H O W M A N Y E G GS , I N HO W M A N Y B AS K E T S ? A N U P D AT E O N N E W Z E A L A N D - C H I N A T R A D E P A T T E R N S
60% of New Zealand’s total goods exports. By the mid-2000s, this had risen to around
25.18
• New Zealand’s exports to China became sharply more concentrated from 2008 to 2013.
Around 50% of the growth in New Zealand’s exports to China over this period was in one
HS4 product line: HS0402, ‘Milk and Cream, Concentrated Or Containing Added
Sweetening’ (milk powder). This was partly due to China outsourcing much of its dairy
production following local consumer concerns over melamine, which incentivised New
Zealand production. The FTA also provided additional market access from 2008 onwards.
• Since 2013, our exports to China have become slightly more diversified, largely due to:
o a sharp drop in exports of HS0402 (following the false alarm over botulism-
contaminated milk powder), a $150 million fall in wool exports and a $96 million drop
in sheep and lamb raw skins.
o rapid growth (over $40 million increase) in a range of products over the past 5 years,
including various types of logs, frozen beef, frozen lamb, infant formula, woodpulp,
cream, gold kiwifruit, unsalted butter, rock lobsters, frozen squid, grated cheese, UHT
milk, dairy-based food preparations, cheddar cheese, honey, tripe and Pacific Queen
apples (see Appendix E for the 50 largest growth products).
• In 2019, New Zealand exported 1,904 HS10 products to China, compared to 1,681 in 2010,
589 in 2000 and 115 in 1990.
18
Rising prices will have played a part in this of course. But a similar pattern emerges when looking at the
annual number of products with an export share of over 0.5% or 1%.
30H O W M A N Y E G GS , I N HO W M A N Y B AS K E T S ? A N U P D AT E O N N E W Z E A L A N D - C H I N A T R A D E P A T T E R N S
8. Revealed comparative advantage
New Zealand-China trade patterns can be largely explained by each country’s comparative
advantage.
A country has an RCA in the export of a product when its share of the country’s exports is greater
than the share of World exports of that product relative to total World exports (i.e. RCA > 1). The
larger the RCA, the larger that country’s comparative advantage in global trade.
8.1. Complementary economies
FIGURE 28 NEW ZEALAND AND CHINA’S REVEALED COMPA RATIVE ADVANTAGES, 2018
SOURCE: UNCTAD
31H O W M A N Y E G GS , I N HO W M A N Y B AS K E T S ? A N U P D AT E O N N E W Z E A L A N D - C H I N A T R A D E P A T T E R N S
Figure 28 shows that New Zealand’s RCAs are largely in primary products and their processed
derivatives. 19
China’s RCAs, in contrast, are much more centred on industrial and manufactured goods.20
Thus, it makes sense that New Zealand and China should exchange primary products (New Zealand)
for manufactured goods (China).
8.2. Changes in comparative advantage over time
The charts overleaf show how each country’s RCA has changed between 1995 and 2018. Each grey
dot is a product21 in which China has an RCA greater than 1.
China’s RCA has shifted heavily towards machinery and transport equipment, manufactured goods
and articles and chemicals, as can be seen by the migration of grey dots to the left hand side of the
‘donut’ in Figure 29.
In 1995, China had an RCA in 14 ‘Food and live animals‘ and ‘Beverage and tobacco’ products. This
fell to just 5 by 2018.
In contrast, New Zealand’s RCA has become increasingly primary sector focused (Figure 30). This is
evidenced by the shift to the right of the grey dots between the two years, away from manufactured
goods and towards ‘Food and live animals’, ‘Crude materials’ and Tobacco and beverage’ products.
In short, these charts indicate, in a visual fashion, that New Zealand tends to produce what China
isn’t particularly good at producing, and vice versa, and that this trend has strengthened over the
past 25 years.
19
We have kept the scale the same on both charts to allow a simple comparison. The blue dots in New Zealand’s
chart denote a few products which have much higher RCAs.
20
SITC Rev.3, 3-digit classification. The names of the 259 products and RCAs in the chart are presented in full in
Appendix D.
21
SITC Rev.3, 3-digit classification.
32You can also read