Senegal Value Chain Study-Mango - Commissioned by the Netherlands Enterprise Agency
←
→
Page content transcription
If your browser does not render page correctly, please read the page content below
Senegal Value Chain Study- Mango

Commissioned by the Netherlands Enterprise Agency
Senegal Value Chain Study- Mango
Prepared for:
RVO Netherlands Enterprise Agency

Michiel Arnoldus
Kerry Kyd
Pierre Chapusette
Floris van der Pol
Barry Clausen
Senegal Value Chain Study                                                                                    2

       Preface
       A promising future in agriculture

       Senegal is expanding its food production with great ambition to serve consumers and spur rural
       development. Products of Senegalese farmers find their way to not only domestic customers but
       also to export markets in West Africa and the European Union. Dutch growers realized long ago
       that local circumstances are very favourable for the production of high-quality, nutritious
       agricultural products. The relative proximity to Europe and accessibility of the wider Sahel region
       make Senegal an attractive partner for close cooperation.

       Partly due to climatic conditions, agriculture in Senegal certainly faces challenges, such as water
       scarcity and soil salinity. Dutch modern technology and expertise can support (further)
       improvement of overall performance and sustainability of production, post-harvest handling and
       marketing. It goes without saying that this will benefit Senegalese farmers to produce in a more
       sustainable, and profitable manner. Dutch innovative technologies could improve, for example,
       the use of quality seeds, precision agriculture, storage and packaging.

       This ‘scoping study’ has analyzed those value chains in Senegalese agriculture to which Dutch
       expertise and technology can have the most added value for improved overall performance. In the
       framework of the study, a number of specific business cases have been developed, which could
       enable Senegalese and Dutch partners to cooperate (more) successfully. The overarching objective
       is to build a sustainable partnership between Senegal and the Netherlands around agriculture.
       I thank the consultants of Sense for their good work. For more information on the study or advice,
       please contact our agricultural experts through DAK-LNV@minbuza.nl.

       H.E. Mrs. Joan J.J. Wiegman
       Ambassador of the Kingdom of the Netherlands to Senegal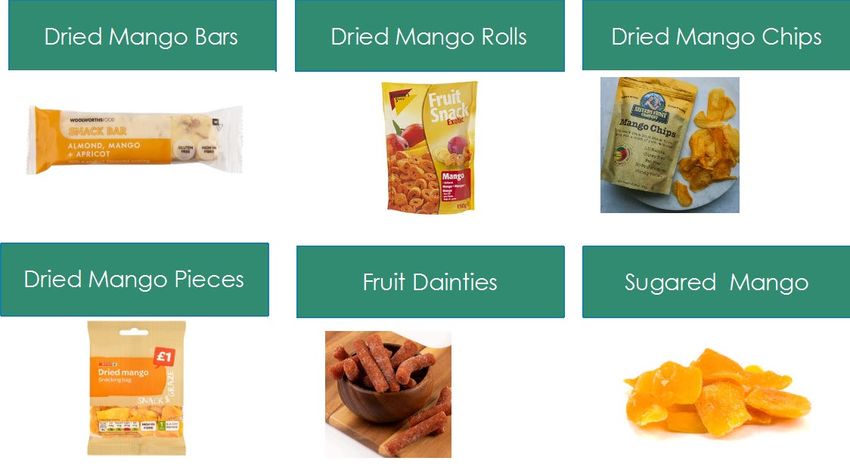
Senegal Value Chain Study                                                                                                                                                                3

       Table of Contents

       1       EXECUTIVE SUMMARY ....................................................................................................................................... 5
       2       BACKGROUND AND METHOD ............................................................................................................................ 6
       3       THE MARKET ..................................................................................................................................................... 6
           3.1          THE FRESH FRUIT MARKET IN THE EU ....................................................................................................................... 6
              3.1.1        Overview ..................................................................................................................................................... 6
              3.1.2        Product Market Segments .......................................................................................................................... 7
              3.1.3        Main Markets Within the EU ...................................................................................................................... 8
              3.1.4        Supplying Markets and Seasonality ............................................................................................................ 9
              3.1.5        Varieties .................................................................................................................................................... 11
           3.2          SENEGALESE FRESH MANGO EXPORTS .................................................................................................................... 11
           3.3          LOCAL MARKET – CENTRE & NIAYES ...................................................................................................................... 12
           3.4          LOCAL MARKET – CASAMANCE ............................................................................................................................. 12
           3.5          REGIONAL MARKET ............................................................................................................................................. 13
           3.6          MARKET FOR PROCESSED PRODUCTS ...................................................................................................................... 13
              3.6.1        Local Market For Juice .............................................................................................................................. 13
              3.6.2        Puree for Juice and other Applications(EU&US) ........................................................................................ 14
              3.6.3        Frozen Fruit ............................................................................................................................................... 16
              3.6.4        Dried Fruit ................................................................................................................................................. 16
       4       THE STRUCTURE OF THE VALUE CHAIN ............................................................................................................ 20
           4.1      OVERVIEW ........................................................................................................................................................ 20
           4.2      PRODUCTION LOCATIONS ..................................................................................................................................... 21
              4.2.1    Mango Quality .......................................................................................................................................... 21
           4.3      LARGE PLANTATIONS IN CENTRE AND NIAYES ........................................................................................................... 22
           4.4      SMALL PRODUCERS IN CENTRE NIAYES.................................................................................................................... 23
           4.5      CASAMANCE ...................................................................................................................................................... 24
           4.6      MANGO PRODUCTION SEASON ............................................................................................................................. 26
           4.7      PROCESSING ...................................................................................................................................................... 27
              4.7.1    Mango Puree and Juice ............................................................................................................................. 27
              4.7.2    Other Processing ....................................................................................................................................... 28
           4.8      PRICING IN THE VALUE CHAIN ............................................................................................................................... 28
           4.9      ACTORS IN THE VALUE CHAIN................................................................................................................................ 29
              4.9.1    Direct Actors.............................................................................................................................................. 29
              4.9.2    Indirect Actors ........................................................................................................................................... 29
              4.9.3    Professional Organisations ....................................................................................................................... 29
              4.9.4    Banks and Microfinance Organisations .................................................................................................... 30
              4.9.5    Input Supplier Financing............................................................................................................................ 30
              4.9.6    Agricultural Insurance in Senegal ............................................................................................................. 30
              4.9.7    The Knowledge Sector ............................................................................................................................... 30
              4.9.8    Research and Development & Professional Skills development................................................................ 30
              4.9.9    Extension Services ..................................................................................................................................... 31
              4.9.10      Finance (Agricultural Knowledge Sector) ............................................................................................. 32
       5       ISSUES AND OPPORTUNITIES ........................................................................................................................... 32
           5.1          SPACE TO EXPAND FRESH EXPORTS TO THE EU .......................................................................................................... 32
           5.2          LOW PRODUCTIVITY OF ORCHARDS AND UNSUSTAINABLE WATER SOURCES .................................................................. 33
           5.3          LACK OF A COMPETITIVE PROCESSING SECTOR ......................................................................................................... 34
           5.4          CHALLENGING ROADMAP FOR FRESH EXPORTS FROM THE CASAMANCE ......................................................................... 35
           5.5          PROCESSING IN CASAMANCE ................................................................................................................................. 35
           5.6          GENETIC MATERIAL & NURSERIES.......................................................................................................................... 36
           5.7          LONG EARN BACK-PERIOD FOR INVESTMENTS .......................................................................................................... 36
           5.8          DIVERSIFICATION: OPPORTUNITY AND NEED ............................................................................................................ 36
           5.9          ORCHARD MAINTENANCE SERVICES ....................................................................................................................... 37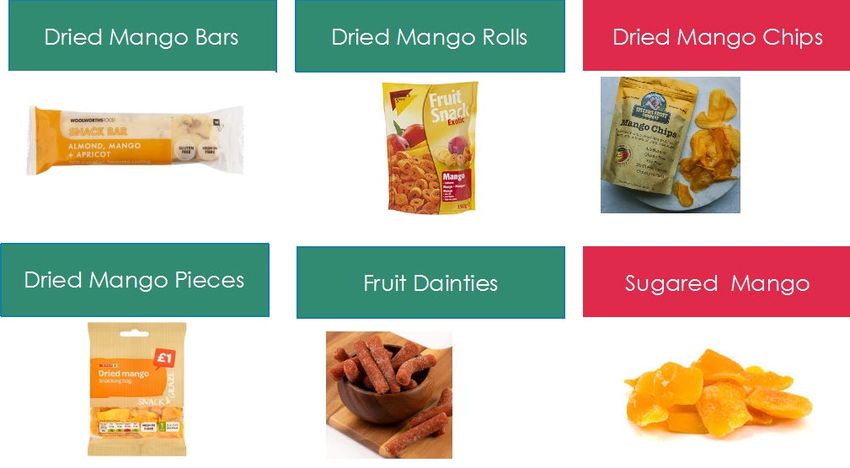
Senegal Value Chain Study                                                                                                                                                            4

           5.10     SOLAR IRRIGATION .............................................................................................................................................. 37
       6     ENVIRONMENTAL SUSTAINABILITY (CIRCULAR ECONOMY) ............................................................................. 37
           6.1      WATER USAGE ................................................................................................................................................... 37
           6.2      PESTICIDE USAGE ............................................................................................................................................... 37
           6.3      ENERGY USAGE .................................................................................................................................................. 38
       7     SOCIO-ECONOMIC DEVELOPMENT (FOOD SECURITY, EMPLOYMENT, WOMEN AND YOUTH).......................... 38
           7.1      LIVELIHOODS ..................................................................................................................................................... 38
           7.2      FOOD SECURITY .................................................................................................................................................. 39
           7.3      INCLUSIVE DEVELOPMENT .................................................................................................................................... 39
       8     OPTIONS FOR INTERVENTION .......................................................................................................................... 40
           8.1      SWOT ANALYSIS................................................................................................................................................ 40
           8.2      BOTTLENECKS & INTERVENTIONS ........................................................................................................................... 40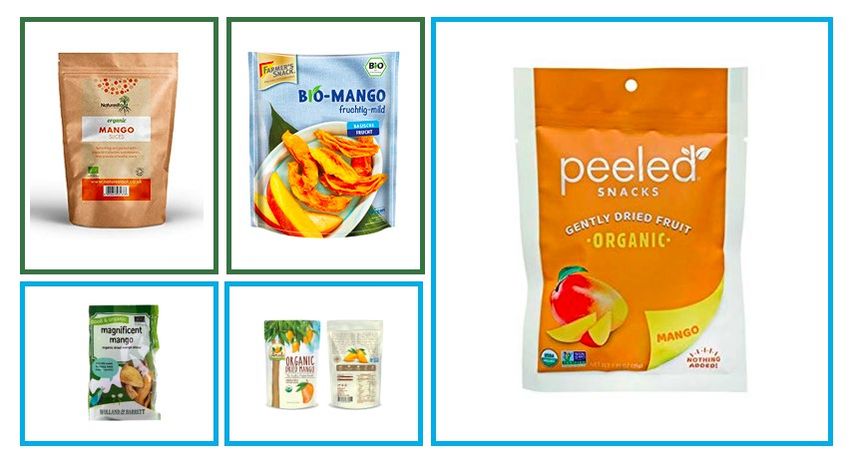
Senegal Value Chain Study                                                                                  5

       1 Executive Summary
       Globally, the demand for mangoes and mango products has been increasing. Fresh mangoes are
       now available year round in Europe, with mango juice quickly becoming a key flavour in juice,
       dairy drinks, ice-creams, smoothies and assorted snacks.

       South American producers dominate the overall volumes being imported by the EU. Much of the
       fresh fruit and juices enter via the Netherlands, before being redistributed across the region.
       Senegal, in contrast is a far smaller exporter, but it has become an important supplier of export
       grade mango to the EU in the EU summer months. At this moment in the supply calendar the
       traditional suppliers Brazil and Peru are not producing, which creates a production window with
       immense potential.

       Within Senegal, the Centre- and Niayes region has emerged as the leading production zone for
       export grade mangoes in Senegal. It’s a fairly organised sector, with professional exporters, who
       are close to the harbour and who enjoy drier conditions that allow for lower phytosanitary
       pressure. Production has been growing, but there are still opportunities to expand the production
       of export grade mango. This could be driven both by increasing the land under cultivation and the
       overall yields. While current yields are good when held up against the historic benchmark,
       Senegalese producers are increasingly lagging behind some of the more advanced counterparts in
       South Africa. Key to closing this yield gap will be developing knowledge and new techniques
       around pruning, orchard planning and the application of fertilisers.

       An expanding fresh fruit sector comes with in-built challenges around sustainability. Larger areas
       will need irrigation, more pesticides will be applied and finally more fruit will need to be
       accommodated in cold storage. Managing waste will also become critical. Efficient fruit production
       sectors include mechanisms to secure maximum value for each grade of fruit. So, as fresh export
       production expands, productive commercial uses of the second and third grade fruit will need to
       be found. This includes a potential expansion of processing, which is in its infancy in Senegal.

       This processing opportunity is very relevant to the Casamance. In reality this area produces more
       mango than the Centre and the Niayes. But the fragmented system of production; the challenges
       around fruit collection; the distance and complexity of getting fruit to port and a humid climate
       prone to fruit fly all make processing a far more feasible and appropriate idea for development.

       Achieving these ambitions requires a better understanding of the processing opportunity in the
       Casamance. The varieties have been mapped, but more work will need to be done on
       understanding the market and opportunities to attract investment. From the perspective of export
       fruit production in -Centre and the Niayes, more will need to be done to counteract -and slow-
       salinisation caused by heavy irrigation and fertiliser use. The expansion of industrial production in
       the Centre and the Niayes raises a fundamental systemic question about the management of
       water resources in a water-poor area that relies on groundwater for irrigation. In the longer term,
       to ensure sustainable expansion of agriculture more will need to be done to enhance the land and
       water resource planning systems.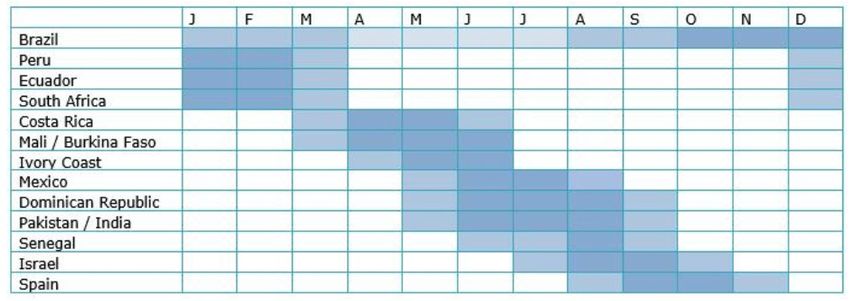
Senegal Value Chain Study                                                                                   6

       2 Background and Method
       The aim of this study is to provide insights into the Senegalese Mango value chain and to define
       critical interventions that are needed for the sector to flourish. These insights will be used to
       provide guidance to development and knowledge partners as they work in these intervention
       areas. Finally, these will be used by the private sector, who at a later stage might be encouraged
       to trade and deliver much needed equipment, inputs and expertise. Ultimately it is hoped that
       these interventions will play a useful part in fueling an improvement in the livelihoods and food
       security of the Senegalese people, while improving the lot of women and youth and the
       environment.

       More specifically the study aims to (i) describe the market, production and enabling environment
       in the mango value chain in Senegal (ii) reveal the key issues, opportunities and bottlenecks in the
       value chain (iii) propose specific interventions that can help to address these bottlenecks & allow
       for the value chain to have greater impact (iv) identify areas where inclusive participation of
       women and youth in the economy can be stimulated (v) highlight opportunities for improved
       circular economy practices (vi) recommend areas where public, private and the knowledge sectors
       can make valuable, if not unique, contribution to these interventions

       This study is to a large extent supported by knowledge obtained through a series of projects in the
       Senegalese Mango sector, and interviews with key stakeholders. The past projects included (1) the
       development of a supply chain strategy for a mango juice plant in 2017, for which all professional
       orchards in Centre Niayes and exporters were visited and interviewed, as well as a selection of
       farmers in Casamance. (2) analysis of the market for processed mango products in the EU, US and
       Gulf States and the perspective of Senegalese processing companies in 2018. (3) Benchmark study
       for mango cost of production in Senegal, Ivory Coast, Ghana and South Africa for HortiFresh/ GIZ,
       for which detailed cost of production analysis was done for large scale plantations and small scale
       plantations in Senegal, and finally advice regarding export promotion project for the sector to IFC
       (2019). We interviewed several key stakeholders to assess recent changes in the industry.

       We must highlight that this research was carried out during the COVID 19 period, but after local
       constraints on travel were lifted. This has both advantages and disadvantages. A large number of
       interviews could be conducted telephonically, which made including a variety of perspectives and
       experiences from Senegal and the Netherlands far more possible. In some instances, the new
       “work from home” norm made interviewees more available.

       3 The Market
       3.1 The Fresh Fruit Market in the EU

       3.1.1 Overview
       The volume and value of mango exports to the EU have been increasing steadily over the past
       decades, though export prices have been decreasing. Figure 1 provides an overview of the import
       volumes (source: CBI). This shows that the value increase is largely driven by large volume
       increases. Western Europe is still responsible for the bulk of consumption, with mango still being
       relatively new and expensive for Eastern Europe.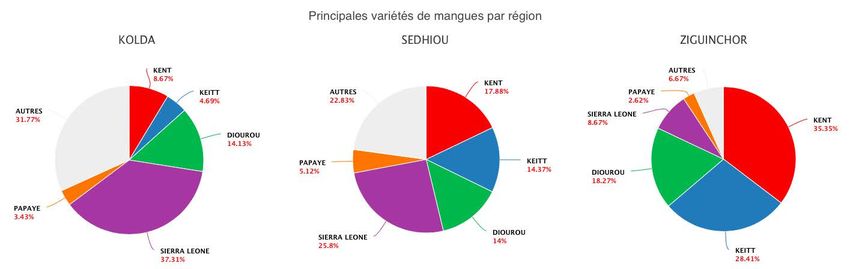
Senegal Value Chain Study                                                                                  7

       Figure 1: EU imports of fresh mango by volume and value from 2014 to 2018 (Source: CBI)

       The biggest development over the past decade has been the growth of the ready-to-eat mangoes
       segment. They are ripened in controlled ripening rooms close to or in the final market so that they
       can be consumed within on or within a few days of purchase. These mangoes are sold at higher
       prices. The growth of the ready-to-eat market has had important consequences for suppliers,
       because for the importers require mango within one container to be uniform in the stage of
       ripeness. This is more difficult to achieve if you source from small farmers.

       3.1.2 Product Market Segments
       Within the market one can distinguish 4 clear segments. The top segment consists of exotic
       varieties that are ‘tree ripened’ and air freighted to the EU. Tree ripened means they are
       harvested closer to maturity and thus have more flavour. Where ripe mango has a sugar content
       of 14-18 brix, mango destined for export tends to get harvested at 6brix so that it can last 20 to 30
       days in transport and distribution. Though the mango does ripen, it never comes close to the
       flavour of a mango harvested closer to maturity. The high segment consists of so called ‘tree
       ripened mangoes’, and fresh cut mango salads and organic mango. The normal segment are
       conventional mangoes of common varieties with the right appearance (minimum 40% red
       coloration, not noticeable skin blemishes etc.). Finally, the low segment consists of “off-sizes”
       (often too big) with external blemishes, and or limited shelf life because they are already too ripe.
       They are often sold to open-air markets where they are resold at discounted prices. They are also
       used by local processors of fresh cut fruit salads.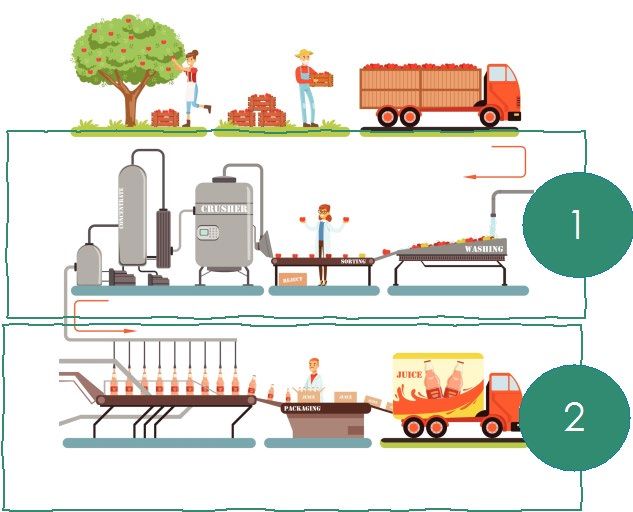
Senegal Value Chain Study                                                                                      8

       Figure 2: Segments in the EU mango market

       3.1.3 Main Markets Within the EU
       The Netherlands is by far the biggest importer in the EU and is central to the redistribution of
       mangoes around Europe. In 2019 the Netherlands imported just over 250 000 tons of mangoes,
       then re-exported 220 000 tons of that mango across the European region. With a consumption of
       30,000 tons the Netherlands is per capita also one of the biggest consumers.

       The UK is the second-largest importer of mangoes in Europe with over 86,000 tonnes of imports in
       2018 but import volumes have been stabilising over the past three years. The stabilisation is a
       result of a maturing market and the devaluation of the British pound. The UK is a large consumer
       of air-freighted specialty mango from India and Pakistan. Brexit may put purchasing power further
       under pressure thereby reducing imports. It may also force UK importers to source directly from
       other countries. Finally, it is likely to force Irish importers to shift their supply from the UK to other
       EU countries.

       With 66,900 tonnes of imported mangoes and limited exports in 2018, France is the third biggest
       consumer of mango. Mango is a popular fruit in France, but the general preference of consumers
       for local products will always compete with the import of mangoes. France has been a traditional
       buyer of West African mango due to the language and cultural links. For example, Ivory Coast
       exported 10,600 tonnes to France, which is more than mango giant Brazil.

       Germany is the largest destination market for mango, with a consumption of 89,000 tonnes in
       2018, up 55% from five years before and still growing. Germany is mostly supplied from the
       Netherlands.

       Spain is the only country in Europe that produces mango. According to FreshPlaza it produced
       34,000 tons, in 2018 up 30% from the year before in 2018. Local production based on the Osteen
       variety has increased local consumption. Spain is also becoming a trade-hub for mango with both
       imports from developing countries and exports to other EU countries increasing with 72% over the
       past five years. Most Spanish mangoes go to Portugal (24,400 tons) and France (16,000 tons).
       Spain can thus be an interesting destination to enter the Southern European market. Portugal is
       actually per capita the highest consumer of mango in the EU.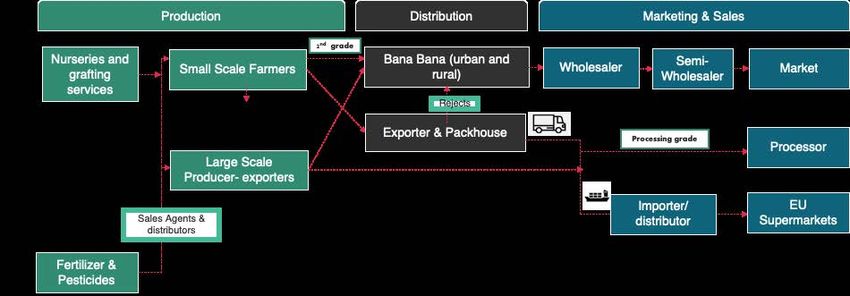
Senegal Value Chain Study                                                                                    9

       Figure 3: Imports and re-exports in the EU in thousands of ton, 2018

       Finally, Belgium is also increasingly a distribution hub for both air freighted and boat freighted
       mango, particularly for West African mango. Antwerp is an easy port to use for Dutch traders, and
       one of the major shipping routes from West Africa lands in Antwerp. Furthermore, it has a
       reputation for being far less strict on phytosanitary controls than the Netherlands. Many West
       African exporters who traditionally have issues with fruit fly control prefer to use Antwerp. Finally,
       SN Brussels airlines offered attractive rates on air freight and a very efficient handling at the
       airport. It is said that it’s faster and cheaper to clear mangoes in Antwerp and truck them to Paris
       than to land them in Paris directly.

       3.1.4 Supplying Markets and Seasonality

       Most of the EU mango imports originated in Brazil and Peru. Collectively these countries supplied
       almost half of all fresh mangoes to the region in 2019. In contrast Senegal supplied a tenth of the
       mangoes that came from Peru. Figure 4 provides an overview of the main suppliers. Figure 5
       provides an overview of the supply per season. Other regional suppliers to the EU are Mali and
       Burkina Faso, but their exports remain limited to about 9000 tons each. Their main challenge are
       the high transit time and logistical cost because they are landlocked. This doubles their transport
       cost compared to for example Ivory Coast which operates in the same time window.
Senegal Value Chain Study 10
Figure 4 EU Fresh Mango Exporters to the EU by Volume in thousands of tons from 2014 -2018 (Source: CBI.EU)
Seasonality plays a large role in the supply of mango. For the first quarter of the year South
American producers Peru, Brazil and the Dominican Republic market their mangoes. From March
producers in the Ivory Coast supply. By the middle of the year volumes from these mega-mango
producers fall sharply. Senegal and Israel contribute only a portion of the volumes imported at the
peak in February and March. Then from October the South American producers begin to market
their mangoes & the cycle start again. 1
Part of the success of Brazil is that it is able to supply Mango all year round due to the large variety
of tropical and sub-tropical climates in the country. Peru has been able to increase the length of
their production season each year through a smart mix of varieties and techniques to speed-up or
delay harvests. The Ivory Coast is the third biggest supplier, but exports only 5 weeks of the year.
Figure 5 provides an overview of the production season in a number of producing countries.
Though South Africa is mentioned, they no longer export meaningful volumes to the EU, because
they have more lucrative markets in the Middle East and locally. Mexico and Ecuador are more
oriented versus the US markets. India and Pakistan are too far for transport by boat; they only play
in the premium exotic air freight segment.
Figure 6 provides an overview of the supply throughout the year of major players. Within this
graph, Ghana is an odd one because its numbers are mostly based on fresh cut mango fruit salads
prepared with local mangoes as well as mangoes imported from Ivory Coast, Senegal, South Africa,
Burkina Faso and other countries. Fresh export in whole fruits from Ghana is less than 1000 tons.
1
These combined volumes represent 80% of EU imports throughout the yearSenegal Value Chain Study 11
Figure 5 Overview of the Global Mango Season
Figure 6 EU Sourcing Origins (lead markets, 2019, ITC Trade Map))
3.1.5 Varieties
The main mango varieties on the EU fresh market are Kent and Keitt. Tommy Atkins, once the
dominant variety, is in decline because it is more fibrous. Osteen is gaining popularity as it is
appreciated by consumers. It is the only variety produced in Spain and is increasingly being
planted in other countries as a replacement for Tommy Atkins, since both are early season
varieties. Palmer from Brazil is also common.
3.2 Senegalese Fresh Mango Exports
Buoyed by growing demand in Europe, exports from Senegal have been growing. In 2019 more
than 14 000 tons of fresh mango left Senegal, largely for the EU. This was an almost doubling of
volumes in a 5-year period. The vast majority of these mangoes were imported by the
Netherlands, followed by Spain and France and a number of European countries.
The only real exception is a significant volume (11%) imported by Blue Skies in Ghana for fresh cut
mango salads. They use Senegalese mango when the Ghanaian season has ended in order toSenegal Value Chain Study 12
provide a year-round supply. The fruit salads are packaged directly in consumer packaging and
flown out to the EU. However, due to Covid19 this business has taken a massive hit in 2020
because of the absence of passenger flights between Africa and the EU.
Figure 7 Senegalese Export Volumes and destinations (ITC Trade Map)
3.3 Local Market – Centre & Niayes
The local fresh market is mostly limited to informal traders who collect truck loads for the local
fresh market. This is mostly to the open markets and small retailers, but even larger retailers tend
to be supplied by small traders. The traders pay premium prices by West African standards, and
this makes the mango too expensive for processing. There is one formal distributor with its own
points of sale in the form of tents and small shops, Senfresh. This local fresh market is supplied
from the Centre Niayes orchards, as well as Casamance and Mali. Opportunities are in better
quality mango supplied over a longer season in more formal retail.
There are currently no professional processing factories that absorb meaningful volumes of mango
and thus offer a good market for farmers. Though there are a few processors in dried fruit and
juice that have tried, they did not reach the necessary scale to reach impact on the sector.
Processing has remained at an artisanal level.
As the mango produced in Senegal is often organic by default, they are able to provide this to the
market. In the 2020 season producers were able to achieve a 15% price premium over the
conventional price. However, lower global supply means that this is in demand and is a useful
product to build relationships with new importers.
3.4 Local Market – Casamance
The market available to the producers from Casamance used to be mostly limited to the local
surroundings. There were traders sourcing for the Dakar fresh market and even for the Agrofruits
juice plant when it was operational. However, the transport was complex and expensive. It
involved crossing the border with the Gambia twice and crossing the river by boat. Often differentSenegal Value Chain Study 13
traders were responsible for segments of the route, leading to lots of loading and reloading and
adding cost as everyone adds their margin. The cost of
gathering in remote orchards, loading trucks, crossing borders and rivers, transport cost and
roadblocks can easily triple or quadruple the cost of mango when it arrives in Dakar.
Since the opening of the Senegambia bridge in January 2019 the transport has become much
easier and cheaper, improving market access for the Casamance. However, COVID19 has shown
the risk of needing to cross borders to reach the Dakar market, as the bridge has been closed so
far this year. Hence, it still makes sense to develop the port and transport by sea, in order to have
an alternative and also introduce competition to road freight.
3.5 Regional Market
A small portion of Senegalese exports in 2019 went to Ghana (1784 tons) and the Ivory Coast (220
tons). The former presumably for the fresh cut fruit export to the EU and for dried fruit
production, which is significantly larger in those countries than in Senegal.
There are also smaller volumes of mango transported from by road from Mali to Dakar. The
season in Mali starts much earlier, and the farm gate price of mango is about 10% to 25% of the
farm gate price in Senegal. However, the cost of getting this Mango to Dakar are high, as it needs
to be moved from orchards with small trucks or tricycles before being packaged in boxes and
loaded on large trucks. Sometimes mango is transported in bulk with large losses of fruit due to
the rough roads. Fees for transport are high despite the fact that many trucks return empty to
Dakar. Part of this is due to cost linked to about 13 roadblocks between Bamako and Dakar.
Figure 8 Typical Successful Juice Production Models
3.6 Market for Processed Products
3.6.1 Local Market For Juice
Juice production typically consists of 2 separate
business models:
1. A juicing plant, which produces large
volumes of a few fruits to be found in
abundance around the plant in bulk
packaging (210 liter drums). The minimum
economic scale is 5 tons of fresh fruit per
hour, which needs to run 24/7 for about 3
to 4 months to be profitable, and the
typical investment is about 2,5 to 3 million
USD.
2. A juice bottler, which purchases a large range of more than 10
different juices and concentrates and blends and bottles juice, and
markets this to consumers via a dense network of distributors and
wholesalers. A modern Tetra Pak plant is an investment of at least 4
million USD.
However, in Africa most juice companies try to juice and bottle at the Figure 9 Local Juice Brand From Kiréne
same time. This means they have a limited product range of expensive
products in a packaging with limited shelf life. This is a major barrier toSenegal Value Chain Study 14
being able to market juice products widely. They tend to remain very small niche players,
incapable of absorbing meaningful volumes of fruit and competing with mainstream drinks such as
coca cola.
Dakar and surroundings does provide a growing market for juice, which is served by imports and
Kirène, a local bottler of soft drinks, juices and mineral water. They bottle large volumes in
modern packaging lines under their own brand, Pressea. Their demand for mango puree is
between 1000 and 1500 tons per annum, which is currently met by using their own stock
produced 2 years ago. This volume is not sufficient to run a mango pulping plant, but Kiren failed
to find sufficient export markets for its mango puree during the three years it operated.
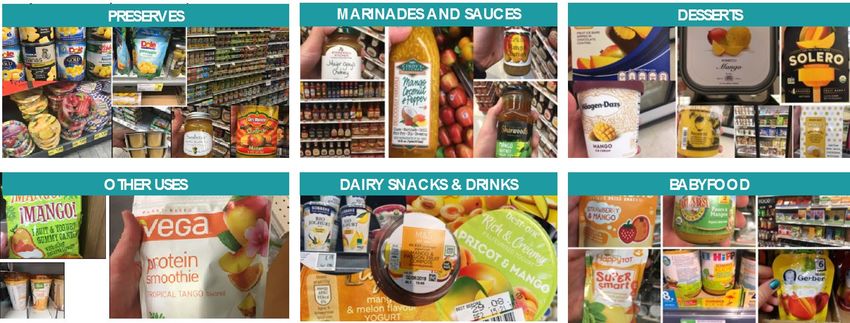
3.6.2 Puree for Juice and other Applications(EU&US)
Mango pulp or puree as it is often called is used as an ingredient in food processing. Its biggest use
is as a juice ingredient, but it is also used in marinades and sauces, desserts, dairy products and
drinks, smoothies, marmalades & jams and baby foods.
Figure 10 Assorted Uses for Mango Concentrate
The standard for mango puree is 14-18 brix (sugar content), aseptic and packaged in an aseptic
bag in 210 litre metal drums. Aseptic means the product is sterilised using steam and it can be
stored at room temperature. A small percentage of the market is frozen puree, and this is mainly
destined for use in dairy products. Dairy products need to be pasteurised at the end and using
aseptic mango would mean the mango is heated twice which would reduce flavour and change
the colour.
We estimate the current EU market for Mango puree at 42,000 tons per year (single strength
equivalent), and slightly larger in the US. The biggest consumers of mango juice are in Western
Europe and Southern Europe. In Eastern Europe it is less popular due to the price. There is still
space for new suppliers on the market, but competition is fierce. You need to be able to matchSenegal Value Chain Study 15
existing suppliers on value for money. There is a strong demand for organic mango of which there
is a shortage. It’s difficult to farm Mango organically at a professional level.
The demand for mango puree is still mostly driven by the juice market, which is actually in decline
as a whole in the EU and US. However tropical flavours such as Mango, and “not from
concentrate” (NFC) juice are growing segments within this declining juice market. Fortunately,
pulped mango, also referred to as single strength puree, functions as a concentrate but qualifies
as NFC because there has not been any evaporation of water. In fact, to make mango juice, water
needs to be added because the puree is too thick to drink. Most mango juices sold in the EU and
US are blends with other cheaper fruits (e.g., apple, grape, pear, orange) and only a small
percentage of mango (5% to 20%).
The juice value chain is dominated by importers and so-called compound houses who source,
import, blend, standardise and market juice to juice bottlers. For example, they will blend various
origins of mango juice to standardise the flavour throughout the year. Or they create multi fruit
blends. Bottlers in turn purchase concentrates and NFC juices, blend and bottle. Importers and
compound houses source concentrates and juices from juicing plants around the world,
sometimes with assistance of agents, but their role is decreasing. Increasingly importers are also
investing in their own plants or in strategic relationships with specific production plants in the land
of origin.
The juice game is a blending game, where the goal is to reach the most flavour with the most
interesting consumer story at the lowest price per litre. Some varieties like Alphonso are more
expensive ($1400/ ton normally, but between $1100 and $1600 depending on the season)
because they provide more flavour, and thus can be used in lower concentrations in the blend
compared to a cheaper Kent or Totapuri ($550 to $750 depending on the season, but usually
around $600 to $650 CNF Rotterdam). Other varieties can deliver an interesting flavour profile and
fit somewhere in between in terms of price, e.g., the Magdalena from Colombia, Chato de Ica from
Peru or Amélie from Mali and Burkina Faso. The organic premium is around $100 to $150 per ton.
The upper end of this range is typically achieved by the more valuable varieties such as Alfonso.
Major suppliers into this market are India, Mexico, Brazil, Thailand, Peru and Colombia. Mali
currently has two factories for export and Burkina Faso one, but volumes are very small compared
to the size of the market. South Africa also exports smaller volumes of Kent, Keitt and Tommy
Atkins puree.
Kent and Keitt mango which are dominant varieties in Centre and Niayes are accepted on the
market. But, for now does seem to compete directly with the cheaper Totapuri from India and
Tommy Atkins from Mexico because Kent and Keitt don’t have a particularly strong and specific
flavour. We feel they should be able to fetch slightly higher prices because the colour is intense,
and the sugar content is higher than other suppliers (18 brix compared to 14-16 brix from other
suppliers). However, this has not yet been proven, and Kiréne was struggling to sell its puree at
higher prices compared to Indian Totapuri. It may well take some time to build a reputation for
this puree that allows it to capture this price premium. Proximity to the market would be a plus,
particularly for NFC transport cost.Senegal Value Chain Study 16
Non-exportable varieties from Casamance could produce interesting flavours but needs to be
tested. Over the past decade Amélie from Mali and Burkina Faso has gained a reputation for
supplying good juice that fetches premium prices. Amélie is a variety that is difficult to export
fresh but is successfully dried and juiced. More premium varieties could obtain between $800 and
$1600 per ton. However, at the start a lower price may be needed to get a foothold in the market.
Assessing the potential sales price for the varieties in Casamance will require close cooperation
with major importers.
3.6.3 Frozen Fruit
The market for frozen mango pieces (IQF mango) is still growing, and again non-exportable
varieties could potentially be used. Once again organic is an interesting niche and route to market
for new unproven producers. Frozen mango pieces have two main end-uses:
• As ingredients for the food industry, particularly for more luxury products where the
impression needs to be given to consumers that real pieces of fruit have been used. For
example, for yoghurts, ice-creams, smoothies, cakes, baby food etc. This industry mainly
used 1cm cubes that in many cases are processed by adding sugar, boiling etc. This is a
price sensitive segment where depending on the usage different buying criteria exist. For
some applications firmer lighter coloured cubes are preferred, such as Ivorio from China.
For other applications a more colourful Kent or Keitt from Peru is preferred.
• As ingredient of fruit salads. Fruit salads made in restaurants and hotels often contain
frozen fruit. In addition, the EU based producers of fresh cut fruit salads sold in
supermarkets and convenience stores often switch between frozen fruit and fresh fruit
depending on what is cheaper at the moment. This market mainly uses hand-cut chunks.
Peru is a big player in this market.
In addition, a small portion of frozen mango is bought by consumers for home usage. The make
smoothies or use these as toppings for yoghurt, desserts etc.
We estimate the total sales of frozen Mango in the EU market at 20,000 tons per year, and 45,000
tons in the US markets. The main competitors are Peru, Mexico, China and India, followed by new
market entrants Thailand and Vietnam. The average market price fluctuates between $900 per ton
for Ivory from China and Totapuri from India to $1400 to $1600 for Kent from Peru and $2000 for
Alphonso. Within the EU the largest importers can be found in The Netherlands and Belgium.
Like mango pulping plants, frozen plants require a large investment of around 3 million USD.
Typically, one needs multiple products to make a plant work. The fastest growing product category
in frozen foods and vegetables are berries, such as blue berries, black berries, raspberries and
strawberries. Morocco is a producer of frozen strawberries. Frozen beans and carrots and broccoli
florets also have a stable demand.
3.6.4 Dried Fruit
Dried mango is sold as a healthy snack in the EU and US markets. It is also consumed a lot by
children, particularly in lunch boxes at school. Second grade and offcuts are used in small
quantities in breakfast cereals. We estimate the market to be around 9000 to 10,000 tons in the
EU and 9000 to 13,000 tons in the US. This seems a small amount, but one has to keep in mind
that depending on the efficiency of the producer and the variety used, between 10 and 17kg of
fresh mango is needed for 1kg of dried mango. Once you add in the labour cost and energy cost itSenegal Value Chain Study 17
becomes a high value product, priced at about €7500 per ton CNF Rotterdam or $7500 / ton
landed in a warehouse in the US.
Dried mango has been the star of the dried fruit market, traditionally dominated by
Mediterranean fruits such as raisins, dates, apricots, peaches, prunes and plums. Growth has been
high over the past decades. There is still space for further growth in most of Europe with the
exception of the UK, Germany and Switzerland where the market is more developed and better
supplied.
There are actually six different types of dried mango product:
Figure 11 Assorted Dried Mango Products
1. Candied or sugared mango produced by placing mango in a sugar solution that draws out
the moisture. This product group is still dominated by the Philippines but it’s losing
relevance overall as consumers increasingly prefer products with no added sugar. One
needs access to cheap sugar to be competitive in this segment
2. Dried mango, usually in the form of strips, produced by air drying mango pieces in a special
dryer with large fans and electric heaters, gas burners or hot water systems powered by
coal, biogas or biomass. This is now the most popular category having shown solid growth.
Traditionally dominated by South Africa and Mexico, but with Burkina Faso emerging as a
new market leader in the EU.
3. Freeze dried mango, providing a very crisp product with a unique taste sensation is still a
very small product group, mainly supplied from China. The production technology is
complex and difficult to manage.
4. Dried mango rolls were developed in South Africa as a way to recover waste from overripe
mangos and flesh still on the pip. The product has potential to grow but is difficult to
manufacture.Senegal Value Chain Study 18
5. Dried fruit dainties are made by extruding second and industrial grade dried mango. This
product can easily be blended with other types of fruit and delivers a soft product with
intense flavour. There is a lot of potential to grow this category in the EU.
6. Dried Mango bars are blends of mango and other fruits with cereals. They can be made
using industrial grade dried mango, or with a mango pulp.
For Senegal like the rest of West Africa, dried mango (number 2) offers the best opportunities
because it is a growing market where the dominant variety Kent does well. Dried fruit dainties and
mango rolls would be important to utilise the expensive mangos properly and so make dried
mango production competitive.
For dried fruit production the variety of mango is important. You need a fibreless variety that
provides larger mangos (for processing efficiency), has a bright dark yellow or light orange colour
when dried, and has sweetness as well as acidity. Some experiences with varieties include:
• Kent and Keitt (South Africa, Ghana, Ivory Coast) are best suited, because they are fibreless
and generate great colour and flavour. They are also large mangos allowing for 12 to 14 kg
of fresh mango for 1kg of dried mango.
• Brooks from Burkina Faso and Mali provides perhaps the best flavour, but the mangoes are
smaller and suffer from fruit fly because it is a late variety.
• Amélie is more fibrous and acidic in flavour, which is actually preferred by about 30% of
consumers. Unfortunately, many importers don’t like it and think the consumers will not
like it. It has been challenging to sell this variety, if it isn’t organic.
• Palmer has been tried in Ghana but was not deemed suitable.
• Lippens has been tried in Burkina Faso but misses the acidity to give depth of flavour in the
final product.
• There is no experience with Osteen, which has been planted recently as an early variety in
Niayes.
Organic makes it easier to sell unknown varieties that are less attractive in flavour and
appearance, because there simply is less choice for importers. This is increasingly in demand.
Figure 12 Assorted Organic Dried Mango Packs from the EU
A third distinguishing factor in the dried mango is the difference between conventional,
unpreserved and organic mango. Conventional dried mango is usually preserved with sulphur,Senegal Value Chain Study 19
which helps it to keep its bright yellow-orange colour but also prevents it from drying out.
Unpreserved is conventionally farmed mango, but without sulphur added, while organic products
is organically farmed unpreserved mango. The challenge is that many consumers want a beautiful
product but not the sulphur.
The value chain is relatively simple. Most dried mango is produced in larger factories, that source
mango from surrounding plantations. The product is sold to specialised importer-packers who
either sell the product in stores and supermarkets under their own brand, or under the retailer
brand. There are also a few exporters in Burkina Faso who source dried mango from many smaller
factories who are not capable of direct export. In most countries there are larger producers who
also source form other smaller producers and thus also act as an exporter- middleman. Most
equipment for processing, including the specialised dryers come from South Africa, which has 3
manufacturers.
Dried mango is normally packaged in plastic bags of 2.5 kg, in cardboard boxes of 10kg, 22 tons
per 40-foot container. Most retail packing is done by the importer, who sometimes uses a contract
packer. This is to save on transport cost and being able to change pack sizes and designs on short
notice.
The main suppliers to the market are:
• South Africa, the traditional market leader in the EU on conventional dried mango.
Production has stagnated due to a lack of mango for processing, and South Africa has lost a
lot of market share. Many South African companies are now involved in producing in West
Africa.
• Philippines is the traditional market leader in candied mango.
• Mexico is the market leader for the North American market and is slowly trying to get into
the EU market.
• Burkina Faso has become the market leader in the EU for both conventional and organic.
Exports have increased from 150 tons in 2009 to 3500 tons in 2019 on the back of South
African investors.
• Mali has remained a very small player in the sector, still exporting via Burkina Faso. The
challenge has been a lack of good management of factories.
• Ghana has been a stable force in the market over the past decade with two large and
professional factories producing about 1400 tons. The high prices of mango compared to
neighbouring countries make it difficult for other producers to survive and existing ones to
grow in Ghana.
• Ivory Coast is an upcoming player, with investments from South Africa and Ghana but still
small.
• Ecuador, Kenya and Mozambique all produce very modest volumes sold in the EU.
They mostly use second and third grade mango.Senegal Value Chain Study 20
Figure 13 Types of Dried Mango Products and their market potential (green=high potential)
4 The Structure of the Value Chain
4.1 Overview
The value chain is relatively simple, with large scale producers exporting most of their fruit
themselves to the EU importer. Small scale producers do this via an exporter. Second grade is sold
to local traders, farmgate and at the packhouse (the sorting rejects). A very small amount goes to
processing.
Figure 14 Value Chain Map for Mango in SenegalSenegal Value Chain Study 21
4.2 Production Locations
We estimate the total annual production of Mango at Figure 15 Map of Production Regions and Volumes
65,000 to 75,000 tons, coming from 3 distinctly
different production areas. The Centre and Niayes
areas produce around 25,000 tons, while the
Casamance produces around 40,000 to 50,000 tons.
Most of the 16,000 tons of fresh exports however
come from the Centre and Niayes regions, while a
large part of the mango available in the Casamance is
not utilised. The Senegal River Valley is coming up as
a new area, with one orchard established, and one of
the largest orchards, Safina, said to move their due to
salination of wells.
The main market for producers from the Centre and
Niayes is the EU fresh market. Senegalese mango
obtains premium prices due to the lack of competition
in that marketing window of July till September and is
able to provide good quality mangoes.
4.2.1 Mango Quality
The quality of mango in the North is high due to low rainfall and thus low disease pressure, a lot of
sun and a short transit time. Exporters are only an hour from port and Senegal is close to Europe.
Mango can also be transported by road via Morocco to Europe, which increases reliability of
transport & frequency of delivery. Road transport can depart daily. Port shipments weekly. Finally,
a large share of the mango marketed from Senegal is sold as Organic. Small farmers tend to
produce fruit organically by default. Low rainfall and lower disease presure makes organic
production possible. Furthermore the orchards tend to be isolated, which limits spread of
diseases.
Mango quality in the South is lower, because of higher rainfall and limited pest control, and the
near continuous spread of fruit trees over the region. Even if a plantation is treated, pest and
diseases can easily invade the orchards from nearby trees that are not managed. The region is not
only a large mango producer, but also a cashew producer. Mango and cashew trees belong to the
same family and therefor suffer from similar pests and diseases. The widespread cashew trees are
hosts for mango pests and diseases.
Figure 16 provides the number of producers per region, with indicative production volumes and
farm sizes. Over the next paragraphs we will describe the producers in the regions in more detail.Senegal Value Chain Study 22
Figure 16 Overview of production regions
#of Farms Farm Size Total Export Exporter
Production Volumes Traders
Large 9 50-100ha 25 000 50%-70% 10
Plantation
Centre Niayes 500-800 1-10 ha 7 000-10 000
(usually 2- tons per
3ha) season
Casamance 40 000-50 000 1 000 tons
tons
4.3 Large plantations in Centre and Niayes
There are about 9 irrigated professional mango orchards from 50 ha to 300 ha in size who export
directly from their own packhouses. The total yield is 10-27 tons per ha of which about 50% to
70% is export grade. The planting density in the orchards is 3x6 meter with 500 trees per ha in
rows, that are pruned every year and receive a strict schedule of preventative spraying against
pests and diseases and also receive fertiliser. The dominant variety is Kent, followed by Keitt.
Osteen is just introduced as an early season variety.
Though for West African standards these are very professional high yielding plantations, there is
still a lot of space for improvement. Firstly, several plantations struggle to reach the theoretical
yields of 25tons/ ha for Kent, despite large investments in agricultural practises and irrigation.
Secondly, the plantations have converted most of their Keitt to Kent because they struggle with
fruit fly once the rains come. However, this is also a matter of proper diseases control. Removing
Keitt shortens the season and makes it more difficult to utilise infrastructure such as packhouses
properly. Keitt is also a higher yielding variety, though it has larger fruit and thus the export grade
is relatively lower.
Thirdly, even the 25 tons per ha is an outdated maximum. For example farms in the Hoedspruit
area in South Africa with a comparable climate achieve on average 30 tons for Kent, but the better
ones do 35 tons on Kent, and 35 to 40 tons with a maximum of 45 on Keitt. This is done with a
planting density of 1000 to 1500 trees per ha, and even more precise management. For example
for each block leaf samples are analysed and a specific fertiliser is developed for that block, that is
added to the irrigation system. They still farm Keitt despite the rains.Senegal Value Chain Study 23
Figure 17 Comparison of yields between Senegal and South Africa
The difference in yields between Senegal and South Africa can also be caused by differences in
genetic material (tree quality). Farms in Senegal tend to produce their own trees, from material
selected from their own farms. In South Africa trees are ordered from specialised nurseries.
An issue is that generally boreholes are used for irrigation. The usage of groundwater for irrigation
is officially not allowed, and is most likely not sustainable. Pumping from wells that are often more
than 100 meters deep also costs a lot of diesel. Salination of boreholes is also an issue.
Commercial plantations in the Niayes area are still expanding, and every couple of years a new
plantation is added. But the expansion is modest. Some plantations may move to the Senegal
River Valley in future.
4.4 Small Producers in Centre Niayes
We estimate that there are between 500 and 800 small scale farmers in Centre and Niayes that
farm between 1 and 10ha each, but on average 2 to 3 ha. We estimate their total production at
between 7000 and 10000 tons of mango, of which roughly half is exported. There are 10
exporters-traders who source from these small-scale farms and have their own packhouse. Rejects
are sold via informal traders on the local fresh market.
The small farmers can roughly be divided in two categories:
• Owner managed mango farms. For most owners, the mango is one of their farming
activities. Green beans, which are planted after the mango season, are often more
important for farmers.
• Small plantations owned by formal sector workers in Dakar. These farms have farm
managers employed who tend to live on the farm. They tend to be poorly paid and
supervised, and are more caretakers than farmers.Senegal Value Chain Study 24
The small farms are not irrigated and have a low planting density of around 120 to 160 trees per
hectare. Compared to small scale farmers in other countries in West Africa, small scale farmers in
Senegal invest a lot in orchard maintenance, and they have a very high percentage of export grade
(50% versus 10%).
The trees are pruned annually, which keeps them very small. The orchard floor is cleaned of fallen
fruit and weeds annually. The orchards are mostly organic with yields of about 5-8 tons per ha, of
which 50% is exportable. Most orchards do use bait traps for fruit fly. These farmers do not use
any foliar or chemical fertiliser. At most they may add some manure to each tree and usually not
every year. As a result they require only flexible staff – usually 2 workers- who are hired in to carry
out specific tasks for short periods throughout the year. Even harvesting is often carried out by the
buyer of the fruit.
Nevertheless there is a lot of improvement possible. We believe the plantations would benefit
from a higher planting density, investments in soil improvement such as mulching of pruning
wood, and keeping a short grass layer instead of barren soils, and supplementary irrigation.
Farmers believe higher planting density would require more water which is not available, but we
believe that this would reduce the exposure of much of the soil to direct sunlight, which would
dramatically reduce evaporation. Furthermore increasing the organic matter would improve the
retention of moisture in the soil.
Another issue is the quality of trees used. Most farmers plant trees from seed directly in the
orchard and then employ a grafter who comes to the orchard. The rootstock nor grafting wood is
certified and standardised, nor is the grafting always done properly. Also not all trees survive the
grafting, which leads to open spots.
Some small plantations are slowly being expanded, while others are disappearing due to
urbanisation in the greater Dakar area.
4.5 Casamance
The Casamance produces about 40,000 to 50,000 tons of fresh mango. Only 1 000 tons from this
is allegedly for export via exporters in Dakar. Only one third seems to be traded for the local fresh
market in Casamance cities and around Dakar. However, with the Senegambia bridge this is likely
to increase. About two thirds is either consumed close to source or not sold because of poor
quality (fruit fly infestation, other pests and diseases or overripe), or because it concerns
undesirable or unknown varieties for which no market exists.
The region is traditionally divided in 3 areas:
• Basse Casamance in the West, from the coast to Ziguinchor, also referred to as Ziguinchor.
• Moyenne Casamance in the middle, also referred to as Sedhiou.
• Haute Casamance in the East, also referred to as Kolda.
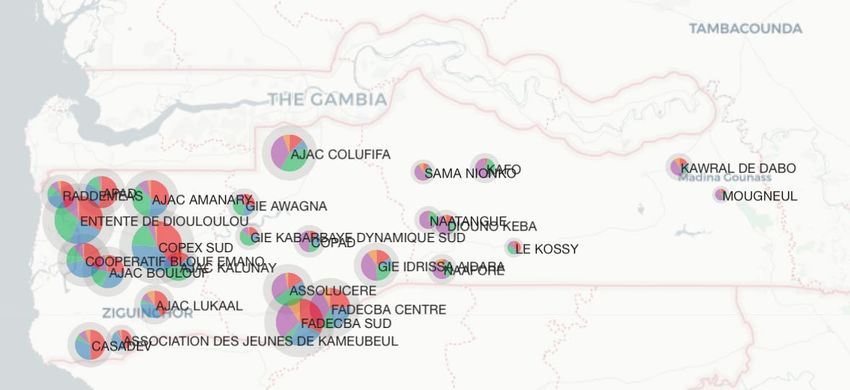
The IFC Comango project has gathered a large amount of statistics over the past years with
regards to the number of trees, farmers, plantations and the varieties. Figure 18 shows the
number of trees per variety per area, while Figure 19 shows the production zones on the map,
with the size of the circle indication the total production and the colours the share per variety.You can also read