2021 Annual Economic Outlook - Aftershocks and divergence in the post-pandemic economy - Wells Fargo
←
→
Page content transcription
If your browser does not render page correctly, please read the page content below

Economics Group

2021 Annual Economic Outlook
Aftershocks and divergence in the post-pandemic economy
December 2020
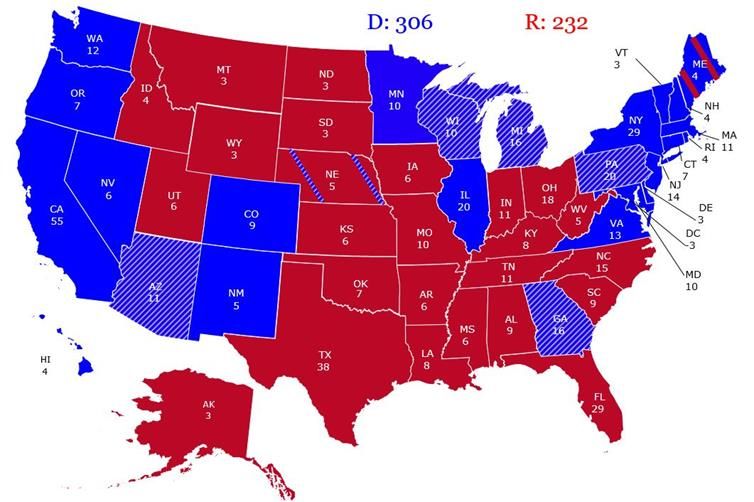
Table of contents

                                              Introduction and Summary                   2

                                              U.S. Economic Outlook                      4

                                              U.S. Real Estate and Regional Outlook      8

                                              U.S. Political Uncertainties              14

                                              Global Economic Outlook & Uncertainties   19

                                              Forecasts                                 24

                                              Disclosure                                26

1   December 10, 2020 | 2021 Annual Outlook
Introduction and Summary the election have not led us to change that assumption. As
of this writing, lawmakers are negotiating the details of
another stimulus package, and more fiscal stimulus could
The Pandemic Has Been the Economic Equivalent of a be forthcoming. That said, we have seen other
Magnitude 9 Earthquake negotiations collapse in the past, so we will continue to
assume that no more meaningful fiscal support will be
The longest U.S. economic expansion since the end of the introduced in the new year. We would make some modest
Second World War came to an abrupt end earlier this year upward adjustments to our forecast for next year if indeed
as the COVID pandemic essentially shut down the another fiscal package is signed into law.
economy. Following an unprecedented plunge in
Q2-2020—real GDP nosedived at an annualized rate of The Federal Open Market Committee (FOMC) responded
31.4%—economic activity rebounded sharply in the to the shock that the pandemic imparted on the economy
third quarter. But the shocks of the pandemic continue to by slashing its target range for its main policy rate back to
reverberate throughout the economy as renewed surges in 0.00% to 0.25%, where it remains today. The FOMC also
COVID case counts have led some local officials to re- reinstated its quantitative easing (QE) purchases of
impose some restrictions. Furthermore, voluntary Treasury securities and mortgage-backed securities, and it
decisions by individuals and businesses to follow guidelines rolled out a plethora of lending programs to stabilize credit
regarding socially-distanced behavior have led to markets. Looking forward, we suspect that the FOMC will
weakness in some sectors of the economy. Most foreign maintain its current target range for its main policy rate
economies, which have experienced their own outbreaks of through at least the end of 2022. In addition, the
COVID cases, have also been rocked by the pandemic. committee may eventually sanction further monetary
accommodation if inflation struggles to reach 2% or higher
Most economies will register sharp rates of contraction in on a sustained basis. Although the likelihood of a negative
2020. We estimate that global GDP will shrink 3.7% this policy rate seems to be rather low at this point, the FOMC
year, the most severe global downturn since at least 1980. could potentially provide further monetary
Although we forecast that real GDP growth in most major accommodation by concentrating its QE purchases at the
economies will bounce back significantly in 2021, we long end of the yield curve in an effort to push long-term
readily acknowledge that the economic outlook remains rates lower and/or by increasing its QE purchases. If the
dependent on the evolution of the pandemic in coming FOMC errs, it will provide “too much” monetary
months and quarters. accommodation rather than too little, in our view.
In that regard, COVID cases in the United States have risen As noted previously, the economic effects of COVID have
significantly over the past few weeks, and some U.S. states reverberated around the world. The Chinese economy,
and municipalities have tightened restrictions in an effort where the pandemic originated around the turn of the
to slow the spread of the virus. Accordingly, we have year, contracted 10% (not annualized) on a sequential
downgraded our U.S. GDP forecast for Q1-2021, which a basis in Q1-2020. But China has largely been successful in
month ago we had projected to be 4.0%, to only 1.2%. But subsequent months in combatting the spread of the virus,
we have also upgraded our forecasts for the second and and the country has reported negligible numbers of new
third quarters of next year due to the recent news that cases since March. We forecast that real GDP in China will
scientists have developed a few vaccines that should help grow 9.6% in 2021 following its pandemic-induced
life return to some semblance of “normal” by the middle slowdown to 2.2% this year.
part of next year. We look for real GDP to grow at a robust
rate of 4.5% in both 2021 and 2022. Real GDP in the Eurozone plunged roughly 12% (not
annualized) in the second quarter as most governments in
We have not made major changes to our U.S. economic the euro area locked down their economies to slow the
outlook at this time that are based on the outcome of the spread of the virus. Although economic activity rebounded
elections that were held in the United States on sharply in the third quarter as case counts receded over
November 3. Our pre-election outlook was predicated in the summer, the reimposition of restrictions by most
part on the assumption that lawmakers would not provide European governments that followed a renewed surge in
further fiscal support to the economy, and the results of COVID cases means that GDP growth in the Eurozone
2 December 10, 2020 | 2021 Annual Outlooklikely will turn negative again in Q4-2020. We forecast severely tested by lower oil prices and disarray in the
that real GDP in the euro area will fall 7.4% this year before energy industry.
growing 3.6% in 2021.
Center city areas have been particularly affected. The near
Cracks Have Opened Up Across Sectors, Regions and extinction of daily office commuters has deprived
Countries downtown restaurants, bars, coffee shops, hotels, gyms,
dry-cleaners, barber shops, doctors, dentists and drug
Not only did the pandemic impart a significantly negative stores from a vital source of revenue, and many have
shock to the global economy, but it has had asymmetrical permanently closed. Cities with expansive downtown
economic effects on different sectors, regions and areas, such as New York City, Los Angeles and Miami, have
countries. For example, the residential housing market in felt the repercussions even more acutely as a result. The
the United States has been robust since the economy eventual return of office workers, business travelers and
started to re-open in the spring. Extraordinarily low tourists should help these hard-hit areas bounce back, but
mortgage rates and the desire more space from which to it may be some while until life returns to “normal.”
work from home have led to the highest number of home
sales and single-family housing starts since the housing The divergence in economic performance across countries
bubble imploded more than a decade ago. On the other has also been marked. China, and Asia more broadly,
hand, however, multifamily starts, which rose to a 31-year experienced the economic shock of the pandemic first. But
high in 2019 as an increasing number of individuals opted those countries also have been largely successful in
for the experience of urban living, have been trending combatting the spread of the virus in recent months, and
lower in recent months. Although demand for multifamily the economic outlook in those economies is reasonably
housing in urban areas likely will continue to struggle, at solid. Economic activity in the Eurozone and the United
least for the foreseeable future, suburban demand may Kingdom is likely to relapse in the near term, and growth in
hold up relatively better. We expect single-family housing the U.S. economy also appears to be downshifting
starts to climb further in 2021. markedly. Many developing economies experienced steep
declines in economic activity earlier this year, and COVID
The pandemic has accelerated trends that were under way cases in many of these economies remain elevated, which
in commercial real estate (CRE). Construction of retail will dampen near-term economic prospects. For other
establishments has been under pressure over the past few countries beset by weaker fundamentals or political
years as more retail spending moves online. But, the boom uncertainties, such as Turkey, South Africa and Brazil, the
in online sales in recent years has helped to push recovery phase will likely be more challenging.
construction of warehouse space to all-time highs. These
trends likely will continue for some time. Similarly, In sum, the COVID pandemic has been the economic
industries that are dependent on travel (e.g., airlines, equivalent of a magnitude 9 earthquake on the global
hotels, convention centers, etc.) have been economy in 2020. Just as the aftershocks of a major
disproportionately affected by the pandemic, and activity earthquake usually are not as devastating as the initial
in those sectors likely will continue to struggle until event, the shocks that are being imparted by the pandemic
vaccines are widely deployed and life returns to “normal” do not appear to be as economically catastrophic as the
again. initial shock. Still, the economic outlook remains very
dependent on the evolution of the pandemic in the coming
Although every state in the country has been adversely months, and different sectors and economies will continue
affected by the pandemic, several are lagging behind. New to feel its effects in varying degrees for quite some time.
York and California have been cautious in their re-opening
efforts, and hiring has been slow to regain momentum.
The collapse in travel has devastated the Nevada and
Hawaii economies, not to mention a myriad of local
economies such as Orlando and New Orleans, which also
are driven by tourism spending. Energy-driven areas such
as North Dakota, West Texas and Alaska have been
3 December 10, 2020 | 2021 Annual Outlookbut the potency of the tools currently at the Fed’s disposal
U.S. Economic Outlook are weaker today than the tools the central bank was able
to draw on back in March. While about two-thirds of the
economy’s lost output has been recovered, reclaiming the
Slow Out of the Gate, but Off to the Races in H2-2020 remaining ground will be slower going and less V-like
(Figure 1). Real GDP growth is likely to sputter during the
The longest U.S. expansion came to an abrupt halt in early part of 2021 before taking off when widespread
March as the novel coronavirus swept across the country. vaccination greatly reduces the need to social distance
While the economic recovery is under way, the effects of (Figure 2).
the COVID pandemic will continue to reverberate across
the U.S. economy in 2021. Recent news reinforces our
Figure 2
assumption that vaccinations will be widely available in the
second half of 2021, which should help life and business U.S. Real GDP
Bars = CAGR Line = Yr/Yr Percent Change
return to some semblance of “normal.” Yet the pandemic’s 40% 40%
Forecast
effects on spending, the labor market and monetary policy
30% 30%
are unlikely to fully dissipate. We project the recovery,
measured by the level of real GDP, will be complete in the 20% 20%
third quarter of 2021, but the economy will still be smaller
than it would have been in the absence of the pandemic. 10% 10%
Furthermore, not all businesses or households will be back 0% 0%
to where they were at the end of 2019.
-10% -10%
Figure 1 -20% -20%
U.S. Real GDP -30% -30%
Trillions of Dollars GDP - CAGR: Q3 @ 33.1%
$21 $21 GDP - Yr/Yr Percent Change: Q3 @ -2.9%
Thousands
Thousands
Real GDP: Q3 @ $18.6T -40% -40%
$20 $20 00 02 04 06 08 10 12 14 16 18 20 22
Source: U.S. Department of Commerce and Wells Fargo Securities
$19 $19
Forecast
$18 $18 Despite the rocky starting point, however, the U.S.
$17 $17
economy should continue to heal over the course of 2021.
An untenable surge in COVID cases continues to be a
$16 $16
major downside risk to our outlook, but the relationship
$15 $15 between virus cases and the economy has weakened since
the onset of the pandemic. Businesses, households and the
$14 $14
public sector are adapting activity as more information
$13 $13 about the spread and treatment of COVID comes to light.
$12 $12
Households appear to have a higher risk tolerance of
00 02 04 06 08 10 12 14 16 18 20 22 possibly contracting the virus and general fatigue over
Source: U.S. Department of Commerce and Wells Fargo Securities mitigation efforts. Restrictions on activity to curtail cases
are also more targeted and are expected to inflict less
The upcoming year looks set to start off on tenuous damage on the economy than the blanket stay-at-home
footing. Growth is slowing as we head into 2021 amid a orders and business closings of last spring. Furthermore,
resurgence in COVID cases, increased restrictions in some additional fiscal stimulus could counter the negative
localities and tougher base comparisons after initial economic effects of another surge in COVID. On balance,
re-openings this summer. No additional fiscal support economic activity is likely to remain depressed in the early
appears immediately on the horizon, and any deal that part of the year, but we believe the prospect for continued
does pass is likely to be significantly smaller than the growth is greater than the chance of a double-dip
$2 trillion CARES Act, as we discuss in more detail on recession.
page 14. Monetary policy may provide additional support,
4 December 10, 2020 | 2021 Annual OutlookConsumption: Excess Saving and Services to Fuel Growth The stronger picture of aggregate spending over the
course of the year is expected to be driven by growth in
Less stringent restrictions, “COVID-fatigue” and the the service sector. The need to physically distance has hit
growing likelihood of at least one vaccine becoming widely service industries that rely on in-person interactions, like
available should lead to consumer spending growing faster hospitality, recreational activities and personal care,
in 2021 than its pre-pandemic trend. Households continue particularly hard. Unusual for a downturn, goods spending
to stash away income at a higher rate than before has made a full recovery ahead of services (Figure 4).
COVID—an outgrowth of the “forced thrift” due to
business closures and personal safety efforts, as well as Figure 4
the substantial fiscal support authorized in the spring.
Real Personal Consumption Expenditures
Compared to the saving rate at the end of 2019, Change from February through October 2020
consumers have tucked away an additional $1.4 trillion in 20% 20%
savings through October (Figure 3). 15% 15%
14%
10% 10%
Figure 3
5%
Forced Thrift 5% 5%
Personal Saving Exceeding Pre-COVID Level Based on Dec-2019
Saving Rate & Total Excess Savings, Billions of Dollars 0% 0%
$1,600 $1,600 -2%
Personal Saving Exceeding Pre-COVID Level
$1,394 -5% -5%
Personal Saving (Pre-COVID Level) -7%
$1,400 $1,400
-10% -10%
$1,200 Cumulative Excess Savings $1,200
-15% -15%
PCE
$1,000 $1,000 Durable Goods
-20% -20%
Nondurable Goods
Services
$800 $800 -25% -25%
Feb-20 Apr-20 Jun-20 Aug-20 Oct-20
$600 $600 Source: U.S. Department of Commerce and Wells Fargo Securities
$400 $400
We expect goods spending to remain relatively strong in
$200 $200 2021, but for wallet share to shift back toward services.
Spending on goods like cars, home furnishings and
$0 $0
Jan-19 May-19 Sep-19 Jan-20 May-20 Sep-20 recreational items has been pulled forward by the initial
Source: U.S. Department of Commerce and Wells Fargo Securities adjustment to more time at home and the desire to avoid
crowded public transportation, including air travel. That
We expect savings to be drawn down over the course of pull-forward should keep the level of goods spending little
2021, which will help to fuel the recovery in consumption. changed over the upcoming year. Services, on the other
But households’ financial health and ability to spend will hand, should show discernable improvement. All the meals
vary across the income spectrum. Lower-income out, concerts and travel skipped since the emergence of
households have been hit disproportionately hard by job COVID cannot be made up, but eagerness to get out and
losses, and the fiscal support that helped many of these about and engage with people outside one’s immediate
households stay afloat early on in the pandemic has been household should fuel above-trend growth in services in
pared back since the summer. Last spring’s stimulus 2021.
checks were one-off payments, while supplemental
unemployment benefits have ended and the emergency Investment: Less Pent-Up Demand than in Prior
unemployment insurance programs are set to expire at Recoveries
year-end, cutting off benefits for about 13.4 million
workers. But, excess savings and some normalization in Despite our expectations for above-trend growth in
day-to-day life should allow more affluent households to consumption next year, the pace of overall business fixed
step up spending as the year progresses, more than investment (BFI) spending is poised to look fairly ordinary
offsetting the very real spending constraints on many (Figure 5). Equipment spending held up unusually well
lower-income households. throughout the COVID recession, as the need for remote
5 December 10, 2020 | 2021 Annual Outlookwork generated a surge in investment on computers and over the course of 2021 as the improvement in global
communication equipment. We expect to see some growth, which we discuss on page 19, leads to more
payback in spending on information equipment—which marked strengthening in export demand.
accounts for about 20% of total BFI—early in 2021.
However, weakness in information equipment should be Figure 6
offset by a strengthening in more traditional capital
Real Business Inventories
expenditures, like industrial and transportation equipment. For All Manufacturing, Wholesale and Retail Businesses
1.70 1.70
Real Inventory-to-Sales Ratio: Sep @ 1.36
Figure 5 1.65 1.65
Real Business Fixed Investment 1.60 1.60
Bars = CAGR Line = Yr/Yr Percent Change
40% 40%
Non-Res Fixed Invest - CAGR: Q3 @ 21.9% 1.55 1.55
Non-Res Fixed Invest - Yr/Yr Percent Change: Q3 @ -4.7%
30% 30%
1.50 1.50
Forecast
20% 20%
1.45 1.45
10% 10% 1.40 1.40
0% 0% 1.35 1.35
1.30 1.30
-10% -10% 97 99 01 03 05 07 09 11 13 15 17 19
Source: U.S. Department of Commerce and Wells Fargo Securities
-20% -20%
Investment in nonresidential structures looks set to be
-30% -30%
00 02 04 06 08 10 12 14 16 18 20 22 weak, however. Completions of projects under way when
Source: U.S. Department of Commerce and Wells Fargo Securities COVID struck should help outlays inch upward the next
few months, but the pipeline of commercial construction
The fundamental drivers of investment spending appear has dwindled over the course of the pandemic. We expect
favorable in 2021. Credit is inexpensive, and for the most structures investment to turn negative as the year
part, firms of all sizes report little trouble obtaining it. At progresses, even as there have been some modestly
the same time, corporate profits are recovering amid the positive signs in energy investment recently.
better sales environment. More stability on the trade front
under a Biden administration should also offer some In contrast to nonresidential construction, the pandemic
modest support to investment spending after a sharp has lit a spark under the housing market, which is expected
escalation in trade-related uncertainty in 2019.1 to lead to a strong year for residential investment. Low
Transportation equipment spending is also expected to mortgage rates, working from home and favorable
get a boost as Boeing’s 737 MAX has been authorized by demographics (Millennials will start to turn 40 next year)
the FAA to fly again and shipments resume. are all supportive of home buying. However, inventories of
unsold houses are extraordinarily low and will limit existing
Inventory investment should also be supportive of overall home sales. Yet, the dearth of inventory has boosted
GDP growth in 2021. The swift rebound in goods home prices and is apt to spur new construction. We
purchases has left business inventories exceptionally lean discuss the divergent fates of commercial and residential
(Figure 6). Rebuilding early in the year is expected to real estate markets in more depth on page 8.
flatter top-line growth—real final sales should grow at a
slower pace. Some of the inventory rebuilding will be met
by imports, but trade is also set to be modestly supportive
of growth next year. We expect the trade deficit to narrow
1
See “Biden Trade Policy: A Status Quo Ante?” for further reading on our
views of trade policy in a Biden administration.
6 December 10, 2020 | 2021 Annual OutlookLabor Market: More Progress than Headlines Will Figure 8
Suggest, but Still Reeling in 2021 Job Losers
On Temporary Layoff vs. Permanent Job Losers and Persons
Completing Temp Jobs, Millions
Fewer job losses among higher-income households, who 20 20
Temporary Layoff: Nov @ 2.8M
are more likely to purchase a home, have also been a key 18 Not On Temporary Layoff: Nov @ 4.7M 18
support of the housing market this past year. But, the 16 16
diminishing risks around COVID in the middle of next year
14 14
and the return of more face-to-face interaction should
help hiring across hard-hit sectors like leisure & hospitality, 12 12
which continue to account for an outsized share of job 10 10
losses. The sharp disparities between low- and high- 8 8
income job losses should narrow as a result (Figure 7).
6 6
While nonfarm payroll growth is likely in for a fitful few
months, given recent virus cases and restrictions, we 4 4
expect to see job gains average 427K per month in 2021. 2 2
0 0
Figure 7 00 02 04 06 08 10 12 14 16 18 20
Source: U.S. Department of Labor and Wells Fargo Securities
Employment Across the Pay Spectrum
Jobs Ranked by 2019 Average Weekly Earnings,
5%
Percent Change in Employment from Feb. 2020
5% The unemployment rate has declined rapidly to 6.7% in
0% 0% November from 14.7% in April, but we expect a
-5% -5%
significantly slower descent in 2021. The health risks
posed by in-person work, a dearth of jobs and remote
-10% -10%
schooling have fueled an exodus from the labor force and
-15% -15%
reduced the number of workers officially counted as
-20% -20%
unemployed. Yet, as the health risks abate, demand for
-25% -25% workers increases and in-person schooling resumes, we
-30% -30% expect to see more individuals return to the labor force,
-35% -35% which should lead to a more modest decline in the
Highest-Paying Quintile: Nov @ -2.9%
-40% Second Quintile: Nov @ -3.8% -40%
unemployment rate. However, a full rebound in
-45%
Middle Quintile: Nov @ -3.1%
Fourth Quintile: Nov @ -10.5% -45%
participation is unlikely, and even as the unemployment
Lowest-Paying Quintile: Nov @ -12.5% rate falls below 6% by the end of the year, a substantial
-50% -50%
Feb-20 Apr-20 Jun-20 Aug-20 Oct-20 Dec-20 amount of slack in the labor market is likely to remain.
Source: U.S. Department of Labor and Wells Fargo Securities Wage growth should remain subdued as a result. We
forecast that employment costs, including benefits, will
That is not to say all will be well in the jobs market. A rising increase only 1.8% in 2021, compared to 2.7% in 2019.
share of job losses are considered permanent, leading to
long spells of unemployment (Figure 8). Overall, Inflation and the Fed: No Need to Hurry
employment will be slower to recover than GDP due to the
profit pressures and restructuring needs that come with While slack is not everything when it comes to inflation,
any downturn, but also by the disproportionately harsh the weak labor market and lingering output gap should
effect COVID has had on labor-intensive service industries. keep overall price pressures muted. Despite the
Despite a full recovery in GDP by the third quarter, we unprecedented increase in the money supply this past
expect employment to still be 3.1% below its previous year, widespread price increases that jolt inflation out of
peak at the end of 2021. its decade-long slumber look unlikely. Consumer inflation
expectations remain near historic lows and businesses’
plans to increase prices are well within their pre-pandemic
range. Although favorable base comparisons should push
the 12-month change in the PCE deflator to 2% in the
second quarter of next year, inflation is likely to struggle to
7 December 10, 2020 | 2021 Annual Outlookmeet 2% on an ongoing basis. We project that core PCE not move substantially higher in 2021, even as the
inflation will average 1.7% in 2021 (Figure 9). economy continues to heal and the outlook for inflation
strengthens (Figure 10).
Figure 9
PCE Deflator & "Core" PCE Deflator
Figure 10
Year-over-Year Percent Change
5% 5% Wells Fargo Rates Forecast
Through 2021
3.5% 3.5%
4% 4%
3.0% 3.0%
3% 3%
Forecast 2.5% 2.5%
2% 2%
2.0% 2.0%
1% 1%
1.5% 1.5%
0% 0%
1.0% 1.0%
-1% -1% Q4-2021
PCE Deflator: Q3 @ 1.2% 0.5% 0.5%
Q4-2020
"Core" PCE Deflator: Q3 @ 1.4%
-2% -2% Q4-2019
00 02 04 06 08 10 12 14 16 18 20 22 0.0% 0.0%
Source: U.S. Department of Commerce and Wells Fargo Securities
Source: Federal Reserve Board and Wells Fargo Securities
FOMC members appear in widespread agreement that
inflation will struggle to reach the committee’s goal of
2% in 2021. But the quest for inflation to reach 2%, let
U.S. Real Estate and Regional
alone average 2% over time as outlined by the Fed’s
updated Longer-Run Goals and Monetary Policy Strategy,
Outlook
is likely to take much longer. In the September Summary
Divergences in Residential and Non-Residential Real
of Economic Projections, the bulk of the FOMC did not
Estate Markets
expect core PCE inflation to return to 2.0% until 2023. The
expectation of a slow return to 2% comes under what
Few areas of the economy have felt the seismic effects of
members projected to be the most appropriate monetary
the COVID crisis as directly as real estate. The need to
policy and, for many, the assumption of additional fiscal
socially distance has wreaked havoc on office buildings,
support, which remains in question.
retail stores, hotels and other types of commercial real
estate where close-contact engagement is intrinsic to the
As a result, the chance of the FOMC raising the fed funds
property’s value proposition. The reverberations so far,
rate in 2021 is for all intents and purposes nil. Rather, we
however, have not been universally negative. The
suspect the FOMC may at some point feel compelled to
new-found aversion to public spaces and more time at
provide some form of additional policy support to lend
home has broadened the appeal of online shopping, which
credibility to its inflation goal. Officials have consistently
has reinforced already strong demand for warehouses and
downplayed the use of negative interest rates and do not
distribution centers, making the industrial market one of
seem eager to attempt yield curve control, in which the
the most resilient sectors of the economy in 2020.
Fed would target some specific point on the yield curve.
That said, some Fed officials seem open to the idea of a
renewed “Operation Twist,” in which the Federal Reserve
would concentrate its purchases of Treasury securities
across the long end of the yield curve. Whether additional
policy support takes the form of an outright increase in
the pace of asset purchases or a shift in the maturity
composition, we forecast that long-term interest rates will
8 December 10, 2020 | 2021 Annual OutlookFigure 11 Figure 12
CRE Vacancy Rates Single-Family Housing Starts vs. New Home Sales
SAAR, Millions
14% 14% 2.0 2.0
Single-Family Housing Starts: Oct @ 1,179K
1.8 New Home Sales: Oct @ 999K 1.8
12% 12%
1.6 1.6
10% 10% 1.4 1.4
1.2 1.2
8% 8%
1.0 1.0
6% 6% 0.8 0.8
0.6 0.6
4% Apartment Vacancy Rate: Q3 @ 6.8% 4%
Office Vacancy Rate: Q3 @ 10.7%
0.4 0.4
Retail Vacancy Rate: Q3 @ 5.0%
Industrial Vacancy Rate: Q3 @ 5.7%
2% 2% 0.2 0.2
07 08 09 10 11 12 13 14 15 16 17 18 19 20 04 06 08 10 12 14 16 18 20
Source: CoStar Inc. and Wells Fargo Securities Source: U.S. Department of Commerce and Wells Fargo Securities
Moreover, the experience over the past several months That is not to say that the road ahead is completely clear
has left those who preferred the vibrancy of city living of hazards. For one, some of the structural trends, which
yearning for greener pastures. There now appears to be an predate the pandemic, are likely to remain in place, namely
exodus of urban renters moving to the suburbs or beyond a lingering shortfall of affordable homes for sale.
for single-family homes, a trend that has surely been Regulatory controls make it difficult to build affordable
supported by record-low mortgage rates and the desire housing in many parts of the country, so constraints on
for more space to accommodate home offices, home new supply will likely persist. Inventories of homes for
gyms and virtual learning. The need for more livable space resale also remain near historic lows, which has helped
has translated to rising apartment vacancies (Figure 11) reignite home price appreciation as buyer demand has
and soaring home sales (Figure 12), which has cascaded heated up. Currently, home prices are now back to rising
into record high builder confidence and a rapid increase in much faster than income growth, meaning affordability
new single-family construction. issues will remain a limitation.
There are several reasons why we believe housing’s Still, the lack of supply and robust buyer demand sets the
momentum will extend well into 2021. Even as Treasury stage for new home construction to continue to climb
yields have ticked higher following brighter economic higher in 2021. One of the more lasting residual effects of
growth prospects on the back of positive vaccine news, the pandemic likely will be an increased preference for less
mortgage rates are likely to remain low compared to dense markets to abide by social distancing and more
historical averages. Furthermore, the recent strength has useable square footage to accommodate virtual activities.
fundamental underpinnings, which will make the COVID- For those reasons, we expect single-family development
induced race for space more than just a fleeting trend. to remain strongest in the land-abundant South and more
Through all of the turbulence of 2020, it is easy to forget affordable parts of the West. Along those same lines, new
that there is a wave of millennials who are now reaching an home construction tends to follow population growth.
age when family-forming and home buying tend to occur. Thus, new construction should continue to be
More broadly, the pandemic appears to have sparked a concentrated in high-growth metros such as Dallas,
nesting instinct, which has prompted a shift toward Austin, Phoenix, Tampa and Charlotte, which have seen an
homeownership across most age cohorts. Together, these accelerated influx of residents from higher cost major
factors should bolster buyer demand for years to come. metro areas in the Northeast and along the West Coast.
By contrast, multifamily construction appears set to
downshift somewhat. A more subdued pace of
9 December 10, 2020 | 2021 Annual Outlookdevelopment makes sense, given the apartment market major property types, vacancy rates have turned higher
continues to work through a number of substantial and rent growth has either slowed to a crawl or declined
headwinds. In response to the exodus of remote workers outright. Likewise, property price appreciation has
fleeing to the suburbs, landlords in many of the largest flat-lined, and cap rates have shown signs of pressing
apartment markets have been slashing rents and offering higher (Figure 14). This has occurred even as the number
generous concessions and lease adjustments. The trend is of commercial real estate sales have plummeted alongside
most evident in the relatively high-cost markets of San a growing distance between buyers’ and sellers’
Francisco, New York City and Los Angeles (Figure 13). perceptions of property values.
Broadly speaking, rents appear to be falling fastest in
central business districts (CBDs), while suburban property Figure 14
rents have been more buoyant.
Commercial Property Price Index
Year-over-Year Percent Change
Figure 13 20% 20%
Daily Asking Apartment Rents per SF
Indexed, Jan. 2020=100 10% 10%
104 104
Charlotte
102 102
Dallas-Fort Worth 0% 0%
100 100
Los Angeles
98 98 -10% -10%
National
NYC
Emergency
96 96 National All-Property: Oct @ 3.6%
Declared
-20% Apartment: Oct @ 7.2% -20%
94 94 Retail: Oct @ -5.2%
Industrial: Oct @ 8.5%
Office: Oct @ -0.9%
92 92 -30% -30%
05 07 09 11 13 15 17 19
90 San Francisco 90 Source: Real Capital Analytics and Wells Fargo Securities
88 88
Jan Feb Mar Apr May Jun Jul Sep Oct Nov With a vaccine in sight, the office market should begin to
Source: CoStar Inc. and Wells Fargo Securities see some improvement in 2021. Currently, the surprising
success of work-from-home (WFH) policies has led many
Compounding the issue is that rental demand has been businesses to reassess their longer-term space needs. The
slow to return amid generally weak labor market prospect of lower occupancy costs amid mounting
conditions. Many large service-sector employers, who financial pressures has made paring back their office
have thus far been absorbing the negative COVID footprints even more enticing. Still, we remain of the belief
economic impacts, have announced plans to reduce that the office will continue as the predominant workspace
headcounts. The supply side looks equally as concerning. for office-using industries in a post-COVID environment.
Even though multifamily development may move to a Office space plays a key role in fostering collaboration,
lower gear in 2021, there is still a deluge of under- innovation, culture and productivity—all of which are
construction apartment units that will be delivered next essential to maintaining a comparative advantage over
year. Although overall rental demand should hold up competitors. Despite all of the recent turmoil, many office
relatively well, the mix likely will change because more tenants appear to still be paying rent and holding on to
demand appears to be shifting to the suburbs. Most leases. Workers have also started to trickle back into the
multifamily development has occurred in urban areas in office, although occupancy remains at only a fraction of its
recent years, which means that apartment vacancies in pre-COVID levels. Some of the large marquee tech firms
those areas likely will continue to rise with rents who made headlines by offering employees permanent
maintaining a downward trajectory over the short term. WFH options, even appear to be leasing new space.
Similarly, it may be some time until commercial property While we see a return to the office as imminent once
fundamentals return to pre-pandemic levels. Across all vaccines are widely available, there is also the question of
10 December 10, 2020 | 2021 Annual Outlookhow much space businesses even need once the pandemic Figure 16
is fully contained. The experience of the past few months
E-commerce Sales
has revealed that there are merits to having a certain mix Nonstore Sales as a Share of Total Retail Sales
of employees work remotely. Transitioning to a hybrid 20%
Sales: Oct @ 15.9%
20%
workforce, where some workers remain remote and still 18% 18%
periodically meet in the office, might reduce occupancy
16% 16%
costs without a significant drop off in productivity. Even
under this model, firms may need to maintain their current 14% 14%
footprint to abide by social distancing requirements, which 12% 12%
are likely to remain in place well after the pandemic has
ended. Putting this all together, demand for office space 10% 10%
should begin to improve next year as employers bring 8% 8%
more of their workforce back and space needs are more
6% 6%
certain. Encouragingly, office development has been
mostly restrained for the past decade, which puts many 4% 4%
office markets in a favorable position once a recovery 2% 2%
gains steam. 92 94 96 98 00 02 04 06 08 10 12 14 16 18 20
Source: U.S. Department of Commerce and Wells Fargo Securities
Figure 15
Unfortunately, the sharp upturn in online sales and surging
Private Warehouse & Retail Construction demand for industrial buildings has come at the expense of
Billions of USD, SAAR
$35 $35 retail stores. The demise of traditional brick-and-mortar
retail is well-documented, and the decline has only been
$30 $30 hastened by social distancing and an aversion to spending
meaningful time undertaking in-store shopping. Retail
$25 $25 vacancy rates have recently risen to 5.0%, the highest since
2016. Considering that large numbers of retailers were
$20 $20 struggling even before the pandemic, it may be some time
until the retail market as a whole fully right-sizes.
$15 $15
We continue to emphasize, however, that not every
$10
Warehouse: Oct @ $33.0B
$10
segment of retail is in dire straits. Retailers that offer
Retail: Oct @ $10.7B curbside service and provide products that augment or
$5 $5
15 16 17 18 19 20
enhance home living spaces, including furniture, appliance
Source: U.S. Department of Commerce and Wells Fargo Securities and home electronics, have generally outperformed.
Building material stores and big-box stores with robust
The widening split between retail and industrial property e-commerce platforms are holding up well and appear
performance was another prominent theme during 2020 poised for stronger growth in the years ahead as more
(Figure 15). The reason for the divergence is clear. Online time is spent at home. The same goes for grocery stores
retail sales have surged since the spring (Figure 16), which and pharmacies, especially those providing online-
has made industrial buildings such as warehouses and ordering, delivery, drive-thru and pick-up services. Town-
distribution centers even more vital. Considering that the center properties, which are mostly outdoor and walkable,
high cost of social interactions has forced many to also stand to benefit in a world of social distancing and
discover the benefits of online shopping more quickly than preference for open-air activities. A vaccine will clearly help
they otherwise would have, we expect this higher share of bring back all forms of in-store shopping, but many of
e-commerce sales to be long-lasting, which should bolster these COVID-related trends that have emerged this year
the need for industrial properties well into the future. will likely prove to be durable.
11 December 10, 2020 | 2021 Annual OutlookFigure 17 about 20% of all travel in 2019, will likely remain depressed
as employers continue to be abundantly cautious in lifting
International Arrivals to the U.S.
Millions, 12-Month Moving Average travel restrictions until vaccines are widely implemented.
7.0 7.0
Similarly, international travel will be restricted until the
Millions
Millions
Arrivals: Aug @ 3.54M
6.5 6.5 world is fully in control of the virus. We are slightly more
6.0 6.0 optimistic about the timetable for a return of leisure
5.5 5.5 travel. Assuming a vaccine is successful, there will likely be
5.0 5.0 an explosion of pent-up travel demand as consumers use
4.5 4.5 some of the excess savings accumulated over the past
4.0 4.0 year to make up for 2020’s canceled trips, sojourns and
3.5 3.5 vacations. Still, without business and international travel, it
3.0 3.0 will be some time until demand for hotel rooms returns to
2.5 2.5 the exceptionally high levels hit in the years leading up to
2.0 2.0 the coronavirus crisis.
1.5 1.5
1.0 1.0
With 2020 coming to a close, many are likely wondering
96 98 00 02 04 06 08 10 12 14 16 18 how prevalent these trends will be in 2021 and beyond. Of
Source: National Travel and Tourism Office and Wells Fargo Securities course, the path forward is still highly dependent on the
trajectory of the pandemic itself, even with a vaccine. That
A highly effective vaccine will likewise come as welcome said, the housing market was gathering momentum in the
news to the hotel industry. For most of the year, hotels months leading into the pandemic, and the quick bounce
have had to grapple with travel moratoriums, canceled back in activity only reinforces our belief that home sales,
conferences and trade shows as well as international travel single-family construction and home improvement
grinding to a halt (Figure 17). Operating fundamentals spending will continue to be a bright spot in the years
have slowly improved since the spring, but occupancy rates ahead. After what we suspect will be a 5.1% gain in 2020,
(Figure 18), revenue per available room (RevPAR) and we expect residential investment to rise an even stronger
average daily rates (ADR) remain well off pre-pandemic 12.5% in 2021.
levels.
Conversely, nonresidential spending appears set to
Figure 18 weaken next year. The collapse in global energy demand
Daily Hotel Occupancy has brought oil prices markedly lower, which has wreaked
2020; 7-Day Moving Avgerage havoc on virtually every facet of the energy industry,
75% 75%
Nov-28: 36.2%
leading to deep cutbacks in production, drilling activity and
pipeline construction. More recently, brighter prospects
65% 65%
for stronger energy demand next year has allowed oil
prices to stabilize around the $40/barrel (WTI) mark. With
55% 55%
firmer prices, the oil and gas rig count, which fell to the
lowest on record in August, has slowly begun to climb
45% 45%
higher, meaning energy-related structures investment
should improve further in 2021.
35% 35%
But, that likely will not be enough to lift overall
25% 25% nonresidential structures spending. Lingering
uncertainties with regard to demand for real estate has led
15% 15% many new commercial and institutional projects to be
Feb Mar Apr May Jun Jul Aug Sep Oct Nov
postponed or canceled. Nonresidential building starts were
Source: STR and Wells Fargo Securities
down 24% through October, according to Dodge Data &
Analytics. With a previously robust pipeline of new work
But even with a vaccine, a full return to pre-COVID levels is
now thinned out, the drop-off in new starts means the
likely some ways away. Business travel, which made up
weakness in nonresidential structures spending will extend
12 December 10, 2020 | 2021 Annual Outlookwell into next year. Overall, we anticipate nonresidential re-opening efforts, and hiring has been slow to regain
structures investment to decline 4.5% in 2021. momentum. The collapse in travel has devastated the
Nevada and Hawaii economies, not to mention the myriad
Regional Economic Divergences of local economies such as Orlando and New Orleans,
which also are driven by tourism spending. Energy-driven
From a regional perspective, no state, metro area or areas such as North Dakota, West Texas and Alaska have
municipality has been left untouched by the pandemic. The been severely tested by lower oil prices and disarray in the
first wave of COVID cases, while primarily impacting the energy industry.
Northeast, led to nationwide suppression efforts that
necessitated stay-at-home orders and business closures. Within these regions, center city areas have been
As a result, employment cratered in every state during particularly affected. The near extinction of daily office
March and April. Most states soon began to re-open their commuters has deprived downtown restaurants, bars,
economies, but those efforts were met by a second spike coffee shops, hotels, gyms, dry-cleaners, barber shops,
of cases in early summer. This time, however, cases surged doctors, dentists and drug stores from a vital source of
in the Sun Belt region, with severe outbreaks occurring in revenue, and many have permanently closed. Not
Texas, Florida and Arizona. The summer Sun Belt surge has surprisingly, markets with expansive downtown areas such
subsided, but now new cases and hospitalizations are back as New York City, Los Angeles and Miami have felt the
on the rise throughout the country. With this latest negative repercussions even more acutely as a result. The
iteration of COVID, the sharpest increases appear to be in eventual return of office workers, business travelers and
the Midwest and Mountain regions. tourists should reinvigorate these hard-hit areas, which
have seen unemployment rates ascend much higher than
As displayed in Figure 19, no state in the country has been in the surrounding areas.
left unscathed by the dire economic consequences of the
public health crisis. Payrolls in every state remain well- While most states are on the path to recovery, the latest
below prior peak levels, although many areas appear well COVID outbreaks are sure to bring some turbulence in the
on their way to recovery. Still, several are lagging behind. months ahead. Some large cities such as New York,
New York and California have been cautious in their Chicago and Philadelphia have imposed some new,
targeted restrictions on businesses in order to contend
Figure 19: Percent of March and April Job Losses Recovered – October 2020
Source: U.S. Department of Labor and Wells Fargo Securities
13 December 10, 2020 | 2021 Annual Outlookwith rising case counts. Considering the enormous fiscal hand, areas of the country that were seeing strong job and
strain many state and local areas have endured this year, population growth before the onset of the COVID crisis
there appears to be little appetite for widespread will likely be at the forefront of the recovery. The
shutdowns. That noted, as we saw this past summer, pandemic has put a premium on space, and an abundance
consumers and businesses tend to pull back on economic of affordable real estate in the South and Inner West
engagement as infections increase. stands to be the driving factor that kicks fast-growing
areas such as North Carolina, Florida, Texas, Arizona, Idaho,
While the next several months will be challenging, Nevada and Utah back into a high gear. Still, while the pace
economic conditions in most parts of the country should of recovery will likely be somewhat uneven, we expect
nevertheless continue to gradually improve. Economic economic conditions in the vast majority of the country to
growth should be even stronger in the second half of the substantially improve in 2021.
year, as vaccines unlock many of the indoor and in-person
activities that have not yet been able to fully resume
normal operations. Of course, there are several potential
U.S. Political Uncertainties
roadblocks ahead. Virtually every state budget has been
severely strained by the drop-off in tax revenues Divided Government Makes Sweeping Economic Policy
stemming from efforts to contain the pandemic. Absent Changes Unlikely
federal relief, many state governments will not be able to
ramp up hiring as quickly as the private sector, meaning The highly-anticipated 2020 U.S. presidential election has
the recovery in many fiscally-stressed states will likely be come and gone, with mixed electoral results for both
more drawn out. parties. It appears that Democratic candidate Joe Biden
defeated President Donald Trump by an Electoral College
In a similar vein, many dense coastal areas, such as New margin of 306-232 (The Electoral College will formally
York and California, have seen an accelerated outflow of vote on December 14). Coincidentally, this margin of
residents and businesses seeking lower rents and fewer victory was the same by which Trump beat Hillary Clinton
regulations. Slower employment and population growth in four years ago. Biden flipped five states that Donald
these areas means economic growth may have a more Trump won in 2016: Arizona, Wisconsin, Michigan,
difficult time getting fully back on track. On the other Pennsylvania and Georgia (Figure 20). Biden won the
popular vote by 4.4%, an increase from Clinton’s 2.1%
Figure 20
Source: State Election Websites and Wells Fargo Securities
14 December 10, 2020 | 2021 Annual Outlookmargin of victory in 2016. When viewed solely through this risks to the near-term economic outlook. But, additional
lens, Democrats appear to have had a successful election fiscal stimulus presents a source of near-term upside risk
night. for the economy. The U.S. federal government still has
plenty of capacity to borrow in the near term, as nominal
However, Democrats also dreamed of retaking the Senate, interest rates are low, real interest rates are negative and
which has been in Republican hands since 2014. As of this the federal budget deficit has begun to recede amid fading
writing, Democrats gained just one net seat in the Senate, fiscal stimulus and stronger economic activity relative to
two short of what was needed to take a narrow majority. earlier in the year. Furthermore, as a share of GDP, the
Not all hope is lost yet for the Democrats on this front; the federal budget deficit in FY 2020 was only half the peak
final two Senate seats will both be decided in a special experienced during World War II (Figure 21). We believe
election runoff in Georgia on January 5, 2021. If that this period provides some historical evidence that
Democrats win both seats, the Senate would be split very high budget deficits can be sustained for short
50-50, with Vice President Kamala Harris casting the periods of time during national emergencies.
deciding vote that would give Democrats a razor-thin
majority. Figure 21
Federal Budget Deficit: 1938 to 1948
Certainly anything can happen, but the Democratic Percent of GDP
candidates likely go into the Georgia races as underdogs. 10%
Annual Budget Deficit
10%
Even though Joe Biden narrowly carried the state in 2020, 5%
FY 2020 Deficit: 2020 @ -14.8%
5%
WFS Projected FY 2021 Deficit: 2021 @ -8.2%
the Republican Senate candidate David Perdue “won” the
0% 0%
state by about two points and just missed the 50%
threshold needed to avoid a runoff. The last time a Georgia -5% -5%
Senate race went to a runoff, in 2008, Republican Saxby -10% -10%
Chambliss beat Democrat Jim Martin by 15 percentage
points a month after only beating Martin by -15% -15%
three percentage points on what was a strong Election Day -20% -20%
for Democrats. At present, betting markets give
-25% -25%
Democrats roughly a 30% chance of winning both Senate
seats and taking a narrow majority in the Senate. Should -30% -30%
Republicans capture at least one of the Georgia seats, they -35% -35%
will cement their Senate majority and ensure that Joe 38 39 40 41 42 43 44 45 46 47 48
Biden faces a divided government for at least his first two Source: Office of Management and Budget and Wells Fargo Securities
years in office.
We were repeatedly skeptical that the pre-election
In the House of Representatives, the election results more negotiations between Treasury Secretary Steven Mnuchin
clearly favored Republicans. Many analysts had expected and Speaker Pelosi would yield a deal of roughly $2 trillion
Democrats to gain roughly 5-10 seats in the House and in additional COVID relief. Senate Republicans frequently
add to their majority. Instead, Republicans have gained a expressed reservations about both the total size of such a
net 10 seats in the House of Representatives, with a package and some of its individual provisions. Our view has
handful of races still undecided. As a result, Speaker of the been that, to get a COVID-relief deal in light of the recent
House Nancy Pelosi will have a very narrow majority in the election results, Democrats would need to come down
House of Representatives for the next two years. The materially from their more than $2 trillion pre-election
combination of a Republican Senate and a small House proposal.
majority for Democrats would create major obstacles for
Joe Biden when it comes time to push his legislative This important first step occurred the week of
priorities. November 30, as House Speaker Pelosi and Senate
Minority Leader Chuck Schumer said that a $908 billion
We expect COVID relief/fiscal stimulus to be a top priority bipartisan Senate plan should “be used as the basis for
of the Biden administration. As discussed in the previous immediate bipartisan, bicameral negotiations.” Around the
sections, COVID continues to present serious downside same time, Senate Republican leaders released a plan that
15 December 10, 2020 | 2021 Annual Outlookis in the ballpark of $500 billion and similar to their
proposal from mid-September. Another avenue available to the Biden administration if a
near term deal is reached would be to shift gears from an
So what happens next? As of this writing, members of income bridge strategy to a more traditional fiscal
Congress are negotiating over whether there is enough stimulus plan. If vaccines are steadily administered across
agreement between to two sides to attach a COVID relief the nation over H1-2021, perhaps Biden could focus on a
bill in the range of $500 billion-$1 trillion to a government stimulus plan that looks more like the one from 2009, with
funding bill that must be passed by December 11. tax cuts, infrastructure spending, and other policies meant
to spur economic activity, as opposed to the current forms
Could a deal in that range come to fruition? Absolutely. of income support primarily designed to aid those who
But, the clock is ticking on the lame duck session, and cannot return to work due to the virus. Regardless, even if
there remain outstanding issues that have proven thorny a deal is cut in the near term, we suspect that discussions
for months, most notably on state & local aid and liability around how to boost the economy in the aftermath of the
reform. Further, having watched several other forecasters COVID shock is unlikely to go away anytime soon.
assume additional fiscal stimulus only to have it yanked
away like Lucy holding the football for Charlie Brown, we Figure 22
would prefer to see Congress much closer to the finish line
Real State & Local Government Purchases
before making such a large change to our forecast. For Bars = CAGR Line = Yr/Yr Percent Change
now, our baseline macroeconomic forecast assumes no 6% 6%
additional fiscal stimulus. Thus, should a package along
4% 4%
those lines come to pass, it would generate some modest Forecast
upside risk to our forecasts for real GDP growth, job 2% 2%
growth, etc.
0% 0%
However, even if a COVID relief deal does not come
together in the lame duck session, we believe the odds of -2% -2%
an eventual deal have risen as the two sides have now
closed a sizable chunk of the huge gap between their -4% -4%
proposals. If Biden faces a Republican-held Senate upon
-6% -6%
taking office, he and House Democrats could face the State and Local Government Purchases-CAGR: Q3 @ -4.0%
prospect of either no COVID relief bill or passing a smaller -8%
State and Local Government Purchases-Yr/Yr: Q3 @ -1.8%
-8%
bill, like the one currently under discussion. Negotiating 03 05 07 09 11 13 15 17 19 21
down to a smaller bill would allow Democrats to achieve at Source: U.S. Department of Commerce and Wells Fargo Securities
least a watered-down version of some of their key goals
from the recent negotiations, such as more money for Beyond COVID relief, what about the other numerous
state & local governments that are cutting employment economic policy proposals on which Joe Biden ran in 2020
and capital expenditures (Figure 22). (Figure 23)? We are skeptical much other major economic
policy legislation will become law. Divided government
Furthermore, if a deal is reached before year end, it does makes sweeping legislation inherently difficult, and it is
not necessarily mean that all COVID-relief talks are behind not immediately obvious to us what legislation both Biden
us. Current negotiations have again included many and Republican senators would support. We doubt Senate
economic policies that strive to create a “bridge” to the Republicans would support expanding the Affordable Care
spring, when hopefully better weather and a vaccine will Act, for example, and we also doubt they would be eager to
allow a steady resumption of “normal” life. But, as we have unwind the marquee tax legislation passed under
learned many times in 2020, the virus can surprise to the President Trump in 2017. If a large, bipartisan
downside, timelines can change and the economy/ infrastructure bill never became law under Trump, is it
financial markets can swing on a dime. Perhaps another likely that the Biden administration would have more luck
“phase” of COVID relief talks could take place in Q1-2021 coaxing Republicans along? We suspect the answer is no.
even if a lame duck agreement is reached, and particularly
if Democrats take both Georgia Senate seats.
16 December 10, 2020 | 2021 Annual OutlookFigure 23
Joe Biden Economic Policy Platform
Tax Policy Spending Proposals
Individual Corporate
• Restore top individual tax rate to 39.6% • Raise the corporate tax rate to 28% • Tuition-free public college for families with incomes
from 37% for individuals earning over from 21%Figure 24
Figure 25
Projected Federal Revenues Average U.S. Tariff Rate on Imports
Percent of GDP, CBO Baseline Scenario Projections
19.0% 19.0% 6% 6%
Revenues: 2030 @ 17.8% Avg. Tariff Rate on Imports: Q3 @ 2.4%
18.5% Average Revenues 1970-2019 18.5%
5% 5%
18.0% 18.0%
4% 4%
17.5% 17.5%
17.0% 17.0% 3% 3%
16.5% 16.5%
2% 2%
16.0% 16.0%
1% 1%
15.5% 15.5%
15.0% 15.0% 0% 0%
19 20 21 22 23 24 25 26 27 28 29 30 69 73 77 81 85 89 93 97 01 05 09 13 17
Source: Congressional Budget Office and Wells Fargo Securities Source: U.S. Department of Commerce, U.S. Department of the Treasury
and Wells Fargo Securities
Given these expiring tax cuts, perhaps Biden could offer
If we are in fact correct about this, then Biden may be
some form of trade: Make some or all of these expiring tax
forced to focus his economic policy changes on areas
cuts permanent in exchange for some Democratic policy
where he has some unilateral power, such as regulatory
priority, such as an infrastructure deal, investments in
changes, federal court and cabinet appointments and
green energy, higher taxes on the wealthy/ corporations or
trade policy. However, even in these policy areas the
a moderate expansion/strengthening of the Affordable
changes will likely take place gradually over time. Take the
Care Act. A somewhat similar deal was cut during the fiscal
Federal Reserve Board as an example. There is currently
cliff negotiations in late 2012 in what was one of the few
just one vacancy on the Fed’s board of governors, and
pieces of economic policy legislation that passed in the
there is a chance that this position may be filled in the
divided government Obama years. In that instance, the
lame duck session of Congress by a Trump nominee, Judy
“Bush tax cuts” were made permanent for most taxpayers
Shelton. Jerome Powell’s term as chair is not up until
but were allowed to expire for high earners. These tax
February 2022, Vice Chair Clarida’s term runs until
increases were then paired with spending cuts, particularly
January 2022 and Randal Quarles’ term for vice chair for
for discretionary spending, via budget sequestration.
Supervision ends in October 2021. Thus, it could be the
Interestingly, Joe Biden played a key role in those
end of Biden’s first year in office before he appoints a
negotiations as vice president, and his Republican
single new member to the Federal Reserve board of
counterpart in the negotiations was current Senate
governors. And even then, proposing and implementing
Majority Leader Mitch McConnell. Since the Trump tax cut
regulatory changes can be a lengthy process.
expirations are still a ways off, we doubt this would be a
Day One move by the Biden administration. But, we
On trade policy, the Biden administration may make some
highlight it as a possible risk in what we suspect will
changes, but even here a wholesale reversal of Trump’s
otherwise mostly be a dull two years for economic policy
policies may not occur.2 Throughout his political career,
legislation.
Joe Biden has generally been more pro-free trade than
Donald Trump. Biden voted for NAFTA when he was a U.S.
Senator from Delaware, and he supported the Trans-
Pacific Partnership (TPP) while vice president. At present,
2
For further reading, see the report that was referenced in footnote #1
on page 6.
18 December 10, 2020 | 2021 Annual OutlookYou can also read