Economic Policy-Making Beyond GDP: An Introduction - EUROPEAN ECONOMY - European Commission
←
→
Page content transcription
If your browser does not render page correctly, please read the page content below

ISSN 2443-8022 (online)

                    Economic
                    Policy-Making
                    Beyond GDP:
                    An Introduction

                    Alessio Terzi

                    DISCUSSION PAPER 142 | JUNE 2021

 EUROPEAN ECONOMY

EUROPEAN            Economic and
                    Financial Affairs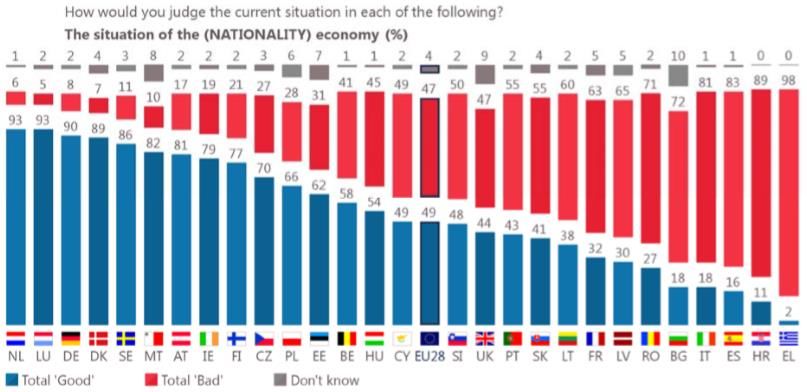
European Economy Discussion Papers are written by the staff of the European Commission’s
Directorate-General for Economic and Financial Affairs, or by experts working in association with them, to
inform discussion on economic policy and to stimulate debate.

DISCLAIMER

The views expressed in this document are solely those of the author(s) and do not necessarily represent the
official views of the European Commission.

The closing date for this document was June 2021.

Authorised for publication by Reinhard Felke, Director for Policy, Coordination, Economic Forecasts and
Communication.

LEGAL NOTICE

Neither the European Commission nor any person acting on behalf of the European Commission is responsible
for the use that might be made of the information contained in this publication.

This paper exists in English only and can be downloaded from
https://ec.europa.eu/info/publications/economic-and-financial-affairs-publications_en.

Luxembourg: Publications Office of the European Union, 2021

PDF     ISBN 978-92-76-23771-6          ISSN 2443-8022        doi:10.2765/166310         KC-BD-20-010-EN-N

© European Union, 2021
Non-commercial reproduction is authorised provided the source is acknowledged. For any use or reproduction
of material that is not under the EU copyright, permission must be sought directly from the copyright holders.

CREDIT
Cover photography: © iStock.com/shironosov
European Commission
Directorate-General for Economic and Financial Affairs

Economic Policy-Making Beyond GDP
An Introduction

Alessio Terzi

Abstract

Gross Domestic Product (GDP) started to be used during World War II to measure the material production
needs of the conflict. Throughout the decades, several issues have been identified with measuring economic
success via this single indicator. Most prominently, GDP fails to inform decision makers on how the
benefits of growth spread across the population, and to what extent these are concentrated in certain
pockets of society. Moreover, it does not take into account the depletion of natural resources and
environmental sustainability more broadly. As these have become increasingly pressing concerns for
policymakers and the public at large, over the past decade, statistical institutes (including Eurostat) have
been developing new complementary indicators, which have been embraced to various degrees by several
governments and international organisations. At the current juncture, the challenge is to bring these
indicators into more active policy-making in a sensible and manageable way. This paper therefore reviews
the pros and cons of some of the ongoing efforts, in Europe and beyond, laying out potential avenues for
future scholarship on the topic.

JEL Classification: B20, B40, D78, E01, E66, I30.

Keywords: GDP, sustainable growth, beyond GDP, wellbeing.

Acknowledgements: The author would like to thank Paul Brans for research assistance on parts of this
paper. Special thanks go also to João Nogueira Martins, Christine Frayne, Jakob-Wegener Friis, Reinhard
Felke, John Verrinder, Martin Hallet, Elizaveta Archanskaia, Maria Chiara Morandini, Stefano Filauro,
Alexandr Hobza, José Leandro, Antonino Barbera Mazzola, Manfredi Danielis, Steven Engels, and
participants to DG ECFIN lunchtime seminar for comments on earlier versions of this paper.

Contact: Alessio Terzi, European Commission, Directorate-General for Economic and Financial Affairs,
alessio.terzi@ec.europa.eu.

EUROPEAN ECONOMY                                                                    Discussion Paper 142
CONTENTS

1.   Introduction .........................................................................................................................................................5

2.   Background on GDP ......................................................................................................................................6

3.   Issues with GDP ..................................................................................................................................................7

4.   The urgency of complementing GDP ................................................................................................10

      4.1       Loss of trust ................................................................................................................................10

      4.2       Waning effect of the counter-arguments ..........................................................................12

      4.3       Worsening dynamics on things it does not measure ........................................................14

      4.4       COVID-19 corrupting GDP figures ........................................................................................15

5.   Varieties of GDP+ options .................................................................................................. 16

      5.1       Stocktaking of EU initiatives ...................................................................................................16

      5.2       How to move further beyond GDP ......................................................................................18

      5.3       Selected case studies.............................................................................................................21

6.   Conclusions ........................................................................................................................... 22

LIST OF BOXES

1.   Explaining Ireland’s astonishing GDP growth in 2015 .........................................................................................8

LIST OF FIGURES

1.   Gross Domestic Product (chain-linked volumes) ................................................................................................8

2.   National breakdown of Eurobarometer data ..................................................................................................11

3.   Correlation between GDP per capita and other variables across time in OECD countries .....................13

4.   Data on corporate profit shifting…………………………………….……………………………………………….14

5.   Climate change of exponential concern…………………………………………………………………….…….15

                                                                                       3
LIST OF TABLES
1. Income statistics by income group, 1980-2016……………………………………………………………………..14
2. Composition of the Chinese Green Development Index………………………………………………..……….22
REFERENCES
ANNEX I. EUROPEAN PILLAR OF SOCIAL RIGHTS
4“In theory, theory and practice are the same. In practice, they are not.”
Albert Einstein
1. INTRODUCTION
For over two centuries, and in particular since the end of World War II and what is commonly known
as the ‘Great Acceleration’, economic growth has heralded a period of prosperity in Europe. Moreover,
it has coincided with a wide improvement in living standards, a reduction in poverty rates, greater
resources for governments to provide public services, and also better local pollution control. However,
over the past few decades, the link between economic growth, as measured by Gross Domestic Product
(GDP), and ‘things that matter’ has waned somewhat. In particular, several advanced economies have
seen inequality levels increase, some indicators of wellbeing stagnate, and environmental degradation
worsen to a worrying extent. Some have concluded that 21st century problems, including climate change
and environmental degradation, are simply incompatible with economic growth (Smil, 2019; Jackson,
2009). Others have focussed more on issues related to GDP – the metric taking the pulse of economic
growth – the statistical computations behind it, and the central role it has taken in society and policy-
making.
Evidently, these reflections are ongoing also within the European Commission, whose 2019 Annual
Sustainable Growth Strategy starts by stating that ‘Economic growth is not an end in itself. An economy
must work for the people and the planet.’1 This call was recently echoed by the President of the European
Council, Charles Michel, who stressed that ‘We want sustainable growth that is measured in more than
GDP’, following a meeting with social partners in March 20212. These considerations are reflected in
the Porto Declaration of 8 May 2021, where EU Heads of State and Government welcomed the idea of
an alternative set of indicators to measure economic, social and environmental progress, supplementing
GDP as a welfare measure for inclusive and sustainable growth3. And evidently these calls fall in line
with the United Nations’ Sustainable Development Goals, designed to be a ‘blueprint to achieve a better
and more sustainable future for all’, and on which Eurostat provides a yearly update for what concerns
Europe, the most recent of which was released on 15 June 2021.
Within the context of the recovery from the Covid-19 socioeconomic shock, also thanks to
NextGenerationEU, and the European Green Deal, considered Europe’s ‘new growth strategy’4, the
quest for economic growth is not in the process of being shelved. However, ongoing efforts are focussed
on ensuring such growth is sustainable and inclusive (Terzi, 2020). This requires turning the attention
to how changes to GDP, or to the primary metrics that feed into policy-making, could improve the
quality of growth and the provision of shared prosperity. This paper intends to contribute to this debate
by reviewing the historical origins of GDP (section 2), the issues it carries (section 3), and some of the
origins of the current discontent with GDP (section 4). In Section 5, the paper then reviews ways in
which policy-making could move further ‘beyond GDP’, also introducing a set of principles to ensure
1
See SWD (2019) 444 final.
2
https://www.consilium.europa.eu/en/press/press-releases/2021/03/24/main-messages-from-the-tripartite-social-
summit-24-march-2021/
3
https://www.consilium.europa.eu/en/press/press-releases/2021/05/08/the-porto-declaration/
4
https://ec.europa.eu/commission/presscorner/detail/e%20n/ip_19_6691
5effectiveness, before showing how various countries, and the EU itself, have made progress on this
front. Section 6 provides some concluding remarks.
2. BACKGROUND ON GDP
Given how widely used GDP is nowadays, it may come as a surprise that until the 1930s, national
governments’ only aggregate statistical measurement of the economy was tax estimates, together with
some industrial production indices. As shown by Philippe Aghion, together with co-authors Céline
Antonin and Simon Bunel, censuses of available resources have been of interest to rulers throughout
human history (Aghion et al, 2021, p. 24-25). In the feudal age, for instance, this was largely based on
agricultural production, which served as a basis to calculate taxes. A precursor of national accounting
was invented in parallel in England and France in the second half of the seventeenth century. However,
national accounting was fully formulated only in the mid-twentieth century. As the Great Depression
hit, the U.S. administration realised that it simply had no precise information on what was happening to
people and the economy more broadly5. As such, in 1931, the U.S. Congress recognised the need for an
aggregate statistical picture of the economy, but it did not know how to produce one. For this purpose,
U.S.-based Nobel laureate Simon Kuznets was asked to develop such a metric.
As we saw, national income was not an entirely new concept: researchers in different countries had
made various estimates independently, but it was the first time that policymakers saw an urgency to use
it (Coyle, 2016). As the term suggests, this metric emphasised income: the money available to citizens
to spend or save. Through his new metric, Kuznets showed how Americans earned only half of what
they had earned before the crisis. Unsurprisingly, for President Franklin Delano Roosevelt’s
administration, raising national income and ensuring that people earned more became the top priority,
laying the policy ground for the New Deal.
However, when the U.S. entered World War II, the policy focus shifted from people’s incomes to the
material production needs of the war effort. Consequently, policymakers deliberately changed their
focus from national income to gross national product (GNP), which merely showed the total dollar value
of goods produced for final consumption. National income and GNP were numerically identical –
overall income generated is, by definition, equal to the value of goods and services produced. The crucial
difference is that GNP, and even more so Gross Domestic Product (GDP), which came to dominate
policy-making from the 1990s onward, does not take into account how income is distributed, whether
nationally or internationally6.
5
In a very interesting personal recount from the time, Italian industrialist Riccardo Gualino describes in Uragani.
Il romanzo della grande crisi del '29 (1932) the sheer amount of economic statistics available in the early 20 th
century. Relatively high frequency data was available on exports, imports, industrial production (especially of
cars), prices, and wages. While there was a broad realisation that all these individual aspects were connected, a
statistical framework to unify them and give an overall picture of the health of the economy was missing.
6
GNP is GDP adjusted for some cross-border income flows. Consequently, GDP is a pure production concept,
whilst GNP has an income dimension. GNP has been relabelled GNI in recent years. Among other things, Stiglitz
et al (2008) advocated in favour of moving back to a national income measure, rather than production, which is
already a better proxy for people’s material living standard. This relatively easy fix, given the statistic is already
collected in a variety of settings, can have important repercussions (see Box 1.).
6Kuznets argued against making this fundamental change in perspective permanent, and he urged
governments to return to focusing on income and its distribution. In wartime, it may be reasonable to
concentrate on the production of goods needed to win. However, in peacetime, he pointed out, the
production of goods is just a means to a higher end: the take-home income generated and available to
the people7. Kuznets was ignored. Shortly after the war, the U.S. government faced a new set of
challenges – reintegrating returning service members, rebuilding a devastated Europe, and responding
to the growing threat from the Soviet Union – that it prioritised over national individual incomes.
3. ISSUES WITH GDP
In recent decades, several issues have been identified with measuring economic success through GDP.
A single indicator, just like an economic model, aims to simplify reality while capturing the main
relevant dynamics at play. As such, it is always bound to be accused of oversimplification and
shortcomings. That being said, as discussed in the previous section, some of these are by design (e.g. a
focus on production rather than income), while others were unintended and probably a result of lower
policy concern at the time for certain issues (e.g. environmental externalities). In what follows, this
paper sketches out some of the most oft-cited problems with GDP, with no pretence of being
comprehensive.
First, GDP does not track inequality, or (relative) poverty. Measuring the aggregate GDP growth of an
economy says nothing about the distribution of the benefits of that extra growth. This has at least two
dimensions. The first is between individuals, meaning that aggregate GDP growth could be associated
with a concentration of income to millionaires and billionaires, while median income could be
stagnating (Cohen, 2018). The second is between individuals and firms. In particular, some evidence
points to the fact that – along with technical progress – firm concentration is growing (Diez et al, 2017),
while the labour income share is falling across advanced economies (Berger and Wolff, 2017). What
this suggests is that underneath the surface of positive aggregate GDP growth, larger firm profits may
not be trickling down to workers in their labour income, breaking a long-term pattern of stability in the
labour- and capital- share of income first identified by economist Nicholas Kaldor in the early 1960s
(Aghion et al, 2021).
Second, GDP does not account for environmental sustainability. A long-standing criticism of GDP has
been that it does not account for value destruction, such as when a country depletes natural resources
for immediate economic gain. GDP accounts positively for the repair of damages, such as the cleaning
up environmental pollution, which would be more welfare-enhancing if avoided in the first place. More
broadly, as stressed by Rohner (2018), ‘GDP tends to measure assets imprecisely, and liabilities not at
all’. Aside from depletion of natural resources, externalities in general, such as carbon emissions,
pollution and biodiversity loss etc., are not captured by GDP.
Another long-standing criticism of GDP has been its failure to account for the value of housework,
which links nowadays with the increasing blurring of lines between leisure and working time, a practice
that has increased since the COVID-19 pandemic and stay-at-home orders8. More recent criticisms of
7
In his own words, ‘the welfare of a nation can scarcely be inferred from a measure of national income.’ See
https://www.nber.org/chapters/c2258.pdf.
8
In 2013, the Galician Statistical Office (IGE) attempted to estimate home production, as part of satellite accounts
on the ‘extended economy’. Evidently, this creates a host of issues related to assumptions as to what to measure,
7GDP focus on the fact that it does not capture well the location of intangible assets, which leaves it
prone to fluctuations when companies engage in profit shifting (see Box 1). More broadly, GDP in its
current form does not fully capture the importance of data, which digital companies exploit in exchange
for providing ‘free’ services to consumers. As these digital services are free, they are not captured in
household consumption and GDP. Given that GDP provides the basis for estimates of national
productivity, this shortcoming related to the digital economy has been identified by some as the reason
for the poor productivity growth of advanced economies since the turn of the century (Brynjolfsson and
Collis, 2020).
BOX 1. EXPLAINING IRELAND’S ASTONISHING GDP GROWTH IN 2015
In 2016, the Irish Central Statistics Office announced a GDP growth rate of 26.3% for 2015 (32.4%
in current prices at the time), later revised to roughly 25% (see Figure 1). GDP growth for the euro
area was at 2.1% in 2015, the second and third highest, Malta and Slovakia, were growing at 10.7%
and 4.2% respectively, and the median growth rate of euro area Member States was 1.9%. This clear
outlier in Ireland’s growth illustrates one of the shortcomings of GDP.
Ireland had been using low corporate tax rates to attract multinational corporations, thus becoming a
European hub for the intellectual property of companies such as Google and Apple, and therefore its
GDP includes the resulting sales from the use of that intellectual property, especially since 2015.
Since then, this has inflated GDP figures, explaining in part the growth well above the euro area
average.
Figure 1: Gross Domestic Product (chain-linked volumes)
Source: Author based on Eurostat.
or where to draw the line between production and consumption. In that case, IGE assumed that activities that
could potentially be delegated, say washing the dishes, would be counted, while those that could not, say reading
a book, would not. Source: http://www.ige.eu/estatico/pdfs/s2/folleto_CSPD_2010_es.pdf.
8Though Ireland has seen strong growth regardless of the presence of multinational enterprises
(MNEs), the scale is not the same. While GDP growth was above 25% in 2015, including the sectors
dominated by MNEs, growth excluding these sectors was closer to 6%9. Ireland’s abnormally
spectacular GDP growth in 2015 mainly reflected economic activity taking place around the world
but that was sourced from intellectual property legally based in Dublin. This means, first, that growth
figures are not due to some equivalent structural improvement in Ireland’s economy; second, that the
benefits of this growth do not necessarily proportionally trickle down to (most) residents. In other
terms, GDP growth does not necessarily reflect a similar increase in Ireland’s material well-being.
Indeed, while GDP may be growing quickly, the levels of income flowing to the residents of Ireland
is not as fast. The OECD estimates that in 2015, Net National Income (a measure that excludes
distribution of profits from activities out of Ireland) grew by 6.4% compared to the more than 25%
GDP growth. In the same year, real disposable income (a domestic income measure) increased by
4.6%10. Finally, given that these MNEs have their activities largely based on intangible assets, GDP
growth may inaccurately reflect economic activity that has taken place, in part, elsewhere. Using
contract manufacturing, these MNEs based in Ireland can involve foreign agents to produce final
products using their intellectual property, but since the final distribution and sale of these products is
organised by the original MNE, the value added is accounted as being created in Ireland.
Evidently, as multinational companies moved operations to Ireland to benefit from low corporate tax
rates or other reasons, they also brought some 200,000 jobs11, which is a macroeconomically
significant number in a country where the whole workforce is just over 2 million people. Moreover,
they bring revenues for the Irish government, both through income taxes on MNE workers, but also
corporate tax revenues, which currently account for over 20% of tax receipts. This in turn allows the
government greater leeway to invest at the local level, including in public goods, and spread economic
benefits more widely. However, the point of this box is to illustrate that there are clear instances
where GDP does not accurately provide a commensurate snapshot of the improvement in wellbeing,
and the structure of Ireland’s economy makes it a case in point.
There are also instances where GDP and other indicators of economic wellbeing even move in
opposite directions. In 2020, when lockdown measures to control COVID-19 prevented one fifth of
Ireland’s workforce from working, GDP grew by 3.4% compared to 2019. Two measures that are
better at describing Ireland’s economy, Modified Domestic Demand and Modified Gross National
Income12 (GNI*) decreased, respectively, by 5.4% and 4.2%13.
9
European Commission Country Report Ireland 2019, p.7.
10
OECD (2016). Irish GDP up by 26.3% in 2015? Retrieved April 8, 2019, from
https://www.oecd.org/std/na/Irish-GDP-up-in-2015-OECD.pdf.
11
https://www.idaireland.com/newsroom/ida-ireland-announces-results-for-2020-and-tanaist.
12
GNI* reflects the income standards of Irish residents more accurately than GDP. It differs from standard GNI
in that it excludes, for example, the depreciation of foreign-owned, but Irish resident, capital assets (notably
intellectual property and assets associated with aircraft for leasing) and the undistributed profits of firms that
have re-domiciled to Ireland.
13
https://assets.gov.ie/132232/97b0a371-df91-42a0-ab77-bfb12df3597b.pdf.
94. THE URGENCY OF COMPLEMENTING GDP
Most of the issues and limitations with GDP outlined above have been appreciated for a long time. And
yet GDP has remained the primary metric of economic welfare and progress in most countries. Already
in 1973, Nobel-prize laureates William Nordhaus and James Tobin felt compelled to write a paper under
the title: ‘Is growth obsolete?’. Their answer: ‘we think not’ (Nordhaus and Tobin, 1973, p. 532). There
are reasons to suspect this persistent attachment to GDP comes down to the fact that, with all its
shortcomings, it proxies for resources available within society, which can then be re-directed towards
the priority of the moment, be it more or better schools, more (digital) infrastructure to reduce
commuting, more healthcare, greater investment in research and innovation, reduced local pollution,
and the likes. Because it focusses on the input side, or the means to achieve ends, it is somewhat shielded
from the (healthy) democratic debate on how to allocate resources between priorities, representing the
‘output’ side of the political process. This is also the reason why we are not talking about ditching
economic growth, or GDP, altogether. These positive structural properties of GDP are reinforced by the
fact that currently this metric is released with high frequency, quarterly or occasionally even monthly,
contributing to making it a good indicator of the business cycle (Coyle, 2016). Moreover, GDP is
computed according to internationally agreed standards, making it ideal for cross-country comparisons.
However, all this does not mean that GDP cannot: (i) be improved to make it a better metric to proxy
for the size of the economy; and (ii) be complemented with indicators that give us a sense of the quality
of growth, which would inform the debate on how to allocate resources in a sustainable and equitable
way. It is precisely because we are talking of complementation that this paper speaks of this policy
challenge as ‘GDP+’. If the issues with GDP have long been known, and economic growth provides the
means to achieve the ends of prosperity and wellbeing, the question naturally arises as to why a renewed
push to move policy-making beyond GDP is necessary at the current stage. The answer relates to several
points.
4.1 LOSS OF TRUST
‘A gulf of incomprehension between the expert certain in his knowledge and the citizen
whose experience of life is completely out of synch with the story told by the data…
nothing is more destructive of democracy…
people believe that they are being lied to…
that they are being manipulated’.
(French President Nicolas Sarkozy in Stiglitz, Sen and Fitoussi, 2009)
In the quote above, French President Nicolas Sarkozy was to a certain extent prescient in drawing
attention to the consequences in a democracy of a growing gulf between the statements, assertions and
beliefs of the experts and government officials, on one side, and the lived experiences of significant
numbers of citizens, on the other14.
14
It is for this very disconnect between official statistics and perception that President Sarkozy asked economists
Joseph Stiglitz, Amartya Sen, and Jean-Paul Fitoussi in 2008 to reflect on how the wealth and social progress of
a nation could be measured, without relying on the unidimensional GDP measure, as part of the Commission on
the Measurement of Economic Performance and Social Progress. The report, published in 2009, has kickstarted
wide-reaching discussions and tangible progress on the Beyond GDP agenda at global level.
10By means of an example, Figure 2 below illustrates opinions of EU citizens on the situation of their
national economy, collected by Eurobarometer in the spring of 2018, before the beginning of a softening
of the economic cycle in late 2018, and evidently before the sharp recession associated with the COVID-
19 pandemic (European Commission, 2018a). In March 2018, when the data was collected, all EU
countries were experiencing positive quarterly GDP growth, but also all economies had expanded in
real terms in 2017.
Figure 2. National breakdown of Eurobarometer data
Source: Standard Eurobarometer 89, Spring 2018.
However, in roughly half the EU member states, the perception of the (then current) situation of the
economy was negative. Some countries particularly stand out. In the UK, for example, 47% of people
had a negative perception of the current situation of the economy, when GDP had expanded by 1.8% in
2017, growth had been positive for eight years, and the level of GDP was way above its pre-2008 levels.
In France, only 32% of citizens had a positive perception of the economy, when GDP growth in 2017
was positive, and roughly in line with the long-term average (at 2.2%). In Spain, the divergence of GDP
statistics and people’s perception is even more striking: only 16% thought the economy was doing well,
in a country where GDP had expanded by more than 3% per year for three preceding years.
If a citizen’s perception is that the economy is not doing well, and the institutional or government
rhetoric, based on aggregate GDP data, is positive, this is likely to increase distrust in experts. This has
repercussions also on support for EU integration. In a detailed study conducted at granular regional
level, Dustmann et al (2017) showed how populism, distrust in political institutions, and anti-EU
sentiment are closely intertwined. Moreover, they concluded that ‘If support for European integration
is to be maintained, the EU and national political systems must deliver effective responses to the malaise
facing their societies, and the grievances felt, in particular, by older individuals who do not feel that
they have shared fully in the fruits of economic growth’. As a further anecdote, Sandbu (2020, p. 188)
reports that when a British academic – Anand Menon – participated in a townhall meeting in Newcastle
and tried to argue that by leaving the EU, the UK would see its GDP fall by at least 2%, a shouted
response came out of the audience: ‘that’s your (bloody) GDP, not ours’. Sandbu then uses this fact to
11introduce an analysis showing how growth has become more heterogeneous across regions and
individuals since the 1980s across Western economies.
This is a problem that cannot be left unaddressed, especially at a time when, from the pandemic to
climate change, expertise is more fundamental than ever in policy-making. To a certain extent, the
sudden resurfacing of the movement questioning the very concept of economic growth, known as
‘degrowth’, after its first appearance in the early 1970s, could be read as yet another consequence of the
widespread feeling that GDP growth does not move hand in hand with progress, at least for many people
(Hickel, 2020).
4.2 WANING EFFECT OF THE COUNTER-ARGUMENTS
Criticism of GDP goes back a long time. Most notoriously, U.S. Presidential candidate Robert Kennedy
in 1968 underlined how ‘the gross national product does not allow for the health of our children, the
quality of their education or the joy of their play. It does not include the beauty of our poetry or the
strength of our marriages, the intelligence of our public debate or the integrity of our public officials.
[…] it measures everything in short, except that which makes life worthwhile’.
One counter-argument to this line of thinking, however, has always been that while GDP might not
mechanically account for all the crucial elements that make ‘life worthwhile’, it correlates very highly
with all of them (Pritchett and Summers, 1996). While it is definitely true that richer countries tend to
enjoy higher quality of life across most indicators compared to developing countries, precisely because
GDP provides the means to achieve societal ends, it is likely that above a certain level of wealth, the
correlation tends to wane somewhat. Indeed, Figure 3 shows the correlation in OECD countries across
time between real GDP per capita and four indicators likely to contribute significantly to the quality of
life. Across health outcomes, crime, and education, GDP per capita seems to be increasingly less
associated with what ‘makes life worthwhile’. This evidently speaks to the wider point that GDP per
capita does not co-move with measures of self-reported happiness, something known as Easterlin’s
Paradox, after the economist who discovered this empirical regularity (Layard, 2006). All in all, there
seems to be some backing in favour of complementing GDP readings with a set of indicators of
wellbeing, especially in advanced economies where the correlation between the two tends to weaken.
12Figure 3. Correlation between GDP per capita and other variables across time in OECD countries
Source: World Bank, OECD, own calculations.
Another counter-argument that is often used to justify the use of GDP as a catch-all metric is that one
should aim to ‘maximise the size of the pie’, in economics jargon. This is because subsequently a
government can, in principle, appropriate resources and target them towards societal goals, e.g.
improving health, education, culture, or any policy priority, as expressed in particular through the
democratic (electoral) process. However, this counter-argument also seems to have lost some steam on
the back of (financial) globalisation, as it has been shown that governments are increasingly less capable
of appropriating resources through the tax system. In the absence of a significant further effort to recoup
profits shifted to low tax jurisdictions, more growth does not necessarily imply commensurably more
resources for the public benefit. This might be particularly true in the EU, as displayed in Figure 4,
which shows the degree of tax revenue lost due to profit shifting.
13Figure 4. Data on corporate profit shifting
Note: data for 2015.
Source: Tørsløv et al (2018).
4.3 WORSENING DYNAMICS ON THINGS IT DOES NOT MEASURE
Another reason why it might now be appropriate to embrace more forcefully the ‘beyond GDP’ agenda,
even if the limitations of GDP have been long known, is that some of the things it does not measure are
becoming increasingly pressing problems, or at least they are perceived that way. In a recent Special
Eurobarometer on fairness, inequality, and social mobility, the overwhelming majority of respondents
thought that income differences were too large (84%), ranging from 96% in Portugal and 92% in
Germany to 59% in the Netherlands (European Commission, 2018).
Table 1. Income statistics by income group, 1980-2016
Income group Cumulative real income growth Share of income growth
per adult captured by group
Full population 40% 100%
Bottom 50% 26% 14%
Middle 40% 34% 38%
Top 10% 58% 48%
Top 1% 72% 18%
Top 0.1% 76% 7%
Top 0.01% 87% 3%
Top 0.001% 120% 1%
Source: WID.world (2017).
Income data collected by French economist Thomas Piketty and co-authors displayed in Table 1 show
how median income (bottom 50%) in Europe increased by 26% over the period 1980-2016, less than
half the increase experienced by the top decile (58%). Put differently, of the overall national income
expansion, 14% accrued to the bottom 50%, and almost 50% to the top 10%.
14Using data going back to the 1900s, others have shown how regional convergence in Europe ended
around 1980 and the gap has been growing since then, with capital regions and declining industrial
regions at the two extremes (Roses and Wolf, 2018).
Likewise, climate change, which was unknown when GDP was first created, is becoming an
increasingly pressing issue, as temperatures in the northern hemisphere are displaying a hockey stick
pattern (Figure 5).
Figure 5. Climate change of exponential concern
Source: NASA GISS, updating Mann et al (1998).
According to Eurobarometer data published before the COVID-19 pandemic15, around three-quarters of
EU citizens (74%) consider climate change to be a very serious problem and more than nine in 10 (92%)
see it as a serious problem (European Commission, 2017). Climate change was seen as the third most
serious global problem, after poverty, hunger and lack of drinking water (28%) and international
terrorism (24%). Along similar lines, for leaders surveyed for the 2021 edition of the World Economic
Forum's Global Risks Report, environmental threats dominate the list of concerns for the fifth year in
row in terms of likelihood, and are second of the list in terms of impact only behind infectious diseases
in the year of a pandemic.
4.4 COVID-19 CORRUPTING GDP FIGURES
As highlighted by the political economist Daniel Mügge16, 2020 is likely to be a particularly challenging
year for GDP statistics. Even normally, GDP relies on a host of early estimates, which face significant
revisions down the line. In 2020, due to the COVID-19 pandemic, stay-at-home orders, teleworking
arrangements, and a broad sudden re-organisation of the economy, these statistics are particularly likely
15
More recent Eurobarometer data collected during the pandemic, unsurprisingly sees the ‘economic situation’
and ‘health’ taking the lead in terms of citizens’ preoccupations and priorities for the EU.
16
Mügge, D., ‘Scrap 2020 GDP data to find a path out of the harm done by coronavirus’, Financial Times, 3
January 2021.
15to be exposed to inaccuracy and large revisions. Likewise, correcting for seasonality will be
problematic, as is the case after large macroeconomic shocks. As such, this makes the argument that
complementary indicators, perhaps less reliant on national accounts, become all the more important to
paint an accurate picture of the economy, and citizen’s wellbeing more broadly, especially when
charting the path to recovery.
5. VARIETIES OF GDP+ OPTIONS
In the aftermath of the first Stiglitz Report (2009), the Commission has taken up work to start moving
beyond GDP. In its early stage, this has meant identifying and developing relevant and timely indicators
through Eurostat. In more recent years, however, these indicators have increasingly being featured as
part of the Commission’s strategy and country surveillance within the context of the European Semester.
This work has been carried out in consultation with the OECD, which has put together an extensive and
in-depth work stream under the heading of the ‘Better Lives Initiative’. Moreover, the Commission’s
efforts have recently been informed by the work carried out by Kate Raworth and her team on the so-
called ‘Doughnut Economics’ approach, including through a set of conferences and workshops
(Raworth, 2017).
5.1 STOCKTAKING OF EU INITIATIVES
It is worth underlining that, although GDP remains central to much of the European Commission’s
economic analysis and communication, several steps have been taken over the last decade to
acknowledge the ‘beyond GDP’ agenda and lay the groundwork for the collection and publication of
new data on relevant variables that are not captured by GDP alone.
More specifically, in 2009, the Commission produced a Communication ‘GDP and beyond: Measuring
progress in a changing world’17, which outlined a roadmap to complement GDP with high-level
indicators reflecting issues such as environmental protection, quality of life and social cohesion. The
roadmap also placed an emphasis on the timeliness and robustness of these indicators, which are
necessary to inform policy-making. As part of this work stream, Eurostat developed several new
indicators measuring income inequality (as for example the S80/20 index), material conditions, healthy
life years, Environmental Economic Accounts, and others, much of which is based on its European
Statistics on Income and Living Conditions (EU-SILC) annual survey18. Since 2015, a first set of Quality
of Life indicators was published by Eurostat, alongside Eurofund’s European Quality of Life Surveys
published every four years (2003, 2007, 2012, 2016).
As a result, in 2013, the Commission Staff Working Document ‘Progress on GDP and beyond actions’19
concluded that ‘several new indicators have been developed and produced, but they often remain
compartmentalised in their respective policy areas. Efforts are still needed to produce a comprehensive
17
COM (2009) 433 final.
18
EU-SILC is one of the most extensive surveys in the EU. It covers more than 130,000 households and 290,000
individuals in all Member States.
19
SWD (2013) 303 final.
16basket of top-level indicators complementing GDP and being released, when possible and relevant, at
the same time’.
The development of the new indicators helped to monitor progress under the Europe 2020 strategy for
growth and jobs, covering not only employment but also climate change, education, R&D, poverty and
social exclusion. This was used as a reference framework for activities at EU and at national and regional
levels. EU governments set national targets to help achieve the overall EU targets, and reported on them
as part of their annual national reform programmes.
The European Pillar of Social Rights (EPSR), another initiative aimed at complementing our
understanding of the inclusiveness of an economy, was proclaimed by the European Parliament, the
Council, and the Commission in November 2017. Since then, the European Commission has made
efforts to embed the 20 rights and principles, ranging from gender equality to access to essential
services20, in its actions. Based on these, the Commission, with the consent of the Council, introduced
three ambitious GDP+ headline targets for policy action to be achieved by 2030, on dimensions such as
employment, training, and people at risk of poverty and social exclusion. On top of linking legislative
proposals (e.g. the working time directive) to the EPSR, the Commission has created an online
scoreboard21 where a wide array of relevant indicators can be compared across Member States and time
(see Appendix 1). Moreover, within the context of the European Semester, each Country Report featured
a box on the EPSR under the ‘Labour Market, education, and social policies’ section, providing a
qualitative description of developments across 14 indicators, feeding into the preparation of the Country
Specific Recommendations. The time series of a more detailed set of indicators not only pertaining to
the Social Scoreboard but also related to education, social and health inclusion, and green growth are
contained in the Annex of each Country Report. While in 2020 the Semester had to be temporarily
adapted in light of the launch of the Recovery and Resilience Facility, the Commission’s assessment of
the national Recovery and Resilience Plans retains the analysis of the EPSR indicators.
More recently, the von der Leyen Commission has pledged to integrate the United Nations’ Sustainable
Development Goals (SDG) within the European Semester of economic policy coordination. The
Commissioner for the Economy, Paolo Gentiloni, has been put in charge of the task, which started with
the 2020 Semester cycle, where the Annual Growth Survey was relabelled Annual Sustainable Growth
Strategy and structured around four dimensions: environmental sustainability, productivity, fairness,
and macroeconomic stability. The 2020 Country Reports identified the policies and challenges related
to the SDGs, focussing on those areas that interlink with economic and employment policies and
featuring annexes setting out the individual Member State’s performance in relation to the sustainable
development goals. This builds on the work conducted by Eurostat, which has been producing for now
five years an annual detailed assessment on how the EU and each Member State is performing on over
100 policy indicators associated with the seventeen SDG dimensions22. This process of integrating the
SDGs in the European Semester process was paused due to the pandemic and the ensuing adjustment
of the semester, but the assessment of the Commission of Member States’ Recovery and Resilience
Plans includes an assessment of how the Country Specific Recommendations issued in 2020 have been
20
For a complete list, refer to: https://ec.europa.eu/commission/priorities/deeper-and-fairer-economic-and-
monetary-union/european-pillar-social-rights/european-pillar-social-rights-20-principles_en
21
See: https://composite-indicators.jrc.ec.europa.eu/social-scoreboard/
22
Eurostat (2021), Sustainable Development in the European Union.
17addressed, which (where relevant) reflects the UN SDGs23,24. Moreover, the Commission Staff
assessments also outline the performance of each Member State with respect to SDGs with reference to
the four dimensions underpinning the Annual Sustainable Growth Strategy. Reflections on the future
scope and timeline of the European Semester to merge the monitoring under the RRF and the
coordination of economic policies are currently ongoing and will also include the further integration of
the SDGs.
Evidently, when taking the view that the European Green Deal is Europe’s new growth strategy, the
indicators associated with progress on this policy package can be seen as complementing GDP, and
therefore part of the GDP+ agenda. For instance, information on Greenhouse Gas emissions, which are
set to reach net zero by 2050, can be read as characterising the quality and sustainability of economic
growth.
Finally, the EU’s effort to embed strategic foresight within its operations has come with a wide set of
dashboards to monitor resilience across a variety of indicators, including on the geopolitical and social
dimension25.
5.2 HOW TO MOVE FURTHER BEYOND GDP
In the current environment, where greater attention is being devoted to making sure economic growth
proceeds hand in hand with the achievement of social and environmental priorities26, and is therefore
sustainable and inclusive, a further push is warranted on integrating complementary indicators into
active policy-making (Deaton, 2020)27. However, how best to do so remains an open question. In
particular, the challenge is to make sure that GDP+ indicators truly contribute to shaping political
decisions and policy-making. Building on the opening quote of this paper, it is time to move further
from theory to practice.
With this objective in mind, two broad approaches could be followed. The first, which is less
controversial, but also at risk of being less impactful; and the second, bolder, which is most probably
harder to engineer, both technically and politically, but more likely to steer policy-making.
Less controversial: Under this scenario, moving further beyond GDP would entail publishing more
comprehensive tables of complementary indicators. While catering to the needs of a wide array of
stakeholders, very wide scoreboards are more exposed to cherry-picking by decision-makers interested
in showcasing positive developments to the public, rather than effectively steering policy in a specific
direction. The UN’s SDGs, for example, were built following this approach, and consist of 169 policy
23
See Art. 18 (4) (b and c), Regulation (EU) 2021/241.
24
COM (2020) 500 final.
25
See COM(2020) 493 final.
26
A survey run in 2020 by GlobeScan-Ethical Markets across 11 countries, both advanced and emerging, found
a staggering 72% majority in favour of setting on equal footing economic (growth) statistics, with health, social
and environmental statistics. Source: https://globescan.com/global-survey-most-prefer-expanding-gdp-health-
education-environmental-data/
27
In October 2019, the Council of the EU under Finnish presidency published conclusions which stated that the
EU should go beyond currently used indicators, noting in particular that: ‘[…] it is widely accepted that GDP
alone does not provide a comprehensive picture of people’s wellbeing. Therefore, further collaborative and
intensified efforts across sectors are required to make better use of and improve existing instruments’.
18targets and 200+ indicators for global monitoring. When discussing the extensive Quality of Life data
already currently produced, European Commission (2013, p. 17) lamented how ‘not much weight is
given to these indicators in assessments of the overall economic performance of a country or region,
and they are rarely commented on in the media.’
Bolder: This approach entails selecting very few indicators that would offer insightful complementary
information with respect to GDP growth figures. As such, they should be published and read (quasi-)
synchronous with GDP figures to have a better understanding of underlying dynamics. As discussed by
European Commission (2009), ‘by looking at it [environmental indicator] alongside GDP and social
indicators, citizens would be able to assess whether EU and national policies – together with citizens'
and business efforts – deliver the level of environmental protection they expect and whether progress is
achieved in a balanced way towards social, economic and environmental goals.’ Simple, concise, single
figures are an essential tool to trigger policy debate. Evidently, however, this approach is harder to
engineer as it remains exposed to potential gaps, or accusations of arbitrary selection of indicators. In
the words of Chancel et al (2014), ‘a dashboard with a limited number of indicators is perceived as a
compromise between the media impact that Beyond-GDP indicators can have (the need to have a
reduced number of indicators) and their statistical robustness (the difficulty of aggregating several
dimensions into a single indicator)’. As such, in the end, as Voltaire said in his Dictionnaire
philosophique (1770), this is an instance where it is possible that ‘the best is the enemy of the good’.
It is crucial to underline at this stage that a decision on which indicators should be published is not only
a matter of (visual) communication. Instead, as underlined by Stiglitz (2018), what you measure
determines what you do. The micro-evidence in this respect is plentiful and refers to the so-called
‘nudging’ literature, which describes how people’s behaviour is altered by the provision and framing of
information, without altering economic incentives or forbidding options (Thaler and Sunstein, 2017).
On top of this, Sheffer et al (2018) show how politicians are just as subject to bounded rationality or
choice anomalies as non-politicians. In other words, decision-makers are exposed to modifying their
actions based on the set of variables with which they are presented. Finally, and perhaps more
intuitively, few key indicators displayed synchronous with GDP figures are more likely to be picked up
by the press, hence framing the public debate in a certain direction, and in turn affecting a decision
maker’s or politician’s behaviour and priorities28.
When trying to identify a concise set of relevant indicators to complement GDP growth, there are some
properties that are worth keeping in mind if the objective is to have them incorporated into policy
actions. Current and future scholars developing beyond-GDP frameworks, could try to factor in these
desirable properties. More specifically:
1. Limiting modifications of existing metrics: While there is a wide array of metrics available to
display developments in a specific area (e.g. inequality), it is worth trying to minimise the
introduction of completely new concepts, to ensure familiarity, and avoid alienating a non-
technical public.
2. Timeliness in publication: If the objective is to use GDP+ metrics within the context of policy-
making, the frequency and timeliness of publication becomes of paramount importance, as
recognised by European Commission (2009) but also by Buti and Nogueira-Martins (2008). In
other words, statistics that are published only yearly, and with a one- or two-year lag, as happens
28
Stakeholder consultations carried out as part of the EU-sponsored BRAINPOoL FP7 project confirmed this
finding.
19with several wealth concentration metrics for instance, make it difficult to organise a rapid
policy response to cyclical developments, rather than longer-term structural trends. Relatedly,
some variables are very static, making regular or quarterly updates rather pointless. Such a
characteristic would also suggest that they are poor candidates as GDP+ metrics, and possibly
more useful in other contexts.
3. Easy to understand conceptually: As discussed by Lepenies (2018), part of the power of GDP,
and the reason why it has endured so long as a primary economic indicator, is that it is
conceptually easy to understand. This is true even if computing it is a complex endeavour,
resting on a wide set of assumptions. Complementary indicators should ideally display a similar
feature. For example, the Gini coefficient would not really fulfil this property, which is why it
has been displaced in terms of media attention by more recent indicators of income and wealth
concentration like the ‘top-1%’ approach, which is more intuitive for non-technical audiences.
4. Should provide a clear sense of direction: Complementary indicators should act as a compass
for policymakers in need of direction. As such, the direction should be clear, ideally as
something you would want to maximise/minimise. If this is not the case, every release of the
indicator will spark a discussion about optimal levels, diluting the message of the data point
and fostering confusion. Evidently, indicators of inequality are particularly exposed to this
dilemma, given that the objective is not to bring inequality to zero but rather to keep it within
low but widely accepted levels, which most likely differ based on cultural and national
sensitivities.
5. Should not always move hand in hand with GDP: The indicators are supposed to complement,
not substitute GDP, which remains a relevant metric of economic activity. Given that we want
to be as parsimonious as possible in the selection of additional indicators, they should as much
as possible convey information that is not captured by GDP. For example, should it so happen
that positive/negative GDP growth always yields bottom 20% income growth/contraction, then
the latter would be less compelling as a complementary metric as it would imply that ‘the tide
does indeed lift all boats’.
6. Geographical coverage: Clearly, the new complementary indicators should be standardised and
not based on ad-hoc calculations on a national basis. They should therefore be based at the very
least on databases of Eurostat, and even better if available at international level, through for
example the World Bank Database. For instance, from a European perspective, it remains an
issue that some of the great data assembled by the OECD does not cover the whole EU, as some
EU Member States are not members of the OECD.
A natural reaction of several international organisations when trying to navigate the trade-off between
having single figure indicators for clarity of messaging, but being as encompassing as possible in
pursuing the ‘beyond GDP’ agenda, has been to generate new composite indicators. Examples include
the UN’s Human Development Index, the World Economic Forum’s Inclusive Development Index, or
the OECD Better Life Index. However, it is worth underlying that these indicators are developed for
international comparisons and benchmarking, not for real-time policy-making purposes. This is
because: (i) they carry implicit value judgment within them that each decision maker or elected
politician would question29 (e.g. giving (un-)equal weighting to environment and inequality); (ii) do not
29
Reviewing a set of case studies, Chancel et al (2014) come to the logical conclusion that ‘Associating Beyond-
GDP indicators with a political agenda increases the likelihood that they will be effectively used in policy making,
by the media and by the public at large, but the longevity of Beyond-GDP indicators that have ‘political leanings’
20give a good immediate sense of what is happening, and what determined a change in the index. This is
particularly the case as the underlying variables need normalisation to fit together (Terzi et al, 2021). In
the end, as stressed above, one of the positive properties of GDP, which have made it so successful, is
exactly that it is broad in what it encompasses and is also internally consistent.
5.3 SELECTED CASE STUDIES
Several countries have decided in some way or form to go beyond GDP in the recent past. Interestingly,
as noted by Chancel et al (2014), ‘Promoting indicators to complement GDP is no longer the preserve
of any specific political party’, but rather part of a shared agenda, while disagreement arises as to how
to do so. This section reviews selected case studies to illustrate a range of possibilities when trying to
expand in practice the set of indicators considered for economic policy-making. Well-being indicators
are mostly used at the policy-formulation stage (e.g. in New Zealand) or at the evaluation stage. In
France, Italy, and Sweden, indicators are commonly used at the agenda-setting stage, with parliamentary
reporting based on these indicators at the start of the budget process. The number and type of indicators
used varies significantly across countries. Generally, the number is small if indicators are to be used for
policy-setting (e.g. France, Italy), and large if they are used for ex post evaluations (e.g. in the UK). In
several countries, the initiative has been spearheaded by the Ministry of Finance (New Zealand, Sweden,
Italy, and Australia).
1. France: Ever since the publication of the Stiglitz Report (2009), France has been heavily involved
in the measurement of well-being. Approved in April 2015, law 411 requires the government to
submit an annual report to Parliament on progress on 10 indicators reflecting the country’s
material-, social- and inclusive-, and environmental- well-being. The report, which should include
an assessment of the impact of the main reforms envisaged on these indicators, can be debated in
Parliament upon request by the government.
2. The Netherlands: The annual ‘Monitor of well-being’ produced by the National Statistical Institute
forms the basis of Cabinet considerations on the state of well-being in the country. These then
become part of the accountability debate in the House of Representatives (in May every year for
‘Accountability Day’). In addition, the policy assessment agencies in the country (the Netherlands
Bureau for Economic Policy Analysis, the Netherlands Environmental Assessment Agency, and
the Netherlands Institute for Social Research) are asked to conduct a periodic exploration of well-
being, based on the monitor.
3. Italy: Building on the National Statistical Institute’s Measure of equitable and sustainable well-
being (BES), 12 indicators are currently forecast and discussed within the context of the budget
law (‘Legge di Bilancio’) as of 2018. These include, among others, the S80/20, greenhouse gas
emissions and disposable income. One of the criteria for selection was that they had to be
forecastable over a short (three-year) horizon, and for this reason, subjective well-being was
excluded. Moreover, the Italian Ministry of Finance has indicated its intention to monitor the
Recovery and Resilience Plan based not only on the basis of macroeconomic and employment
indicators, but also through the BES scoreboard.
remains in question’. If reaching a shared sustained agreement on ‘the things that matter’ is already hard, weights
assigned to different dimensions are very likely to depend on political leaning. Entrenching weights in an indicator
would therefore make it problematic at each change of political power following an electoral cycle.
21You can also read