European Construction Sector Observatory - Country profile Ireland June 2018
←
→
Page content transcription
If your browser does not render page correctly, please read the page content below

European Construction
Sector Observatory
Country profile Ireland
June 2018
European Construction Sector Observatory

                                                      In a nutshell

The number of enterprises in the broad construction sector in Ireland           The new Capital Investment Plan for 2016-2021 sets out a compre-
were estimated at 78,833 in 2016 6.7% below the 2010 level. More-               hensive EUR 42 billion framework for infrastructure investment,
over, due to the crisis, investment in construction fell by 40.2% over          comprising a EUR 27 billion investment from the Exchequer, as well as
2008-2016, with investment in dwellings and non-residential construc-           EUR 500 million from public-private partnerships (PPPs) and EUR 14.5
tion and civil engineering dropping by 58.6% and 20.2%, respectively.           billion of state-owned sector investment. Specifically, transport proj-
The production of construction of buildings is also recovering and              ects will benefit from EUR 9.6 billion, with EUR 6 billion devoted to the
recorded a 38.7% increase in 2016 compared to 2010.In 2016, the                 road network and EUR 3.6 billion to public transport.The total capital
broad construction sector is estimated to have employed 169,742                 expenditure under the Plan was recently brought up to EUR 47 billion.
persons, a 15.3% increase compared to 2010 and showing a strong
recovery from the low levels recorded in 2012.                                  Due to the significant energy usage and emissions from the residen-
                                                                                tial building sector, the energy efficient renovation of domestic
                                                                                buildings is a priority of the government. This is primarily addressed
      Number of enterprises in the                                              through the Better Energy Programme, which includes government
        broad construction sector                                               schemes providing grants to households for the energy efficient
                                                                                upgrade of their homes, and the Home Renovation Incentive (HRI),
        Investment in construction                                              a tax credit on expenses for repair and renovation works. The Irish
              evolution 2008-2016                                               construction sector suffers from a shortage of skilled labour, requiring
                                                                                an additional 112,000 workers by 2020. Initiatives including the
                                                                                National Skills Strategy 2025 and Action Plan for Jobs aim to train
The Irish housing market experienced one of the longest house price             and reskill workers, create 50,000 new apprenticeships and 200,000
booms in Europe, with prices for existing properties soaring by 268%            net jobs by 2020.
until 2007. The onset of the crisis led to a housing market crash, with
the house price index dropping by 53.0% over 2007-2012. The market                   The revival of the Irish construction sector,
started recovering in 2013 and residential construction has been                     underway since 2013, is expected to continue
improving, with the number of dwelling starts increasing from 8,088
                                                                                     over the coming years, with output being fore-
in 2015 to 11,320 in 2016, and dwelling completions from 8,301 in 2013
to 13,376 in 2016. However, this is significantly below the 2006 peaks in
                                                                                     cast to grow at an annual average of 9% over
housebuilding, and is insufficient given the annual need for 41,636 new              2017-2020, reaching EUR 20.2 billion in 2020.
properties. To tackle the housing shortage, the government launched
the Rebuilding Ireland Action Plan, aiming to deliver 47,000 new social
homes by the end of 2021, and an average of 25,000 new dwellings per            The revival of the Irish construction sector, underway since 2013, is
year. Moreover, the National Asset Management Agency (NAMA) plans               expected to continue over the coming years, with output being fore-
to fund the delivery of up to 20,000 new units until 2020.                      cast to grow at an annual average of 9% over 2017-2020, reaching EUR
                                                                                20.2 billion in 2020. This will be driven primarily by residential construc-
                                                                                tion, which will see a 10.5% and 14.8% growth in 2017 and 2018 alone.

         The house price index
          evolution 2007-2012

                                                                            2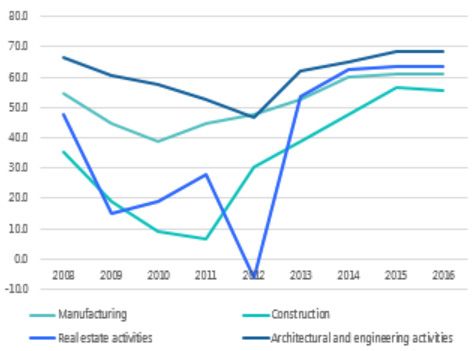
Country Fact Sheet Ireland

                                                                     1
                                                                Key Figures

The number of enterprises in the broad construction sector in                             Figure 2: Volume index of production in construction sector in
Ireland was estimated at 78,833 in 2016 1(Figure 1). Companies in the                     Ireland over 2010-2016 (2010=100)
narrow construction sector represented 69% of the total, followed by
                                                                                           140
real estate activities (17.6%), architectural and engineering activities
                                                                                           130
(10.7%) and manufacturing (2.8%). The overall number of enterprises
                                                                                           120
in the broad construction sector in 2016 was 6.7% above the 2010                           110
level, with the real estate activities sub-sector experiencing the highest                 100
increase (21.8%), followed by architectural and engineering activities                      90
(8.3%). Companies in the manufacturing and construction sub-sectors                         80
saw a 2.5% and 3.4% increase in numbers, respectively.                                      70
                                                                                                     2010      2011         2012         2013       2014         2015       2016
                                                                                                     Volume index of production - construction
Production in construction of buildings dropped drastically between
                                                                                                     Volume index of production - construction of buildings
2010 and 2012 (-23.2.3%) (Figure 2), but started to recover after 2013,                              Volume index of production - construction of civil engineering works
increasing with 38.7% from the 2010 level by 2016. Similarly, produc-                                                                                        Source: Eurostat, 2017.
tion in civil engineering fell by 33% in2011 and despite a steady
increase over 2012-2015, it was still 1.4% below the 2010 level by 2016.                  Figure 3: Value added in the construction sector in Ireland in 2016
                                                                                          (EUR m)
       Production in construction of                                                      11,000
                          buildings                                                       10,000                                         1,704
               evolution 2010-2016                                                         9,000
                                                                                           8,000                                         1,657
                                                                                           7,000
                                                                                           6,000
   Figure 1: Number of enterprises in the construction sector in                           5,000
   Ireland over 2010-2016                                                                  4,000                                         6,465
   60,000                                                                                  3,000
                                                                                           2,000
   50,000                                                                                  1,000
                                                                                                                                           800
                                                                                                 0
   40,000
                                                                                            Architectural and engineering activities        Real estate activities
   30,000                                                                                   Construction                                    Manufacturing
                                                                                                                                                             Source: Eurostat, 2017.
   20,000

   10,000
                                                                                          Figure 4: Gross value added as a share of GDP in the construction
        0                                                                                 sector in Ireland in 2016 (%)
               2010        2011   2012   2013       2014        2015        2016
       Manufacturing                       Construction
       Real estate activities              Architectural and engineering activities
                                                           Source: Eurostat, 2017.

                                                                                                                                                                                5.7
In 2016, the total value added of the broad construction sector
was estimated at EUR 10.6 billion (Figure 3), with the construction
                                                                                                                                   2.6
sub-sector having the largest share (60.8%, i.e. EUR 6.5 billion), followed
by architectural and engineering activities (16%, i.e. EUR 1.7 billion),
real estate activities (15.6%, i.e. EUR 1.6 billion) and manufacturing
(7.5%, EUR 800 million). The share of gross value added of narrow                          0.0          1.0           2.0            3.0             4.0             5.0             6.0
construction and real estate activities2 in the GDP3 reached 2.6% and
                                                                                                                        Real estate         Construction
5.7% in 2016, respectively (Figure 4).
                                                                                                                                                           Source: Eurostat, 2017.

                                                                                      3
European Construction Sector Observatory
2
Macroeconomic Indicators
Unemployment has been steadily declining since the peak in 2010
In 2016, Ireland’s GDP amounted to EUR (15.5%) and reached 8.4% in 2016, just below the EU-28 average
240.7 billion, a 5.2% increase since 2015 of 8.6%. Youth unemployment (below the age of 25) has also been
and 44% above the 2010 value, thus declining continuously since the 2012 peak (30.8%), reaching 16.8%
in 2016, below the EU28 average of 18.7%7. Long-term unemployment
continuing the country’s solid economic
has also been falling, but remains a challenge. Notably, the labour
recovery after the economic crisis.
market in Ireland is characterised by skills shortages in several areas
and large disparities between the labour market outcomes of different
In 2016, Ireland’s GDP amounted to EUR 240.7 billion, a 5.2% increase skill groups, with low-skilled workers continuing to experience relative
since 2015 and 44% above the 2010 value, thus continuing the country’s deterioration of their labour market prospects since 20088.
solid economic recovery after the economic crisis. The very rapid growth
in Irish GDP since 2014 reflects the substantial contribution from foreign- Unemployment rate in 2016
owned multinationals as well as the strong expansion of domestic
economic activity - core domestic demand grew by approximately
5.4 % in 2015, indicating a broad recovery that has reached nearly all
sectors in the economy. While confidence in the economy remains
high, there are growing risks and uncertainty, related to exchange rate
developments, wage pressures, productivity developments, the vola-
tility of certain sources of public revenue and the overall exposure of the
economy to global value chains and taxation frameworks and not least
– the consequences of the referendum on UK’s membership in the EU4.
The crisis had a severe impact on credit availability for Irish compa-
nies. Indeed, loans to non-financial corporations in the general
GDP evolution 2010-2015 economy have been experiencing a continuous decline since 2008
(EUR 171.5 billion), falling by 74.2% by 2016 to EUR 44.2 billion. Simi-
larly, the situation for Irish SMEs has worsened significantly, with
General government expenditure in Ireland accounted for 28% outstanding credit extended to them dropping by 41% between 2010
of GDP in 2016, below the EU-28 average of 46.6%5.The same year, and 2016, from EUR 47.5 billion to EUR 28 billion. Gross new lending
general government deficit accounted for 0.6% of GDP, in line to SMEs also experienced a decline to its lowest level of EUR 2.2 billion
with the EU average. General government gross debt amounted in 2013, followed by strong growth to more than double this amount
to 75.4%, also below the EU-28 average of 83.5% and is expected to in 2016 when it stood at EUR 4.8 billion.
continue to decline in 2017 and 2018 in the face of robust GDP growth
and the realisation of primary budget surpluses. In absolute terms, Despite these signs of recovery in bank lending, the Irish domestic
public debt is still high. While the stock of public debt remains at a corporate sector, comprised of mostly small companies, remains
historically high level, it has one of the most long-term maturities in in strong deleveraging mode and obstacles to new SME borrowing
Europe and interest rates are relatively low, contributing to an overall remain.Most new loans are extended to construction, agriculture and
healthy financing situation6. manufacturing firms9.
General government expenditure relatively to GDP
There are a number of government initiatives aiming
at improving the access to finance for SMEs in Ireland.
4Country Fact Sheet Ireland
The Ireland Strategic Investment Fund, managed and controlled by
the National Treasury Management Agency, is a sovereign develop-
ment fund with a statutory mandate to invest on a commercial basis in
a manner designed to support economic activity and employment in
Ireland. The fund had committed EUR 385 million to the SME financing
sector at 31 December 201610.
The Strategic Banking Corporation of Ireland (SBCI) commenced oper-
ations in March 2015 with the purpose of addressing market failures in
the Irish SME lending market. The SBCI provides Investment & Working
Capital Loans, i.e. low cost funding for eligible SMEs, characterised by
low interest rate loans up to EUR 5 million with repayment flexibility11.
In October 2016, the SBCI expanded its responsibilities to include the
management and operation of the SME Credit Guarantee Scheme12,
introduced by the Irish government in 2012 to stimulate additional
lending to SMEs which are unable to obtain credit from their bank,
by providing banks with a government guarantee amounting to up
to 75% of the value of the loan (with a maximum loan value of EUR
1 million)13.
Finally, the European Investment Fund (EIF) has supported Irish micro-
enterprises and SMEs via the EU Programme for Employment and
Social Innovation (EaSI) and the Innovfin and COSME financial instru-
ments.
In terms of demographics, the total population in Ireland amounted
to 4.725 million people in 2016 and is expected to increase by 10.3%
and 22.1% by 2030 and 2050 respectively. Furthermore, by 2050, the
share of the working age population will have shrunk to 56.0% from
65.0% in 2016, while people aged 65 or older will make up 26.0% of the
overall population compared to 13% today. This highlights the need
for long-term policy responses, such as ensuring the sustainability of
the health and pension system and increasing employment opportu-
nities for elderly.
5European Construction Sector Observatory
3
Key economic drivers of the
construction sector
Productivity Profitability
Labour productivity developments in the Irish broad In 2016, the turnover of the broad construction sector in Ireland
construction sector since 2010 have shown a general amounted to EUR 26 billion, which is a 3.8% decrease from the turn-
trend of recovery following major drops in 2008- over in 2010. More than half of this turnover – 61.7% - originates from
11(Figure 7), reflecting the fall in employment (and the narrow construction sector, 8.9% from manufacturing, 14.7% from
real estate activities and 14.6% from architecture and engineering
thus hours worked) inthis otherwise labour intensive
activities. The gross operating surplus of the broad construction sector
and relatively low productivity sector14. amounted to EUR 4 billion in 201515, which is a strong recovery from
the deficit recorded in 2008-2012. The gross operating rate of the
Productivity in the construction and real estate sub-sectors expe- broad construction sector16, which gives an indication of the sector’s
rienced the greatest volatility in productivity, dropping by as much profitability, was 16.1% in 201517, again showing the recovery of the
as 81.7% and 113% in 2011 and 2012 respectively compared to 2008 sector following the losses recorded in 2008-2012 (in 2010, the rate was
levels. The period of recovery that followed led to the construction -16.4%). Following a slight drop in 2011, construction costs18 recovered
sector recording a net increase for the 2008-2016 period of 57.5% - and slightly exceeded their 2010 levels by 2016 (Figure 8).
from EUR 35,400 of gross value added per person employed to EUR
55,770, which is howeverthe lowest among all sub-sectors of the broad Turnover of the broad
construction sector. In 2016, the highest gross value added was that construction sector evolution
of the subsector architectural and engineering activities – EUR 68,500, 2010-2016
which is an increase of 2.72% compared to 2008. Real estate activities
and manufacturing activities also saw an increase for the 2008-2016 Figure 6: Construction cost index for residential buildings over
period, by 33.3% and 12.2% respectively or EUR 63,600 and 61,100 per 2010-2016 (2010=100)
employed person.
Figure 5: Labour productivity in the construction sector in
Ireland over 2008-2016 (EUR k)
Source: Eurostat, 2017.
Source: Eurostat, 2017.
6Country Fact Sheet Ireland
Employment persons in the general economy declined from 16.5% in 2008 to 15.5%
in 2016. Conversely, self-employment in the real estate sector reported
In 201619, the broad construction sector is estimated to have employed an increasing trend, although from a low base, growing from 2,200
169,742 people, a 15.3% increase compared to 2010 and showing a people in 2010 to 3,200 in 2016 (+45.5%) and accounting for 1.1%
strong recovery from the low levels recorded in 2012 (139,555). In 2015, of the self-employed in the general economy. Finally, SMEs play an
the broad construction sector employed 8.53% of workers in the total important role in terms of employment, since they employed 89.6% of
economy – a share that has remained relatively steady since 2010. The the total workforce of the broad construction industry in 2015, slightly
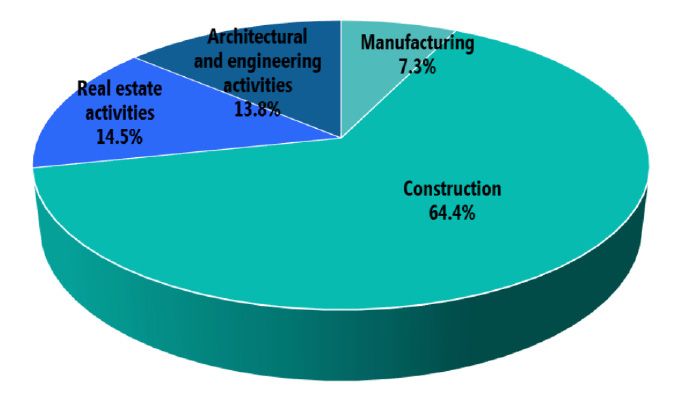
construction sub-sector employed 64.4% of the total workforce in the higher than the EU average of 85.8%22.
broad construction sector in 201620 (i.e. 115,929 people), followed by
real estate activities (14.5%), architectural and engineering activities Number of self-employed workers
(13.8%) and manufacturing (7.3%) (Figure 9). The real estate activities in the construction sub-sector
sector saw a 41.4% increase in the number of workers over 2010-201621.
The architectural and engineering activities and narrow construction
sub-sectors experienced a 21.8% and a 10.9% increase in their work-
force over the same period, while the manufacturing subsector showed
the lowest growth with a net increase of 2.9%. Conversely, As for the
changes in employment in specific occupations within the subsec-
tors, the number of workers employed in the construction of other
engineering projects (not related to infrastructure or building projects)
saw the largest relative decline, from 2,461 in 2010 to 1,957 in 2016 Business confidence
(-20.5%). Conversely, workers employed in the provision of electrical, Business confidence in Ireland has been showing signs of improve-
plumbing and other construction installation activities had the largest ment since 2008. After dropping at -47.4 in 2009 in the aftermath of
increase amongst the occupations in the narrow construction sector – the economic crisis, the consumer confidence indicator has been
between 2010 and 2016 their number increased by 20.5% from 27,578 improving gradually, entering positive territory in 2014 (+2.8) and
to 33,235. In the real estate sector, there was a strong grow (41.4%) in further increasing to +9.9 in 2016. Industry confidence has been
the number of persons employed for the provision of real estate activ- negative since 2000, but 2016 saw its highest level (-11.6) since 2009.
ities on a fee or contract basis – from 9,151 in 2010 to 13,425 in 2016. Similarly, the construction confidence indicator also reached a
bottom low of -39.5 in 2009 and has remained in deep negative terri-
tory since then. Nevertheless, it has been improving, reaching -24.0 in
2016. In parallel, the investment ratio declined from 24.3% in 2008
to 17.6% in 2010, due to the crisis. It subsequently started recovering,
reaching 30.6% in 2016 and surpassing the pre-crisis values for the
first time.
Number of people employed in
the broad construction sector The consumer confidence
Figure 7: Percentage of people employed by construction
sub-sector in Ireland in 2016
The investment ratio
Source: Eurostat, 2017.
The number of self-employed workers in the construction sub-sector
experienced a 3.7% decline between 2010 and 2016, from 45,900
to 44,200. Indeed, their share in the total number of self-employed
7European Construction Sector Observatory
is to be achieved. This requires cooperation between government and
The Construction Industry Federation (CIF) advocates for increased industry in order to set out a strategy that would enable the construc-
government support to the construction sector if economic growth tion sector to deliver the necessary planned housing and infrastruc-
tural projects23.
Domestic sales Export of construction-related
products and services
Between 2010 and 2016, the ranking of the most domestically sold The ranking of the most exported products has remained relatively
construction products in Ireland has experienced some changes - stable since 2010, although it is not possible to assess the 2016 perfor-
most notably, the sales of ‘Portland cement, aluminous cement, etc.’ mance of the top export in 2015 - Fireboard of wood or other ligneous
has been in the top 5 of most sold product groups since 2012. The materials – due to unavailable data. The value of exports of all construc-
product group ‘Other structures and parts of structures’ saw the largest tion products experienced increases over 2010-2016, with the excep-
decrease (-57.8%) in value of sales in 2010-2016, while the value of sales tion of product group ‘Particle boards and similar boards of wood or
of ‘Barrels and coopers’ products of wood’ had the largest increase other ligneous materials’, which decreased by 29.6% in that period –
– from EUR 6.6 million in 2010 to EUR 32.9 million in 2016 (+307%). from sales of EUR 60 million in 2010 to EUR 42.3 million in 2016. The
Table 3 presents the top 5 most domestically sold construction prod- highest growth for this period can be observed in the product group
ucts, both in Ireland and the EU-28, which made up 55.8% of all Irish ‘Tiles, flagstones, bricks and similar articles, of cement, concrete or arti-
domestic construction product sales in 2016. ficial stone’which grew by 2227.9%, followed by ‘Articles of cement,
concrete or artificial stone n.e.c.’ (+1932.3%), representing an increase
of sales from under EUR 0.5 million to approximately EUR 10 million.
The top 5 most exported construction products from Ireland and the
EU-28 are summarised in Table 4.
Table 3: 5 most domestically sold construction products in Table 4: 5 most exported construction products in Ireland
Ireland and in the EU in 2016 and EU-28 in 2016
Ireland EU-28 Ireland EU-28
Product Value Share in Product Product Value Share in Product
(EUR m) construction (EUR m) construction
product product
domestic domestic
sales (%) sales (%)
Ready-mixed Other Portland cement, Ceramic tiles
concrete 269.6 17.8 structures aluminous cement, 140.0 29.5 and flags
(group 236310) (group 251123) etc. (group 235112) (group 233110)
Tiles, flagstones, Doors, Prefabricated Other struc-
181.7 12.0 structural compo- 74.3 15.6 tures (group
bricks and similar windows, etc.
articles, etc. (group (group 251210) nents for building, 251123)
236111) etc.
(group 236112)
Portland cement,
aluminous cement, Ready-mixed Particle boards and Fibreboard of
etc. (group 235112) 136.3 9.1 concrete similar, etc. 42.3 8.9 wood or other
(group 236310) (group 162113) ligneous ma-
terials (group
Doors, windows Prefabricated 162114)
and their frames 119.9 7.9 buildings
(group 251210) of metal
(group 251110) Doors, windows Marble,
and their frames, 41.1 8.6 travertine, etc.
etc. (group 251210) (group 237011)
Other structures Prefabricated
115.2 7.6
and parts of struc- structural
tures, plates, rods, components
angles, shapes and for building or Other structures Doors, win-
the like, of iron, civil engineer- and parts of 31.3 6.6 dows, etc.
steel or aluminium ing, etc.(group structures (group (group 251210)
(group 251123) 236112) 251123)
Source: PRODCOM, 2017. Source: PRODCOM, 2017.
8Country Fact Sheet Ireland
The UK constitutes one of the main export markets for Irish construc-
Access to housing
tion products, with 55% of Irish exports in the construction and timber
sectors and almost 50% of Irish clean energy technology being directed The number of households in Ireland increased by 2.3% over 2010-
to Britain and Northern Ireland each year24. These figures are as high as 2016, reaching 1.73 million in 2016. The share of total population liv-
100% for products such as lime and plaster and ready-mixed concrete. ing in cities and greater cities in 2016 (28.3%) remained close to the
Therefore, the fall in value of the Sterling against the Euro as a conse- share in 2010 (27.6%). Moreover, the mean equivalised net income ex-
quence of Brexit could negatively affect the viability of such exports25. perienced a 14.5% decline between the peak in 2008 and 2014, from
EUR 26,809 to EUR 22,93629.
Access to finance in the construction sector Number of households
Access to finance in the construction sector has experienced significant evolution 2010-2016
declines since the crisis, with credit extended to Irish construction firms
having shrunk importantly. This trend continued in 2016, with total
outstanding credit advanced to the construction sector showing a The Irish property market experienced one of the longest and most
decrease of78.2% since 2010, from EUR 3.5 billion to EUR 755 million in significant house price booms in Europe between 1997 and 2007.
2016. In particular, outstanding credit extended to Irish firms involved Indeed, new dwellings saw a 216% price soar during the decade,
in construction of buildings fell by 86.4% over 2010-2016, from EUR 1.6 which reached 268% for existing properties30. Following the crisis,
billion to EUR 223 million. Similarly, outstanding credit to companies the bubble burst and house prices dropped importantly, leading to
in civil engineering activities fell by 79.5% over the same period, from a housing market crash. The house price index dropped by 53.0%
EUR 748 million to EUR 203 million, whereas outstanding credit for between 2007 and 2012, although it started to recover in 2013 due
other construction activities decreased by 57.4%, from EUR 1.1 billion to the improved economic situation, recording a 39% increase be-
to EUR 153 million. Irish construction SMEs were especially affected by tween 2012 and 2016 and thus reaching its 2010 level (Figure 10).
the credit crunch, with the total outstanding credit advanced to them Nationwide, house prices further rose by 5.2% in 2016 compared to
falling by 71.8%, from EUR 2.1 billion in 2010 to EUR 587 million in 2015, with Cork, Galway and Limerick reporting the highest increases
2016. Credit to SMEs involved in construction of buildings experienced (+7.4%, +10.1% and +6.9%, respectively). Conversely, prices in Dublin
the hardest hit, dropping by 82.4%, from EUR 989 million in 2010 to started to cool down, growing by 3.7% in 201631. Residential property
EUR 174 million in 2016. Likewise, SMEs involved in civil engineering transactions and turnover rates remain below historical averages, but
activities saw outstanding credit directed to them decline by 65.2% have been increasing gradually. Reflecting in part the prominence of
over 2010-2016, from EUR 293 million to EUR 102 million. Outstanding non-household buyers (e.g. investment funds and approved housing
credit to SMEs involved in other construction activities decreased by bodies), the proportion of non-mortgage financed transactions is es-
60.2% over the same period, from EUR 796 million to EUR 312 million. timated to be substantial at up to 55 per cent of total residential prop-
erty transactions in H1 2017. Prices related to those non-mortgage
Total outstanding credit advanced to financed transactions appear to have risen at a faster pace than prices
the construction sector for mortgage financed transactions and are contributing to overall
price dynamics in the market. Nevertheless, the primary factors un-
derpinning continued expected house price growth are supply con-
straints in both new and second-hand stock, in addition to favourable
macroeconomic conditions32.
House price index
evolution 2007-2016
Most defaults still occur in the construction sector26 and SMEs in the
construction sector have the highest loan default rate in this company
segment, although signs of improvement are noted in 201627.
According to a survey of construction companies carried out on behalf
of the Construction Industry Federation in Ireland, in 2017, 63% of the
construction companies that sought to borrow from financial insti-
tutions in 2016-2017 experienced difficulties in securing finance.
Only 33% of those involved in house building use bank finance and a
majority rely on own resources for investment28.
9European Construction Sector Observatory
Figure 9: House price index in Ireland over 2005-2016 (2010=100) Figure 8: Mortgage interest rates for loans for over 5 years origi-
nal maturity (%)
Source: ECB MFI Interest Rate Statistics, 2017.
Source: Eurostat, 2017.
In addition, interest rates have been falling since 2008, from 5.0% to The Irish housing market is characterised by a low supply of dwell-
2.6% in 2016, making mortgages more accessible (Figure 11). How- ings for sale, lagging behind demand, which is estimated at 25 000
ever, total outstanding residential loans have been decreasing since units per year38. Indeed, in 2016, fewer than 25 000 were listed for
2008, from EUR 148.8 billion to EUR 89.1 billion in 201533, reflecting sale throughout the country, i.e. only about 1% of the total Irish hous-
the increased risk aversion of banks following the crisis. Expressed as ing stock39, which in 2016 stood at 2,003,645 dwellings40. Residential
a percentage of disposable income, Irish household debt has fallen construction has been improving, with the number of residential unit
to 144.8 % in Q3-2016, down from 225 % in 2008. While the strong starts increasing from 8,088 in 2015 to 11,320 in 201641. Similarly, new
recovery in GDP has not been matched by an equal increase in house- dwelling completions went up from a bottom low of 8,301 in 2013 to
hold disposable income, deleveraging slowed down in 2016, as new 12,666 in 2015 and 13,376 in 2016. This is nevertheless 85.7% below
lending for consumer and house purchases started to pick up34. In this the 93,419 peak in completions recorded in 200642. Moreover, it is in-
context, in February 2015, the Central Bank of Ireland introduced mac- sufficient considering that increasing population and migration will
ro-prudential regulations for residential lending. The measures limit require the construction of up to 41,636 new properties each year
loan-to-value (LTV) ratio to 80% for non-first time buyers and 90% on until 201843.
the first EUR 220,000 of the value of the property for first-time buyers
(an LTV of 80% applies to any value above). Furthermore, the regula- The housing shortage is contributing to pushing prices up which, com-
tions put a limit on loan-to-income (LTI) ratios equal to 3.5 times the bined with the relatively slower increase in disposable incomes, may
gross annual income35. The aim of the Bank was to protect the banking lead to housing affordability issues. Indeed, the home ownership rate
and household sectors from changes to the property market and to in Ireland has been declining continuously, from a peak of 81.8% in
reduce the risk of bank credit and housing price spirals, thus prevent- 2004 to 70.0% in 2015. This rate increases to 74.3% for the population
ing a credit-fuelled property bubble. While, lenders, mortgage brokers whose income is above 60% of the median equivalised income, but
and the construction/real estate industry have expressed concern drops to 47.3% for those below this threshold. Conversely, the share
about the restrictiveness of the LTV caps to be too restrictive and the of tenants has been increasing, from a bottom low of 18.2% in 2004 to
appropriateness of LTV limits36, the Central Bank’s annual reviews of 30.0% in 2015 (from 33.2% to 52.7% for the population below 60% of
the measures report on their effectiveness and the rules will remain median equivalised income).
in place37.
Nevertheless, housing affordability and quality in Ireland are generally
good. The housing cost overburden rate44 was at 4.6% in 2016, well
below the EU-28 average of 11.1%45.The overcrowding rate46 in 2016
was at 3.2%, one of the lowest in the EU, and considerably below the
EU-28 average of 16.6%47. Similarly, the severe housing deprivation
rate48 reached 1.0 % in 2016, below the EU-28 average of 4.8%49.
Housing cost overburden rate
Interest rates
10Country Fact Sheet Ireland
Infrastructure
Ireland ranks 29th out of 138 in terms of its infrastruc-
ture, according to the World Economic Forum Global
Competitiveness Report 2016-201750.
In particular, it performs well with respect to the quality of its air trans-
port infrastructure (25th) and port infrastructure (26th) while it ranks
32nd for the quality of its roads and 35th in railroad infrastructure.
Moreover, Ireland is nearing the completion of its TEN-T Core Network,
for both road (93%) and rail networks (92%)51.
When comparing Ireland’s level of investment in transport infrastruc-
ture with that of other EU countries, it is evident that investment is
below the EU average. The level of investment in road infrastructure
has been decreasing steadily since the economic crisis and in 2015 it
was 0.24% of GDP, well below the EU average of 0.54.
Substantial investment in infrastructure will be delivered through the
Capital Investment Plan 2016-2021, which foresees EUR 10 billion spe-
cifically for transport52 (see TO 1 - Investment conditions and volumes).
An increase in investment in transport projects, in particular in port
infrastructure, is expected to help ensure that Ireland has adequate
infrastructure to cope with new trading arrangements after Brexit53.
11European Construction Sector Observatory
4
Key issues and barriers in the
construction sector
Company failure Trade credit
The business demography in the broad construction sector has gener- In Ireland, 46% of the value of B2B sales was transacted on credit
ally seen important increases in the number of company births and in 2016, oneof the highest shares reported in Western Europe, high-
decreases in the number of deaths between 2008 and 201454. Namely, lighting the country’s credit-friendly business environment. Neverthe-
company births in the construction sub-sector increased by 41.7%, less, this share was lower than in 2015, when 52% of the value of B2B
from 2,489 in 2008 to 3,526 in 2014, whereas the number of company sales was made on credit. Specifically, 47% of the value of domestic B2B
deaths decreased by 91.4%, from 8,652 to 747. Similarly, real estate sales was transacted on credit in 2016, compared to 44% for foreign
activities experienced a 67.4% increase in company births (from 700 in B2B sales, underscoring the higher risk perceived with the latter. Trade
2008 to 1,172 in 2014) and a 76.9% drop in deaths (from 823 to 190). credit terms are mainly granted to B2B consumers in the construction,
Conversely, company births in the architectural and engineering activ- consumer durables, and services industries56.
ities sub-sector experienced a 2.6% decline, from 499 to 486 over 2008-
2014, whereas company deaths decreased by 52.3%, from 569 to 270.
Late payment
Company births in the construction sub-sector
The Irish construction sector reports one of the
lowest shares of payments performed by due date
in 2016, although its performance has improved
compared to 2015.
In 2016, only 21.5% of the total payments were made by due date,
Company deaths in the construction sub-sector compared to 34.5% in the finance services sector. Indeed, 67.5% of
payments in the construction sector are carried out with a delay of up
to 30 days, versus 55.3% in finance services, with 8.4% of payments
occurring with a delay between 30 and 90 days and 1.6% with a delay
between 90 and 120 days. Moreover, 1.2% of payments occur with
delays of over 120 days, although this share is the highest in the retail
trade sector (5.1%)57.
According to the Insolvency Journal, the Irish construction sector
recorded 229 insolvencies in 2014 (i.e. 19.7% of total insolvencies), To improve the payment practices in the sector and cash flow within
the highest in the general economy. This declined to 139 in 2015, the construction industry, particularly for sub-contractors, the
i.e. 13.3% of the total, and the third in the general economy, after Construction Contracts Act was given legal effect in April 2016 after
services (200) and retail (154). In 2016, the number of insolvencies in being initially enacted in 2013. The Construction Contracts Act applies
construction increased to 164 (i.e. 15.9% of the total), although it is to all construction contracts awarded after the 25th of July 2016, and
still 28.4% below the 2014 value55. provides a set of legal requirements ensuring the flow of payments58.
It stipulates that all construction contracts have adequate mechanisms
for determining the amounts and payment intervals. It also provides
statutory rights to suspend work, provided written notice is given, and
further sets out a fast track dispute resolution procedure59. The main
benefit of this new legislation is to provide a quick answer in case of
a dispute60. However, it will be clear in the medium and long-term
whether the Act will have the desired effect and improve the payment
culture in the Irish construction industry.
12Country Fact Sheet Ireland
Time and cost of obtaining building Skills shortage
permits and licenses
Ireland ranked 38th in terms of ‘dealing with con- Job vacancies in the construction sub-sector62
struction permits’ in 2016, according to the World dropped significantly in the aftermath of the econom-
Bank’s Doing Business 2017, an improvement com- ic crisis, but started increasing after 2014 in line with
pared to the previous year (43rd). the economic recovery in the sector.
10 procedures and 149.5 days are required to complete administra- Specifically, following a drop by 64.7% between 2008 and 2013, from
tive formalities to build a warehouse (Table 56), below the OECD high 425 to 150, job vacancies reached 600 in 2015, i.e. 41.2% above the
income average (12.1 procedures and 152.1 days)61. Furthermore, 2008 level63.
the cost of building a warehouse represents 5.4% of the value of the
warehouse, above the OECD high-income average of 1.6%. Nevertheless, the number of tertiary students in engineering,
manufacturing and construction, and specifically in architecture and
Table 5: Construction procedures timing and costs in Ireland building, decreased by 39.5% over 2010-2015, from 3,223 to 2,066.
Moreover, adult participation in education and training in the
Time to Associated construction sub-sector64 experienced a continuous decline, falling
Procedure
complete costs
from a peak of 9.2% in 2008 to 4.9% in 2016.
Publish notice of construc-
tion in approved newspaper 15 days EUR 15
The Irish construction sector is experiencing a shortage of workers,
which will become even more marked as the sector grows over the
Obtain an ordinance survey 0.5 days EUR 77
map next years. Indeed, the expansion of the industry is predicted to require
Table 4: 5 most exported
an additional 76,000 newconstruction products
workers until 2020. in Ireland there will be
Moreover,
Request and obtain planning 90 days EUR 101,057
permission and EU-28 in 2016
significant demand to replace workers who leave the labour market
due to illness and retirement, which is estimated at about 36,000 skilled
Request and obtain fire safety 78 days EUR 3,772
certificate workers (including 3,840 apprentices) over 2016-2020. Thus, the total
labour requirement until 2020 amounts to an additional 112,000
Request and obtain disability 60 days EUR 800
safety certificate workers. Specifically, in order to sustain the ambitious planned housing
construction targets and infrastructural investments, skilled trades
Submit a commencement 0.5 days EUR 30 will be the most requested. Indeed, by 2020 there will be the need
notice
for 88,900 skilled craftsmen, including 30,800 carpenters and joiners,
Request water and sewage
connection 1 day EUR 490 15,200 electricians, 7,900 bricklayers and masons, 13,900 plasterers and
tilers and 11,800 plumbers and heating/ventilating engineers65.
Receive inspection for feasibility
of the connections 1 day no charge
Ireland’s construction workforce needs to upskill, particularly in
Obtain water and sewage response to the growing need for renovation and building perfor-
connection 21 days no charge
mance professionals. The drive towards international markets also
Submit the Certificate of Compli-
further changes the necessary skills66. Further upskilling to gain expe-
21 days no charge
ance on Completion and obtain rience in areas such as Building Information Modelling (BIM) and Infor-
approval
mation Technology will enable the industry to develop more efficient
administrative processes. To be able to address these needs, several
Source: Doing Business overview for Ireland, World Bank, 2017. actions are in place in Ireland (see TO 2 - Skills).
13European Construction Sector Observatory
Sector & sub-sector specific issues Climate and energy
Material efficiency and waste management Emissions of greenhouse gases (carbon monoxide and dioxide,
methane, nitrous oxides and particulate matter) from activities in
the construction and real estate sub-sectors amounted to 806,405.6
The tonnage of construction and demolition tonnes and 16,353.5 tonnes in 2014, respectively. The former has in-
waste collected in 2014 amounted to 3.31 creased by 15.9% since 2008 and the latter has decreased by 46.1%.
million tonnes, a 6.5% increase since 2011 and
81.4% below the peak of 17.8 million tonnes Ireland uses the Dwelling Energy Assessment Procedure (DEAP),
which is based on the UK Standard Assessment Procedure and
reported in 2007.
EN13790. DEAP was first introduced in 2006 and has gone through
a number of updates so that it can meet regulation, consumer and
industry needs72. This assessment procedure is based on assigning an
The tonnage of construction and demolition waste collected in energy efficiency rating for each building. However, there are no rat-
2014 amounted to 3.31 million tonnes, a 6.5% increase since 2011 and ings to compare what was designed with the as-built situation.
81.4% below the peak of 17.8 million tonnes reported in 2007. This
reflects the decline of construction and demolition activities due to
the economic downturn67.
The bulk of C&D waste is made up of uncontaminated soil and stones,
with the remainder segregated wastes such as rubble, concrete, bricks,
glass, plastic, wood, metals and mixed C&D waste.In terms of recycling
infrastructure, there were 222 active waste facility permit holders
authorised to collect C&D waste in 201168. In line with the economic
recovery trends and the government policy focus on the provision
of social housing, major road and social infrastructural projects, C&D
waste generated will increase again in the coming years69.
Ireland is on track to meet the Waste Framework Directive 2020 targets
for C&D waste. In 2017, it was preparing for reuse, recycling and other
material recovery (incl. beneficial backfilling operations using waste as
a substitute) of 68% of its C&D non-hazardous waste (excluding natural
soils & stone), given a target of 70%70.
The Best Practice Guidelines on the Preparation of Waste Management
Plans for Construction and Demolition Waste Projects were published
in 2006 to promote an integrated approach to the management of C&D
waste for construction projects above certain thresholds (e.g. new resi-
dential development of 10 houses or more, civil engineering projects
producing over 500 m3 of waste, etc.)71.
The EU Construction & Demolition Waste Management Protocol
adopted in 2016 introduces non-binding guidelines as a proposal to
the construction industry with the aim to increase confidence in the
Construction and Demolition waste management process and the trust
in the quality of Construction and Demolition recycled materials.
14Country Fact Sheet Ireland
5
Innovation in the
construction sector
Innovation performance Materials firms rank within the top 1,000 EU companies by R&D (indus-
trial sector ICB-3D), according to the 2017 EU R&D Scoreboard79.
A 2013 report on Ireland’s R&D sector published by Forfas, the national
Ireland is classified as a Strong Innovator, policy advisory board for enterprise, trade, science, technology and
according to the European Innovation innovation, states that a total of EUR 1.9 billion has been expended on
industry R&D in Ireland. However, only EUR 4.6 million (0.2%) of this has
Scoreboard 2017. Its performance over time
been attributed to the construction industry.
has increased by 3.5% relative to that of the
In order to foster R&D, the government introduced R&D tax credits,
which can be claimed by companies engaging in R&D activities. Credits
Ireland is classified as a Strong Innovator, according to the European cover up to 25% of the eligible expenditures incurred for inventions,
Innovation Scoreboard 2017. Its performance over time has increased design, development or improvement of products, processes, tech-
by 3.5% relative to that of the EU in 201074. The country performs above niques, formulas or software. In the case of construction, companies
the EU average for many dimensions, such as Human Resources, Open, financing activities such as green building design or improvement,
excellent and attractive research systems and Innovators. Specifically, mechanical systems design, process design, pilot plants, construction
its relative strengths are in International scientific co-publications, techniques or other products, processes or software, qualify for R&D
License and patent revenues from abroad, Exports of knowledge-in- tax credits. Nevertheless, construction companies are often unaware
tensive services and Employment in knowledge-intensive activities. that their R&D activities and related expenditures can qualify as such,
Conversely, its relative weaknesses are in Private co-funding of public and therefore do not claim the R&D tax credits, resulting in their low
R&D expenditures , Non-R&D innovation expenditures and Commu- uptake in the construction sector80.
nity designs.
The R&D tax credit was complemented by the Knowledge Devel-
Business enterprise R&D expenditure (BERD) in the opment Box (KDB), introduced by Finance Act 2015 for companies
construction sub-sector75 amounted to EUR 2.6 whose accounting period commences on or after January 1st 2016.
million in 2011, which declined slightly to EUR 2.5 The KDB, it is a regime for the taxation of income arising from patents,
million in 201376. copyrighted software and other intellectual property (IP) that is similar
to an invention which could be patented. Companies that qualify for
On the contrary, BERD in professional, scientific and technical activities the KDB are entitled to a 50% allowance on their eligible profits. Thus,
increased by 221.2%, from EUR 29.6 million in 2009 to EUR 95.1 million profits arising from patents, copyrighted software or IP equivalent to a
in 2013, the highest across the sub-sectors77. patentable invention are taxed at 6.25% rather than 12.5%81.
In parallel, the total R&D personnel (full-time equivalents – FTE78) in the Moreover, the Construction Innovation Lab is a student-led initiative
construction sub-sector also experienced a declining trend. In line with to assist higher education students with research topics identified by
the BERD, the construction sub-sector reported only 33 FTE in 2013, the construction industry. The main objective of the lab is therefore to
compared to 49 in 2011 (-32.7%). Conversely, professional, scientific align student research with industry needs, thus stimulating the revival
and technical activities sub-sector reported a 235% increment in FTE, of the sector through research and innovation and giving students the
from 280 in 2009 to 938 in 2013, the highest across sub-sectors. opportunity to pursue a sustainable career in construction82.
Moreover, there has been an increase in the annual average number
of construction related patent applications in recent years. In fact,
over 2000-2007, an average of 10 patents were filed in the European
Patent Office (EPO) and United States Patent and Trademark Office
(USPTO). This increased to 11 in the period 2008-2016, with the year
2008 reporting the highest number of applications (21), although this
has declined to only 3 in 2016. Moreover, two Irish Construction &
15European Construction Sector Observatory
Eco-innovation and digitalisation
In 2014, the government’s Construction 2020 strategy pledged to
develop a public sector pilot Market-Led Clustering Programme to
stimulate collaboration between Irish based construction sector
firms, other relevant industry sectors and the research community,
to improve the sector’s international competitiveness as well as
to contribute to national level policy goals particularly in terms of
climate change targets. Such a project should encompass activities
from applied research to pilot production (e.g. smart infrastructures
or smart homes).
The Construction 2020 startegy further stresses the importance of
technological advancements, developments in quality materials,
the rising use of Building Information Modelling (BIM) and sophisti-
cated manufacturing facilities for increasing the productivity gains on
construction projects.
The EU Eco-innovation observatory has highlighted the production
of eco-cement in Ireland as a good practice in the construction sector
- Ecocem Ireland manufactures a cement with a carbon footprint 16
times lower than other cements produced in Ireland83.
16Country Fact Sheet Ireland
6
National & Regional Policy &
Regulatory Framework
Policy schemes to provide 47,000 new social homes by the end of 2021, with EUR 5.35
billion of funding being set aside for this purpose.
In 2014, the government introduced the Construc-
tion 2020 Strategy, which aims to restore a properly The overall target is the construction of 25,000 new
functioning, sustainable and dynamic construction houses per year (almost double existing output levels)
sector. over 2017-2021. Moreover, a EUR 200 million Local In-
frastructure Housing Activation Fund is also included,
It defines a package of measures consisting of 75 action points to so as to provide the necessary enabling infrastructure
tackle the most pressing issues in the industry. Among the areas
to open up large land sites for early development and
addressed in the strategy are the housing and commercial property
sectors, the planning process, access to finance, education and training
provide between 15,000 and 20,000 new units by
for the sector, competitiveness, innovation and internationalisation84. 201989.
Under the framework of the Strategy, various actions have been The National Asset Management Agency (NAMA) is also involved
adopted. In October 2015, a package of measures was introduced in the construction and delivery of new dwellings. It has already funded
to stabilise residential rents and boost housing supply, especially in the completion of 2,700 new homes and has plans to fund the delivery
the locations of greatest need, notably Dublin and Cork85. This inte- of up to 20,000 new residential units over the period to 2020 across
grated housing package, known as Stabilising Rents, Boosting 80 new housing sites. About 90% of these units will be in the Greater
Supply, brought about the increase in the deduction available to Dublin Area and about 75% will be mainly starter homes. However, due
landlords for mortgage interest from 75 to 100% if they let to tenants to some issues in terms of development viability and infrastructure
receiving social housing supports. The incentive aims to encourage deficits on the development sites, the units are likely to be delivered
landlords to rent their property for a period of three years to tenants by the end of the decade90.
benefiting from social housing supports, thus improving the supply
of rental properties to such tenants. By mid-September 2016, 1,260 These actions as well as the Rebuilding Ireland Action Plan will be
such commitments from landlords were registered with the Private further supported by financial and fiscal measures detailed in the
Residential Tenancies Board (PRTB) across each of the 26 counties86. Budget 2017. These include the new Help to Buy Incentive, aiming
to help first-time buyers with the deposit required to purchase a newly
Moreover, under the housing package, additional private sector built home. The incentive takes the form of a refund of income tax
finance has been leveraged through the funds of the Ireland Stra- paid over the previous four tax years, up to a maximum of 5% of the
tegic Investment Fund (ISIF) to support increased housing output. purchase price of a new home up to a value of EUR 400,000. For new
Thus, ISIF invested EUR 325 million in the EUR 500 million-joint homes valued between EUR 400,000 and EUR 600,000 the maximum
venture with the US private equity firm KKR Credit, announced in relief (i.e. EUR 20,000) will continue to be available. No relief will be
2015. The venture, by the name of Activate Capital, provides home- available for new builds costing over EUR 600,000. The incentive will
building companies with loans for up to 90% of the total financing run until the end of 201991.
requirements and has the capacity to finance the construction of over
11,000 new homes in Ireland87. The ISIF also invested EUR 25 million
in the Ardstone Equity Investment housing venture, which will fund
Insurance and liability related regulations
the delivery of over 1,500 units88. Construction activities in Ireland are regulated by two main bodies
of law, namely the Law of contract and the Law of torts. The Law of
In July 2016, to further tackle the housing shortage as well as social contract defines, amongst others, the principles of contractual liability,
housing and homelessness, the government launched the Rebuilding whereas the Law of torts regulates damages and injuries originating
Ireland – Action Plan for Housing and Homelessness.The Plan from failure to comply with non-contractual obligations. Common
is structured around five pillars, namely addressing homelessness, law statutes also shape contractual relationships, and include the Civil
accelerating social housing, building more homes, improving the Liability Act 1961, the Statute of Limitations as amended and Sale of
rental sector and utilising existing housing. Ultimately, the Plan aims wwwGoods and Supply of Services Act 198092.
17European Construction Sector Observatory
The contract sets out the liability of the property developer (or the can act as Building Control Authorities under the Building Control
builder) towards the final client, and defines the terms and conditions Act, as amended. These have the power to inspect buildings and
for the delivery of the building. The building development should be monitor compliance with the requirements of the Building Regu-
completed in accordance with the terms and conditions of the Building lations. Compliance with such requirements is under the responsi-
Regulations and with the planning permission. Liability of consultants bility of the designers, builders and owners of buildings, as per the
and designers is based upon the obligation to exercise reasonable skills Building Control Regulations 1997 to 201598. These introduced a
and care. Their negligence must be proven in order to hold them liable. new form of Commencement Notice, which is filed electronically. Part
According to the Statute of Limitations 1957, the general limitation of the Commencement Notice strengthens existing building control
period is six years for claims based on tort. For claims arising under regulation by requiring that architectural drawings be drawn up by
contract, the limitation periods are six years for action under simple a certified professional and submitted to the local building authority.
contracts and twelve years for actions founded on contracts under seal. Furthermore, greater governance measures are being implemented to
For claims with respect to personal injuries due to negligence, nuisance enforce and inspect Building Control activity across local governments.
or breach of duty, the limitation period is three years. Under the Civil
Liability Act 1961, parties that have contributed to a damage are jointly The Safety, Health and Welfare at work (Construction) Regu-
and severally liable. lations 2013 clarify the requirements for respecting the protection
of workers on construction sites and apply to all construction proj-
There is no compulsory construction insurance required by law in ects, including the alteration, decoration, maintenance and repair of
Ireland. Nevertheless, standard contracts require parties to take out buildings and the installation, maintenance and removal of mechan-
public liability insurance, which covers bodily injury or death to third ical and other systems. The Regulations oblige clients and designers to
parties or damage to third party property; employer’s liability insur- ensure that health and safety measures are taken into account before
ance covering all loss, damage, injury or disease to employees; motor the project starts99.
liability insurance; professional indemnity insurance for design activi-
ties, which covers defective design due to negligence; and Contractors’
all-risks insurance to covers damage to the construction works/plant/
tools during the construction phase93.
HomeBond Insurance is also widespread, and covers newly built houses
for a period of up to ten years in case of major structural defects and
five years remedial work in the event of water ingress or smoke pene-
tration caused by major structural defects, among others94. A Home-
Bond guarantee is compulsory in order to benefit from local authority
construction loan schemes. Currently, over 600,000 new homes have
registered with HomeBond.
Building regulations
The Building Regulations aim to ensure the safety
and welfare of people in and around buildings.
They concern the design and construction of a new building or an
extension, material alteration or a material change of use of an existing
one.The minimum performance requirements that a building must
achieve are set out in 12 parts, which cover structure, fire safety, site
preparation and resistance to moisture, sound, ventilation, hygiene
and conservation of fuel and energy, among others95. Since 2011 the
Residential Building Regulations include a minimum threshold require-
ment for renewable energy supply for new residential buildings that
can be met via renewable heat technologies. A similar requirement has
recently been applied to buildings other than dwellings in the 2017
revision to non-domestic building regulations96.
The Department of Housing also issues Technical Guidance Docu-
ments to accompany each part of the Building Regulations, which
provide guidelines on how the Building Regulations requirements are
to be achieved in practice by the construction97. 31 Local Authorities
18You can also read