2020 Point in Time Homeless Report - Thurston County Public Health and Social Services Office of Housing & Homeless Prevention
←
→
Page content transcription
If your browser does not render page correctly, please read the page content below
2020 Point in Time
Homeless Report

Thurston County Public Health and Social Services
Office of Housing & Homeless Prevention
412 Lilly Road
Olympia, WA 98501
pitcensusteam@co.thurston.wa.us

2

CONTENTS
Thurston County Point In Time _________________________________________ 4
  This Report _____________________________________________________________________ 5
  Point in Time Methodologies ______________________________________________________ 5
  New practices for Thurston County 2020 ___________________________________________ 8

Trauma Informed Community Care ____________________________________ 10
  What is Trauma Informed Care? __________________________________________________ 10
  Why does it Matter? ____________________________________________________________ 11

Partnerships & processes ____________________________________________ 13
  Establishing Teams & Distributing Action __________________________________________ 13
  Volunteer Recruitment & Training ________________________________________________ 14
  Day of PIT _____________________________________________________________________ 14

POINT IN TIME CENSUS RESULTS ____________________________________ 15
  By the Numbers ________________________________________________________________ 15
  Causes of Homelessness ________________________________________________________ 16
  Where did you sleep last night? __________________________________________________ 17
  Disabilities & other challenges ___________________________________________________ 18
  Sources of Income _____________________________________________________________ 19
  Basic Demographics ____________________________________________________________ 20
  Geography of Homelessness ____________________________________________________ 27
  Chronic Homelessness__________________________________________________________ 30
  Snapshots of Jurisdictions _______________________________________________________ 31
  The Data in Context ____________________________________________________________ 35

Supplemental Sources of Data on Homelessness ________________________ 37
  Homelessness in Public Schools _________________________________________________ 37
  People Temporarily Staying with Friends or Family _________________________________ 39
  People in Jail or Medical Facilities ________________________________________________ 40
  People who Chose not to Participate ______________________________________________ 40

Conclusion _________________________________________________________ 41

3

Thank You Thurston Community! ______________________________________ 42
  Appendix A: Thurston County 2020 PIT Survey_____________________________________ 45
  Appendix B: Data Overview ______________________________________________________ 48
4

THURSTON COUNTY POINT IN TIME
Our Commitment

Thurston County is committed to leading a regional effort addressing homelessness through active
partnerships with all County jurisdictions, sustained engagement with service providers, and work
informed by best practices as they emerge. Led by the Thurston County Department of Public Health
and Social Services Office of Housing and Homeless Prevention, the County will continue to facilitate
conversations and actions to meet the goals in the Homeless Crisis Response Plan.

Our Vision

The Office of Housing and Homeless Prevention believes that homelessness in Thurston County is not
inevitable and can be mitigated by the concerted efforts of this department, the jurisdictional partners,
and the homeless crisis response system providers including volunteers and individuals with lived
experience. The vision of collaborative action that embraces work appropriate for both urban and rural
responses to homelessness, highlights Thurston County as a leader in homeless response in
Washington State.

Our Community

Thurston County has a rich culture of service with hundreds of organizations and thousands of people
who volunteer and donate their time and skills to build community and improve lives. The successes
achieved are a measure of this gift and proof that the work is not done alone. According to the US
Census Bureau, Thurston County’s population surpassed 290,000 people in 2019. As the county
continues to build and grow, there is the opportunity to use the information in this Report to increase
our resilience through better understanding of gaps in our system.

  “What moved me were the number of volunteers who slogged around
      in the pouring rain in their quest to count, and their heartfelt
               engagement with folks. Such dedication!”
                                                               Volunteer 2020 PIT
5 This Report The annual Point in Time (PIT) is a census of people experiencing homelessness that is mandated by the United States Department of Housing and Urban Development (HUD). Each year during the last ten days of January, HUD requires counties across the nation to collect data and count how many people are homeless. In the State of Washington, each Continuum of Care (CoC) is responsible for conducting and managing its PIT; King, Pierce, Snohomish, Chelan, and Spokane County each consist of their own CoC. The remaining 34 of Washington’s 39 counties make up the Balance of State CoC, of which Thurston County is part. The PIT collects data on people who are unsheltered (without any place to sleep), sheltered (sleeping in an emergency shelter), or transitionally housed. The PIT is vital to meeting the 1st objective in Thurston County’s Homeless Crisis Response Plan, to “quickly identify and engage all people experiencing homelessness under the state definition, and all unaccompanied youth under any federal definition, through outreach and coordination between every system that encounters people experiencing homelessness.” The Thurston County Point in Time Report seeks to establish the practice of providing our community with thorough, deeply contextualized information and data on the results of our PIT efforts. 2020 marks the first year that Thurston County has led the design, implementation, and analysis of its PIT. In previous years, Thurston County contracted out the PIT work to various contractors, most often the City of Olympia. While the data collected through surveys and the Homeless Management Information System (HMIS, used by Department of Commerce to collect and store information on those experiencing homelessness in Washington State) are the basis of this reporting, the County recognizes that people are much more complex than numbers. This report attempts to create meaning around the data to provide a useful tool that the entire community can utilize to better understand causes, barriers, and potential interventions for homeless citizens. Collected by 230 volunteers and staff, the surveys completed by unsheltered persons represent a compelling story of trauma and resilience, and a way to more fully understand the human costs of homelessness. Point in Time Methodologies The Point in Time census is an attempt to gain some universal metrics around homelessness at local levels, but through a national lens. HUD designed the process and mandates questions on certain topics be asked, at a certain time of year, in a certain way. While States and Counties have some
6

leeway in how they plan and administer the PIT, most of the process and procedures are dictated by
HUD.

The design is intentional to try to capture the homeless population at a time when only the most
vulnerable, with no other option, would be living in shelters or in places unfit for human habitation. This
timing also increases the logistical challenges associated with conducting the PIT census. There are
various HUD approved methodologies, of which Thurston County opted for a direct count census for
those unsheltered, and a direct count report from providers as a part of the Housing Inventory Count
(HIC) for the night of the PIT, for those in Emergency Shelter (ES) and Transitional Housing (TH). This
one-day count was then followed by a “7-day count.” This methodology provided an opportunity to
follow-up with individuals accessing regular services in the 7 days following the PIT which expanded
opportunities to include more individuals. The 7-day count is an extension of the PIT, as folks were
only asked about where they slept on the night of the PIT count day – it is not an ongoing count of
those accessing services each night for the next 6 days.

The count takes place over the course of 24 hours, 12:00am – 11:59pm on the designated day. This is
handled for the 7-day count, by confirming which night is being discussed. This can seem confusing,
when you simply talk about the PIT, which is meant to be the count of one night, but spans across two
night times. More information is available on the Department of Commerce website.

For the unsheltered population, a focused encampment and street count ensured volunteers engaged
houseless individuals throughout Lacey, Olympia, and Tumwater. Thurston County has a lot of rural
area, and a complete coverage census is simply not feasible. Events were planned in Yelm and Lacey,
providing meals and service connection to targeted houseless populations. These counts were then
verified through HMIS to ensure there were no duplications. Efforts were also made to cross-reference
individual’s program entry into permanent housing did not fall on the day of the PIT census (if their
permanent housing starts during the 24hours of the PIT, they are considered housed, and therefore
not eligible to be included in the count).

Included in the PIT census are people staying in Emergency Shelter and Transitional Housing
programs. Emergency shelter, also termed homeless shelters, provides emergency housing for up to
90 days. Transitional Housing is defined as housing designed to facilitate the movement of homeless
individuals or families to permanent housing within a set timeframe, around 24 months or less.
7

The Housing Inventory Count (HIC) and PIT are done concurrently, to capture a snapshot of system
capacity and utilization at a given point in time and to help prevent individuals being counted twice.
HUDs PIT methodology standard provides the following guidance:

       COCs must ensure that during the PIT count homeless persons are only counted once. It is
       critical that counting methods be coordinated to ensure that there is no double counting.
       Therefore, COCs must also collect sufficient information to be able to reliably deduplicate the
       PIT count (i.e. ensure that the same homeless person was not counted more than once).

The PIT census helps orient funding and policy decisions, yet accurate data collection is a challenge
as there is always an undercount of those experiencing unsheltered homelessness. It is hard to tell a
compelling funding story without information about who is experiencing what. Sound data helps the
community assess its resources by looking at what shelter and housing is available, what the need is,
and allowing for an examination of the gap and ways to help bridge it. The PIT also helps support long-
term planning by tracking how trends occur over time. Year-by-year data comparison can help further
hone and guide funding decisions, jurisdictional collaboration, and policy recommendations.

Participation in the PIT is voluntary and many declined either in full or in part to participate in the
survey. Surveys are considered “consent refused” when respondents partially fill out a survey yet do
not meet a minimum identification criterion (such as their full legal name). Consent refused surveys
were not officially included.

The 2020 PIT survey (included in Appendix A) gathers basic demographic information and asks
questions aimed at understanding the root causes of homelessness and barriers individuals and their
households have experienced in accessing housing. Survey questions also included current housing
situation, previous permanent address, sexual orientation, and substance use history. Domestic
violence is also asked about and necessitates additional safeguards. For anyone who indicated they
were actively fleeing violence, or for anyone under the age of 18, no identifying information is asked or
entered into HMIS. This includes full name and DOB. Some of these additional questions may be
sensitive issues for the survey taker which can significantly impact PIT survey responsiveness
depending on the approach of the census volunteer.

Other systemic challenges that can impact an accurate PIT count include but are not limited to the
following:
8
1. Data quality requirements mandated by HUD include disclosing a first name, last name, and full
date of birth. These data elements are the minimum required to count a person for PIT. Many
unsheltered individuals may use only street names and may be hesitant to give personal
information like their birthdate to strangers. Even if a person signs their consent to be included,
without these 3 pieces of information, they are counted as ‘consent refused’, making it harder
to de-duplicate and justify data.
2. Balance of State counties in Washington are unable to use any online software or digital survey
device because the software used by the State for HMIS (Homeless Management Information
System) is not compatible with online software systems. Paper surveys are subject to damage
from weather and data is often lost due to the inability to read or recover water-damaged
surveys.
3. The PIT depends on volunteers to administer surveys. Gathering information from people is a
skill that takes time to develop and the population surveyed for PIT can be difficult to engage
with effectively. While Thurston County continues to update and improve training methods, it is
acknowledged that sending first time survey volunteers to gather information presents certain
challenges.
New practices for Thurston County 2020
With approval from the Department of Commerce, the Thurston County PIT census team implemented
several new methods for collecting surveys. The intent of implementing these changes was to offset
some of the challenges mentioned above, and to attempt to address the unique challenges of working
with rural homeless populations, high risk, and hard to reach populations. Some of the new processes
used in 2020 include:
• Engagement with Nisqually Tribal Leadership to collect data on non-Tribal people living
outdoors on Nisqually lands.
• Engagement of CIELO, an organization that promotes the Latinx/Hispanic population, to
include non-English speaking populations in our census.
• Inclusion of a “7-Day Count” for hard to reach populations that could be engaged by with
approval from the Department of Commerce known nonprofit service providers over a 7-
day period following the PIT day. People surveyed in this way were asked where they slept
on the night of January 23rd while accessing regular services. Locations for the 7-Day
Count included ROOF (Rochester Organization of Families), Together!, Family Support9
Center of South Sound, Safeplace walk in services, Capital Recovery Center, and the
BUPE Clinic.
• Engagement of a large team of persons with lived experience to survey camps and those
sleeping in RV’s and vehicles throughout Thurston County. Just Housing Olympia, under
the leadership of Tye Gundel, led a team of 30 surveyors.
• Incentives for our unsheltered neighbors were informed by asking these folks what they
wanted and needed. Volunteers gave out first aid & sewing kits, flashlights, batteries, and
ponchos on PIT day.
• The County worked with transitional housing and shelter providers to gather supplemental
data that is normally not collected from these populations to better understand the causes
of homelessness for this group.
• Volunteers were encouraged to collect surveys for all people, regardless of where they
stayed or if they wanted to share their core information (name, DOB, any questions they
wanted to answer were gathered). This resulted in far more surveys & data collected for
sheltered persons, and greater engagement of unsheltered population including those
counted as ‘consent refused’.
• Redesigned and reorganized all volunteer training to include trauma informed care
practices.10
TRAUMA INFORMED COMMUNITY CARE
Nationally, there is growing awareness that people experiencing homelessness are likely to have
experienced significant trauma both before and after they lost access to permanent housing. While
service providers and advocacy groups have been working to integrate Trauma Informed Care (TIC)
practices into their work, Thurston County sees the need to also include these principles and
practices into policy and action work at the County level. Following best practices, the 2020 PIT was
an initial effort in applying TIC to the census design, project frameworks, and comprehensive
mandatory volunteer trainings.
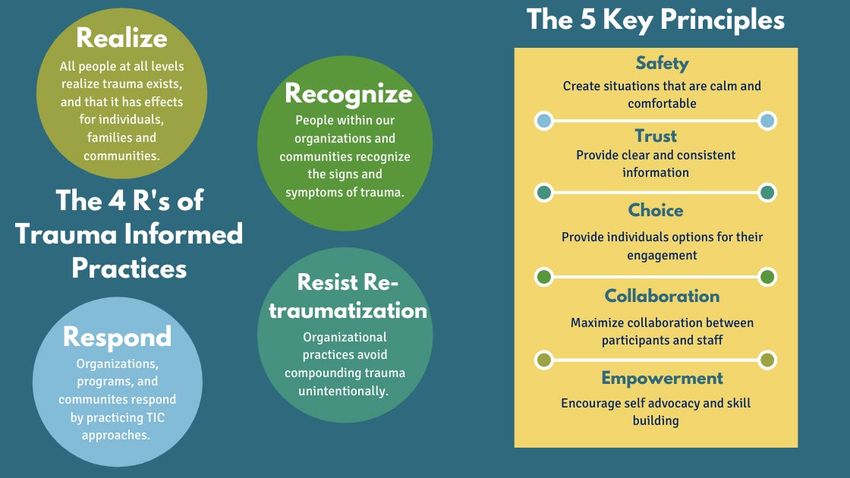
What is Trauma Informed Care?
Trauma Informed Care (TIC) is an overarching structure and treatment attitude that emphasizes
understanding, compassion, and responding to the effects of all types of trauma. TIC also looks at
physical, psychological, and emotional safety for both participants and providers, and provides tools to
empower folks on the pathway to stability.
Becoming “trauma-informed” means recognizing that people have many different traumatic
experiences which often intersect in their lives. Well-meaning advocates and outreach workers can
often re-traumatize homeless participants who need understanding, support, and individually-
conscious care. 1 Trauma informed practices then arise out of the knowledge of trauma within a
population, the desire to avoid re-traumatization, and the understanding that people with complex
traumas are far more likely to engage when providers and advocates intentionally set high standards
for safety.
In the case of the PIT, including TIC practices is as simple as educating volunteers, practicing
compassionate interviewing, and respecting each person. By doing this, it allows our processes and
interventions to be a part of community building, mutual understanding, and a greater capacity to
respond to crisis with compassion.
1
National Coalition for the Homeless, Building a Movement to End Homelessness11 Why does it Matter? The PIT census, particularly the survey of unsheltered individuals and families, is dependent on the willing engagement of people who are experiencing homelessness. In order to effectively engage with this population, the volunteer teams need to be trained in engagement practices that emphasize compassion, physical and psychological safety, and a willingness to show mutual respect across differences. In this way, project planners can design the PIT for the greatest possible impact by ensuring all processes align with the goal of being trauma informed. Volunteers who are trained in TIC practices are also more prepared to interact with unsheltered individuals because the principles of TIC work in all directions; the safety created is for both volunteers and those served. TIC Key Principles and Practices, Substance Abuse and Mental Health Services Association (SAMHSA, 2018) Best practices encourage TIC for outreach because “Homelessness deprives individuals of...basic needs, exposing them to risky, unpredictable environments. In short, homelessness is more than the absence of physical shelter, it is a stress-filled, dehumanizing, dangerous circumstance in which individuals are at high risk of being witness to or victims of a wide range of violent events”. 2 The 2020 PIT used a framework emphasizing compassionate practice in every phase of planning and implementation. Partnerships, outreach, and volunteer engagement were all based in the concept of ‘nothing about us without us’, or the intentional engagement of groups and individuals who have 2 Fitzpatrick KM, LaGory ME, Ritchey FJ. Dangerous places: Exposure to violence and its mental health consequences for the homeless. Am J Orthopsychiatry 1999; 69: 438-47
12

current, ongoing, trusting relationships with the community they wished to survey. For instance, only
people with lived experience of homelessness did outreach surveys in camps. By designing our
processes to allow those surveyed to speak with people they already know, or with people who share
common circumstances, we were able to offset some of the inherent difficulties of interviewing an at-
risk population about topics that are deeply personal and perhaps triggering.

Additionally, practicing TIC in addressing homelessness acknowledges the historical and ongoing
traumas that specifically effect traditionally marginalized populations and racial minorities who
continue to be over-represented in our homeless population. People in these populations are
disproportionately affected by various forms of trauma and adversity including violence, poverty,
incarceration, lack of access to health care, marginalization and low social status. 3 Trauma informed
practices are a recognized tool to help Thurston County meet goal #5 in its Homeless Crisis Response
Plan, to “address racial disparities among people experiencing homelessness”.

While it is hard to measure outcomes from the use of TIC in the PIT this year, feedback from
volunteers reflected a shift in experience for both volunteers and participants with the use of this new
framework. Below are a few quotes from our amazing community members who gave their time.

           I selfishly think I got                                      I was pleasantly surprised
         more out of this than the                                        by the friendliness and
           community we were                                               approachability of the
           surveying. I had not          I always find myself           people I spoke with. I was
          previously ever really        moved by the myriad              saddened by the youth. I
              interacted with           stories of people, and           think a lot of the people I
          homeless people. This          how they ended up                met were glad to have a
            experience helped          where they are. I really              conversation with
         humanize the group for         appreciate the one on             someone interested in
                     me.                    one connection             them... which really doesn't
                                       facilitated by giving the               cost anything.
                                                surveys.

3
 Healing the Hurt: Trauma Informed Approaches to the Health of Boys and Young Men of Color,
https://unnaturalcauses.org/assets/uploads/file/HealingtheHurt-Trauma-Rich%20et%20al.pdf
13 PARTNERSHIPS & PROCESSES Establishing Teams & Distributing Action The PIT census team began planning in September and October of 2019. County PIT lead, Keylee Marineau, reached out to providers and jurisdictions to begin conversations around the upcoming census to begin building teams to function within specific areas of effort. A coordinator for PIT was contracted in November, rounding out the County PIT team. The County team worked from the principle that each jurisdiction knows best what is needed for their citizens, and as such would own its own PIT planning process within the broader scope of County plans. After initial conversations, five core groups emerged to coordinate PIT activities with the County: • City of Olympia • City of Lacey • City of Tumwater • Yelm (Love Abounds Here) • Camp Count Teams (Just Housing Olympia) These core groups provided the backbone for events and activities designed to engage unsheltered individuals and families throughout Thurston County. For example, in Yelm a luncheon was organized to serve those in need, along with a bus to bring folks from encampments to the event location. In Lacey, the City and Community Action Council of Lewis, Mason, Thurston Counties created a resource fair and food specifically for families and students. Tumwater sponsored work by Together! to better reach youth and families in crisis. The City of Olympia and the Camp Count Teams set up tents with survival goods and food outside of three key encampments and engaged outreach staff to lead teams throughout Olympia. Additionally, a number of providers were recruited to assist in surveying their clients and participants who would not otherwise be counted: • Lacey Veteran’s Hub • Family Support Center of South Sound • Senior Services for South Sound • Safeplace • Capital Recovery Center • CIELO • Rochester Organization of Families (ROOF) • Together!
14

Volunteer Recruitment & Training
The Thurston County PIT Census team began recruiting volunteers and partner organizations to
collect surveys in November and December 2019. Drawing from previous volunteer lists, jurisdictional
staff, and community outreach, nearly 230 people were recruited to assist in the PIT efforts.

Part of the planning process was developing an intentional, focused training. This year, training was
mandatory for all volunteers assisting with surveys in the unsheltered population. The County’s
commitment to Trauma Informed practices led to a one-hour volunteer training that sought to build
both confidence and compassion in the teams of outreach volunteers. In addition, there was a trainer
on-site at the PIT headquarters throughout the day of the PIT so volunteers who were not able to
attend the pre-scheduled trainings were still able to receive training. Every person who volunteered
received the basic training for TIC and survey completion.

Keylee Marineau and Meg Martin (Executive Director, Interfaith Works) also offered 2 optional full-
length Trauma Informed Care training sessions, which many community members chose to attend.

Day of PIT
The 2020 PIT was held on Thursday, January 23 on what proved to be a very cold and rainy day.
Despite the environmental challenges, nearly 230 volunteers and staff from nonprofits and
jurisdictions fanned out across Thurston County to collect surveys. An impressive number of surveys
were completed (674), including 465 unsheltered survey pages (some with multiple persons
surveyed), 148 sheltered surveys, and 61 surveys of people temporarily staying with friends or family.
Not all of these individuals were found to have been homeless according to the HUD definition; for
example, some were entered into HMIS in projects, and as such would be considered a duplicate in
the unsheltered count.

Surveys were collected by each of the partners listed above, with small events held in Yelm, at Senior
Services of South Sound, Lacey Veterans Hub, City Life Church, Rosie’s Place Youth Shelter, and at
the Olympia Center (at the PIT Coordination Hub). Key survey teams included the camp count, the
Downtown Ambassadors, Transit Center, West Olympia, Tumwater & Lacey street outreach, Salvation
Army and teams who collected surveys from car and RV campers.
15

POINT IN TIME CENSUS RESULTS
By the Numbers
To be included in the PIT census, individuals must meet the HUD definition of homelessness on the
night of January 23rd, 2020. The PIT data presents a compelling story of where individuals are finding
refuge, if at all. Although the following data presents a snapshot, homelessness does not exist only on
one night of the year.

54% of homeless individuals counted in 2020 are living unsheltered, which is an increase from 2019
where 49% indicated they were unsheltered. In 2021 when the PIT is conducted, this number is likely
to continue to increase, as shelter capacity due to COVID-19 has decreased in Thurston County, and
there is not a significant increase in available Transitional or Permanent Housing.

Definitions of Homelessness
This census report is based on the Federal definitions of homelessness. The total number of
homeless individuals is comprised of people living in the following three types of accommodations:

       •   Unsheltered - places not meant for human habitation such as cars, tents, parks, sidewalks,
           abandoned buildings, or on the street. Also falling under the unsheltered category is-
           Substandard Housing - defined as a dwelling lacking drinking water, restroom, heat, ability
           to cook hot food, or ability to bathe.
       •   Sheltered - also termed homeless shelters, provides emergency housing for up to 90 days.
       •   Transitional Housing - a form of temporary housing assistance lasting for less than two
           years.

 541                        295                      159                         995
 Unsheltered                Sheltered                Transitional                Homeless
                                                                                 Individuals
16
Not included in the official Point in Time census are people temporarily staying with friends or family,
or ‘couch surfing’. This population is counted as homeless by the McKinney-Vento rules that count
homeless students, as further defined, and explained in analyzing the OSPI (Office of the
Superintendent of Public Instruction) data later in this report. Data for this population is included
separately from the main PIT data analysis see Homelessness in Public Schools.
The following series of charts present the results of the 2020 PIT Homeless Census. Please note:
Some respondents only answered the threshold PIT questions of name, gender and where did you
stay to be included in the formal PIT Census. Each person could choose to complete the survey in full,
or in part, as a result, some questions reflect a smaller, actual number of respondents for each
question. Additionally, for several of the data points most data is from the unsheltered population
surveyed by volunteers.
Causes of Homelessness
Understanding the root causes of homelessness is key to identifying the most appropriate resource
allocation in Thurston County. The chart below presents the self-reported causes of homelessness by
respondents in the county census. Each respondent was asked to report all circumstances that
applied, recognizing that there are multiple causes of homelessness and each situation does not
happen in a bubble. This information also helps to tell more clearly the real story of how individuals
and families became homeless while dispelling myths and inaccurate information.
Top 10 Causes of Homelessness
180 167
160 148
140 131
120
95 90
100 77
80 63
55
60 40
40 29
20
017
In keeping with previous years PIT data, eviction (28% of respondents) and job loss (25% of
respondents) are the top two answers given by people answering the question: what led to their
homelessness. This year, the positions are reversed; for the last two years job loss was number one
and eviction number two. The 2020 results show a surprising rise in people who answered that family
rejections (kicked out of a family living situation, divorce, or other forms of familial stressors) led to
homelessness, with 131 people or 22% citing this as a reason for their current situation.
A high number of respondents identified substance and alcohol addiction, physical disabilities, mental
illness, and domestic violence as what caused them to lose stable housing. Answers also point out the
difficulty of finding housing when people have been discharged from jail or juvenile detention, making
it much more challenging to pass a rental background check.
Where did you sleep last night?
A little over half of all people experiencing homelessness in Thurston County are living unsheltered in
2020. 541 people answered that they were sleeping in an abandoned building, a tent or encampment,
on the streets, in a vehicle, or in an RV or boat without basic amenities. All 995 homeless persons in
Thurston County are represented in this data.
Where did you sleep last night?
RV/Boat Abandoned Building
7% 1%
Vehicle
19% Emergency Shelter
30%
Transitional
Out of Doors Housing
27% 16%
These numbers represent a change from 2019, in that there seems to be a rise in people sleeping in
vehicles and RV’s. In 2019, only 14% of respondents reported sleeping in vehicles, RV/Boats, or in18
abandoned buildings, compared to 27% this year. 257 people answered that they slept in a vehicle, or
RV/Boat on January 23rd, with just under half (46%) being women – a much higher ratio than in the
rest of the homeless population, where women are closer to 39% of the population. Anecdotally, this
suggests that many of those choosing to sleep in vehicles are women with children (58 people under
18 slept in vehicles), in part because the vehicle is private and perceived as a safer place than a
shelter or encampment.
Disabilities & other challenges
Many people who experience homelessness self-report that they live with disabilities. These can
impact their ability to access social services, find work, and stay housed. In 2020, the largest reported
challenge for our houseless neighbors was mental health, with 258 persons reporting struggles with
mental health. There also continues to be many respondents who have significant physical disabilities.
It should be noted for this data set that most of the data comes from the unsheltered surveys taken on
January 23. Both the sheltered and transitionally housed populations had low answer totals for this
question. Only 63 answers were collected for the sheltered population and 41 for transitional housing
occupants, compared to 475 individual answers for the unsheltered population.
Disabilities
300
258
250
205
200 172
150
101
100
50
0
Mental Health Physical Disablity Substance Abuse Developmental
Disability19
Sources of Income
Of the 995 individuals included in the PIT, 403 (40%) reported having income of some kind, 180 (18%)
reported no current source of income, and either the data was not collected or is unknown for the
remaining 412 individuals.
In Thurston County, houseless individuals rely on the continued funding of basic service programs like
EBT (food stamps), TANF (Temporary Assistance for Needy Families), Social Security and Social
Security Disability (SSI, SSDI), Veterans Assistance (VA) and medical assistance programs like
Medicare and Medicaid. With job loss or unemployment being high on the list of causes of
homelessness, most people without housing in our community rely on public programs such as meal
services, clothing closets, and hygiene products and services to meet their basic needs
Sources of Assistance/ Income
FT Employment 5
Unemployment 8
Temp Disab. ABD 9
VA 11
Seasonal/Farm 14
PT Employment 17
Relatives/Friends 22
Panhandling 32
SSI/SSDI 117
TANF 175
Medicare/Medicaid 183
0 20 40 60 80 100 120 140 160 180 200
Looking beyond household income, housing affordability and cost of living are important factors to
consider in determining accessibility of housing. If the minimum wage does not allow individuals to
comfortably rent a home and afford basic living necessities, it can cause individuals to resort to
alternative methods of meeting their basic needs needs. These survival methods are often not
sustainable and make the slide into homelessness that much easier when unexpected issues or
expenses arise.
It is something to note that 22 individuals reported being either a FT or PT employee and yet are
unable to secure steady housing. This data challenges narratives that individuals experiencing20
homelessness “choose” to be homeless, are “lazy”, or they simply “refuse to get a job”; hyperbole
that is dehumanizing and does not recognize the lived experiences of each individual.
Basic Demographics
What follows is a series of charts with basic demographics of the Thurston County PIT homeless
population. For complete data on specific populations (unsheltered, sheltered, and transitionally
housed) please see the Complete Data in Appendix B. For demographics, percentages are of 995
total people counted for the PIT. For any small group where the data was not collected, these graphs
will note that as ‘Not Collected’ to maintain a consistent percentage and value.
Gender Female
40%
Non-
Binary/Transgender
2%
Not collected
Male 1%
57%
While the PIT consistently shows more men than women in the homeless population, it should be
noted that this is in part because the PIT and HUD definitions of homelessness do not count those
temporarily staying with friends or family (couch surfing, doubled up) or those who stay in hotels
through a variety of voucher programs. Women, especially with children, are likely to use friend
networks or go to family in times of crisis and stress if that option is available. A higher percentage of
those captured in the “temporarily staying with friends or family” category are women and/or DV
survivors (around 59%). In 2020, the PIT census team added a demographic question to the survey,
asking respondents if anyone in their family group identified as LGBTQ+ (Lesbian, Gay, Bisexual,
Transgender, or Queer).
While PIT results continue to show a small number of people (21 in 2020) who identify as transgender
or gender non-binary in the homeless community, anecdotal reports suggest there may be more.21
Violence is commonly experienced in this population, which can make it feel unsafe for individuals to
self-identify their gender identity, especially to strangers. Transgender people are a protected class in
the state Fair Housing law, and it is necessary for shelters and housing programs that receive local,
state, or federal dollars to abide by non-discrimination and other Fair Housing provisions. That is not
required of privately funded organizations, whether faith based or other, so it is up to those entities to
determine if and how they will serve this population.
Race
Asian 5
Islanders 23
American Indian/Alaska Native 36
Black/African Amer. 69
Multiple Races 96
Not collected 107
White 659
0 100 200 300 400 500 600 700
Race in a subpopulation is best understood through contextualizing it based on representation in the
overall population. If a demographic is more or less represented than in the overall population, there is
likely an underlying story to tell. For BIPOC (black, indigenous, people of color) people, that story is
often one of over representation, which is reflected in the PIT numbers. The proportion of minorities
remains significantly higher in the homeless population than in the general population. The racial
makeup of the county from 2014-2018 4 was 82% white, 6% Asian, 3% Black or African American, 1%
American Indian, 1% Pacific Islander, 1% from other races, and 6% from two or more races. Compare
these numbers to percentages of people of color in the PIT count: 7% Black or African American (over
twice the general population), 4% Native American/ American Indian (four times the general), 10%
multiple races (almost twice the general).
4
https://www.trpc.org/449/Race-Ethnicity22
Racial Representation Disparities
Native American
Multiple Races
Black/African American
0 2 4 6 8 10 12
PIT General Population
This continued disparity in representation by race in our homeless population highlights the need to
continue to build comprehensive trauma informed practices at the County level and to support
transition to these practices with the State, local jurisdictions, and service providers. This data
supports strategies identified in the Homeless Crisis Response Plan, “The work of incorporating racial
equity principles and best practices is a lengthy and ongoing process which requires system-wide
personal and professional buy-in. In conversations … it was crucial to acknowledge the commitment
to a meaningful and purposeful approach about how to address the disproportionate percentages of
POC experiencing homelessness in the community. Truly assessing, analyzing, and implementing
practices to address equity and related disparities will take years of effort, and a system fully
committed to the process.”
Latinx/Hispanic
Not
collected
15%
No
75%
Yes
10%
The Hispanic homeless population in Thurston County reflected a nominal disparity, with 10% of
survey respondents identifying as Latinx/Hispanic in a community with an average of 9%23
Latinx/Hispanic population. There is anecdotal evidence that this may reflect an undercount of this
population, something that will be considered in future PIT counts and efforts.
Veteran
Not
collected
32%
Yes
6%
No
62%
The homeless veteran population have historically had low response rates for the PIT census. This
year, only 6% of those surveyed identified their veteran status. Many veterans refuse to self-identify 5,
and the methods of PIT are particularly apt to miss female veterans, the fastest growing demographic
of homeless veterans nation-wide. This may be because “Women veterans who are at risk for
homelessness or experiencing homelessness are likely to avoid both sleeping outside (and hence are
missed during the PIT count) and staying in shelters (and thus are missed during the aggregate count
of services used)” 6.
The City of Lacey hosts the Veteran Services Hub, a collaboration of providers and advocates that
creates a space for veterans to reach many services through one access point. The Veteran Services
Hub operates low-barrier drop-in services to connect individuals to programs including but not limited
to: substance and mental health treatment, VA healthcare, and veteran specific housing assistance.
5
https://www.governing.com/blogs/view/gov-how-Michigan-got-better-at-counting-homeless-veterans-.html
6
https://www.finalsaluteinc.org/uploaded/files/WhitePaper-Revised_%20070319.pdf?direct=124
Age Groups of Respondents
Over 65 35
45-64 295
35-44 235
25-34 147
18-24 81
0-17 202
0 50 100 150 200 250 300 350 400 450 500
In Thurston County an individual is more likely to be homeless if they are under 18, or over 45. There
are limited housing resources available to both populations and securing income to maintain housing
can be a challenge. For young people experiencing homelessness, there is a youth and young adult
shelter in Olympia, and an organization that works with homeless families with children. The
McKinney-Vento Homeless Assistance Act works through the school districts and helps coordinate
resources for homeless youth that are school-aged. This population is examined in more detail in
Homelessness in Public Schools.
There are single adult providers, but there is no specific organization working with homeless elders.
182 out of 344 (53%) individuals over 45 years old acknowledged that they have an income from
sources such as SSI/SSDI and Medicare/Medicaid funds. However, finding and maintaining
permanent housing on fixed incomes presents a significant obstacle.
Youth Data Breakout (0-17 yrs. old)
GENDER AGES LATINX/HISPANIC
Male 101 0-9 134 Yes 32
Female 98 10-17 68 No 168
Non-Binary/Transgender 0 Not collected 2
Not collected 3
WHERE SLEPT RACE DISABILITIES
Transitional Housing 69 White 123 Developmental Disability 20
Chronic Health
Vehicle 58 Multiple Races 41 9
Condition
Emergency Shelter 53 Black/African Amer. 19 Mental Health 5
RV/Boat 18 Islander/Hawaiian 12 Physical Disability 225
American
Abandoned Building 2 4 Substance Abuse 1
Indian/Alaska
Out of doors 2 Not collected 3
Asian 0
Unaccompanied Youth Households (0-24 years old)
GENDER AGES LATINX/HISPANIC
Male 45 Under 18 13 Yes 9
Female 18 18-24 62 No 60
Non-Binary/Transgender 12 Not collected 6
Not collected 0
PARENTING RACE HOUSEHOLD
Parenting Youth (under 18) 0 White 48 Total Households 68
Parenting Youth (18-24) 10 Multiple Races 8 Total Persons 75
Children in households with
14 Black/African Amer. 8 Emergency Shelter 33
youth parents
American
Female Parenting Youth 10 4 Transitional Housing 25
Indian/Alaska
Latinx/Hispanic Parenting
4 Islander/Hawaiian 1 Unsheltered 17
Youth
Asian 0
Youth Location Breakout *
OLYMPIA LACEY TUMWATER
0-17 54 0-17 Suppressed 0-17 Suppressed
18-24 17 18-24 3 18-24 2
YELM THURSTON OTHER WA/NOT REPORTED
0-17 Suppressed 0-17 1 0-17 50
18-24 1 18-24 0 18-24 5
This data on youth location is included under the specific jurisdictions, but not in the total reported
numbers for each as it is extrapolated from the head of household, and not formally included in data
captured in HMIS. This also means this data only represents minors captured in surveys in the PIT,
and will not include any in ES or TH. For example, any youth living with their parent or guardian would
have participated under their parent/guardian on the PIT – they would not be given their own census.
When entering this data into HMIS, location is only entered for the head of household. By breaking out
the youth’s location, we are considering them to be in the same location as the participating head of
household.26
Identify as LGBTQ+*
No Not Collected
78% 10%
Yes
12%
* as a percentage of 675 respondents
The LGBTQ+ population is overrepresented in the surveyed homeless population: 12% of
respondents self-identified as LGBTQ+ compared to a national average of around 4.5% of the general
population 7. We can and must do more to develop meaningful programs to give LGBTQ+ youth and
adults alternatives to homelessness if they are not accepted at home. Research on the percentage of
LGBTQ+ homeless youth varies, but it is estimated they make up 20-40% of this population 8. While
there are large discrepancies between the homeless and general population in other demographic
areas, at 3x the general population, LGBTQ+ folks are significantly overrepresented. This number only
includes those who self-identified taking the survey, and does not represent those individuals not
surveyed in ES or TH. It also does not include any youth and young adults, as they would be included
under their head of household on the PIT survey, and outside of the PIT, this is not currently data
being collected in HMIS.
7
UCLA School of Law, Williams Institute, https://williamsinstitute.law.ucla.edu/visualization/lgbt-
stats/?topic=LGBT#density
8
Durso, LE & Gates, GJ. (2012). Serving our youth: findings from a national survey of service providers working
with lesbian, gay, bisexual, and transgender youth who are homeless or at risk of becoming homeless. Los
Angeles, CA: The Williams Institute with True Colors Fund and The Palette Fund.27
Fleeing Domestic Violence
DV Current
Not Collected 6%
39%
Not Fleeing
55%
According to the US Department of Justice, “Domestic violence is one of the primary causes of
homelessness for women and their children in the United States. According to the National Network to
End Domestic Violence, between 22 and 57 percent of women and children are homeless due to
domestic violence, with 38 percent of all victims experiencing homelessness at some point in their
lives due to domestic violence.” 9 The PIT count at 6% is significantly below the national percentage.
However, if we include people temporarily staying with friends/family the rate goes up to 10.4%. It is
understood that low PIT survey participation for this demographic is likely, as giving personal
information, even if not identifying, can feel threatening or unsafe to those actively fleeing DV.
Geography of Homelessness
This section examines where houseless individuals are currently living, as well as their previous
permanent address. To further clarify prior permanent addresses, people tell us where they last
received mail, or where they last lived in a house or apartment of their own. Additionally, another
question was added to the survey inquiring how long they had lived in Thurston County when they
became homeless. This enabled the gathering of new data on the movements of people in and around
Thurston County who have become homeless.
Data on the current city of residence was collected from those that completed surveys within the
unsheltered population. This was not captured for those in ES or TH who were not surveyed. Some
9
https://www.justice.gov/ovw/blog/transitional-housing-programs-and-empowering-survivors-domestic-violence28
extrapolation was done, from where surveys were conducted, if they did not otherwise indicate their
city of residence. For example: someone surveyed at the Mitigation Site who did not indicate their
current city was entered as an Olympia resident. There may be a few instances where this resulted in
a false indication of residence, but the methodology was consistent across jurisdictions.
Current City / Where Surveyed
Not Collected 142
Other 2
Rochester 6
Tumwater 9
Yelm 30
Lacey 40
Olympia 314
0 50 100 150 200 250 300 350
According to the surveys completed by unsheltered individuals, 58% identify as currently living in
Olympia. Downtown Olympia hosts the highest density of shelters, meal services, food bank, service
providers, showers, and other services for those experiencing homelessness. Having access to these
services can be crucial for an individual’s survival, while lack of access can also make it difficult to
engage in other essential life activities such as applying for jobs or attending treatment appointments.29
Last Known Permanent Address
Don't Know
Out of State 1%
14%
Other WA
11%
Thurston
Lewis/Mason/Pierce
61%
13%
As can be seen from the chart above, the majority (61%) of people surveyed identified their last
permanent home in Thurston County. Another 13% of those surveyed last had homes in counties
neighboring Thurston. The responses indicated that last known addresses were located primarily in
Shelton, Lakewood, Chehalis, and Centralia. Therefore, approximately 75% of respondents had a last
known address from inside of Thurston County or its immediate neighbors. About one in four
respondents indicated that they came from elsewhere in Washington or from out-of-state.
For those who indicated their last known address was in Thurston County, most had lived in Thurston
for several years before they became homeless. Of the 258 respondents who indicated Thurston as
their last permanent address, 191 (74%) answered that they had lived in Thurston County at least one
year before becoming homeless. 135 (52%) of people had lived in Thurston County for more than 5
years, many for all their lives.30
How long did you live in Thurston before becoming
homeless?
160
135
140
120
100
80
60 53
38
40
18
20 4 8
2
0
Not collected 0-3 months 4-5 months 6-12 months
1-3 years 3-5 years More than 5 years
Length of Time Currently Homeless
4%
14%
82%
Less than 1 year More than 1 year Not Collected
Chronic Homelessness
The Federal definition of “chronic homelessness” is someone who has experienced homelessness for
at least a year – either 12 months or more in a row, or several shorter experiences of homelessness
that add up to a year - while struggling with a disabling condition such as a serious mental illness,
substance use disorder, or physical disability. As a Balance of State County, Thurston County31
depends on the Department of Commerce to conduct an analysis of the data and determine the
number of people who can be categorized as chronically homeless in our community.
For 2020, the Department of Commerce determined that 272 (27%) individuals met the criteria for
chronic homelessness in Thurston County. Best practices for reducing homelessness among people
with disabilities includes building supportive housing options that prioritize this community. “By
prioritizing people experiencing chronic homelessness for existing supportive housing, and by
creating opportunities to bring new units online, communities have made many more units available
for people experiencing chronic homelessness with the highest needs. Communities are also
strengthening their assertive outreach and engagement, lowering barriers to emergency housing and
services, and quickly linking people to permanent housing in order to bring the number of people
experiencing chronic homelessness to as close to zero as possible.” 10
Snapshots of Jurisdictions
Thurston County acknowledges the independent character and specific needs of the jurisdictions who
participate in the PIT each year. These cities add vital knowledge and expertise to our examination of
homelessness, and a deeper understanding of conditions unique to their city. The PIT data helps to
inform local jurisdictional action while operating within the county’s regional homeless crisis response
system.
Lacey: The City of Lacey increased their outreach and engagement efforts during the PIT this year. In
coordination with their new full-time liaison from Community Action Council, the City had more than
20 volunteers and staff to survey streets, encampments, and families on January 23. Forty unsheltered
individuals were counted.
GENDER AGES LATINX/HISPANIC
Male 31 0-17* Suppressed Yes 4
Female 9 18-24* 3 No 26
Non-Binary/Transgender 0 25-48 21 Not collected 10
49-65 13
Over 65 3
Not collected 1
10
United States Interagency Council on Homelessness, https://www.usich.gov/goals/chronic/32
WHERE SLEPT RACE DISABILITIES
Out of Doors 19 White 28 Mental Health 12
Vehicle 11 Multiple Races 2 Physical Disability 14
Developmental
RV/Boat 7 Not collected 4 4
Disability
American
Abandoned Building 3 3 Substance abuse 10
Indian/Alaska
Black/African Amer. 2
Asian 1
TOP 10 CAUSES INCOME SOURCES LAST KNOWN ADDRESS
Eviction/Loss of housing 20 SSI/SSDI 15 Thurston 23
Job Loss/unemployment 16 TANF 11 Lewis/Mason/Pierce 7
Family Rejection/Kicked
10 Medicare/Medicaid 5 Other WA 4
out
Alcohol/substance abuse 8 Seasonal/Farm 4 Out of State 3
Physical health/disability 7 Panhandling 3 not collected 3
Mental Illness 4 PT Employment 2
Domestic Violence 4 Relatives/Friends 2
Discharged Justice 4 VA 2
Temp Disability/
Unable to work 3 1
ABD
Abuse/Neglect 2
Olympia: Olympia continues to have the highest concentration of homeless individuals in Thurston
County. As stated before, this is largely because Olympia hosts the majority of homeless services.
Nearly all shelter and transitional counts are also in Olympia. Olympia had an outpouring of staff and
community support and volunteers to engage in the PIT. Olympia counted 314 unsheltered
individuals.
GENDER AGES LATINX/HISPANIC
Male 199 0-17* 54 Yes 31
Female 107 18-24* 17 No 239
Non-Binary/Transgender 5 25-48 203 Not collected 44
Not collected 3 49-65 78
Over 65 8
Not collected 11
WHERE SLEPT RACE DISABILITIES
Out of Doors 212 White 236 Mental Health 142
Vehicle 79 Not collected 26 Physical Disability 121
RV/Boat 20 Multiple Races 18 Substance abuse 113
Abandoned Building 3 Black/African Amer. 16 Developmental Disability 1433
American
14
Indian/Alaska
Islander/Hawaiian 3
Asian 1
TOP 10 CAUSES INCOME SOURCES LAST KNOWN ADDRESS
Eviction/Loss of housing 110 TANF 108 Thurston 179
Job Loss/unemployment 99 SSI/SSDI 79 Lewis/Mason/Pierce 30
Family Rejection/Kicked out 91 Medicare/Medicaid 35 Other WA 34
Alcohol/substance abuse 69 Panhandling 20 Out of State 53
Mental Illness 58 PT Employment 12 Not collected 18
Physical health/disability 55 Relatives/Friends 12
Domestic Violence 43 Seasonal/Farm 7
Unable to work 39 Temp Disability/ ABD 6
Discharged Justice 22 FT Employment 5
Abuse/Neglect 21 VA 4
Unemployment 4
Tumwater: Capturing data on homelessness in Tumwater proved challenging because of the widely
dispersed houseless population. City of Tumwater staff teamed with Together!, a small non-profit
working with youth and families in Tumwater, to survey people already accessing services. With a 7-
day count of families and street outreach on PIT day, Tumwater counted 9 people living unsheltered.
GENDER AGES LATINX/HISPANIC
Male 5 0-17* Suppressed Yes 1
Female 4 18-24* 2 No 7
Non-Binary/Transgender 0 25-48 5 Not collected 1
Not collected 0 49-65 3
Over 65 0
Not collected 1
WHERE SLEPT RACE DISABILITIES
RV/Boat 4 White 9 Mental Health 3
Out of Doors 3 Not collected 0 Physical Disability 3
Vehicle 2 Multiple Races 0 Substance abuse 2
Developmental
Abandoned Building 0 Black/African Amer. 0 0
Disability
American
0
Indian/Alaska
Islander/Hawaiian 0
Asian 0
TOP 10 CAUSES INCOME SOURCES LAST KNOWN ADDRESS34
Eviction/Loss of housing 4 TANF 7 Thurston 7
Physical health/disability 3 Medicare/Medicaid 6 Lewis/Mason/Pierce 0
Job Loss/unemployment 3 SSI/SSDI 3 Other WA 0
Unable to work 2 Panhandling 2 Out of State 0
Discharged Justice 2 Relatives/Friends 1 Not collected 2
Illness 2
Family Rejection/Kicked
2
out
Mental Illness 1
Alcohol/substance abuse 1
Abuse/Neglect 1
Yelm: A small group of dedicated individuals planned and implemented outreach and an event for the
PIT this year. Yelm counted 30 people unsheltered.
GENDER AGES LATINX/HISPANIC
Male 21 0-17* Suppressed Yes 2
Female 8 18-24* 1 No 26
Non-Binary/Transgender 1 25-48 20 Not collected 2
Not collected 0 49-65 7
Over 65 2
Not collected 0
WHERE SLEPT RACE DISABILITIES
Vehicle 17 White 25 Mental Health 10
American
Out of Doors 7 2 Physical Disability 6
Indian/Alaska
RV/Boat 3 Multiple Races 1 Substance abuse 6
Developmental
Abandoned Building 3 Black/African Amer. 1 4
Disability
Not collected 1
TOP 10 CAUSES INCOME SOURCES LAST KNOWN ADDRESS
Eviction/Loss of housing 16 TANF 12 Thurston* 19
Family Rejection/Kicked
14 Medicare/Medicaid 11 Lewis/Mason/Pierce 9
out
Job Loss/unemployment 11 SSI/SSDI 8 Other WA 1
Physical health/disability 10 Panhandling 4 Out of State 1
Unable to work 7 Relatives/Friends 4 Not collected 0
Alcohol/substance abuse 7 Seasonal/Farm 1
Discharged Justice 4 PT Employment 1 *Yelm is the location of
Illness 4 Under the table 1 last permanent
address for 16
Medical Costs 4
respondents.
Domestic Violence 3You can also read