GREEN JURISDICTIONAL ELIGIBILITY CRITERIA ASSESSMENT FOR THE REPUBLIC OF INDONESIA
←
→
Page content transcription
If your browser does not render page correctly, please read the page content below
&GREEN JURISDICTIONAL ELIGIBILITY
CRITERIA ASSESSMENT FOR
THE REPUBLIC OF INDONESIA

March 2020

Prepared for:

&GREEN FUND
PRINS BERNHARDPLEIN 200, 1097JB AMSTERDAM,
NETHERLANDS

PT Hatfield Indonesia
Plaza Harmoni Unit B5-B7
Jl. Siliwangi No.46
Bogor 16131
Indonesia
&GREEN JURISDICTIONAL ELIGIBILITY
    CRITERIA ASSESSMENT FOR
   THE REPUBLIC OF INDONESIA

                 Prepared for:

                &GREEN FUND
          PRINS BERNHARDPLEIN 200
             1097JB AMSTERDAM
                NETHERLANDS

                 Prepared by:

           PT HATFIELD INDONESIA
          PLAZA HARMONI UNITS B5-B7
             JL. SILIWANGI NO.46
                BOGOR 16131
                 INDONESIA

                 MARCH 2020

                 AGRN10116-BG
                  VERSION 5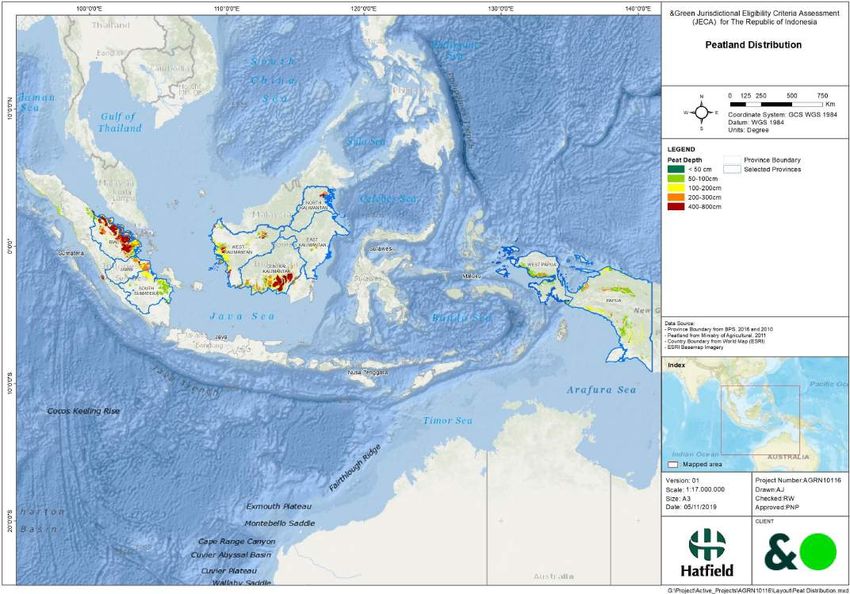
TABLE OF CONTENTS

LIST OF TABLES .............................................................................................II
LIST OF FIGURES ............................................................................................II
LIST OF APPENDICES ....................................................................................II
LIST OF ACRONYMS ......................................................................................III
DISTRIBUTION LIST ..................................................................................... VII
AMENDMENT RECORD ............................................................................... VII

1.0     INTRODUCTION .....................................................................................1

        HIGH LEVEL OF SUMMARY .................................................................1

        JURISDICTIONAL SCOPE .....................................................................4
        3.1      BACKGROUND: KEY ECONOMIC DATA AND MAPS ................................ 5
        3.2      NATIONAL AUTHORITY............................................................................. 10
                 3.2.1 Planning and Budgeting ................................................................ 10
                 3.2.2 Environment and Forestry Governance ......................................... 14
                 3.2.3 Summary of Jurisdiction Scope Analysis ....................................... 19

4.0     CHECKLIST JEC 1: SCOPE ............................................................... 21

5.0     CHECKLIST JEC 2: AMBITION AND STRATEGY ............................. 24

6.0     CHECKLIST JEC 3: PROGRESS ....................................................... 35

7.0     CHECKLIST JEC 4: MONITORING, REPORTING AND
        VERIFICATION (MRV) ......................................................................... 41

8.0     CHECKLIST JEC 5: SOCIAL AND ENVIRONMENTAL
        SAFEGUARD ....................................................................................... 45

&Green JEC Assessment Report                            i                                      Hatfield Indonesia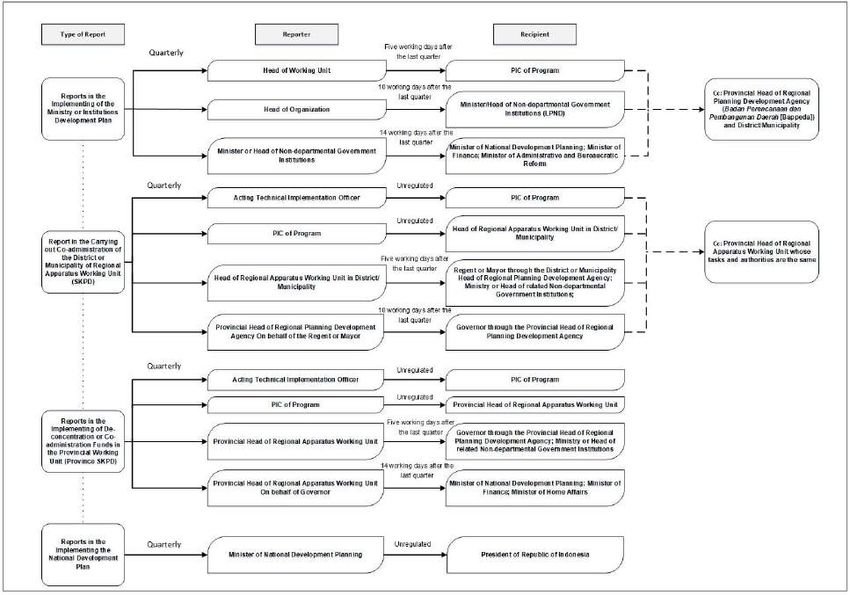
LIST OF TABLES
Table 1       Key economic data for Indonesia and in the nine selected provinces. ......................... 9

Table 2       The changes to authority under previous and new laws on local government in
              the forestry sector. ......................................................................................................11

Table 3       The authority of MOEF, provincial, districts, and municipal governments on
              licensing in forestry sector. .........................................................................................12

Table 4       Regulations to promote cooperation between central and provincial
              government. ................................................................................................................14

Table 5       Deforestation rates from 1990 to 2017. ......................................................................17

Table 6       Global Forest Watch tree cover loss from 2010 to 2018 (million ha). .........................17

Table 7       BAU GHG emission levels and 2030 CM1 and CM2 projections. ..............................18

Table 8       Actual emission rates and reductions in forestry and other sectors from 2010 to
              2017. ...........................................................................................................................19

                                           LIST OF FIGURES
Figure 1      Forest cover (2018) in Indonesia with nine selected provinces indicated. ................... 6

Figure 2      Extent of deforestation (1990-2018) in Indonesia with nine selected provinces
              indicated. ....................................................................................................................... 7

Figure 3      Peatland distribution (2018) in Indonesia with nine selected provinces
              indicated. ....................................................................................................................... 8

Figure 4      Planning and budgeting mechanism and process at the national and provincial
              levels. ..........................................................................................................................12

Figure 5      Development plan national and subnational reporting mechanisms. .........................13

Figure 6      The National Monitoring, Reporting, Verification (MRV) System. ...............................16

Figure 7      Comparison of forestry sector GHG emissions to BAU from 2010 to 2017 with
              emission reduction slope line. .....................................................................................20

                                      LIST OF APPENDICES
Appendix A1   Province Assessment and Selection Process

Appendix A2   Conservation and Protected Area Details in the Nine JECA Priority Provinces

Appendix A3   Subnational Plan and Strategic Action for GHG Emission Reduction in JECA Priority
              Provinces

Appendix A4   Regulations on Forests, Ecosystems, Protection and Land Use Management

Appendix A5   Historical Reference Level from Deforestation, Forest Degradation, Peat
              Decomposition, and Emission Projection in Indonesia

&Green JEC Assessment Report                                      ii                                                   Hatfield Indonesia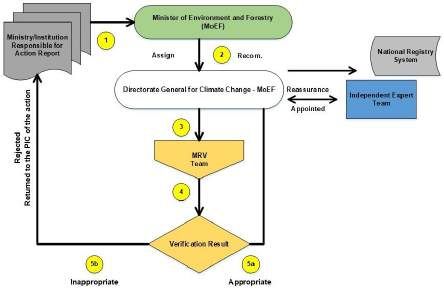
LIST OF ACRONYMS
AFOLU           Agriculture, Forestry and Other Land use
AMDAL           Analisis Mengenai Dampak Lingkungan (Environmental Impact Analysis)
ATR-BPN         Agraria dan Tata Ruang Badan Pertanahan Nasional (Ministry of Agrarian, Spatial
                and National Land Agency)
BAPPEDA         Badan Perencanaan Daerah (Agency for Regional Development)
BAPPEDALDA      Badan     Pengendalian    Dampak      Lingkungan   Daerah   (State   Ministry   for
                Environmental)
BAPPENAS        Badan Perencanaan Pembangunan Nasional (National Development Planning
                Agency)
BAU             Business as Usual
BLU             Badan Layanan Umum (Public Service Agency)
BPDLH           Badan Pengelola Dana Lingkungan Hidup (Environment Fund Management
                Agency)
BRG             Badan Restorasi Gambut (Peatland Restoration Agency)
BUR             Biennial Update Report
CA              Cagar Alam (Nature Reserve)
CBD             Convention on Biological Diversity
CITES           The Convention on the International Trade of Endangered Species
CM1             Counter Measure 1 (Unconditional)
CM2             Counter Measure 2 (Conditional)
CO2e            Carbon Dioxide Equivalent
CSR             Corporate Social Responsible
DBH-DR          Dana Bagi Hasil-Dana Reboisasi (Revenue Sharing from Restoration Fund)
DG              Directorate General
EU              European Union
FCPF            Forest Carbon Partnership Facility
FFI             Fauna and Flora International
FLEGT           Forest Law Enforcement Governance and Trade
FMU             Forest Management Unit
FOLU            Forestry and Other Land Use
FORDA           Forest Research and Development Agency
FREDDI          Funding Mechanism For REDD+ Indonesia
FREL            Forest Reference Emission Level
GHG             Gas House Green
GOI             Government of Indonesia
GRK             Gas Rumah Kaca (Green House Gas)
HCS             High Carbon Stock
HCV             High Carbon Value

&Green JEC Assessment Report                    iii                             Hatfield Indonesia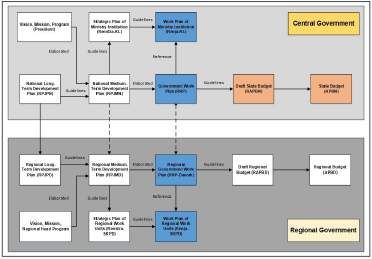
HCVF            High Conservation Value Forest
HD              Hutan Desa (Village Forest)
HKM             Hutan Kemasyarakatan (Community Based Forest Management)
HTHR            Hutan Tanaman Hasil Rehabilitasi (Planted Forest from Rehabilitation Program)
HTI             Hutan Tanaman Industri (Industrial Forest Plantation)
HTR             Hutan Tanaman Rakyat (Community Forest Plantation)
IBSAP           Indonesian Biodiversity Strategy and Action Plan
ICCTF           Indonesia Climate Change Trust Fund
ICRAF           International Centre for Research in Agroforestry
IEU CEPA        Indonesia-European Union Comprehensive Economic Partnership Agreement
IPCC            Intergovernmental Panel on Climate Change
IPHHK           Izin Pemungutan Hasil Hutan Kayu (Timber Harvest Permits)
IPPU            Industrial Process Product Use
ISPO            Indonesia Sustainable Palm Oil
IUCN            Union for the Conservation of Nature
IUPHHK          Izin Usaha Pemanfaatan Hasil Hutan Kayu (Timber Utilization Permit)
IUPHHK-RE       Izin Usaha Pemanfaatan Hasil Hutan Kayu-Restorasi Ekosistem (Timber Utilization
                from Restoration Ecosystem Forest Permit)
IUP RAP         Izin Usaha Pemanfaatan Penyerapan dan/atau Penyimpanan Karbon (Carbon
                Sequestration and Stock Utilization Permit)
JEC             Jurisdictional Eligibility Criteria
JECA            Jurisdictional Eligibility Criteria Assessment
KEE             Kawasan Ekosistem Essensial (The Essential Ecosystem Area)
KKI WARSI       Komunitas Konservasi Indonesia Warung Informasi Konservasi
KLHK            Kementerian Lingkungan Hidup dan Kehutanan (Ministry of Environment and
                Forestry)
KLHS            Kajian Lingkungan Hidup Strategis (Strategic Environmental Assessment)
KPA             Kawasan Pelestarian Alam (Nature Conservation Area)
KPH             Kesatuan Pengelolaan Hutan (Forest Management Unit)
KPHK            Kesatuan Pengelolaan Hutan Konservasi (Conservation Forest Management Unit)
LCD             Low Carbon Development
LGR             Local Government Regulation
LOA             Logged Over Area
LUCF            Land use change and forestry
LULUCF          Land use Land Use Change Forestry
MAB             Man and Biosphere Program
MOEF            Ministry of Environmental and Forestry
MPTS            Multi-Purpose Tree Species
MRV             Monitoring, Reporting and Verification
Mt              Million Metric Ton

&Green JEC Assessment Report                          iv                       Hatfield Indonesia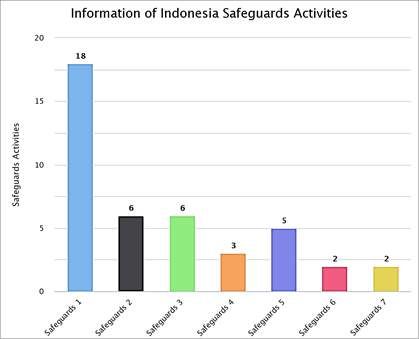
NCCC            National Council on Climate Change
NDC             National Determined Contribution
NFMS            National Forestry Monitoring System
NGO             Non-Government Organization
NGHGEI          National Greenhouse Gases Emissions Inventory
NOAA            National Oceanic and Atmospheric Administration
PAA             Performance Assessment Areas
PCI             Principles, Criteria, and Indicator
PERDA           Peraturan Daerah (Regional Regulation)
PERGUB          Peraturan Gubenur (Governor Regulation)
PESONA          Pengembangan Perhutanan Sosial Nusantara (The Archipelago of Social Forestry
                Development)
PHPL            Pengelolaan Hutan Produksi Lestari (Sustainable Production Forest Management)
PPIKHL          Balai Pengendalian Perubahan Iklim Kebakaran Hutan Lahan (Climate Change and
                Forest Fire Response Unit)
PRISAI          Prinsip, Kriteria, Indikator, Safeguards Indonesia (Principe Criteria Indicator
                Safeguard Indonesia)
RAN-API         Rencana Aksi Nasional – Adaptasi Perubahan Iklim (National Action Plan on Climate
                Change Adaptation)
RAN-GRK         Rencana Aksi Nasional – Gas Rumah Kaca (National Action Plan on Green House
                Gas)
REDD+           Reduce Emission from Deforestation and Degradation
RKU             Rencana Kerja Usaha (Business Work Plan)
RMTDP           Regional Medium-Term Development Plan
RPJMD           Rencana Pembangunan Jangka Menengah Daerah (Regional Medium – Term
                Development Plan)
RPJMN           Rencana Pembangunan Jangka Menengah Nasional (National Medium – Term
                Development Plan)
SEA             Strategic Environment Assessment
SIMONTANA       Sistem Monitoring Hutan Nasional
SIS-REDD+       Safeguards Information System REDD+
S-LK            Sertifikat Legalitas Kayu (Certification of Timber Legality)
SM              Suaka Marga Satwa (Wildlife Sanctuary)
SNC             The Second National Communication
S-PHPL          Sertifikat Pengelolaan Hutan Produksi Lestari (Certification of Sustainable
                Production Forest Management)
SRAP            Strategi dan Rencana Aksi Propinsi (Provincial Strategy and Action Plan)
SVLK            Sistem Verifikasi Legalitas Kayu (Timber Legality Verification System)
TAHURA          Taman Hutan Raya (Grand Forest Park)
TN              Taman Nasional (National Park)

&Green JEC Assessment Report                      v                               Hatfield Indonesia
TWA Taman Wisata Alam (Nature Recreation Park)
UKCCU United Kingdom Climate Change Unit
UM Unit Management
UNFCCC United Nation Framework Convention on Climate Change
WACLIMAD Water Management for Climate Change Mitigation and Adaptive Development of
Lowlands
WPK Wilayah Penilaian Kinerja (Measurement Area of REDD+ Performance)
WWF World Wide Fund for Nature
VPA Voluntary Partnership Agreement
&Green JEC Assessment Report vi Hatfield IndonesiaDISTRIBUTION LIST
The following individuals/firms have received this document:
Name Firm Hardcopies CDs Email FTP
Michael Schlup SAIL Ventures - - -
Aris Wanjaya IDH Sustainable Trade - - -
AMENDMENT RECORD
This report has been issued and amended as follows:
Issue Description Date Approved by
1 First draft version 2019-12-12
2 Second draft version 2020-01-29
3 Third draft version 2020-02-25
4 Fourth draft version 2020-03-04
5 Fifth draft version of &Green 2020-03-13
Jurisdictional Eligibility
Criteria Assessment for the
Republic of Indonesia
Jim Webb Rio Rovihandono
Project Director Project Manager
&Green JEC Assessment Report vii Hatfield Indonesia1.0 INTRODUCTION
The objective of the &Green Fund is to catalyze investment in jurisdictions 1 where local authorities are
committed to reducing deforestation and are actively taking steps to work with the private sector,
communities and civil society to protect forests and peatland. &Green is only able to invest when the
country, region, or province where the investment is located meets the Jurisdictional Eligibility Criteria
(JECs) of the &Green Fund.
This report document outlines the results of desktop assessment of the Republic of Indonesia relative
to the five (5) criteria as set out in the JEC. Section 2 includes a high-level summary of the overall
assessment findings of all five JECs while Sections 4 to 6 outline the assessment of JEC 1 to JEC 5.
In addition, Section 3 provides a determination whether the Republic of Indonesia meets the &Green
Fund objectives.
This Jurisdictional Eligibility Criteria Assessment (JECA) report has been developed by assessing the
Indonesian setting which considers the presence of natural forests and peatlands as the main indicators
related to the impact of development and the dynamics of existing policies and regulations at the
national level to provide sustainable solutions. Since this JECA focusses on the country as the
jurisdiction, a selection of nine provinces has been included to provide subnational insight on policies
or measures that may support or could compromise national efforts due to potentially disproportionate
representation of a province based on the select criteria (APPENDIX A1). Of note: this approach
includes all three previously approved &Green jurisdictions in Indonesia – Jambi, South Sumatera, and
West Kalimantan provinces.
HIGH LEVEL OF SUMMARY
Analysis concludes that the Republic of Indonesia is the correct jurisdictional scope in accordance with
the &Green Fund’s objectives. Since initiated through the Kyoto Climate Agreement in 1997,
sustainable development policies led by the national level in Indonesia have improved the
environmental and social governance within the country to reduce impacts on natural forests, peatlands
and maintain land productivity. Government policies at the national level to support sustainable
development through adaptation and measures to address climate change reflect a strong commitment
to protect natural forests and peatlands.
JEC 1 – Scope
The Republic of Indonesia is the largest archipelagic nation in the world with a total terrestrial area of
188 million hectares (ha); forested areas of 93.9 million ha and non-forested areas of 94 million ha.
Indonesia is the second largest mega-biodiversity country after Brazil with substantial, intact tropical
forests that extend over 88.1 million ha.
Peatland ecosystems encompass approximately 14.9 million ha across 17 provinces although peatland
is concentrated on three major islands: Sumatera (6.4 million ha or 43% of the total peatland),
Kalimantan (4.8 million ha or 32.1%), and Papua (3.7 million ha or 24.7%) 2.
1 The &Green Terms of Reference defines “Jurisdictions” as a national or subnational administrative unit with national or
subnational governance structures endowed with the requisite political and decision-making authority to sustainably manage,
preserve, and monitor forest and/or peatland natural resources.
2 Sistem Informasi Sumber Daya Lahan Pertanian [Internet]. 2011. Bogor: Balai Besar Penelitian dan Pengembangan Sumber
Daya Lahan Pertanian; [updated 2017; cited 2019 October 11]. Available from: http://sisultan.litbang.pertanian.go.id/#
&Green JEC Assessment Report 1 Hatfield IndonesiaThe Ministry of Environment and Forestry (MOEF) at the national and provincial levels manages 552
designated conservation areas – national parks, grand forest parks, and wildlife reserves - covering a
total area of 27.4 million ha. These areas are home to 25 endangered species listed on the International
Union for the Conservation of Nature (IUCN) Red List of Threatened Species and the GOI has
established targets to increase the populations of these species by at least 10 percent from their 2013
baseline populations3.
Additionally, there are 16 biosphere reserves in total area of 27.6 million ha which have been
established to manage interrelated protected areas, buffer zones and landscapes that support
economic, social and cultural of communities surrounding the protected ecosystems and conservation
areas. Details on these conservation areas in the nine provinces deemed most essential for Indonesia
to reach its forest and peatland conservation targets are listed in APPENDIX A2.
As a mega-biodiversity country45, Indonesia plays a strategic role towards biodiversity preservation
globally and this role has been developed in the 2015 to 2020 Indonesian Biodiversity Strategy and
Action Plan (IBSAP). The government of Indonesia (GOI) has ratified several international agreements
and conventions related to biodiversity, including the Convention on Biological Diversity (CBD), the
UNESCO Man and Biosphere Program (MAB), the World Heritage Convention, the Convention on the
International Trade of Endangered Species of Wild Fauna and Flora (CITES), and the Ramsar
Convention (the Convention on Wetlands of International Importance as Waterfowl Habitat) 6.
JEC 2 – Ambition and Strategy
The total unconditional national greenhouse gas (GHG) emissions reduction target for Indonesia by
2030 is 29% (CM1), and the conditional target is 41% (CM2). The emission reduction is relative to the
emissions defined in a “Business as Usual” (BAU) or baseline scenario which is calculated using
deforestation data from primary and secondary forests across the country between 1990 to 2012. The
Forest Reference Emission Level (FREL) is calculated from this same data and the National Forest
Inventory (NFI) to assess Indonesia's success in reducing GHG emissions in the forestry sector.7 The
first National Determined Contribution (NDC) provides the baseline assumption used for a 2020 to 2030
scenario:
BAU: an emissions scenario when the development trajectory does not consider action plan8
and mitigation policies. This is conservative scenario as there were existing policies when it
was determined and reaching the counter measure targets will require additional policies or
support.
Counter Measure 1 (CM1) or unconditional: emissions scenario with mitigations and considers
sectoral development targets.
3
Murniningtyas, E., Darajati, .W., Sumarsja, E. S., editor. 2016. Indonesia Biodiversity Strategy and Action Plan (IBSAP) 2015 -
2020. Jakarta: Kementerian Perencanaan Pembangunan Nasional/BAPPENAS
4Supriatna Jatna. 2018. Konservasi Biodiversitas Teori dan Praktik di Indonesia. Jakarta: Yayasan Pustaka Obor Indonesia .
5 Rosoman, G., Sheun, S.S., Opal, C., Anderson, P., and Trapshah, R., editor. 2017. Toolkit Pendekatan SKT. Singapura:
Kelompok Pengarah Pendekatan SKT.
6 Ministry of Environmental and Forestry. 2018. The State of Indonesia Forest 2018. Jakarta: Ministry of Environmental and
Forestry Republic Indonesia
7 Tingkat Emisi Rujuikan Deforestasi dan Degradasi Hutan (Forest Reference Emission Level) [Internet]. 2016. Jakarta:
Direktorat Jenderal Pegendalian Perubahan Iklim; [updated 2020; cited 2020 March 01]. Available from:
http://ditjenppi.menlhk.go.id/berita-ppi/2655-tingkat-emisi-rujukan-deforestasi-dan-degradasi-hutan-frel.html
8 Academic Script Presidential Decree. 2010. Rencana Aksi Nasional Penurunan Emisi Gas Rumah Kaca. Jakarta
&Green JEC Assessment Report 2 Hatfield Indonesia Counter Measure 2 (CM2) or conditional: emissions scenario with more ambitious mitigations
and considers sectoral development targets when international support is applied.
Within these GHG emission reduction targets, the lion’s share is to be achieved by reductions of
emissions from the forestry sector, i.e. as the result of a comprehensive mix of policies, strategies and
regulations that aim to improve the protection of forests, reducing deforestation and peatland
degradation as well as restoration. The emission reductions from the forestry sector, and related to that,
the reduction of deforestation and peatland exploitation are ambitious, both in absolute terms but also
relative to the contribution of other sectors to the targets: Compared to the BAU scenario for 2030,
emissions from forestry are expected to be reduced by 69% (CM1) or 91% (CM2) respectively. This is
equivalent to reaching an emission level from forestry related sources of 33% from 2010 levels (CM1)
or 10% from 2010 levels (CM2).
JEC 3 - Progress
The GOI has enacted policies and regulations to minimize deforestation, forest degradation and
peatland restoration as well as improved the capacity of key national and subnational stakeholders.
These policies most recently include:
Presidential Instruction 8/2018 – this regulation places a moratorium on the utilization of
peatland and primary forests for palm oil concessions;
Presidential Instruction No. 5/2019 – this regulation permanently suspends the granting of new
permits in conservation forests, protected forests, production forests, and non-forest estates;
and
Presidential Decree No. 77/2018 - this regulation establishes a trust fund for the environment
and forests to support climate change adaptation and mitigation program in the near future.
Building on these regulations, the GOI signed a policy national action plan on sustainable palm oil
plantation for 2019 to 2024 and recently prepared a presidential regulation on the certification system
for sustainable palm oil to strengthen current Indonesia Sustainable Palm Oil (ISPO) which needs
presidential approval.
Progress on emissions reduction appears to have been substantial as initial emission reductions in
2010 were 7.34% below the baseline level although this decreased to -27.83% (i.e. an increase in
emissions) in 2015 until reversing in 2017 to reach 17.54% (equal to 506.4 million metric ton (Mt) CO2e).
This variability in emissions reductions remains strongly influenced by external conditions. Dry weather
in 2015 resulted in a high incidence of wildland and peatland fires which increased emissions over the
BAU scenario while unusually wet weather in 2017 enabled a significant reduction in emissions.
The GOI has implemented measures to reduce deforestation. Since 1990, deforestation rates peaked
between 1996 to 2000 when the average annual rate was 2,255,196 ha 9 to more recently when rates
from 2015 to 2016 were 629,177 ha10 and from 2016 to 2017 were 480,011ha11. Additionally, the Badan
Restorasi Gambut (BRG) stated that restoration and revitalization of peatland in 2017 encompassed
1.2 million ha in seven provinces.
9 National Forest Reference Emission Level for Deforestation and Forest Degradation, MOEF, 2016.
10 Deforestasi Indonesia, MoEF, 2017.
11 Deforestasi Indonesia, MoEF, 2018.
&Green JEC Assessment Report 3 Hatfield IndonesiaJEC 4 – Monitoring, Reporting, and Verification
The Directorate General (DG) of Climate Change in the MOEF manages a functional national MRV
system that inventories GHG emissions from deforestation, forest degradation, and peatlands in
Indonesia (APPENDIX A5). The MRV system is a transparent mechanism integrated into the national
forestry management system and provides publicly accessible information. Periodic training at the
subnational level is provided through the DG of Climate Change to ensure consistent tracking and
reporting of GHG emissions to support reporting at the national level. Data from the national MRV is
used to prepare the FREL, NDC, and Biennial Update Report (BUR) documents that are submitted to
the UNFCCC Secretariat.
JEC 5 – Social and Environment Safeguard
In accordance with the Cancun Agreements from 201012, a framework on social and environment
safeguards was established to mitigate and minimize potential negative impacts from the
implementation of REDD+ activities on existing forestry plans and programs. The MOEF established
the Principles, Criteria, and Indicator (PCI) framework and Safeguards REDD+ Information System
(SIS-REDD+) based on a multi-stakeholder process in 2011 and 2012. Since piloting of the SIS-REDD+
in East Kalimantan and Jambi provinces started in 2013, activities now recorded in 11 provinces. Four
of the nine priority provinces are included in these 11 provinces, namely: East Kalimantan, West
Kalimantan, Riau, and Jambi. However, technical support such as training to conduct SIS-REDD+ for
local stakeholders is needed.
JURISDICTIONAL SCOPE
This section describes the governance, legislative and regulatory frameworks of the assessed
jurisdiction as well as main decision-making structures at the national and select provincial levels.
The Indonesia JECA analyzes the national policies, strategies and regulations relative to the five
&Green JECs. The analysis assesses various components, including the governance structures at the
national level and the identification of key decision makers, and relevant socio-economic data.
To assess the impact of subnational policies at province level this study has selected nine provinces
that were considered essential for Indonesia to reach its national targets due to the importance of their
forests and peatlands and analyzed them more closely how their respective provincial policies and
strategies support or counter the national policies.
These nine provinces are: 1) Riau, 2) South Sumatera, 3) Jambi, 4) Central Kalimantan, 5) West
Kalimantan, 6) North Kalimantan, 7) East Kalimantan, 8) Papua, and 9) West Papua (APPENDIX A1).
The methodology used to select these provinces is provided in Appendix 1 and key economic details
for the country and these selected provinces are listed in Table 1. The purpose of the analysis at
provincial level was to establish the potential risk of Indonesia missing relevant targets and failing to
meet international commitments due to key provinces not having the right policies, strategies, tools and
targets in place to deliver their respective contributions to the national level.
While targets, ambition and strategy related to deforestation, as well as measuring progress in
Indonesia are now set at the national level, the analysis detailed in Appendices A2 and A3 suggests
12 Cancun Agreements: https://unfccc.int/process-and-meetings/conferences/past-conferences/cancun-climate-change-
conference-november-2010/cancun-climate-change-conference-november-2010-0
&Green JEC Assessment Report 4 Hatfield Indonesiasome variability between how national regulations are implemented at the provincial level and implies
that further alignment between the governance levels will be necessary over time to ensure and improve
consistency.
3.1 BACKGROUND: KEY ECONOMIC DATA AND MAPS
Indonesia has an estimated population of 270,625,568 which ranks number four in the world13. The total
territory for the country encompasses 191,686,220 ha14 of which the terrestrial area consists of 93.9
million ha of forested area and 94 million ha of non-forested area. Of the terrestrial area, 120.6 million
ha are state-owned forests. Not all areas classified as forests are forested due to various factors
including encroachment and illegal logging. The country also has extensive mangrove ecosystems,
high endemism and is home to numerous key flora and fauna species. Biodiversity management in
Indonesia is currently guided by the 2015 to 2020 IBSAP.
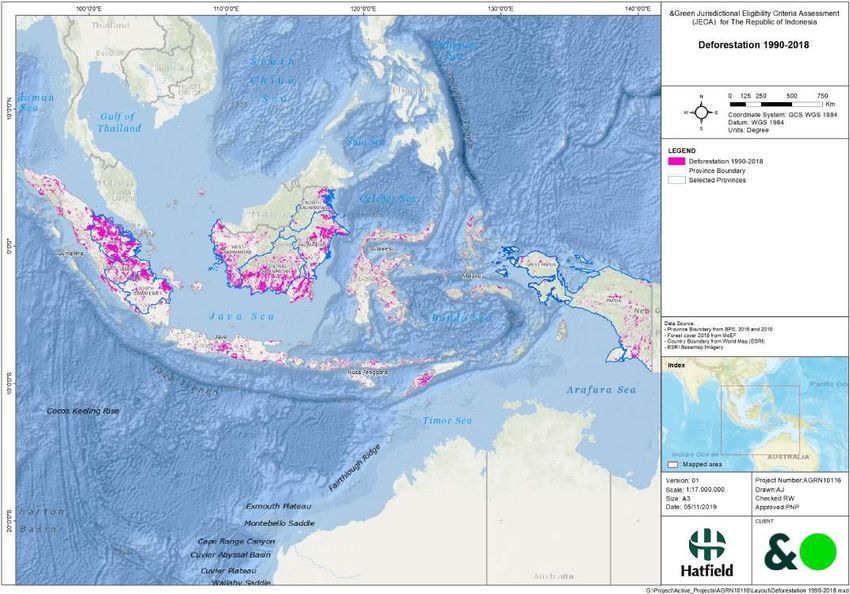
The distribution of forest cover, deforestation and peatland across the country and in the nine priority
provinces are illustrated in Figure 1, Figure 2, and Figure 3.Peatland ecosystems cover 7.9% of
Indonesia’s total land area (Figure 3). As peatlands ecosystems are effective for absorbing and storing
carbon dioxide, protecting them from wildfires is a key measure towards achieving Indonesia’s emission
reduction commitments in the Paris Agreement. Approximately 40% of Indonesia’s total carbon
emissions come from peatlands burned for palm oil and pulp wood plantations. In an effort to protect
peatland ecosystems, the President of Indonesia established the Indonesian Peatland Restoration
Agency (Badan Restorasi Gambut [BRG]) in 201615.
The palm oil industry sector employs more than 17 million people including smallholders and farmers
with indirect education and health care effects on a population of 30 million people in 190 districts in 22
provinces16. Main agricultural products produced in North Sumatra, South Sumatra, Central, West, East
Kalimantan, Aceh, Lampung and South Sulawesi provinces include rubber, coffee, cacao, tobacco, and
wood products. Indonesia is the largest palm oil producer in the world, and the second largest global
producer of rubber and coffee 17.
13
Worldometers [Internet]. 2019. American Library Association (ALA): Indonesia Demographic - Indonesia Population Live; [cited
2019 October 14]. Available from: https://www.worldometers.info/world-population/indonesia-population/
14 Ministry of Environmental and Forestry. 2018. The State of Indonesia Forest 2018. Jakarta: Ministry of Environmental and
Forestry Republic Indonesia
15
Pickup Francine [Internet]. 2017. Why Indonesia Has to Save The Peatland. [Cited 2019 October 26]. Available from:
https://www.id.undp.org/content/indonesia/en/home/presscenter/articles/2017/01/09/why-indonesia-has-to-save-the-
peatland.html
16
Rismansjah.2018. Makalah Rancangan Perpres Kelapa Sawit, disampaikan di Hotel Sahira Bogor, 16 April 2018
17
Informasi Komoditi Online: Komoditas Unggulan Beberapa Provinsi di Indonesia [Internet]. 2019. Komoditi Online Guide; [cited
2019 October 10]. Available from: http://komoditi.co.id/komoditas-unggulan-beberapa-provinsi-di-indonesia/
&Green JEC Assessment Report 5 Hatfield IndonesiaFigure 1 Forest cover (2018) in Indonesia with nine selected provinces indicated. &Green JEC Assessment Report 6 Hatfield Indonesia
Figure 2 Extent of deforestation (1990-2018) in Indonesia with nine selected provinces indicated.

&Green JEC Assessment Report                                                                        7   Hatfield Indonesia
Figure 3 Peatland distribution (2018) in Indonesia with nine selected provinces indicated.

&Green JEC Assessment Report                                                                 8   Hatfield Indonesia
Table 1        Key economic data for Indonesia and in the nine selected provinces.

                                                                                                                                                                                                                                                                       Proportion
                                                                                                                   Central            West                              East            North            South                                                        of Selected
                        Socio-Economic Attribute                               Indonesia           Papua                                                Riau                                                               Jambi         West Papua      Total
                                                                                                                  Kalimantan       Kalimantan                        Kalimantan       Kalimantan        Sumatera                                                      Provinces to
                                                                                                                                                                                                                                                                       Indonesia
Provincial Area/Indonesian Territory (Terrestrial*) (million ha)18               (187.9*)           33.0              15.4             14.7              9.0             12.9              6.9              8.7             4.9                  9.9    115.4            60.2%
Number of    Districts19                                                           416               28                13               12               10                7                4               13               9                   12     108.00            26%
Number of    Cities20                                                              98                 1                 1                2                2                3                1                4               2                    1     17.00            17.3%
Population Density per km2 (2017)21                                                137               10                17               33               77               28                9               90               70                   9      343              N/A
Size of land cover (forest + non-forest) (million ha)22                           88.01             24.8               7.2              5.5              1.5              6.5              5.6              0.7             1.02                 8.8     61.8            70.2%
Peatland area (million     ha)23                                                  14.9               2.6               2.6              1.6              3.9             0.16             0.17             1.28             0.60             1.03        14.1            94.7%
Total deforestation 2015-2018 (million    ha)24                                    1.9              0.11              0.26             0.22             0.12             0.26             0.08             0.05             0.11             0.04         1.2            64.1%
Gross Domestic Product (GDP) at current market prices 2018                     14,837,358         210,660           138,741          194,033          755,274          638,177           86,059          419,723          208,379           79,644     2,730,690         18.4%
(billion rupiah)25
Per Capita Gross Domestic Product (GDP) at current market prices                 55,987            63,404            52,154           38,794          110,827          174,882          120,126           50,144          58,365            84,958     753,654            N/A
2018 (thousand rupiah)26
Gross Domestic Product (GDP) at constant market prices 2010                    10,425,316         159,729            94,596          130,584          482,087          464,823           57,826          298,569          142,995           60,454     1,891,663         18.1%
(billion rupiah)27
Per Capita Gross Domestic Product (GDP) at constant market                       39,339            48,075            35,560           26,108           70,740          127,390           80,716           35,670          40,052            64,487     528,798            N/A
prices 2010 (thousand rupiah)28
Main Agricultural Non-Forest Products (ha)
a) Palm oil (2017)29                                                           14,030,753          66,563          1,500,948        1,553,932        2,776,440        1,046,746         251,689         1,166,421         887,228           98,355     9,348,322         66.6%
b) Rubber   (2017)30                                                           3,659,129            3,741           281,232          366,897          349,803           70,875            1,412          837,431          378,926                 0    2,290,317         62.6%
c) Cacao    (2017)31                                                           1,732,002           40,950            2,017            11,296           6,339             7,902            7,926           11,315           2,264            11,753     101,762            5.9%
d) Coffee   (2017)32                                                           1,253,796           11,227            1,674            11,580           4,505             2,893            1,733          263,339          27,446                 506   324,903           25.9%
e) Coconut   (2017)33                                                          3,653,167          125,616            28,757          106,650          510,925           21,742            1,393           66,556          119,069           21,204     1,001,912         27.4%
f) Nutmeg   (2017)34                                                            180,205               0                 0               85                0               133               0                0               11             15,317      15,546            8.6%
g) Clove   (2017)35                                                             548,091              25                 0              887                0                2                0              314              167                  614    2,009             0.4%
Palm Oil Plantation (million ha)36                                                16.38             0.11              1.78             1.81             3.39             1.28             0.23             1.47             1.13             0.06       11.27            68.79%
Percentage of palm oil plantation to provincial area                              8.54%            0.33%            11.55%           12.30%           37.64%            9.98%            3.40%           16.88%           23.16%            0.59%         ----           9.76%

18 Peta Interaktif KLHK [Internet]. 2019. Indonesia: Kementerian Lingkungan Hidup dan Kehutanan; [cited 2019 October 11]. Available from: http://geoportal.menlhk.go.id/arcgis/apps/Viewer/index.html?appid=8f491695fab04bb99d03962bbd747abd
19
   Wikipedia Ensiklopedia Bebas. 2019. Daftar Kabupaten dan Kota di Indonesia; [cited 2019 October 15]. Available from: https://id.wikipedia.org/wiki/Daftar_kabupaten_dan_kota_di_Indonesia
20
   Wikipedia Ensiklopedia Bebas. 2019. Daftar Kabupaten dan Kota di Indonesia; [cited 2019 October 15]. Available from: https://id.wikipedia.org/wiki/Daftar_kabupaten_dan_kota_di_Indonesia
21
   Badan Pusat Statistik. 2019. Statistik Indonesia 2018. Indonesia: Badan Pusat Statistik
22
   Peta Interaktif KLHK [Internet]. 2019. Indonesia: Kementerian Lingkungan Hidup dan Kehutanan; [cited 2019 October 11]. Available from: http://geoportal.menlhk.go.id/arcgis/apps/Viewer/index.html?appid=8f491695fab04bb99d03962bbd747abd
23
   Sistem Informasi Sumber Daya Lahan Pertanian [Internet]. 2011. Bogor: Balai Besar Penelitian dan Pengembangan Sumber Daya Lahan Pertanian; [updated 2017; cited 2019 October 11]. Available from: http://sisultan.litbang.pertanian.go.id/#
24
   Peta Interaktif KLHK [Internet]. 2019. Indonesia: Kementerian Lingkungan Hidup dan Kehutanan; [cited 2019 October 11]. Available from: http://geoportal.menlhk.go.id/arcgis/apps/Viewer/index.html?appid=8f491695fab04bb99d03962bbd747abd
25
   Badan Pusat Statistik. 2019. Produk Domestik Bruto Indonesia Menurut Pengeluaran 2014-2018. Indonesia: Badan Pusat Statistik
26
   Badan Pusat Statistik. 2019. Produk Domestik Bruto Indonesia Menurut Pengeluaran 2014-2018. Indonesia: Badan Pusat Statistik
27
   Badan Pusat Statistik. 2019. Produk Domestik Bruto Indonesia Menurut Pengeluaran 2014-2018. Indonesia: Badan Pusat Statistik
28
   Badan Pusat Statistik. 2019. Produk Domestik Bruto Indonesia Menurut Pengeluaran 2014-2018. Indonesia: Badan Pusat Statistik
29
   Direktorat Jendral Perkebunan Kementerian Pertanian. 2017. Statistik Perkebunan Indonesia 2016-2018 (Kelapa Sawit). Jakarta: Sekretariat Direktorat Jendral Perkebunan
30
   Direktorat Jendral Perkebunan Kementerian Pertanian. 2017. Statistik Perkebunan Indonesia 2016-2018 (Karet). Jakarta: Sekretariat Direktorat Jendral Perkebunan
31
   Direktorat Jendral Perkebunan Kementerian Pertanian. 2017. Statistik Perkebunan Indonesia 2016-2018 (Cokelat). Jakarta: Sekretariat Direktorat Jendral Perkebunan
32
   Direktorat Jendral Perkebunan Kementerian Pertanian. 2017. Statistik Perkebunan Indonesia 2016-2018 (Kopi). Jakarta: Sekretariat Direktorat Jendral Perkebunan
33
   Direktorat Jendral Perkebunan Kementerian Pertanian. 2017. Statistik Perkebunan Indonesia 2016-2018 (Kelapa). Jakarta: Sekretariat Direktorat Jendral Perkebunan
34
   Direktorat Jendral Perkebunan Kementerian Pertanian. 2017. Statistik Perkebunan Indonesia 2016-2018 (Pala). Jakarta: Sekretariat Direktorat Jendral Perkebunan
35
   Direktorat Jendral Perkebunan Kementerian Pertanian. 2017. Statistik Perkebunan Indonesia 2016-2018 (Cengkeh). Jakarta: Sekretariat Direktorat Jendral Perkebunan
36 Menteri Pertanian.2019. Penetapan Luas Tutupan Kelapa Sawit Indonesia Tahun 2019.Keputusan Menteri Pertanian Nomor 833/KPTS/SR.020/M/12/2019. Jakarta: Kementerian Pertanian

&Green JEC Assessment Report                                                                                                                   9                                                                                                                 Hatfield Indonesia
3.2 NATIONAL AUTHORITY
3.2.1 Planning and Budgeting
Indonesia is a democratic unitary state with a three-tier administrative structure (national, provincial and
local governments) and is made up of 34 provinces, 98 municipalities (Kota), and 416 districts
(Kabupaten) and more than 70,000 villages. The country has parliaments at the city, district, provincial
and central levels. In general, districts are governed by a regent (Bupati) and located in rural areas,
municipalities are governed by a mayor (Walikota) and located in urban areas and provinces are
governed by governors who serve as the central government’s representative.
The country has implemented wide-ranging decentralization measures to bring a measure of autonomy
to Indonesia’s many culturally diverse regions 37. Although drafted in 1999, regional autonomy legislation
– Law No. 22/1999 (administrative decentralization) and Law No. 25/1999 (financial administration) –
were implemented in 2001 to focus on empowering sub-provincial governments. The provincial
government is responsible for coordinating functions among the district and city governments and
performing certain roles that the district and city governments are unable to perform. The central
government retained the responsibility for defense, justice, finance, monetary policy and development
planning38.
As Law No. 22/1999 on regional government and Law No. 25/1999 on fiscal balance between central
and regional governments were drafted without a well-developed transition and implementation
process, a resultant increase in the issuance of land use permits at the subnational level required the
central government to mediate. As a result, Local Government Law No. 23/2014 distributed most
governmental functions between the central and provincial governments while the district and municipal
governments retained the authority for several functions to a lesser extent than in the former Law No.
32/2004 (Table 2), resulting in overall improved land-use planning and associated permitting.
The forestry sector is an example where, under the previous law, authority was decentralized to the
district level but under the new law, the authority to manage the forestry sector transferred from the
district to the provincial government39. Under the 2014 Local Government Law the central and provincial
governments share responsibility for the forest inventory, forest management (Table 2) and issuance
of forest business permits (Table 3). However, residual issues of land use permit allocations remain
from the earlier transition period and are important issues to be addressed in the context of policies to
control deforestation activities and peatland development.
37
Mumbunan S, Ring I and Lenk T. 2012. Ecological Fiscal Transfers at the Provincial Level in Indonesia. Leipzig: Helmholtz –
Zentrum für Umweltforschung GmbH - UFZ Permoserstr. 15 04318 Leipzig.
38
Green Keith [Internet]. 2005. Decentralization and Good Governance: The Case of Indonesia. [cited 2019 October 10].
Available from:https://mpra.ub.uni-muenchen.de/18097/1/Decentralization_and_Good_Governance
The_Case_of_Indonesia.pdf
39
Steni Bernadius. 2016. Review of the New Local Government Law. Jakarta: Institut Penelitian Inovasi Bumi (INOBU)
&Green JEC Assessment Report 10 Hatfield IndonesiaTable 2 The changes to authority under previous and new laws on local
government in the forestry sector40.
Law No. 32/2004
Authority Law No. 23/2014
Province District/Municipality
Forest inventory Conducting inventories of Conducting inventories of Provincial governments are given
production forest, production forest, the opportunity to assist forest
protected forest, and protected forest and planning by providing technical
forest parks and forest parks, and considerations, such as proposing
watershed areas that cut watershed areas in changes in forest area status and
across several districts/ district/municipal areas functions, establishment of FMUs,
municipalities and others
Designation of Providing technical Proposing the designation
forest production considerations regarding of production forests,
forests, the designation of protection forest,
protected forest, production forest, conservation areas,
conservation protection forest, wildlife reserves and
forest and conservation areas, hunting area parks
hunting park wildlife reserves and
area hunting park areas
Forest area for Preparing and providing Proposing the
special purposes technical considerations management of forest
regarding the areas with special
management of forest purposes for customary
area for special purposes law communities,
for customary law research and
communities, research development, forestry
and development, forestry education and training,
education and training, and social and religious
and social and religious institutions at the
institutions at the district/municipal scale
provincial scale taking into account the
governor’s considerations
Forest Providing technical Proposing a change in Provincial government is conducting
management or considerations for the status and function of the designation of forest functions in
utilization change of forest area forest area and change of FMU, except for conservation forest
status and function, land status from private management unit (KPHK)
change of land status from land to forest area and Provincial government is conducting
private land to forest area, utilization and exchange forest utilization in production and
and use/exchange of of forest areas. protected forest areas, including:
forest areas. Providing consideration 1.Utilization of forest area;
Conducting the regarding the architecture
2.Utilization of non-timber-forest
formulation of architecture and proposal to establish
products;
and establishment and management areas for
proposing the designation protected forest and 3. Extraction of forest products; and
of protected and production forests and 4.Utilization of forest area for
production forest institution of forest environmental services, except for
management unit (FMU) management areas. carbon storage sequestration.
and providing technical District and municipal government
consideration regarding responsible for the management of
regional institution for Grand Forest Park (TAHURA)
forest management
40 Steni Bernadus. 2016. Review of the New Local Government Law. Jakarta. Institute Penelitian Inovasi Bumi (INOBU)
&Green JEC Assessment Report 11 Hatfield IndonesiaTable 3 The authority of MOEF, provincial, districts, and municipal governments on
licensing in forestry sector41.
Ministry of District or
Provincial
Permit or Authority Environment Municipal
Government
and Forestry Government
Business Permits for Timber Utilization in Natural Forest,
Ecosystem Restoration Forest, Industrial Timber Plantation
(HTI), Reserved Areas for People’s Timber Plantation (HTR)
and Plantation Forest from Rehabilitation (HTHR)
Business Permits for Non-Timber Forest Products Utilization
(IPHHK)
Business Permits for Timber Forest Product Extraction
(IPHHK)
Forest Area Lease Permits
Approval for Principle for Forest Area Exchange
Approval for Principle Forest Area Exchange
At the national level, the Ministry of National Development Planning (BAPPENAS) provides guidance
on mechanisms and procedures for planning and budgeting with the central and regional governments
(Law No. 25/2004 on National Development Plan System) (Figure 4).
Figure 4 Planning and budgeting mechanism and process at the national and
provincial levels.
To ensure monitoring and evaluation on planning and budgeting activities under Law No. 25/2004,
government Regulation No. 39/2006 prescribes various reporting mechanisms (Figure 5).
41 Steni Bernadus. 2016. Review of the New Local Government Law. Jakarta. Institute Penelitian Inovasi Bumi (INOBU)
&Green JEC Assessment Report 12 Hatfield IndonesiaFigure 5 Development plan national and subnational reporting mechanisms. &Green JEC Assessment Report 13 Hatfield Indonesia
3.2.2 Environment and Forestry Governance
The central government has taken important steps to respond to climate change through the
establishment of and strengthening institutional arrangements that aim to achieve the national targets,
coordinate with the provincial government and fulfil commitments on the global level. The central
government has established policies and a national strategic plan to address biodiversity conservation,
sustainable development, and climate change adaptation and mitigation (Table 4).
Table 4 Regulations to promote cooperation between central and provincial
government.
Level Authority
Category Regulation
Central Government Provincial Government
Biodiversity Indonesian BAPPENAS ensures The provincial
Conservation Biodiversity Strategic biodiversity conservation is government is
Action Plan (IBSAP) adopted in the Long-Term responsible for the
2015 to 2020 Development Plan in all management and
relevant national ministry conservation of
offices and institutions. protected areas within
The DG of their boundaries.
Conservation Natural MOEF mandated that
Resources and protected areas outside of The provincial
Ecosystem-MOEF existing conservation areas, government ensures
Regulation within and outside the state- the conservation of
No.8/KSDAE owned forests, are managed natural resources and
/BPE2/KSA.4/2016 to maintain natural ecosystems are
biodiversity. incorporated in the
strategic environment
assessment (SEA).
Ecosystem The Law No.32/2009 Central government ensures The provincial
Protection the policy implementation of government is
ecosystem protection, responsible for the
Government protected areas and management and
Regulation No. management. conservation of
28/2011 protected areas within
Peatland Restoration Agency
(BRG) developed an action their boundaries.
Government plan for sustainable peatland Seven provincial
Regulation No. management through a government have
57/2016 and rehabilitation and restoration supported the BRG by
Presidential Decree program in priority areas. restoring 2.5 million ha
No. 1/2016 The GOI permanently stopped of peatland ecosystems
issuing new permits for in Riau, Jambi, South
Sumatera, West
President concessions in natural forests
and peatlands. Kalimantan, Central
Presidential
Kalimantan, South
Instruction No.
Kalimantan, and Papua
5/2019
provinces with support
from various donors
including the Norwegian
government, GIZ and I
World Bank Group.
Environment Government Central government monitor The provincial
Assessment Regulation No. and evaluate the government manage
46/2016 implementation of the Strategic provincial
Environment Assessment environmental
(SEA) to ensure the assessment and
Government sustainability of natural management including
Regulation No. resources and to minimize managing and
27/2012 potential environmental risks at controlling high
national level. conservation value
Central government ensure the areas outside the state-
implementation of environment owned forest
&Green JEC Assessment Report 14 Hatfield IndonesiaLevel Authority
Category Regulation
Central Government Provincial Government
The Ministry of Home impact assessment (EIA) is The provincial
Affairs Regulation No. measured and monitored at government also acts
7/2018 national level as supervisor and
The Ministry of Home Affairs decision maker for
monitor, evaluate and provide issuing environmental
guidance for SEA permits and reviewing
implementation to District and impact assessments
Provincial. (AMDAL [EIA]).
REDD+ Presidential Decree MOEF conducting the The Provincial
Implementati 16/2015 on the implementation of REDD+ from Government establish
on establishment of the the GHG inventory through the Regional Plan on
DG of Climate Change MRV to set out FREL and NDC GHG Emission
in MOEF to develop and reporting to the United Reduction (RAD-GRK)
National REDD+ Nation Framework Convention to measure the level of
Strategy and MRV on Climate Change (UNFCCC). emissions and to
framework which BAPPENAS developed project the emission
enables the GOI to guidance for mainstreaming reductions
report on the NDC and REDD implementation and low While up to 11
FREL carbon development initiative to provinces had a
Presidential Decree sectoral ministry and provincial regional committee for
No. 61/2011 on the governments. REDD+ implementation
National Action Plan (Papua, Central, East,
for the Reduction of West Kalimantan, South
Emissions of and West Sumatra,
Greenhouse Gases Jambi, Aceh and South
(RAN-GRK) Sulawesi), this
committee currently
exists in only West
Sumatra and East
Kalimantan provinces.
Monitoring President Decree No. MOEF inventories GHG N/A
Reporting 71/2011 emissions, monitors the MRV
and MOEF Regulation No. system implementation once
Verification P72/Menlhk/Setjen/ku annually to generate the FREL,
m.1/12/2017 NDC, and Biennial Update
Report (Figure 6).
MOEF Regulation No.
P73/Menlhk/Setjen/ku MOEF conducts an annual
m.1/12/2017 review of the National Action
Plan for GHG reduction to
assess results from the energy,
transportation, industrial
process product use (IPPU),
agriculture, forestry, and waste
sectors.
Land Use Presidential Decree Ministry of Economic Affairs is Provincial and district
Management No. 9/2016 implementing the One Map government should
Policy to ensure utilization of provide regional
land use data for development geospatial information
strategy. that connect to the
The DG of Climate Change - national level.
MOEF provide data on GHG
inventory.
Financial Presidential Decree MOEF, Coordinating Ministry of Provincial government
Support for No. 77/2018 Economy and Ministry of can propose funding in
REDD+ Finance is assessing the climate change
Implementati applicability and function of an adaptation and
on The governments of environmental trust fund mitigation projects once
Indonesia and Norway (Badan Pengelola Dana the BPDLH is
Letter of Intent in May Lingkungan Hidup [BPDLH]). functional.
2010 The BPDLH would finance
climate change adaptation and
&Green JEC Assessment Report 15 Hatfield IndonesiaLevel Authority
Category Regulation
Central Government Provincial Government
mitigation (environment,
forestry, renewable energy,
carbon trade, and ecosystem
services).
The DG on Climate Change
conducted MRV and mitigation
actions for reducing GHG
emissions from deforestation
and forest degradation on the
“resulted based payment
mechanism.
The government of Norway will
provide results-based
payments for actual emission
reductions from deforestation
(were 228,349,830 tCO2 – a
reduction of 8,597,610 tCO2)
and from forest degradation
(were 42,743,041 tCO2 – an
increase of 1,191,560 tCO2.)
While emissions from forest
degradation increased, the net
reduction due to deforestation
was 7,406,051 tCO2.
Figure 6 The National Monitoring, Reporting, Verification (MRV) System42.
42 Direktorat Jendral Pengendalian Perubahan Iklim. 2017. Laporan Inventarisasi GRK dan Monityoring, Pelaporan dan
Verifikasi. Jakarta. Kementerian Lingkungan Hidup dan Kehutanan.
&Green JEC Assessment Report 16 Hatfield IndonesiaProgress Towards REDD+ Target and Commitments
Deforestation rates and emissions have varied between 1990 and 2017 (Table 5). Prior to submitting
the first NDC to the UNFCCC, the highest deforestation rate of 2.25 million ha/year was recorded from
1996 to 2000. Following the submission, the highest deforestation rate of 1.09 million ha from 2014 to
2015 was predominantly due to forest fires. This later data does not include emission rates.
Table 5 Deforestation rates from 1990 to 2017.
% Deforestation Emissions
Forest Deforestation
Years Period Annual Rate Period Total Annual Rate
cover (ha) to Forest
Cover Total (ha) (ha/year) (tCO2e) (tCO2e/year)
1990 to 1996 1 n/a n/a 3,828,973 638,162 1,193,476,158 198,912,693
1996 to 2000 1 n/a n/a 9,020,783 2,255,196 2,948,024,748 737,006,187
2000 to 2003 1 n/a n/a 1,333,085 444,3627 428,854,857 142,951,619
2003 to 2006 1 n/a n/a 2,527,909 842,636 793,089,246 264,363,082
2006 to 2009 1 n/a n/a 2,741,459 913,820 859,201,887 286,400,629
2009 to 2011 1 n/a n/a 1,101,040 550,520 347,782,080 173,891,040
2011 to 2012 1 90,110,6003 0.87% 786,052 786,052 248,937,119 248,937,119
2012 to 2013 2 89,052,9003 0.82% 728,000 728,000 n/a n/a
2013 to 2014 2 88,323,0003 0.45% 397,400 397,400 n/a n/a
2014 to 2015 2 88,136,0003 1.24% 1,092,182 1,092,182 n/a n/a
2015 to 2016 2 86,626,0003 0.73% 629,177 629,177 n/a n/a
2016 to 2017 2 87,728,3003 0.55% 480,011 480,011 n/a n/a
1
Source: National Forest Reference Emission Level for Deforestation and Forest Degradation (emission not included peat
decomposition), MOEF, 2016
2
Source: Deforestation Indonesia, MoEF, 2014,2015,2016,2017,2018.
3
Source: Recapitulation of forest cover in Indonesia, MoEF, 2011,2012,2013,2014,2015,2016,2017.
Global Forest Watch has also determined tree cover loss from 2010 to 2018 based on satellite imagery
(Table 6) resulting in different deforested areas compared to the nationally reported data in Table 5.
Table 6 Global Forest Watch tree cover loss from 2010 to 2018 (million ha) 43.
Year
2010 2011 2012 2013 2014 2015 2016 2017 2018
Tree Cover Loss
1.3 1.5 2.2 1.1 1.9 1.7 2.4 1.3 1.2
(million ha)
Following the Paris Agreement, Indonesia strengthened its commitment to CO 2e reductions with the
first NDC submitted to the UNFCCC in November 2016. The NDC included an unconditional national
target (CM1) of 29% or 834 MtCO2e and a conditional national target (CM2) of 38% or 1,081 MtCO2e
over the BAU scenario by 2030 (Table 7). However, the Indonesian NDC states that the CM2 target is
43 Global Forest Watch: http/data.globalforestwatch.org/search
&Green JEC Assessment Report 17 Hatfield Indonesia41% of the BAU scenario although the data in the table state 38%. The table in the NDC is replicated
in Table 7. This discrepancy has not been explained in the NDC or other documents.
Table 7 BAU GHG emission levels and 2030 CM1 and CM2 projections44.
BAU CM1 CM2
Emission Emission Emission Emission
Sectors % of % of
2010 2030 Level Reduction Level Reduction
Total Total
(MtCO2e) (MtCO2e) 2030 2030 2030 2030
BAU BAU
(MtCO2e) (MtCO2e) (MtCO2e) (MtCO2e)
Forestry 647 714 217 4971 17.2% 64 6502 23%
Other 688 2,154 1,817 337 11.8% 1,723 432 15%
sectors3
All sectors 1,334 2,869 2,034 834 29% 1,787 1,081 38%
1
A decrease of 69% compared to 2030 BAU.
2
A decrease of 91% compared to 2030 BAU.
3
Other sectors are energy, waste, IPPU, and agriculture.
To meet these targets, various sector-specific mitigation actions have been identified in the National
Action Plan for the Reduction of Emission of Greenhouse Gases while actual GHG emissions are
reported by the DG of Climate Change, MOEF. The forestry and other sectors achieved reductions in
emissions from 2010 to 2017 and emission reductions in 2017 in the forestry sector was impressive at
506.4 MtCO2e which exceeded the 2030 CM1 target of 497 MtCO2e (Table 8 and Figure 7). However,
the forestry sector reductions were not consistent due to climatic events.
In 2014 and into early 2016, dry weather conditions and an El Nino event contributed to a severe fire
seasons in Indonesia resulting in extensive forest and peatland fires 45. The net result in 2014 and 2015
was an increase in deforestation and emissions in the forestry sector (Table 5 and Table 8). The wetter
weather pattern leading into a weak La Nina event in early 2018 resulted in fewer fires and a reduction
in emissions. A trend line analysis, which indicates the progress over time, for the 2010 to 2017 emission
reductions in the forestry sector produces a negative or declining slope; the red dotted line in Figure 7.
This trend line indicates that because emission reductions are decreasing and becoming further away
from the target, emission reductions are too ambitious and require additional land management and
policy and planning to be reached, in particular to improve the resilience of forests and peatlands to
climatic variability.
The progress in later years has been supported through the establishment of the Peatland Restoration
Agency (BRG and policies to protect forests and peatlands (Presidential Instruction No. 5/2019) and
improve palm oil plantation management (Presidential Instruction No. 8/2018) as well as policies on law
enforcement. The Second BUR in 2018 looks at all sectors and indicates, for example, that while
emissions in the agricultural sector in 2016 were 117 MtCO2e which exceeded the BAU of 114 MtCO2e,
the forestry sector emissions of 635 MtCO2e was a reduction from the 764 MtCO2e BAU.
44 Direktorat Jendral Pengendalian Perubahan Iklim. 2017.Strategy Implementasi NDC. Jakarta. Kementerian Lingkungan dan
Kehutanan.
45 NASA: Severe 2015 Indonesia Fire Season Linked to El Nino Drought. 2015; [cited 2020 January 21]. Available from:
http://www.nasa.gov/feature/Goddard/2016/severe-2015-indonesia-fire-season-linked-to-el-nino-drought
&Green JEC Assessment Report 18 Hatfield IndonesiaYou can also read