The COVID-19 pandemic's footprint in India: An assessment on the district-level susceptibility and vulnerability - Munich Personal ...
←
→
Page content transcription
If your browser does not render page correctly, please read the page content below
Munich Personal RePEc Archive

The COVID-19 pandemic’s footprint in
India: An assessment on the district-level
susceptibility and vulnerability

Imdad, Kashif and Sahana, Mehebub and Rana, Md Juel
and Haque, Ismail and Patel, Priyank Pravin and Pramanik,
Malay

Department of Geography, Pandit Prithi Nath PG College,
Chhatrapati Shahu Ji Maharaj University, 96/12, Mahatma Gandhi
Marg, Kanpur - 208001, Uttar Pradesh, India, School of
Environment, Education and Development, University of
Manchester, Oxford Road, Manchester M13 9PL, United Kingdom,
Centre for the Study of Regional Development, School of Social
Sciences, Jawaharlal Nehru University, New Delhi - 110067, India,
International Institute for Population Sciences, Mumbai - 400088,
India, Indian Council for Research on International Economic
Relations (ICRIER) Plot No. 16-17, Sector-6, Pushp Vihar
Institutional Area, Saket, New Delhi - 110017, India, Department of
Geography, Presidency University, 86/1, College Street, Kolkata -
700073. West Bengal, India, Department of Development and
Sustainability, School of Environment, Resources and Development,
Asian Institute of Technology (AIT), PO. Box 4, Klong Luang,
Pathumthani - 12120, Thailand, Centre of International Politics,
Organization, and Disarmament, School of International Studies,
Jawaharlal Nehru University, New Delhi - 110067, India

31 April 2020

Online at https://mpra.ub.uni-muenchen.de/100727/
MPRA Paper No. 100727, posted 01 Jun 2020 04:41 UTC
The COVID-19 pandemic's footprint in India: An assessment on the district-
 level susceptibility and vulnerability

Abstract
In this nationwide study, we trace the COVID-19 global pandemic's footprint across India's districts. We
identify its primary epicentres, which are the major international airports of Mumbai and Delhi. We then track
the outbreak into India's hinterlands in four separate time-steps that encapsulate the different lockdown stages
implemented. Using a detailed district-level database that encompasses climatic, demographic and
socioeconomic parameters, we identify hotspots and significant clusters of COVID-19 cases, which are
examined to discern temporal changes and predict areas where the pandemic can next spread into. Of prime
concern are the significant clusters in the country's western and northern parts and the threat of rising numbers
in the east. Encouraging insights emerge from Kerala in South India, where virus hotspots have been
eradicated through effective contact-tracing, mass testing and accessible treatment. Allied with this, we
perform epidemiological and socioeconomic susceptibility and vulnerability analyses. The former elicits areas
whose resident populations are likely to be physiologically weaker in combating the virus and therein we
expect a high incidence of cases. The latter shows regions that can report high fatalities due to ambient poor
demographic and health-related factors. Correlations derived from the generalised additive model show that
a high share of urban population and high population density (1500-2500 people/km2), particularly in slum
areas, elevate the COVID-19 risk. Aspirational districts have a higher magnitude of transmission
(susceptibility) as well as fatality (vulnerability). Discerning such locations can allow targeted resource
allocation by governments to combat the next phase of this pandemic in India.

Keywords: epidemic outbreak, contagion spread, socioeconomic analysis, epidemiological attributes, novel
coronavirus, lockdown measures

Graphical Abstract
The COVID-19 pandemic's footprint in India

1. Introduction
At the time of writing, the COVID-19 global pandemic has raged for about five months, affecting 212 countries
and territories worldwide and two international conveyances (https://www.worldometers.info/coronavirus/),
in all afflicting over 3.7 million people and causing over 250,000 deaths till date. The emergence of this
pandemic, as a previously unreported mystery illness or unknown strain of pneumonia in the Wuhan region of
China (Columbus et al. 2020; Lupia et al. 2020; Torales et al. 2020), in December 2019 and its rapid dispersion
across the globe in a matter of weeks (Bonilla-Aldana et al. 2020; Cruz et al. 2020), had caught countries and
healthcare systems off-guard. The primary mode of spread from its centre of origin has been through air-travel
to other major cities in different countries and thereafter from those places further into their hinterlands and
adjacent regions, often on the coattails of returning tourists or businessmen, students or other travellers
(Chakraborty and Maity 2020). With community transmission being set in motion often just days after the first
cases were reported in some areas, the pandemic's burgeoning footprint overwhelmed healthcare services quite
swiftly. The aged and those with existing health issues or compromised immune systems have been particularly
vulnerable to this coronavirus (MacConnachie et al. 2007). Ameliorative measures have ranged from initially
quarantining patients to progressively containing entire healthcare centres, city blocks and provinces (Harapan
et al. 2020), as the virus' ambit grew beyond administrative, political and geographic boundaries. With
transmissions occurring through contact between individuals, via respiratory droplets at close quarters or from
contaminated surfaces (WHO 2020a), healthcare officials and governments have introduced and widely
propagated the concept of 'social distancing' (Manderson and Levine 2020) to limit the spread of the virus,
with cancellations of major sporting and cultural events (Munoz and Meyer 2020; Parnell et al. 2020) and
diplomatic gatherings (Sharfuddin 2020), closure of religious institutions (Alyanak 2020) and the suspension
of academic conferences and teaching activities (Gallo and Trompetto 2020). However, with the virus' spread
having continued unabated and possibly being supplanted more alarmingly by transmissions from pre-
symptomatic and asymptomatic individuals (WHO 2020b), further restrictive measures in the form of the
partial and complete lockdown of regions or even entire countries were quickly adopted. Such lockdowns
sought to heavily restrict the movement of those possibly carrying the contagion and to forbear them from
transmitting it to others/other areas as well as curb the virus' spread by stopping healthy people from moving
into spaces in which they were more likely to pick it up or come into contact with pre-
symptomatic/asymptomatic individuals. Other nations, like India, where the outbreak assumed a potentially
threatening status some weeks after its initial rampage in East Asia and Western Europe, were somewhat
quicker to highlight social distancing and impose such lockdown measures (The Lancet 2020), seeking to take
pre-emptive steps to combat the virus' spread and to try and keep affected populations to a minimum.
 Yet, despite such restrictive measures being imposed, many countries, India included, have suffered
increasingly rising outbreaks of the virus and experienced a sharp jump in cases due to existing gaps in their
healthcare systems and apparent vulnerabilities in their socioeconomic and political-administrative setups
(McAleer 2020), which exacerbate the risk of contamination and dampen recovery rates. While lives have
definitely been saved as a result of the lockdown measures (Dwivedi 2020) and transmission rates are now
checked in quite a few countries where the outbreaks occurred first (i.e. in China, South Korea, Italy, Spain,
 2
The COVID-19 pandemic's footprint in India

Germany and France, which have all reported declining numbers of new cases and much-reduced transmission
rates in the last few weeks), such effects are still not as apparent across parts of India even a month after the
initial lockdown was implemented, with cases continuing to rise at increasing rates. This is also the scenario
in many other affected regions where numbers continue to rise (i.e. Russia and Brazil) or has not yet tapered
off significantly (i.e. the United States and the United Kingdom). On the other hand, the shutting down of
offices and factories has already cast what is likely to be a lasting effect on the global economic landscape
(Ajami 2020; Gong et al. 2020; McKibbin and Fernando 2020). In particular, nations that have large numbers
of low-income migrant workers, who mostly live on-site at their workplaces or are heavily dependent on daily
incomes/wages for sustenance, have perforce been uprooted. This has, in all probability, further reduced their
ability to withstand a viral outbreak due to impaired health from malnutrition/hunger and the need to travel
long distances to return to their original homes. Such a situation has especially emerged in India, where
thousands of migrant workers mostly from the southern and western zones of the country, have thronged bus
terminals and railway stations or have even attempted to travel across states on foot (Lal 2020; Singh 2020),
raising the spectre of further widespread community transmission and the incursion of the virus into especially
socioeconomically vulnerable areas (and more importantly into rural hinterlands) that are ill-equipped in terms
of healthcare (both at the individual and community level for resident populations and returning migrants-
Nacoti et al. 2020) and economic resources to deal with a massive surge in infections. Alongside the
physiological threat to life and the economic threat to livelihoods posed by the current situation, arises an
equally grim prospect of impaired mental health and similar attendant issues (Goyal et al. 2020; Torales et al.
2020; Wang et al. 2020). Continuous confinement at home can make daily life seem dysfunctional in an
apparently dystopian society, with residents in constant fear of what may transpire (Ahorsu et al. 2020;
Raffaeta 2020).
 With no vaccine yet available, the prospect of a viral return in this coronavirus' original or mutated
form casts further threat, more so on populations and areas that are most at risk from such an outbreak. We,
therefore, seek to examine a number of aspects in this paper. Firstly, we delve into the pattern of COVID-19
outbreak in India, relating this with the influx of tourists from abroad (as the COVID-19 is an 'imported' virus-
WHO 2020b) and those availing of air-travel in the country. Secondly, we track the contagion's spread through
the nation during the successive/ongoing lockdown phases and map the geographic trajectories of COVID-19
infection in India together with its potential outreach zones, i.e. the areas where the virus was most likely to
spread into when this analysis was undertaken. For doing this, we have had to perforce use slightly older data
than that which reflects the current situation, due to the intervening lag time for computation, analysis and
writing up of the results. Some research accounts have noted that the contagion's virulent nature is dampened
and hindered by higher temperatures (Briz-Redon and Serrano-Aroca 2020; Prata et al. 2020; Wu et al. 2020;
Xie and Zhu 2020) and that it reacts to raised humidity levels (Ahmadi et al. 2020; Luo et al. 2020; Qi et al.
2020), conditions which mostly persist across the India subcontinent. Along with this, clinical studies, as well
as actual treatment accounts, have reported that hydroxychloroquine or chloroquine based drugs have achieved
a measure of success in combating the COVID-19 virus (Colson et al. 2020; Gao et al. 2020; Singh et al. 2020).
India has had a history of chloroquine use and vaccination due to its historical struggles with malaria (Das et
 3
The COVID-19 pandemic's footprint in India

al. 2012; Anvikar et al. 2014) and it may thus be possible that her citizens are likely more resistant to the
COVID-19 threat. Based on the above two aspects, we estimate the epidemiological susceptibility of a
particular location (since this is, in essence, a medical/health issue first and foremost), identifying those areas
where the disease is most likely to affect people. Subsequent to this, we examine the overall susceptibility of
a region to a COVID-19 outbreak, factoring in the socioeconomic and health conditions of its residents, which
makes them more prone to succumbing to the virus. Finally, we look at the overall socioeconomic vulnerability
of the districts (i.e. where deaths are most likely) and its variation across the country.
 As stated before, the lockdown has resulted in one of the largest mass migrations in contemporary
India (in terms of movement being concentrated in such short timeframes) (Abi-Habib and Yasi 2020). It is
obvious that some regions shall be more affected than others in this light, due to loss of income and livelihood
and the dropping off in agricultural and industrial production. While some industries (both agro-based and
manufacturing and on-site construction) and offices have gradually been opened up under the current lockdown
phase operative in the county, the effects of their complete closure for over a month are sure to reverberate
across regions, both urban and rural. We highlight those areas that are likely to be worst affected in such a
situation. By combing our outputs from the epidemiological and overall susceptibility analyses together with
that obtained from the ensuing vulnerability study, we thus identify regions that have already been the worst
affected in terms of the virus' outbreak alongside those that are at the greatest risk from its further spread,
firstly in medical terms, as well as in the light of further impaired economic activities, if the rising trend of the
COVID-19 outbreak in India continues unabated over the coming weeks. As demonstrated already (e.g. Fauci
et al. 2020; Li et al. 2020; Prem et al. 2020; Shi et al. 2020; Yang et al. 2020), such studies are crucial towards
gaining a comprehensive idea of the pandemic's likely impact on a country (in health, economic and societal
terms), not only in light of the current ongoing situation but to also gauge possible scenarios and ascertain
target areas for pre-emptive resource allocation in the near future.

2. Susceptibility and vulnerability analyses in the context
Susceptibility analyses are important to ascertain the likely incidence of disease and the populations it can
affect (Lohmueller et al. 2003). This also helps health-care providers perceive the risks involved for certain
groups in order to better influence their health-related behaviour (BMJ 2020; Brewer et al. 2007). In relation
to the COVID-19 virus, a range of susceptibility studies have been performed to understand how the
physiological attributes of patients condition their response to the virus (Rothan and Byrareddy 2020; Shi et
al. 2020; Zhao et al. 2020), and its links with the disease's spread in different areas (Fanelli and Piazza 2020;
Karako et al. 2020). Other studies have compared habits like smoking (Wang et al. 2020) or ambient
environmental conditions (Coccia 2020; Wu et al. 2020) with the virus' threat and examined how co-
morbidities can occur due to underlying health issues (Li et al. 2020; Yang et al. 2020).
 Examinations of the vulnerability of people and regions to this virus outbreak have followed diverse
trends. The first group of studies have mostly focused on tracing the virus' actual footprint across different
regions to identify communities that are most vulnerable to its onslaught and the ambient risks that they face
(e.g. Boldog et al. 2020; Gilbert et al. 2020). The second category of attempts have employed model-based
 4
The COVID-19 pandemic's footprint in India

analyses (e.g. Cassaro and Pires 2020; Cobey 2020) to predict estimates of the likely scenarios that can evolve,
in order to pre-empt the virus' effect in a region (e.g. in China- Zhang et al. 2020; in Spain, France and Italy-
Ceylan 2020 and Africa- Adekunle et al. 2020) and to gauge the outcomes of social distancing and restrictive
travel measures (Chinazzi et al. 2020; Kraemer et al. 2020). The final category of vulnerability and COVID-
19 impact studies have delved into how this virus' spread has affected healthcare services and shaped
socioeconomic dynamics. Concerns about diminishing essential medical supplies (Requia et al. 2020; Rowan
and Laffey 2020; Wang and Tang 2020) or impaired medical services to other patients with critical-care
requirements (Soreide et al. 2020; Willan et al. 2020) have been paramount. The societal impacts of this virus
have been undeniable (c.f. Ali and Alharbi 2020; Nicola et al. 2020), with people restricted indoors and almost
all inter-personal contact shifting to the digital domain.
 This global pandemic has also brought to the fore varied media channels and modes of information
dissemination that encapsulate societal perceptions and reactions to the virus outbreak (Jimenez-Sotomayor et
al. 2020), which can be fruitfully utilized to supplement official reports for tracking the contagion's spread
(Oliver et al. 2020; Ting et al. 2020). These can enable measures to be put in place to reduce suffering in the
areas most likely to be affected, through the use of advanced computational techniques and Big Data analysis
(Cinelli et al. 2020; Srinivasa Rao and Vasquez 2020; Zhou et al 2020).
 Attempts to estimate this coronavirus' spread have however been comparatively less in the overall
Indian context (e.g. Biswas and Sen 2020; Dhanwant and Ramanathan 2020; Pandey et al. 2020), with some
regression models being employed to predict virus outbreaks across the country (Tomar and Gupta 2020; Singh
and Adhikari 2020). Others have tried to estimate the COVID-19's prevalence within smaller regions (e.g.
Simha et al. (2020) for the southern Indian state of Karnataka and Kumar (2020) for the western state of
Maharashtra). Efforts have also been made to document ways to control this coronavirus' rampage across the
country (Mandal et al. 2020) and the debilitating effects it can engender on the nation's overall healthcare
system/setup (Chatterjee et al. 2020). The other aspect examined in the Indian context has been the efficacy of
the implemented lockdown measures (e.g. Paital et al. 2020), following similar studies undertaken elsewhere
(e.g. Ibarra-Vega 2020; Tobias 2020). Sardar et al. (2020) in examining the effects of the initial lockdown
measures have opined that it would have little effect in the western Indian states that are the most affected by
the virus but can prove to be somewhat beneficial in other areas, while Das et al. (2020) have provided
guidelines on the critical community size required to make lockdowns effective.
 However, it has been demonstrated that there exists a great deal of heterogeneity in how people and
regions respond to and are affected by this pandemic (Sominsky et al. 2020), with an urgent need for further
science-based assessments of the virus' spread (Bedford et al. 2019). With India being an extremely diverse
country, in geographic as well as socio-demographic aspects, it is very much feasible that the virus' impact and
spread will vary markedly across regions. Furthermore, due to the large variations in economic and healthcare
attributes across the nation, the physiological response and case-fatalities will also differ significantly across
areas. We, therefore, seek to examine the COVID-19's footprint across the nation and link it intricately with
the situational realities in different locales, something which is sorely required but has received scarce attention
in the current context.
 5
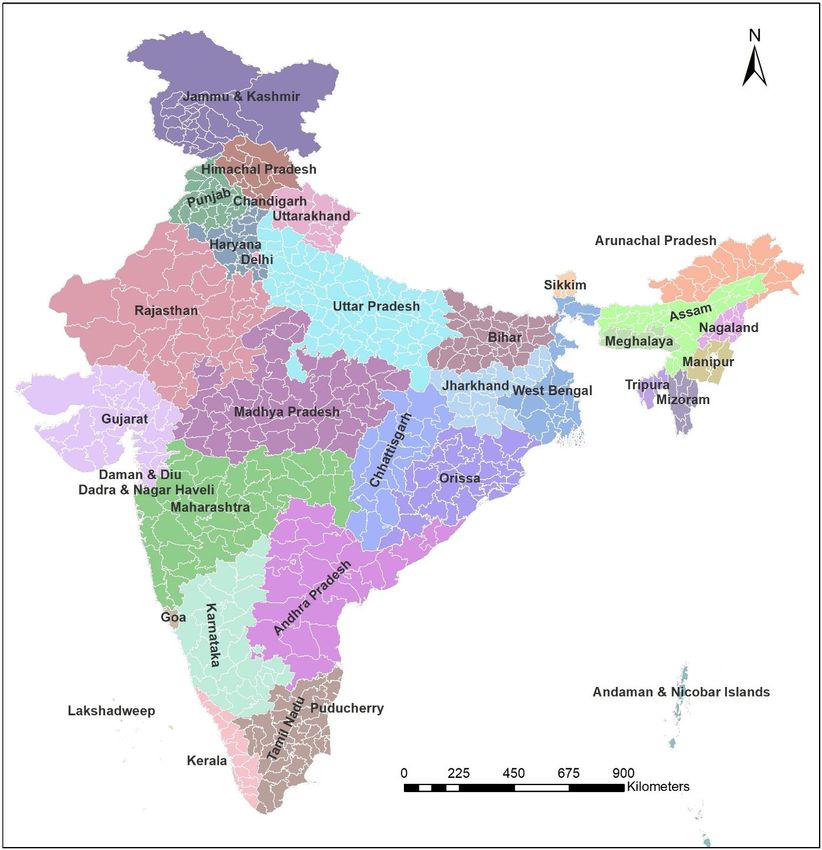
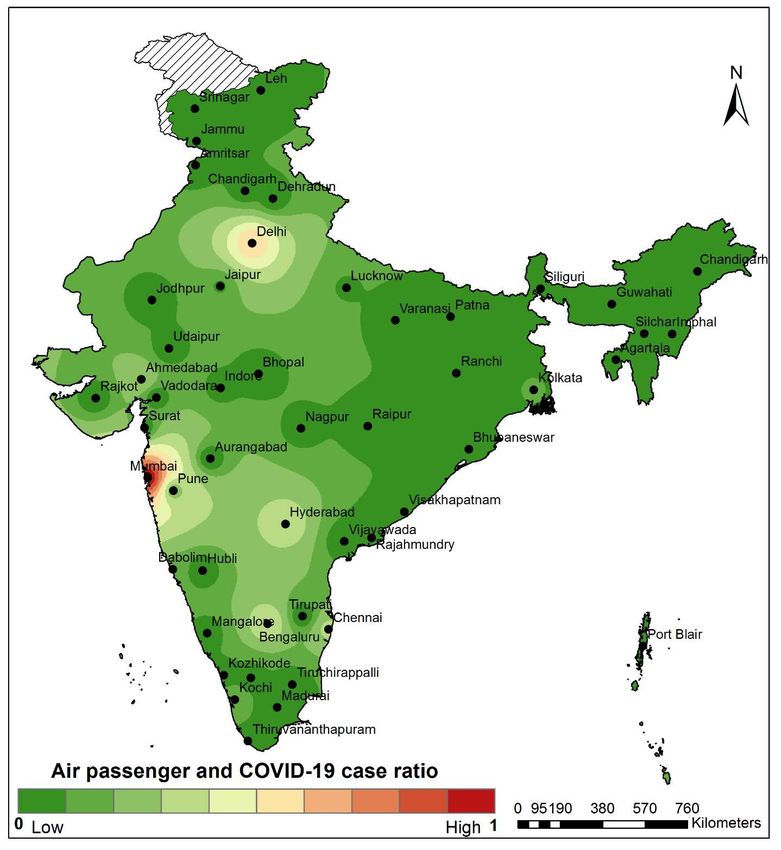
The COVID-19 pandemic's footprint in India

3. Database and methods
3.1 Data collection
The entire analysis has been based on the district-level administrative zones (Figure 1) denoted in the Indian
Population Census of 2011, which lists 640 districts nationwide, in order to keep parity with the Census
datasets that were used. The number of district-level COVID-19 cases as reported by the Ministry of Health
and Family Welfare (MoHFW), Government of India (GoI) was the principal secondary dataset used to analyze
the geographic trajectories of this viral outbreak across India. This data was also used for the identification of
COVID-19 hotspots and analysis of its possible outreach. On 24th March 2020, the Government of India (GOI)
ordered a nationwide lockdown for 21 days (Phase-I), from 25 March - 14 April 2020, further extending this
in Phase-II (15 April - 3 May) and then to the ongoing Phase-III (May 3 to May 17). Therefore, district-wise
numbers of COVID-19 cases were collected on four dates from the MoHFW, GoI, database to understand how
this deadly virus is spreading across space and time and to feasibly represent each stage of the pre and ongoing
lockdown phases. These dates were- a) Pre-lockdown Phase (on 23rd March); b) Early lockdown Phase (29th
March); c) Mid-lockdown Phase (10th April) and d) Late lockdown Phase (18th April).
Two sets of indicators were used for the ensuing susceptibility and vulnerability analyses. For selecting these,
we considered all the relevant information at the district level that could feasibly be associated with the
COVID-19 outbreak (these datasets were collated from information made available by Office of the Registrar
General of India (2011), MoHFW (2016), IIPS and ICF (2017) and similar other sources- see Table 1 and
Table 2). The district-level susceptibility is related to viral transmission, while the vulnerability denotes the
risk of fatality after infection. We identified the various potential indicators based on an extensive literature
review (e.g. Coudhry and Avindandan 2020; Dowd et al. 2020; França et al. 2009; Rocklov and Sjodin 2020;
Sajadi et al. 2020; Wang et al. 2020; WHO 2020a; Zhong et al. 2020) and the parameters finally selected for
both the susceptibility and vulnerability analyses basically encapsulate the district-wise overall socioeconomic,
demographic, climatic, health and hygiene conditions. Their descriptions and references are listed in Table 1
and Table 2, respectively, while the conceptual framework devised for the entire workflow is depicted in Figure
2.

3.2 Methods
3.2.1 Linking air travel and COVID-19 cases
Since the dispersion of the COVID-19 virus from its source region and its subsequent entry into every other
geographic region was mostly via airports and returning travellers, we especially examined this aspect as the
initial spreading centres and hotspots were most likely to develop around cities that handled large volumes of
air traffic. The annual air passenger data for 2018-2019 was collected from the Airports Authority of India
(https://www.aai.aero/en) for 54 international airports across the country. The number of COVID-19 cases
within a district was used as an attribute of its centroid and a spatial buffer analysis was done to understand
the relation between the distance from the airport and the number of COVID-19 cases. The Inverse Distance
Weighting interpolation method was used to represent the ratio between the number of COVID-19 cases and
 6
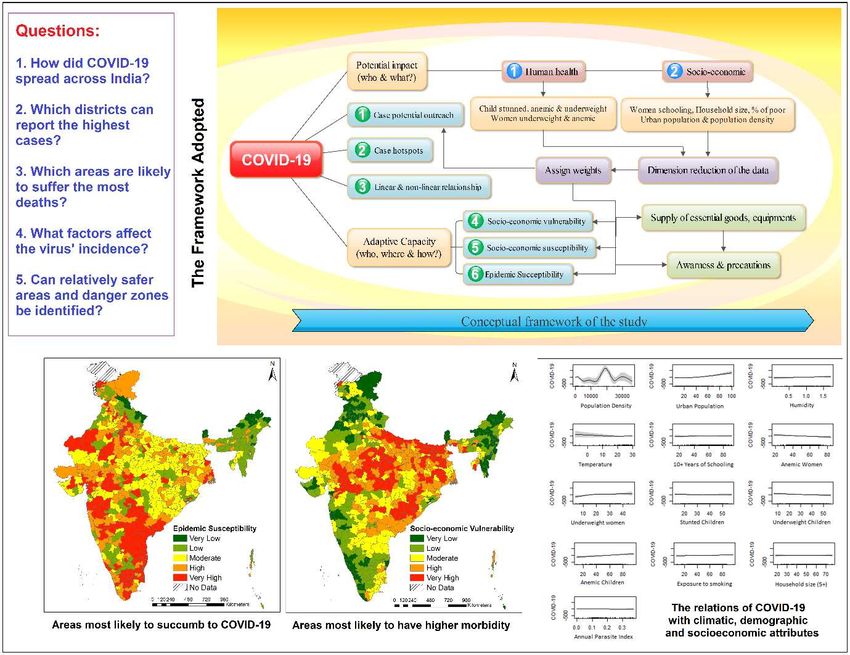
The COVID-19 pandemic's footprint in India

the number of air passengers for each international airport, with higher ratios obviously indicating the greater
likelihood of a large number of COVID-19 cases emanating from or being transmitted by passengers who have
passed through that particular airport.

3.2.2 Geographic trajectories of the COVID-19 outbreak and hotspot identification
The district-level outbreaks of COIVD-19 cases in the four consecutive time periods have been visualised
through a series of maps and similarly, the changes in the virus hotspots and its potential outreach have also
been identified for each time step. The Getis-Ord Gi* statistic developed by Getis and Ord for analyzing
evidence of spatial patterns (Getis and Ord 1992; Ord and Getis, 1995) was used to identify clusters of low
and high index values and generate district-level hot spots and cold spots of COVID-19 cases. This tool is
based on the z-score, p-value and confidence level bin (Gi_Bin) for each feature class. For the purpose of
cluster identification, the neighbourhood distance was calculated using the Incremental Spatial Autocorrelation
tool of ArcGIS 10.2 (Appendix 1).

3.2.3 Moran's I
The Moran’s I (Moran, 1950) is useful for determining spatial autocorrelation by explaining whether or not
certain attributes in a two-dimensional plane affect other attributes with the same characteristics (Drück et al.,
2004). Moran's I was used to distinguishing between a statistically significant COVID-19 cluster of high values
surrounded by other similarly high-value districts (High-High: HH), a cluster of low values surrounded by
low-value districts (Low-Low: LL), an outlier in which a high value was surrounded primarily by low values
(High-Low: HL) and another outlier in which a low value was surrounded primarily by high values (Low-
High: LH). The statistical significance was set at the 95 percent confidence level, with p-values smaller than
0.05. Moran’s I was calculated for the same databases (of the four different time periods) as was used for the
Getis-Ord Gi* hot spots and cold spots analysis.

3.2.4 COVID-19 potential outreach analysis
The COVID-19's potential outreach was assessed using the vector based double and vector based integer
assessment through Python coding. The Euclidean distance was computed from each district's centroid and the
number of COVID-19 cases for that district was used as its mass. As such, the higher the number of COVID-
19 cases in a district, the higher would be its outreach potentiality towards the surrounding districts (Appendix
3).

3.2.5 Developing an area-based COVID-19 susceptibility and vulnerability index
As long as a vaccine for the COVID-19 has not been fashioned and distributed widely, susceptibility analysis
of this viral transmission remains extremely important. As mentioned earlier, for the susceptibility analysis a
number of possible crucial indicators were selected. Two susceptibility indices were developed to respectively
gauge the epidemiological and socioeconomic susceptibility at the district-level. The epidemiological
susceptibility analysis dataset includes the actual number of COVID-19 cases in the country along with other
 7
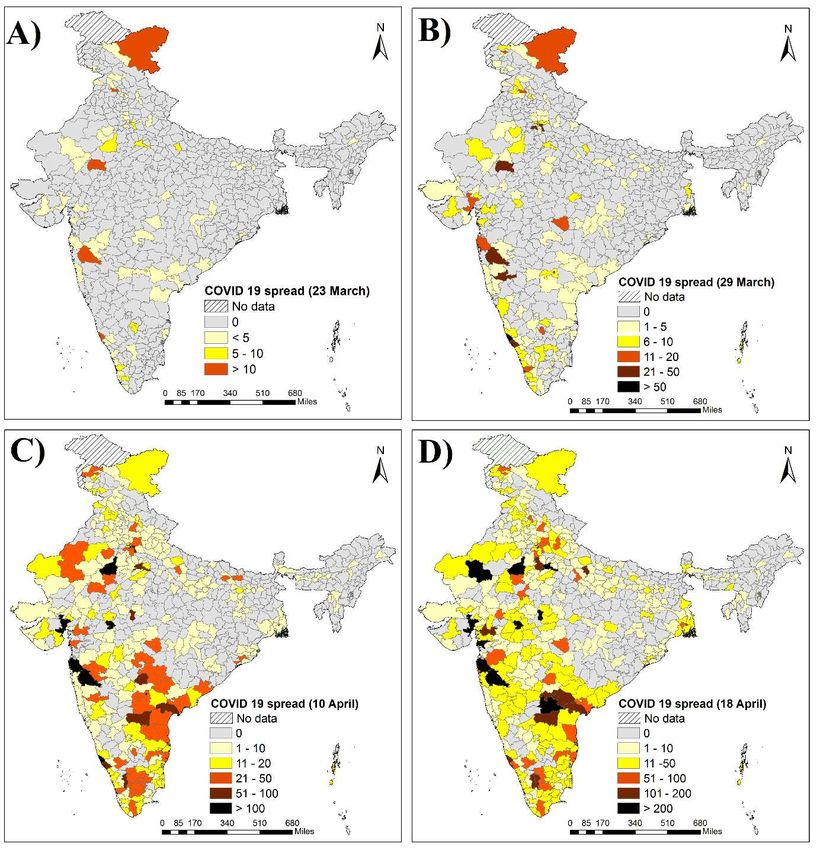
The COVID-19 pandemic's footprint in India

relevant socioeconomic, demographic and climatic factors. The socioeconomic susceptibility analysis dataset,
on the other hand, excludes the variable denoting the number of COVID-19 cases in a district. We sought to
undertake such a dual analysis in order to represent both, the actual situation which has emerged (as far as it
was possible in the light of inherent data limitations and lags) as well as the situation that can arise if the
country continues to remain under the threat of the virus (i.e. if all areas are eventually targeted or intruded
into by the virus, which ones may succumb more easily). While constructing the epidemiological susceptibility
index, the maximum weightage was given to the variable denoting the district-wise number of COVID-19
cases, as the virus' presence in a district endangers that area the most and makes it more liable to become a
spreading centre than any other socioeconomic, demographic or climatic factor. For the socioeconomic
susceptibility index, all variables were given almost equal weights (see Table 1). With the community
transmission of the COVID-19 already underway and ongoing, it is tricky to conduct any susceptibility analysis
using real-time information due to the obvious time-lag between information gathering and analysis. In this
paper, we have used the then most recent available data for the districts as released by the MoHFW, GoI, when
we commenced our analysis in the latter half of April 2020. Similar to the weightage pattern accorded for the
socioeconomic susceptibility computation, the index for ascertaining the socioeconomic vulnerability was also
developed by assigning equal weightage to all variables (Table 2) and using weighted mean method (Appendix
3).

3.2.6 Socioeconomic, demographic and climatic correlates of COVID-19 cases
The assessment of spatial heterogeneity in the relationship between two variables may be useful if the
presence/numbers of COVID-19 cases is available for all districts. Due to the unavailability of this data, we
have only focussed on eliciting linear and non-linear relationships of the district-wise number of COVID-19
cases with the ambient socioeconomic, demographic and climatic variables. In computing the linear
relationship, we obtained Pearson's correlation plot using the 'corrplot' package in R (Wei and Simko 2017).
For the multivariate analysis, the non-linear relationship of COVID-19 cases and its correlates were computed
using the Generalized Additive Model (GAM), via the 'gam' package in R (Hastie 2019).

4. Results and Discussion
4.1 COVID-19's spread, its hot spots and clusters
COVID-19 cases were first diagnosed in India in late January, 2020 and crossed 60,000 cases by the end of
the second week of May, 2020. With this highly contagious disease transmitting primarily through
international tourists and returning travelers from aboard, the initially affected sites were mostly cities that
have international airports (or are regions adjoining such places) or are major tourist destinations. This is made
apparent by the district-wise spread pattern of the COVID-19 virus (Figure 3). In the first phase (Figure 3A),
cases were reported from western India (around Mumbai and Ahmedabad- two of the main commercial hubs
of the country), from around New Delhi (the national capital) and Ladakh (popular tourist destination as well
as a prominent base of the Indian Army) and from the southern states of Kerala (which has a high number
residents who migrate/travel for work to the Gulf region), Tamil Nadu, Andhra Pradesh and Karnataka (all of
 8
The COVID-19 pandemic's footprint in India

which have major metropolitan centres that are important commercial hubs- Chennai, Hyderabad and
Bengaluru). We saw a further intensification of the above pattern in the next time step on 29th March, 2020,
with the adjoining regions of the above areas reporting substantial numbers of COVID-19 cases (Figure 3B).
Broad swathes of the eastern part of the country still remained mostly unaffected, except for Kolkata (the major
regional metropolitan centre) and its adjoining areas. In the next time step on 10th April, 2020, two large
contiguous zones in northern India and western-central-south India reported high numbers of COVID-19 cases
(Figure 3C). The northern entity manifested in a broad swathe from western Rajasthan, through Haryana,
Delhi, western Uttar Pradesh and Punjab, up to Ladakh and parts of Jammu and Kashmir. The west-central-
southern entity, while contiguous in nature had two broad trends- one portion of it stretched into the interior
of the country from west to east across Maharashtra and Madhya Pradesh, the other followed the alignment of
the eastern and western coastal plains, with one arm trending from Gujarat down to Kerala via Maharashtra,
Goa and Karnataka's littoral districts and the other incorporating the coastal tracts of Andhra Pradesh and Tamil
Nadu (with the adjoining parts of Telangana and Karnataka). Even at this comparatively advanced stage of the
pandemic in India, the eastern portion of the country reported markedly lower numbers of cases, with only a
few centres in Gangetic West Bengal, coastal Orissa and along the Ganga valley in eastern Uttar Pradesh and
Bihar. The pandemic's footprint in the north-eastern states of India was by and large negligible. The final time
step map of 18th April, 2020 (Figure 3D), showed the merging of the two entities described above, with
infilling of their intervening districts (i.e. reporting of cases from areas that did not have any before) and a rise
in the numbers of cases of those districts already afflicted previously. This resulted in a near-continuous stretch
of the nation, from Kashmir to Kanyakumari, along the central and western corridors and down the eastern
and western coastal belts, reporting COVID-19 cases. By now the country's eastern zone had noted a rise in
cases (with its epicentre at Kolkata). This manifested as a narrow line of districts along the densely populated
Ganga plains in Uttar Pradesh and Bihar, which merged into the larger/more contiguous zone further west.
 The above spreading trends and initial incidence centres of the virus in India made it apparent that, as
expected, the distance from an international airport and the numbers of COVID-19 cases were characterised
by distance-decay or were inversely correlated to each other, i.e., with increasing distance from the airport the
number of COVID-19 cases decreased (Figure 4). During the successive lockdown phases, the percentage of
cases within 50 km of an airport had decreased slightly but numbers rose gradually for locations within 50-
100 km of an airport. Thus districts situated within this distance buffer (50-100 km) seemingly had a higher
probability of being affected by COVID-19 and thereby swelling the overall numbers of cases. This
demonstrates that the virus had spread out from its initial centres during the latter part of the lockdown and
while it may have been partly contained in the primary places it had first afflicted, its footprint was becoming
much more apparent across the hinterland. Of the 50 international airports examined, the ratio of air passengers
to COVID-19 cases was far higher for the Mumbai, Delhi, Bengaluru and Hyderabad airports (Figure 5).
Mumbai and Delhi handle the maximum international air traffic and passengers in the country and most
international and domestic connecting flights are also routed through them. COVID-19 cases in India started
to increase from the middle of March onwards, with this rise occurring after the virus' outbreak and spread in
most European countries and the Middle and the Far East. In economic as well as geographic terms, Mumbai
 9
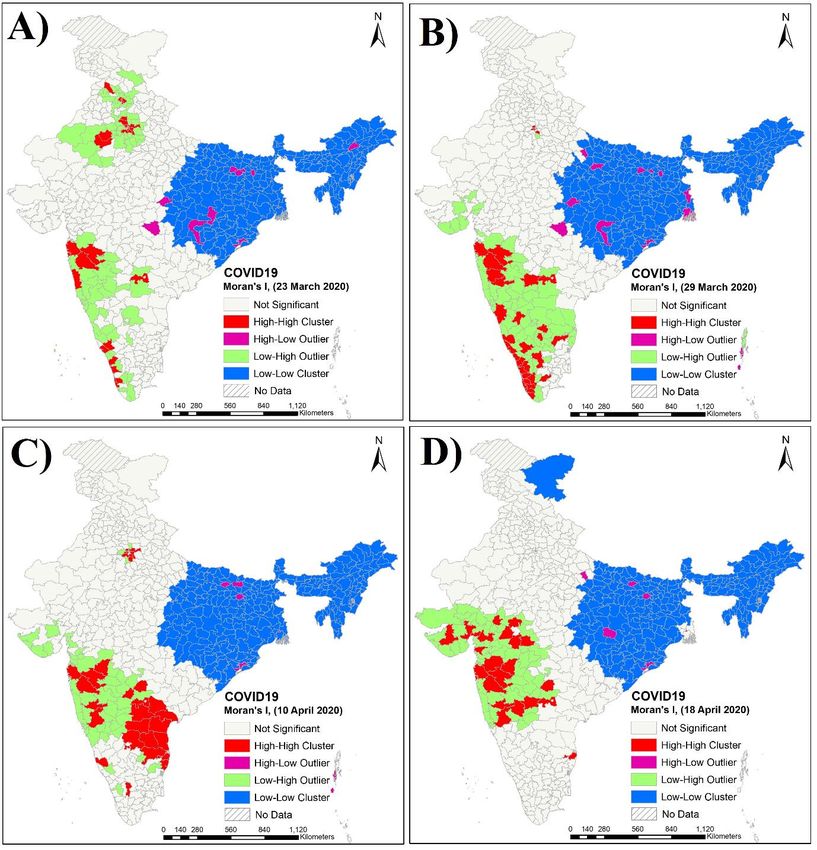
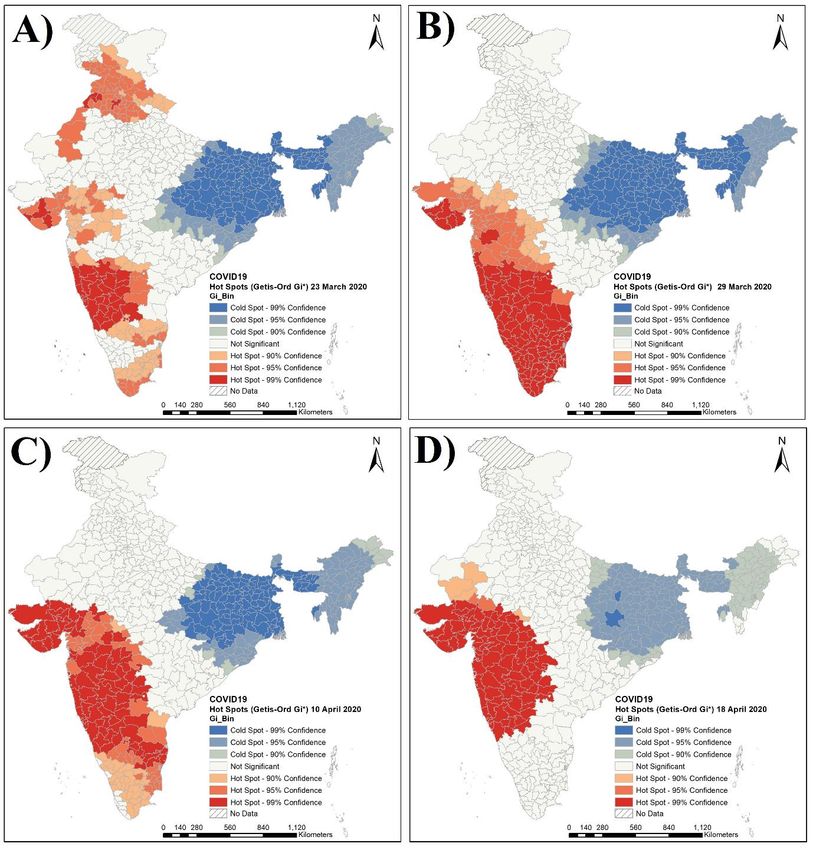
The COVID-19 pandemic's footprint in India

is intricately connected with the Middle East and also linked through trade and commerce with all major
European markets and the Far East. Similarly, Hyderabad and Bengaluru, the main information technology
hubs of India, are also entwined with the global market while New Delhi (the national capital) is connected by
flights throughout the world for diplomatic, administrative and tourism purposes. Thus, the initial outbreak in
India occurred mostly through these four airports. As mentioned before, many of Kerala's residents work in
the Middle East or Gulf countries and this state is also a major tourist destination, with numerous flights routed
to it through the Mumbai and Bengaluru airports. Therefore an initial hub of the COVID-19 incidence in India
was also noticed therein.
 The Getis-Ord Gi* method was used to identify the spatial distribution of potential hot spots
(statistically significant high values) and cold spots (low values) of the virus' spread/concentration through z-
score, p-value and confidence level (Gi_Bin) analysis (Figure 6). The 23rd March, 2020 dataset indicated a
spread of various COVID-19 clusters, with a z-score of 6.90 representing high clustering along the northern,
western and southern regions of India (Figure 6A). A significant cold spot was visible in the eastern region,
comprising of Assam, West Bengal, Bihar and their surrounding areas. The same analysis for the 29th March,
2020 dataset (Figure 6B) indicated clustering of cases in the west and south-western region of India,
encompassing Kerala, Karnataka, Tamil Nadu, Maharashtra and Gujarat. The location of the cold spots
remained almost similar to that discerned from the pre-lockdown phase data of 23rd March, 2020, with
clustering mainly around West Bengal. The hot spot analysis of the mid-lockdown phase data of 10th April,
2020 (Figure 6C) indicated intense clustering of high values around Maharashtra and Gujarat. This finding is
especially significant since these two states at present contain the highest numbers of total and active COVID-
19 cases in India. Furthermore, this also validates to an extent the computations performed. However, the
initial high values clustering around Kerala started diminishing in this mid-lockdown phase, possibly due to
the pre-emptive actions regarding testing and quarantine taken by the Kerala State Government and the Union
Government's policies. In fact, Kerala is the first Indian state to 'beat the curve' and has shown a continuous
downtrend/decrease in its number of active COVID-19 cases since 6th April, around when numbers had
peaked, and at present (i.e. on 10th May) this number is in the low 20s. The cold spot intensity had declined
in the eastern part, almost throughout West Bengal. Analysis of the 18th April, 2020 dataset (Figure 6D)
revealed a much more concentrated hot spot with a z-score of 7.84 in Maharashtra and Gujarat. By then, the
entirety of Kerala and Andhra Pradesh had ceased to be part of any hot spot region. However, the area and
intensity of the cold spot region located in the eastern part of the country had also declined significantly,
possibly indicating that the next phase of the virus' spread could possibly target this zone. Again, subsequent
events and updated news reports about the COVID-19 spread has validated just this, with the eastern region
around Kolkata presently emerging as one of the most affected by the pandemic.
 The investigation of global clustering patterns across regions is very important in spatial data analysis
and the Moran's I am a widely used spatial statistic for this purpose (Jackson et al. 2010). While the Getis-Ord
Gi* analysis of the district-level COVID-19 cases identified the clustering of low and high index values, it
only delineated large clusters through neighbourhood analysis and ignored those districts that had high
numbers of cases but were surrounded by low-value neighbours or vice versa. Thus, the Moran’s I was
 10
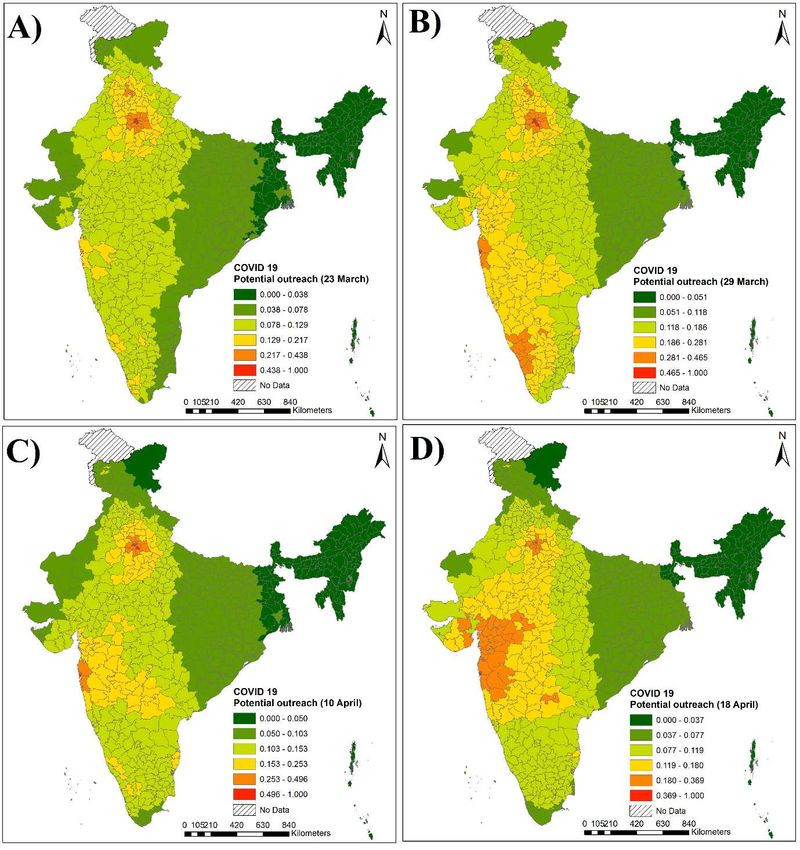
The COVID-19 pandemic's footprint in India

computed to obtain additional insights into the statistically significant High-High, High-Low, Low-High and
Low-Low clusters derived previously for each of the four datasets (Figure 7). Results reveal that the Moran’s
I generally follows the pattern of the Getis-Ord Gi* hot spot and cold spot classification but that it also provides
further visual identification of all High-Low and Low-High value neighbours among the COVID-19 affected
districts. The Moran’s I map for 18th April, 2020 (Figure 7D) indicates some locations in cold spot regions
that have attribute values higher than the overall average while their neighbours' attribute values are lower than
the average. Such areas include Nalanda and Siwan districts of Bihar, Korba district in Chhattisgarh, Khordha
district in Orissa and Lucknow in Uttar Pradesh. Contrastingly, the hot spot regions derived from the same
data show that the attribute values of many districts are lower than the average while their respective
neighbours have higher than average attribute values. All the High-Low designated districts in the cold spot
areas are most important tourist destinations and the Low-High designated districts in the hot spot zones are
on the whole not as developed or as urban as their higher value neighbours. However, a more in-depth research
is required to fully discern the observed pattern of High-Low and Low-High Moran’s I values and its temporal
changes across the four examined datasets.

4.2 Estimating the potential outreach of the COVID-19 pandemic across India
The potential gravity of the COVID-19 spread was assessed for the four time stamps to ascertain its likely
outreach areas (Figure 8). The possible potential outreach on 23rd March, 2020 (Figure 8A) was mostly around
the Delhi NCR (National Capital Region). Some small outreach pockets were seen in Kerala and in
Maharashtra (e.g. Mumbai and Pune). As per the 29th March, 2020 dataset (Figure 8B), potential outreach
epicentres were found in three significant locations- Delhi-centric, Mumbai-centric and Kerala-centric (due to
reasons outlined in Section 4.1). In the third phase of the analysis (i.e. dataset of 10th April, 2020), Kerala
displayed a marked improvement in controlling the outbreak, as discussed previously (Figure 8C). However,
rapid growth was observed for Mumbai and its surrounding areas and this scenario continued into the next
phase as well (Figure 8D). We thus predicted that based on the potential outreach analysis, the gravity of the
COVID-19 outbreak was likely to be very high in western India, especially in Maharashtra and Gujarat. The
current situation fully bears out the above analysis, as these two states rank the highest in the country in
COVID-19 incidence, numbers of active cases as well as deaths (India Covid-19 Tracker at
https://www.covid19india.org/). Maharashtra is overwhelmingly afflicted in Mumbai and its nearby areas of
Thane and Pune, with its total number of cases being almost three times that of second-placed Gujarat (which
has been hardest hit in Ahmedabad, Surat and Vadodara). As per the performed potential outreach analysis,
the North-eastern states and the Himalayan states are relatively safe from the COVID-19 outbreak. Two of the
North-eastern states, Sikkim and Nagaland, have not reported any COVID-19 cases at all, while Arunachal
Pradesh, Manipur and Mizoram all report cases in single digits only. However, the eastern districts of Bihar,
Jharkhand and West Bengal are seen to gradually come under the pandemic's grasp, over the different times-
steps, pointing towards this zone possibly carrying forward the rising patient numbers in the near future, as the
spread in western India may start to peak or gradually decline. Most of those in eastern India who are afflicted
by COVID-19 have had a travel history from either Mumbai, Kerala or Delhi. Initially, only a few cases were
 11
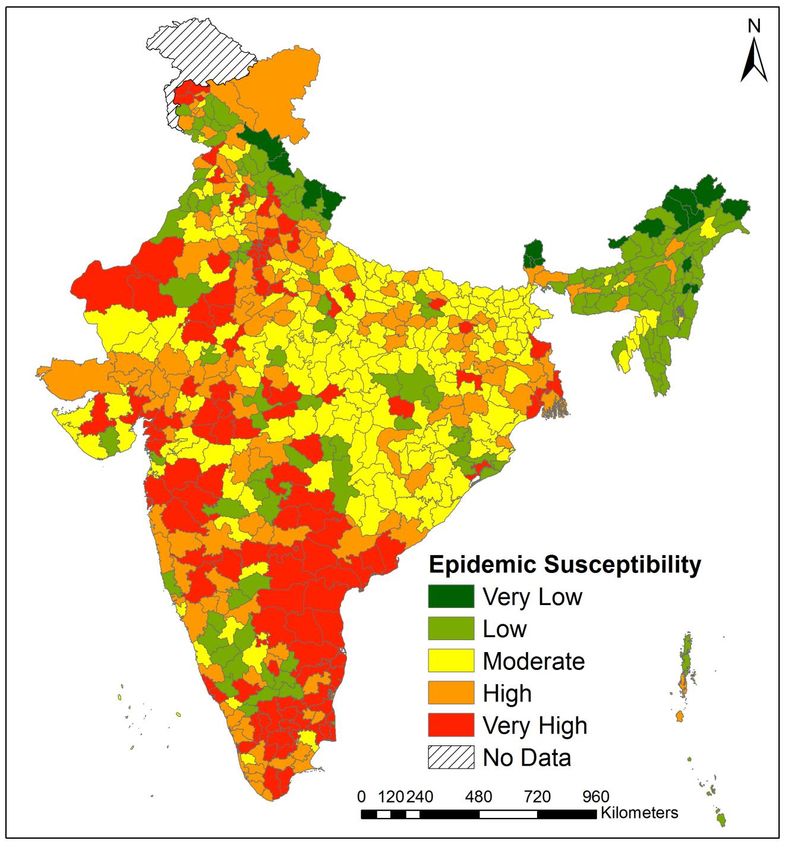
The COVID-19 pandemic's footprint in India

observed in eastern India due to the lower volume of international air traffic in this region (as denoted by the
lower air passenger to COVID-19 case ratio) but more recently, the numbers of cases have risen herein in the
late lockdown phase due to inter-state in-migration from the western and southern parts of the country.
 Overall, the most important results derived from the potential outreach analyses were that the
epicentres of COVID-19 have so far been mostly concentrated in and around Mumbai in Maharashtra. As
Kerala and also Karnataka recovered quite quickly, the earlier epicentre in southern India was quite obliterated
towards the late lockdown phases. The eastern part of the country now faces the imminent threat of becoming
an epicentre if COVID-19 cases are transferred into it due to return migration, especially by the
attempted/ongoing homecoming of the many currently unemployed migrant labourers in the western and
southern reaches of the country. The comparative outlooks of the undertaken hotspot and the potential outreach
analyses differed slightly in perspective. While the hot spot enumeration discerned COVID-19 affected zones
based on the actual ground situation/data as ascertained for that point in time, the potential outreach maps
denoted the gravity factors for the four different time periods and depicted how conditions may worsen in the
major epicentres or has eased off in other areas. The outreach analysis thus casts some light on the outbreak's
potential across the country and denotes zones likely to be affected in the near future, with higher potential
districts obviously facing a bigger threat from COVID-19.

4.3 Interpreting COVID-19 susceptibility and vulnerability indices
Using the indicators listed in Table 1 and Table 2, we developed an area-based composite COVID-19
susceptibility and vulnerability indices at the district level-for India, with a view towards providing policy
makers with some indication on which districts are likely to be most susceptible or vulnerable to a COVID-19
outbreak and specifically where should the Government target its resources and accordingly plan a data-driven
intervention strategy. The elicited results from these indices are presented below.

4.3.1 Epidemic susceptibility index
A five-pronged classification scheme (ranging from Very High to Very Low) has been used to visualise the
derived district-level epidemic susceptibility values (derived using quintile class- Table 3). There are
significant regional clusters in the northern, eastern, southern and parts of the north-eastern states of India
(Figure 9). Large swathes of south-western and northern India, covering most districts of Kerala, Tamil Nadu,
Telangana, Andhra Pradesh, Karnataka, Maharashtra, Gujarat, Rajasthan, Delhi, Haryana and Punjab are
highly susceptible to this pandemic. Primarily, these were the areas where the initial outbreak occurred and the
subsequent transmission of COVID-19 has been phenomenal, with people therein being seemingly less able
to cope with the COVID-19 virus (i.e. their physiology is more easily affected by it). Possibly, the prevalence
of urbanization (which creates congestion), the burden of non-communicable diseases (hyper tension, diabetes
and obesity) and a greater proportion of the elderly population in these regions may have heightened the overall
epidemic susceptibility. Ironically, most of the highly urbanized and economically well-off states seem to have
reported higher COVID-19 susceptibility, since the initial epicentres of the virus outbreak were in their large
cities and significant economic ramifications may arise as such areas are likely to remain under stringent
 12
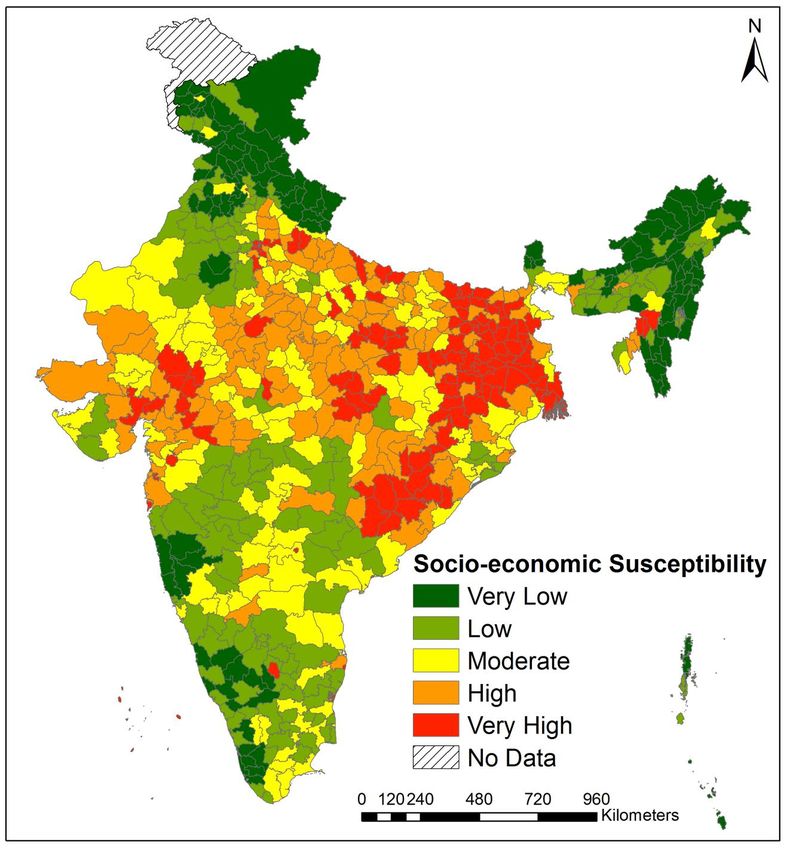
The COVID-19 pandemic's footprint in India

lockdown measures for relatively long periods. Contrarily, almost all districts in the seven north-eastern states
of Assam, Meghalaya, Manipur, Tripura, Mizoram, Arunachal Pradesh and Sikkim fall under the low to very
low COVID-19 susceptible class. The northern, central and eastern parts of India comprising of Odisha
(Orissa), Chhattisgarh, Jharkhand, Madhya Pradesh, Uttar Pradesh, Bihar and West Bengal are moderately
susceptible to the pandemic. It is interesting that despite being economically poorer and having low indicators
with respect to almost every socioeconomic and health-related parameter than the rest of India, these areas are
less susceptible to the pandemic, suggesting that the COVID-19 outbreak might be an erratic phenomenon that
cannot be explained solely by traditional socioeconomic theories and which might require further investigation.
As the districts in the moderate susceptibility to COVID-19 class lie in many economically poorer zones, this
can have important connotations in terms of impaired health-care services and facilities, which can thereby
significantly deteriorate immune response and patient recovery. Furthermore, as discerned from the previous
section, it is this eastern part of the country that is likely to become a secondary epicentre of the virus in the
country (following the trends displayed by the hot spot, Moran's I and potential outreach analyses) subsequent
to the primary one in the nation's west. Thus, even though this zone is at present in the moderate susceptibility
category, its lower socioeconomic standing and existing poorer healthcare assets and availability/accessibility
accord it a high priority for pre-emptive future resource allocation in order that the likely forthcoming
challenges can be met adequately.

4.3.2 COVID-19 related district-wise socioeconomic susceptibility
Figure 10 visualizes the socio-economic susceptibility index for India's districts, following a similar
classification approach to that adopted in Figure 9 (see Table 3). The underlying assumption of this particular
index is that if all districts are evenly infected by the COVID-19 outbreak, then what would be the magnitude
or susceptibility of further transmission in a certain area, with this being dependant on its socioeconomic status.
Results reveal that large portions of eastern, north and north-western India are high to very highly
socioeconomically susceptible to this deadly virus and are likely to be most affected by it. These areas are
particularly characterized by high population densities, chronic malnutrition, poor health infrastructure, larger
family sizes, poor hygiene practices, poverty concentration and marginalization including lower health-related
knowledge and awareness, thereby precipitating such outcomes. On the contrary, most districts in the north-
eastern, southern and extreme northern region (e.g. in the northern part of Rajasthan and in Punjab, Himachal
Pradesh, Jammu and Kashmir and Uttarakhand), and are found to be socioeconomically less susceptible in
terms of COVID-19 transmission. Interestingly, some areas that initially had higher numbers of COVID-19
cases have emerged in the low susceptible category (e.g. Kerala) and this merits further explanation. In Kerala,
after the initial outbreak was reported, effective State Government measures at all levels towards curbing
further transmissions by facilitating mass testing, awareness creation at the community level and applying
stringent physical distancing and lockdown norms, have proved to be very effective. Alongside this, most
importantly, there has been efficient management of both international and inter-state migrants in the state.
These are lessons that can be picked up and implemented by other similarly afflicted areas or those that are
likely to be threatened by the COVID-19 virus in the foreseeable future.
 13
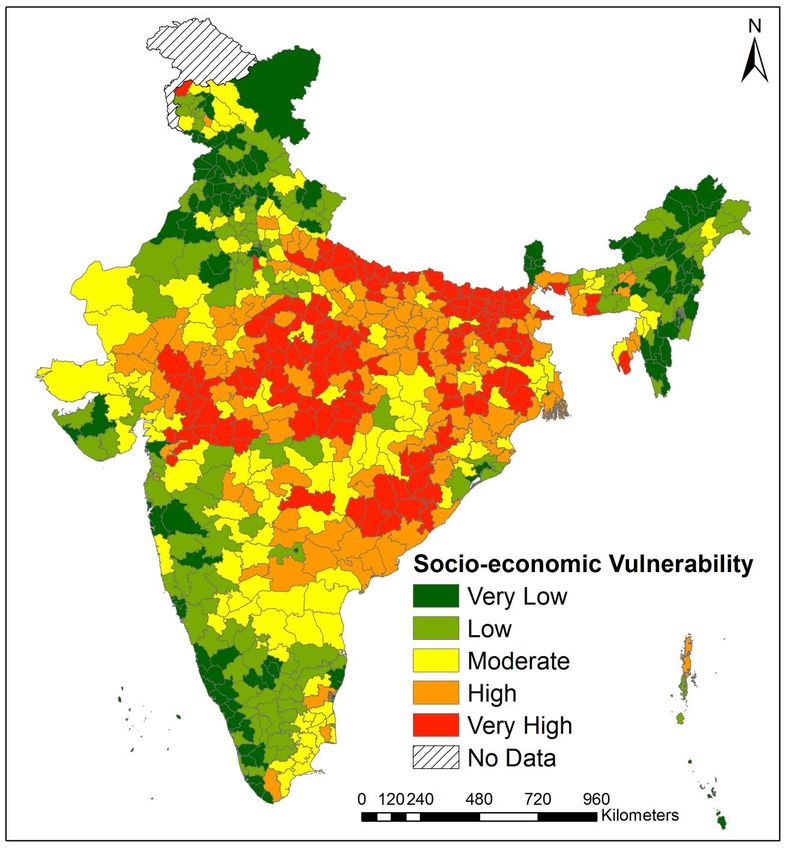
The COVID-19 pandemic's footprint in India

 Aspirational Districts (ADs) are more susceptible to the COVID-19 due to their already limited
coping-up capacities as they are some of the socio-economically poorest/most backward regions of India.
However, the incidence of COVID-19 cases in these areas has till date been fairly low, at less than 2% (a total
of 610 cases as of 6th May, 2020) of the total cases nationwide. Of the 112 ADs affected by the virus, the
worst-hit have been Ranchi (55 cases), Baramulla (62), YSR (55), Nuh (57), Jaisalmer (34) and Kupwara (47),
which are all located in the Red Zone (the locales facing the most stringent lockdown norms) as per the Indian
Government's classification. Considering their susceptibilities, the Government of India (through the NITI
Aayog) has taken steps to ensure appropriate and timely action for resolving supply shortages in test kits,
Personal Protective Equipment (PPE) and in providing masks to the respective empowered populations/groups
in these districts. In our present study, we have also been able to identify these districts based on their respective
susceptibility indicators, e.g. percentage of poor population, household size, impaired child health (i.e.
suffering from anaemia, underweight or stunted development), and poor female health (anaemia and
underweight). Apart from these ADs, we have also identified some other districts that are also quite susceptible
due to their socioeconomic background and these areas, therefore, need a similar kind of support to that being
provided to the ADs (i.e. urgent supply of testing kits, PPE and masks). Most districts of Madhya Pradesh,
Orissa, Andhra Pradesh, Bihar, Jharkhand, West Bengal and Uttar Pradesh fall under the above category.

4.3.3 COVID-19 related district-wise socio-economic vulnerability
Based on the selected set of indicators, the discerned socioeconomic vulnerability to the COVID-19's impact
(Figure 11) is likely to be higher in many districts of Madhya Pradesh, Orissa, Telangana, Andhra Pradesh,
Bihar, Jharkhand, West Bengal and Uttar Pradesh and these areas are likely to report higher fatalities. There is
a 30% overlap of the places most at risk in these states with those demarcated under the Union Government's
Aspirational Districts Programme, i.e. 75 of the discerned 255 highly to very highly vulnerable districts are
also ADs. Contrastingly, this impact shall be markedly lower in the states of Kerala, Punjab, Haryana,
Himachal Pradesh and in most of the North-eastern states and the Rann of Kachch (in Gujarat). Some districts
of Tamil Nadu, Gujarat, Rajasthan and Maharashtra are moderately vulnerable. The enumerated index values
are higher in some districts due to these housing a greater proportion of those that are more vulnerable to this
contagion (i.e. more number of children and women who are anaemic and/or underweight, lower female
education levels and a higher prevalence of diabetic patients). Therefore, these districts are likely to find it
difficult to cope with the COVID-19 threat and its related morbidity aspect. On the other hand, the lesser
vulnerable districts seemingly do have sufficient capability to deal with the threat, as observed in the districts
of Kerala, from where very few morbidity cases have been reported, compared to the other parts of India.
Another indication of Kerala having coped quite successfully with the pandemic is that at present the numbers
of new cases being reported from the state are very low (and the number of active cases has been in constant
decline since the first week of April) even though it was an epicentre of the pandemic in the early stages and
was then consistently reporting high numbers.

 14
The COVID-19 pandemic's footprint in India

4.4 COVID-19 incidence and its correlations with climatic, demographic and socioeconomic aspects
Figure 12 shows the correlations derived between the COVID-19 cases (i.e. the number of cases per district)
and its socioeconomic, demographic and climatic factors. This pandemic is positively associated with the
percentage of urban population and the population density of a district. It is also positively associated with the
percentage of women having attained 10th or lower standard of schooling. Furthermore, districts with a higher
share of poorer households (40%) had lower viral transmissions. In the second half of April 2020, although
the virus had spread across 377 districts, the gravity of the outbreak was mostly concentrated in districts that
were major urban agglomerations, such as Mumbai, Delhi and Hyderabad. People in urban areas are relatively
more mobile within the city than ruralites in villages. They may also be forced to maintain lower residential
and social distances due to the higher densities of built-up zones as well as population, especially within slums
areas where housing shortages are quite severe (Haque et al. 2020). These factors together with the inherent
economic deprivation faced by slum residents would likely enable a more widespread outbreak in such
congested locales (Ahmed et al. 2020), as has been evidenced by the large numbers of cases reported from the
Dharavi slum area of Mumbai, which is one of the largest such entities in Asia. As urbanites generally attain
a higher level of education, the pandemic's outbreak is also positively associated with the educational status,
more so because this 'imported' virus mainly came into the country via air-travel (i.e. from the movement of
economically well-off sections of the population, who can be expected to have also attained higher education
levels).
 The above bivariate linear relationship does not provide the non-linear associations between variables.
For this, the multivariate non-linear association was evaluated by applying the Generalized Additive Model
(GAM), whose results are relatively easy to interpret. The obtained findings predict a flexible relationship
between the enumerated variables (Figure 13). Districts with a population density between 1500-2500
people/km2 specifically have a higher risk of this virus spreading amidst them than other districts. Of the 377
districts affected by the virus (as per the last date on which the data for this paper was collected), apart from a
few situated in urban metropolitan cities, all others contain medium to large towns which have a moderate
level of population density. The highly urban districts face a greater threat of a COVID-19 outbreak,
particularly when the share of urban population crosses 60%. In the urban agglomerations of India, a significant
share (17.4%) of the urban population lives in slums (e.g. about half the residents of Greater Mumbai live in
such locales). While they play a vital role in the functioning of the city, these slum areas are poorly planned
and obviously very densely populated as a result of the ever-accelerating urbanization trend in India. Such sites
thus become potential hotspots for infectious diseases like the COVID-19. This unplanned urban growth also
poses a considerable risk in terms of impaired preparedness and ready response to any infectious disease
outbreak, with mass quarantining at such close quarters while maintaining social distancing, being almost
impossible. Hence, the responses of healthcare officials, governments and communities to this ongoing
pandemic can be devised towards generating a paradigm shift in how urban spaces and residences are planned
and designed, with possible ramifications for future peri-urban transformations, inner-city renewal and slum
rehabilitation (Jha 2020; Regmi 2020; Van den Berg 2020).

 15
The COVID-19 pandemic's footprint in India

 The findings also suggest that although districts with a higher prevalence of children suffering from
anaemia and/or being underweight face an elevated risk of this viral transmission, the relationship slope is not
very significant. Thus these health indicators are not strongly correlated with COVID-19 cases in the Indian
context. A possible reason for this seemingly discordant finding is that may be the Government of India and/or
State Governments had till the last date of data collection for this paper (i.e. 18th April, 2020) not conducted
an adequate number/proportion of population-level tests, rather testing only those who had already developed
COVID-19 related symptoms. Therefore, a similar analysis performed on a bigger and possibly more
representative sample obtained via large-scale population-level testing may yield better explanations.
 Several studies have found that climatic parameters such as mean annual temperature and relative
humidity have a crucial role in spreading the COVID-19 virus (Sajadi et al. 2020; Wang et al. 2020), with
evidence suggesting that a mean temperature of 10°C and a medium to high (60% to 90%) relative humidity
range is most suitable for its transmission. The greater majority of India's districts have a higher daily mean
temperature than 10°C in April and except for a few districts in the Himalayan and coastal belts, all districts
have an average relative humidity less than the suitable level. Therefore, unlike as discerned in other studies,
we could not find any significant relationship between the currently prevalent climatic parameters and this
viral outbreak.

Summary and Conclusion
The COVID-19 crisis was slow to onset, before rampaging worldwide and its impact on society and the global
economy has been profound and likely to be long-lasting. The primary reason for this was that governments
either underestimated its potential threat or were caught unawares or did not have robust enough socio-political
systems and infrastructure to combat the virus' transmission. Instead, while helpful, the uniform global
response of lockdown measures has created extreme economic vulnerability, and developing nations are some
of the worst affected, having to contain the pandemic while simultaneously addressing rising unemployment
and the livelihoods at stake of an economically vulnerable population. Thus, it is paramount that in the midst
of such a crisis, correct and sustainable economic, social and political decisions be made. To enable these
predictions of the pandemic's path across a nation with pinpointing of the areas that it can affect the most, are
pertinent, for prudent and targeted resource allocation.
 Our analyses have highlighted the initial centres of the COVID-19 pandemic in India, how its
incidence occurred, its spread over time and concentrations. By identifying hotspots and significant clusters of
the virus' outbreak, we pinpointed the areas where possible community transmission have occurred and which
need targeted measures to control the situation. Our computations and predictions were based on the data
garnered about the cases occurring in the initial and middle stages of the three-phase lockdown underway in
India. However, subsequent reports of the pandemic's spread largely validate our estimation of the areas that
were most likely to be affected in the forthcoming days (i.e. the case of the virus gaining a foothold and then
spreading in various clusters of Eastern India, around Kolkata). We could also display and demonstrate the
withdrawal of the virus from certain areas like Kerala, where stringent government interventions have proven
to be effective. Our analysis thus lays the groundwork for identifying future hot spot zones so that communities
 16
You can also read