IN INDIAN CITIES - ITDP India
←
→
Page content transcription
If your browser does not render page correctly, please read the page content below
>> WOMEN AND
 TRANSPORT
 IN INDIAN CITIES

              1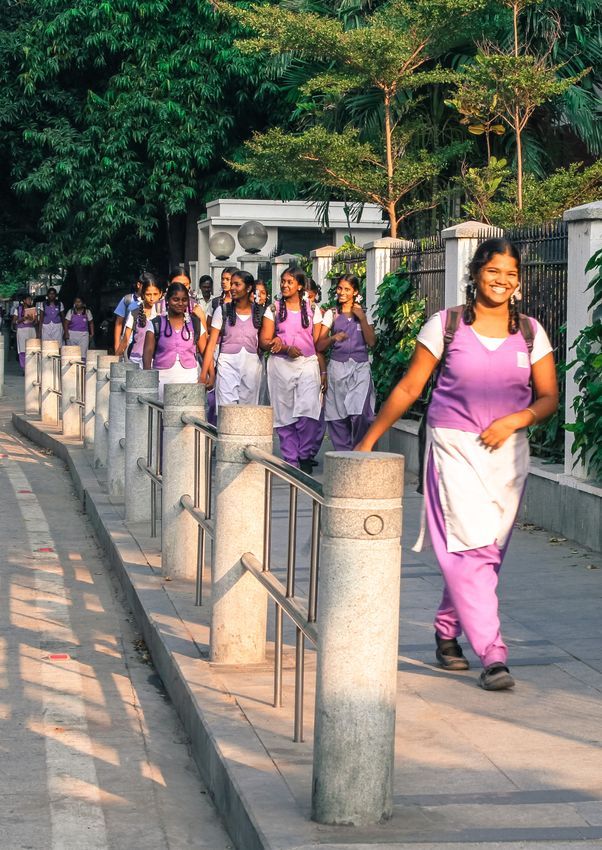
Women and Transport in Indian Cities
A Policy Brief
December 2017

Citation
Sonal Shah, Kalpana Viswanath, Sonali Vyas and Shreya Gadepalli 2017, Women and Transport in
Indian Cities, ITDP and Safetipin, New Delhi

Photo Credits
Cover: Luc Nadal, ITDP
Page i: Santhosh Loganaathan, ITDP India; iii: ITDP; iv: Santhosh Loganaathan, ITDP India; vi:
Rajarshi Mitra; 10-11: Santhosh Loganaathan, ITDP India; 13: Prasad Packirisamy, ITDP India; 15:
Shreya Gadepalli, ITDP India; 16: Sonal Shah, ITDP India; 20-21: Joseph D’Mello; 24: Adapted from
ICRW; 29: Jorge Gonzalez; 30: Sonal Shah, ITDP India; 33: ITDP; 34: Mexico City´s Ministry of Envi-
ronment Department of Cycling Culture; 39: Safetipin; 40: Fig 8-Toronto Transport Commission, Fig
9- Secondarywaltz; 42: Vienna Sees It Differently; 45: Jagori; 46: Malcolm Payne; 48: Reuters as
published in The Hindu; 49: Santhosh Loganaathan, ITDP India; 53: Ian Kindred; Q-R: Steve Evans
3
Acknowledgements

We would like to thank our peer reviewers for providing valuable feedback on the draft policy brief:
• Amit Bhatt, Strategy Head-Integrated Urban Transport, WRI
• Antara Ganguly, Gender and Development Specialist, UNICEF
• Anvita Arora, Director, i-Trans
• Ramon Cruz, International Policy Program Manager, ITDP

The draft policy brief was released on 13 June 2017 and a round table on Gender and Transport
was organized by ITDP, Safetipin and UN Women with participation from 30 women’s groups[1],
professionals and academics, on 13 and 14 June 2017. We invited suggestions from this group and we
would like to thank the following individuals for their comments:
• Heather Allen, Independent Consultant - FIA Foundation
• Keshinee Shah, Ashwin Chandrasekhar, Kanupriya Rungta, Dalberg Global Development Advisors
• Shahana Choudhary, Principal Consultant at Toji Communication Consultancy
• Suneeta Dhar, Advisor, Jagori

Additionally, we thank the entire team at the Institute for Transportation and Development Policy, for
their support.

Authors
Sonal Shah
Kalpana Viswanath
Sonali Vyas
Shreya Gadepalli

Editing
Sonal Shah
Rekha Raghunathan

Layout
Nashwa Naushad

[1]
      Refer to List of Organisations in the Annexure

                                                       ii
5
6
Table of Contents

Executive Summary                                                                             1

1. Introduction                                                                              12

2. Scope                                                                                     14

3. Gender Dimensions of Urban Transport                                                      16
   3.1. Trip Patterns and Purpose                                                            16
   3.2. Modal Shares, Trip Distances and Time Poverty                                        16
   3.3. Sexual Harassment                                                                    17
   3.4. Employment                                                                           19
   3.5. Conclusion                                                                           19

4. Policy Recommendations                                                                    22
   4.1. Urban Transport Indicators and Benchmarks                                            22
   4.2. Comprehensive Mobility Plans                                                         24
   Recommendation 1: Measure Gendered Mobility Patterns                                      25
   Recommendation 2: Set Goals and Create a Mobility Plan Underpinning Women and Girls’
                        Concerns                                                             25
   Recommendation 3: Prepare an Implementation Plan                                          27
   Recommendation 4: Monitor Implementation Progress and Evaluate Outcomes                   27

5. Modes of Transport                                                                        30
   Recommendation 5: Create Safe and Comfortable Walking Environments for Women and Girls 30
   Recommendation 6: Increase Women and Girls’ Cycling Shares                                32
   Recommendation 7: Increase Women and Girls’ Safety and Use of Public Transport            35
   Recommendation 8: Engender Public Transport Authorities                                   43
   Recommendation 9: Make Intermediate Public Transport Safer for Women                      46

6. Conclusion and Way Forward                                                                50

Annexure                                                                                     A

Definitions                                                                                   I

List of Figures                                                                              K

List of Tables                                                                               K

Bibliography                                                                                 L

                                               v
8
Executive Summary

The coming decade will be a defining moment for India as its urban areas are estimated to constitute
around 40 per cent (600 million) of its total population by 2030. According to the High Powered
Executive Committee (HPEC), around INR 23 lakh crores[2] is required over 2015–2030 for India’s
urban transport infrastructure. The recently announced Green Urban Mobility Scheme (GUMS)
expects to invest around INR 70,000 crores[3] over 2018–2023 on sustainable transport. The national
government has initiated missions and schemes to invest in urban transport and infrastructure;
and created indicators and service level benchmarks to establish a city’s baseline and goal for
improvement.

While there is momentum by different levels of government in addressing women’s safety in public
transport, urban transport investments are largely gender blind with a limited understanding of the in-
terrelationships between gender and transport inequities. Sustainable urban development will remain
elusive without integrating women and girls’ safety, comfort, convenience and affordability in urban
transport.

Ultimately, transportation is the fulcrum that allows women to participate in the workforce, which can
create a societal shift to transform the entire world economy. This policy brief fills a key gap in urban
transport literature in India by recommending gender responsive transport indicators, supported by
benchmarks to set goals and monitor outcomes and outputs at the city level. Additionally, it provides
good practice case studies for implementation guidance. The brief will be relevant for policy and deci-
sion makers at the national, state and city levels, advocacy organizations and professionals.

[2]
      USD 490 billion at 2009-10 prices
[3]
      USD 10.9 billion at 2017 prices
                                                   1
Recommendation 1 - 4: Prepare and Implement Gendered Mobility Plans
● Measure gendered mobility patterns.
● Set goals and create a mobility plan underpinning women and girls’ concerns.
● Prepare an implementation plan.
● Monitor implementation progress and evaluate outcomes.
The comprehensive mobility plan can be assessed by the following indicators:
Table 1: Outcome indicators for comprehensive mobility plans
Indicator Measure Recommended Benchmarks
1 People near transport Percentage of women and girls At least 80 percent of women and
(PNT), disaggregated by living within 500m walking girls
gender distance of public transport
in the city and metropolitan
region, with a frequency of at
least 6 schedules per hour
2 Mode shares, Percentage of walking, At least 80 per cent of all trips
disaggregated by gender cycling, public transport (buses are by public and non-motorized
and metro-rail separately), transport
intermediate public transport,
motorized two-wheeler and At least 40 percent of all public
four wheeler trips by women and non-motorized transport trips
and girls are by women and girls
3 Median non-motorized Women and girls’ median Women and girls’ walking trips
trip time, disaggregated walking and cycling trip time are less than 15 minutes
by gender
Women and girls’ cycling trips
are less than 25 minutes
4 Median motorized trip Women and girls’ median Stabilized at 2017 levels or lesser
distances, disaggregated motorized trip distances
by gender
5 Cost on transport per Monthly household Not more than 10 per cent for
month expenditure on transport low-income households
6 State and city State and city transport budget Specific allocations and
transport allocations that benefits women and girls expenditures in the state and city
and expenditures on transport budget for women’s
transport safety in urban transport
7 Improved air quality Reduction in air pollutants (to City achieves or exceeds air
achieve CPCB ambient air quality standards set by the CPCB.
quality norms) due to women 50 percent of the reduction in air
and girls’ use of sustainable pollutants from transport because
transport of women and girls’ use of
sustainable modes of transport
2Recommendation 5: Create Safe and Comfortable Walking Environments for Women and Girls
● Create a walking friendly street network with median urban block lengths of 100-150m.
● Design footpaths and pedestrian crossings as per IRC 103: 2012 Guidelines for Pedestrian Facili-
ties, which proposes three zones—a dead zone, a pedestrian zone and a multi-functional zone for
footpaths along with a level of service approach for determining the width of footpaths.
This can be measured with the indicators in Table 2.
Table 2: Indicators for street network and pedestrian infrastructure
Indicator Measure Recommended Benchmarks
Street Network
1 Median block length Median block length bounded 100 – 150m
by publicly accessible roads on
all sides
2 Level and perception Experience and perception At least 80 per cent of women and
of safety, comfort of safety, comfort and girls perceive the street network
and convenience, convenience of walking to be safe, comfortable and
disaggregated by gender convenient. Each aspect will be
evaluated separately.
Pedestrian Infrastructure
3 Walking friendly streets Percentage of city roads with At least 80 per cent
right of way greater than 12m
with universally accessible,
shaded footpaths with
minimum 3.5m width or Level
of Service B (as per IRC 103:
2012 Guidelines for Pedestrian
Facilities), whichever is
greater
4 Well-lit streets Percentage of street network Entire street network
with uniform and consistent
lighting for footpaths and
cycling infrastructure
• 25 lux for shopping areas
• 30-40 lux for non-shopping
areas
3Recommendation 6: Increase Women’s Cycling Shares
● Create cycle tracks to provide safer cycling environments and reduce motor vehicle speeds
where cycles share the carriageway with motor vehicles.
● Conduct education programs to teach women how to ride and repair cycles.
This can be assessed with the indicators in Table 3
Table 3: Indicators for cycling network and infrastructure
Indicator Measure Recommended Benchmarks
Cycling Network and Infrastructure
1 Streets with dedicated, Percentage of streets 20m At least 80 per cent
continuous, even, and above with dedicated,
shaded, well-lit continuous, even, shaded,
cycle tracks without well-lit cycle tracks without
encroachment encroachment. The following
are recommended:
• Minimum 2m for one-way
cycle tracks
• Minimum 2.5m for one-
way cycle tracks with cycle
rickshaws
• Minimum 3m for two-way
combined cycle tracks
2 Shared streets with Percentage of shared streets At least 80 per cent
traffic calming elements with design speeds less than
30kmph
Recommendation 7: Increase Women’s Safety and Use of Public Transport
● Propose routes and frequencies that cater to destinations visited by women (such as schools,
markets) and their time of travel; reduce trip chaining fare burden.
● Conduct safety audits and level of service analyses to improve last mile connectivity and to design
bus stops, IPT stops, train/metro stations, terminals and interchange stations.
● Procure public transport fleet as per UBS II specifications with lower handlebars, wider gangways,
space for strollers, access ramps and women doors.
● Create campaigns to generate awareness on sexual harassment laws, communicate a zero tolerance
approach to sexual harassment, encourage women to report harassment, and encourage bystanders
to assist women and girls.
● Provide real time information on arrival and departure of public transport and major destinations
around the public transport stops frequented by women and girls.
This can be measured with indicators in Table 4.
4Table 4: Indicators for a public transport system
Indicator Measure Recommended Benchmarks
Overall System
1 Availability of buses Number of buses per lakh At least 50 buses per lakh
population in the urban and population
peri-urban areas of the city/
metropolitan region. These
must have at least 35 per cent
seats reserved for women or
as per demand in peak hours,
whichever is more
2 Load factor of the bus Ratio of the number of Load factor should not exceed 100
passengers in the bus to the per cent of the total capacity in
capacity of the bus peak hours
3 Level and perception Experience and perception At least 80 per cent of women and
of safety, comfort of safety, comfort and girls perceive the public transport
and convenience, convenience of the public journey to be safe, comfortable
disaggregated by gender transport journey i.e. from and convenient. (Each aspect must
origin to public transport stop, be evaluated separately)
waiting at the stop, boarding
and alighting, traveling
inside the vehicle and travel
from public transport stop
to destination, conducted
annually or bi-annually
4 Waiting time, Women and girls’ waiting time7 Information and Percentage of stations with real All stations
communication time information, route maps,
functional help line numbers
and emergency numbers
8 Public toilets Gender disaggregated data on Terminal Stations and Bus
availability of adequate and Terminals
universally accessible public Men: 4 water closets for first 1000
toilets within 250m walking persons and 1 for every additional
distance of a public transport 1000 persons or part thereof;
stop[4] Urinals: 6 for every 1000 person
and 1 for every additional 1000
persons or part thereof
Women: 10 water closets for every
1000 persons and then 1 per 1000
persons after
Within 250m walking distance of
a public transport stop
Men: 1 per 100-400 persons;
For over 400 persons, add at the
rate of 1 per 250 persons or part
thereof.
Urinals: 1 for 50 persons or part
thereof
Women: 2 for 100-200 persons;
over 200 persons, add at the
rate of 1 per 100 persons or part
thereof
Vehicles
9 Public transport fleet Percentage of the public Entire public transport fleet
as per Urban Bus transport fleet with space for
Specifications II persons on wheelchairs and
strollers, lower grab bars,
minimum 700mm gangway,
doors with a clear width of at
least 1000mm
10 Information and Percentage of public transport Entire public transport fleet
communication fleet with route maps,
functional help line numbers
and emergency numbers and
real time information
[4]
This standard must be considered for intermediate public transport, where it serves the majority of public transport trips.
6Recommendation 8: Engender Public Transport Authorities
● Create a Gender Advisory Committee (GAC) within public transport authorities to:
o Make gender equality a core duty of the public transport authority.
o Review all public transport plans to ensure gender responsive planning, implementation and
evaluate impact.
o Create and implement a capacity building program for gender responsive planning, design,
implementation, monitoring and evaluation of public transport.
o Define protocols to prevent and address sexual harassment in public transport.
o Enable recruitment, retaining and promotion of women at all levels within public transport
authorities.
o Facilitate gender sensitization trainings for drivers, conductors, depot managers and
leadership.
This can be measured with indicators in Table 5
Indicator Measure Recommended Benchmarks
Employees
1 Women employees in Percentage of women At least 50 per cent women
the public transport employees in the public at junior, mid and senior
authority transport authority at different management levels across
levels different functions (Eg. drivers,
conductors, depot managers,
engineers, urban and transport
planners etc) or reflecting the
city’s female population ratio,
whichever is greater
Trainings and Complaint Redressal
2 Standard operating Standard operating procedures Public transport authority has
procedures created for preventing and created standard operating
addressing sexual harassment procedures, which is included
in the core training curricula for
drivers, conductors and depot
managers
3 Drivers, conductors and Percentage of drivers, All drivers, conductors and depot
depot managers, who conductors and depot managers
have received gender managers who have
sensitization trainings received training on gender
sensitization and standard
operating procedures annually,
along with quarterly follow-
ups to discuss challenges and
share learnings
4 Complaints and redress Gender disaggregated data on At least 80 per cent of the com-
mechanism is created complaints filed and redressed plaints filed by men and women
by the public transport are addressed within 14 days
authority
7Recommendation 9: Make Intermediate Public Transport Safer for Women and Girls
● Recognize IPT as a mode of public transport
● Make police verification of drivers (and conductors) mandatory, create standard operating
procedures and conduct gender sensitization trainings with the drivers (and conductors) to prevent
and address sexual harassment in their vehicles. This can be mandated by the Regional Transport
Organization (RTO), when issuing permits and approving IPT routes
● Design IPT stands to provide sheltered, safe and well-lit waiting areas with route signage and
information on complaint and emergency helpline numbers
This can be measured with indicators in Table 6.
Table 6: Indicators for intermediate public transport
Indicator Measure Recommended Benchmarks
Overall Journey
1 Level of safety, comfort Annual or bi-annual surveys At least 80 per cent women and
and convenience in the to assess sexual harassment, girls perceive the intermediate
intermediate public comfort and convenience public transport journey to be safe,
transport journey, in the intermediate public comfortable and convenient. (Each
disaggregated by gender transport journey i.e. from aspect is evaluated separately)
origin to shared IPT stop,
waiting at the stop, boarding
and alighting, traveling inside
the vehicle and travel from IPT
stop to destination. For direct
auto-rickshaw or taxi services,
interaction with drivers and
travel inside the vehicle will be
critical
IPT Infrastructure
2 Sheltered stops with Percentage of sheltered stops All stops
consistent and adequate with consistent lighting of 30-
lighting 40 lux
IPT Vehicles and Drivers
3 Intermediate public Percentage of intermediate Entire intermediate public
transport fleet public transport fleet with transport fleet
functional help line and emer-
gency numbers and name and
photograph of the driver pub-
lished inside and outside the
vehicle. The route maps must
be shown where applicable (as
in the case of mini buses etc.)
84 Drivers (and conductors) Percentage of drivers (and All drivers (and conductors)
verified by the police conductors) without criminal
records, verified by the police
5 Standard operating Standard operating procedures Standard operating procedures are
procedures created for preventing and created, which is a prerequisite for
addressing sexual harassment issuing permits
6 Drivers (and conductors) Percentage of drivers (and All drivers (and conductors)
who have received conductors) who have
gender sensitization received training on gender
trainings sensitization and standard
operating procedures last year.
This is accompanied with
quarterly follow-ups to discuss
challenges and share learnings
910
Photo by ITDP India
11
1. Introduction

Over 2012-20, around 865 million women are expected to enter the workforce (Strategy and PwC
2012). According to the McKinsey Global Institute, if women were to play an equal role in labour
markets, as much as USD 28 trillion could be added to the global economy by 2025. Yet, in urban
India, women’s labour force participation is only at 15.5 per cent (MoSPI 2014) and in fact, India’s
female labour force dropped by 19.2 million individuals between 2004-5 and 2011-12 (Andres, et al.
2017).

The performance of urban transport services places different burdens on women and men, with the
costs of poor public transport often being borne by women. For example, women may turn down
better employment opportunities further away from home in favour of lower-paid local opportunities
when the public transport system is unreliable or unaffordable (ADB 2013). Safe, comfortable,
convenient and affordable transport can play an important role in not only helping meet women’s
practical needs such as access to schools and markets, but also in contributing to their strategic
empowerment by facilitating access to social and economic opportunities.

In India, women’s concerns in urban transport came to the fore primarily through the lens of safety
since Jyoti Singh’s death[5] in December 2012. It brought this issue, which had earlier remained
confined to feminist and queer movements (Baxi 2014), to the public discourse and galvanized action
by civil society and different levels of government to create safer public transportation systems. The
Government of India created the Nirbhaya Fund over 2013–16 to implement schemes for improving
women’s security. Under the fund, the Cabinet Committee on Economic Affairs has approved the
setting up of a unified system at the national and state levels (City Command and Control Centre) for
Global Positioning System (GPS) tracking through emergency buttons and video recording in public
transport vehicles in 32 cities[6]. In 2016, Maharashtra introduced the Tejaswini buses, which were
ladies’ special buses plying during peak hours with women drivers and conductors (Gaikwadi 2017).
While most of these services are yet to start, numerous initiatives were underway prior to 2012, such
as reserved seats for women and ladies’ special buses, coaches and trains at the city-level. However,
these were not undertaken in a systematic or comprehensive manner.

Further, protectionist concerns (Phadke 2010), technological and project level interventions largely
circumscribe the discussions on women’s safety in India without an embedded inquiry into how
transport systems and institutions are gendered (Anand and Tiwari 2006). The Nirbhaya Fund
is critiqued for its tardy utilization (Kaul, Budget 2016: Nirbhaya Fund is a Dud; Jaitley Should
Urgently Find Ways to Utilise It 2016), and the service level benchmarks for urban transport remain
largely gender neutral. The Smart Cities Mission (MoHUA, Smart City Features 2015) and the
Green Urban Mobility Scheme (MoHUA, New Green Urban Mobility Scheme 2016) do not include
indicators, which could compel cities to improve their transportation systems for women’s mobility
of care (Madariaga 2013), affordability, safety, accessibility and comfort. Gender is not a ‘core
competence’ among urban local institutions or managers who remain primarily concerned with the

[5]
    Jyoti Singh was a 23-year-old woman`, who was beaten and gang raped in a private bus in which she was travelling
with a male friend. She was transferred to a hospital in Singapore for emergency treatment, but died from her injuries. This
incident generated widespread national protests.
[6]
    These are cities with a population of one million or more (as per the 2011 Census)

                                                             12
provisioning of basic services. Gender expertise is perceived to be within the domain of conventional
women’s programmes/agencies such as Women and Child Development (R. Khosla 2009).
Additionally, women’s access to urban transport has been framed through a rights based approach or a
public health or economic development discourse, but not both (Law 1999).
Women and girls are close to 50 per cent of our urban population. They comprise only 19 per cent
of “other workers” and yet 84 per cent of their trips are by public, intermediate public and non-
motorized modes of transport (Census 2011).[7]
While 73 per cent of trips by “other workers” in urban areas are by sustainable modes of transport,
women and girls’ share is only 14 per cent.[8] In the coming decade, cities will need to make a
concerted effort to improve women and girls’ experience of sustainable modes of transport to achieve
a target of 40 per cent of all trips. The policy brief fills this gap by providing a framework to integrate
technical and social, quantitative and qualitative approaches for enabling this transition.
Figure 1: Women constitute only 4% of cyclists who commute to their workplace in urban India
[7]
Other workers as defined by the Census include all workers except cultivators, agricultural labourers or household
industry workers.
[8]
Women’s trips are likely to be undercounted as the above may not account for trip-chaining and care-related trips.
132. Scope
This policy brief outlines the broad issues faced by women and girls when using or accessing urban
transport, and recommends key measures to enable equitable access. The brief recommends gender
responsive indicators, service level benchmarks and guidelines for comprehensive/green mobility
plans as well as walking, cycling, public and intermediate public transport. This policy brief has the
following constraints:
● A gendered agenda is incomplete without including transgender persons. This is a critical gap and
more research is required to understand their issues, concerns and needs.
● The brief focuses on road-based passenger transport as it forms the backbone of our urban
transportation systems.
● A safe and secure transport system requires intersectoral transformations in transportation and
urban planning, institutions, criminal justice system and behavioural change. However, this should
not result in policy paralysis and therefore this brief focuses on transport planning and design to
provide guidance on sectoral interventions.
The structure of the paper is as follows:
● Section 3 describes the gendered dimensions of urban transport with a focus on trip chaining and
purpose, modal shares, trip distances, time poverty, sexual harassment and employment in the
transport sector.
● Section 4 proposes urban transport indicators and service level benchmarks for comprehensive
mobility plans.
● Section 5 makes recommendations to improve women’s modal shares and experiences of walking,
cycling, public and intermediate public transport, and engendering public transport authorities.
● Section 6 identifies ministries and departments responsible for urban transport and their potential
role in mainstreaming gender.
The recommendations include case studies to highlight Indian and global practices.
1415
3. Gender Dimensions of Urban Transport

3.1. Trip Patterns and Purpose
Women’s travel is characterized trip chaining i.e. combining multiple destinations within one
trip. Women make shorter and more trips, which often require them to change, divert, and break
their journeys to pick up children, run errands, shop or take on other family obligations (Allen,
Vanderschuren and Town 2016). This often makes it costlier for women to get around, since they may
have to pay numerous single fare tickets during such a chained trip.

                              Figure 2: Trip Chaining as a Gendered Mode of Travel

Since women are overrepresented as informal workers, their destinations may not be concentrated in
the central business district or in one or two main areas, but dispersed (Kuneida and Gauthier 2007).
In Visakhapatnam, while 39 per cent of all trips were for work, only 11 per cent of women’s trips
versus 63 per cent of men’s trips were for work. A study of a low-income settlement in Delhi showed
a gender dimension to the shelter-transport-livelihood link i.e. women are more affected than men
when access to employment, education or basic services are located far away from their residences.
For example, relocation of squatter settlements to the periphery of Delhi led to an increase in female
unemployment by 27 per cent compared to 5 per cent for men (Anand and Tiwari 2006).

3.2. Modal Shares, Trip Distances and Time Poverty
A gendered comparison of Census data (2011) for five cities[9] on ‘Travel to place of work for other
workers’ revealed that on average, 37 per cent women walked to work compared to 27 per cent of
men. In Bangalore, 43 per cent of women walked to work compared to 24 per cent of men, whereas in
Chennai, twice the number of women (34 per cent) walked to work than men (16 per cent). Similarly,
in Ranchi, 59 per cent women walked to work (ITDP 2015), whereas in Hazaribag, 76 per cent

[9]
      Bangalore, Delhi, Kolkata, Mumbai and Chennai

                                                      16
women walked to their educational institute or workplace (Jagori 2016). In Sanjay Camp in Delhi, 52
per cent of women as compared to 26 per cent of men walked to work. However, though 21 per cent
of people used bicycles, women constituted only 2 per cent pillion riders (Anand and Tiwari 2006).
Similarly, in Chennai, even with poor bicycling facilities, bicycling rates for low-income men were 8
per cent compared to 1 per cent for low-income women (Uteng and Cresswell 2008). The difference
in cycle use is due to women’s higher concern for safer riding environments and lower ownership
of cycles. Women’s limited access to basic carts or load-carrying bicycles results in frequent strain
injuries, and neck and back pain due to excessive head loading (Deike 2011). Further women’s choice
of cycling is also constrained by socio-cultural perceptions, such as being perceived as ‘madam’[10] by
their neighbours and children, as has been shown in Pune (Parisar and University of Pune 2009).
According to the National Sample Survey Office (NSSO), more than 60 per cent of rural and urban
households use the bus as their main mode of public transportation, followed by auto-rickshaw, taxi,
railways and cycle rickshaw (NSSO 2016). While women’s bus transport modal shares vary from 25
per cent in Mumbai[11] to 37 per cent in Bhopal (DIMTS 2012), women are more dependent on public
transport than men are, especially when they are from lower-income groups. In Mumbai, women
made 45 per cent more trips by bus than by train, which increased to 67 per cent for households with
incomes less than Rs 5000 per month (World Bank 2011).
In Delhi, 34 per cent of women commuted to work by bus compared to 25 per cent of men, whereas
the corresponding figures for Chennai were 34 per cent (women) and 22 per cent (men) (Census
2011). Unfortunately, the off-peak and peripheral public transport routes on which many women
depend for their travel to the market or social facilities, have much less priority than the radial
commuter corridors going straight to the city centre (Viswanath 2013). In Bhopal, the informal system
carries more passengers (20 per cent) than the formal public transport system (DIMTS 2012). Due to
the unregulated nature of this sector, affordable but poor quality of vehicles, unverified drivers and
conductors, unpredictable schedules and a lack of accountability characterize it.
Women tend to take more and shorter trips at varied times, during peak and afternoon off-peak hours.
In Bangalore, the average distance traveled by women for work (1.7km) was about half of that for
men (3.3km), whereas in Mumbai, women traveled 3/4ththe distance of men (4km) (Census 2011). In
Delhi’s Sanjay Camp, 75 per cent of women worked within a 5km radius whereas 75 per cent of men
worked within a 12km radius. Lower income women used slower and inexpensive modes of transport
to manage transport costs, which exacerbates their time poverty (Anand and Tiwari 2006).
3.3. Sexual Harassment
Sexual harassment is unwanted sexual behaviour that includes physical harassment such as touching
and groping, verbal harassment including commenting and whistling, and visual harassment such
as staring and leering. With growing urbanization, the phenomenon of sexual violence in cities has
become a serious issue. Sexual harassment has an effect on women’s mobility, accessibility and
confidence. Lack of safety and security in public spaces and public transport affects women’s human
rights and their ability to participate equally in the city.
[10]
Used as a term to connote that a woman has become “modern”
[11]
The reserved seats are taken as an indicator of women’s ridership in BEST
17There have been several studies conducted in India over the past few years that have explored the
nature and extent of sexual violence that women and girls face in Indian cities, specifically in public
spaces including public transport. A study conducted in Delhi in 2010, reported that over 90 per cent
of women had faced some form of sexual harassment in the past year (Jagori 2010). The same study
showed that 51 per cent of women faced harassment inside public transport, and another 42 per cent
while waiting for public transport.
Similar studies in Mumbai, Kerala, Guwahati and Bengaluru showed high levels of sexual harassment
and everyday violence. In a study of two cities in Kerala by Sakhi in 2010, Kozhikode reported that
71 per cent of women respondents faced harassment while waiting for public transport while 69 per
cent faced it while using public transport. Similarly, in Trivandrum, over 80 per cent faced sexual
harassment while either waiting for or riding public transport (Sakhi 2011). In Mumbai, a survey done
by Akshara in 2013 also showed that 46 per cent of women reported facing sexual harassment inside
buses and 17 per cent inside trains (Akshara Centre 2015).
In a study done by Safe Safar with UCL, London in Lucknow, 88 per cent of the respondents said
that they had faced sexual comments while in public transport (Safe Safar, Safetipin and UCL 2014).
A Bengaluru Metropolitan Transport Corporation (BMTC) survey among female commuters in 2013
found that two out of three commuters faced regular harassment (Deccan Herald 2013). The 2014
Thomson Reuters Foundation survey on unsafe transport in capital cities around the world found
Delhi to have the fourth most unsafe public transport among the cities surveyed after Bogota, Lima
and Mexico. (Thomson Reuters Foundation 2014) A 2008 National Association of Software and
Services Companies (NASSCOM) study showed that female employees in the IT sector across India
depended heavily upon the transport provided by the company as it was considered safer than public
transport.
While there are occurrences of gruesome and violent crimes, the defining characteristic of violence
against women is its normalization and ordinary and continuous nature (Viswanath 2013). This forces
us to examine violence within the frame of rights and its violations. ‘Although feeling unsafe is not
confined to women, the fear that women feel in urban areas is quite particular. It is to do with physical
and psychological honour. Although not all women have been raped or attacked; all have felt at
some point that indescribable feeling of unease which ranges from merely feeling uncomfortable to
paralysis.’ (Smaoun 2000)
Further, there is high underreporting of violence against women in public spaces and of sexual
harassment in public transport as it takes place during a journey making it more difficult to report
the offence. It is sometimes difficult to identify the harasser in a crowded space and know whom to
report to. In a metro train, it is possible to have a button, which directly links to the security at the
next station where the woman can lodge her complaint as well as identify the harasser, but in most
situations, women just move away from the harasser or at the most confront him and make a noise.
Women and girls fear using public transport because of violence and the fear of violence. Crowded
public transport is often a space where women face sexual harassment, because the crowd offers
anonymity. This has led to interventions such as women only carriages in metro trains or women
only buses. Consequences of the violence and insecurity that women face leads to forced immobility.
Simultaneously, women and girls are subject to forced mobility when they have to undertake trips,
18which are often unsafe because of lack of services, such as water and sanitation (Khosla and Dhar
2013).
3.4. Employment
According to the International Labour Organization, transport is one of several sectors that has
traditionally been regarded as having ‘no place for women’ (Turnbull, Lear and Thomas 2009). In
2005, 6.85 per cent of women were employed in the transportation sector in India compared to 19 per
cent of men. In Mumbai, according to a World Bank report, women constituted only 12.5 per cent of
the Brihanmumbai Electric Supply & Transport (BEST) Committee and 1 per cent of its engineers
in 2010. When BEST attempted to induct women bus conductors, all of them requested to be shifted
to desk jobs (World Bank 2011). Similarly, the Delhi Transport Corporation (DTC) has 245 women
conductors and only one-woman driver (Kaul and Shrivastava, Safety of Women in Public Spaces in
Delhi: Governance and Budgetary Challenges 2017).
Women face multiple challenges including accessing vocational training specific to transport sector
jobs. For example, the requirements pertaining to driving licenses are passed on informally from older
male family members to younger ones. Moreover, the upfront investment associated with training
programs may be a barrier for resource-poor women. In the DTC, drivers are required to hold a valid
heavy motor vehicle license for at least three years and a public service vehicle (PSV) badge issued
by the licensing authority, which is a major entry barrier. Additionally, when women are qualified
for the jobs, insidious gendered assumptions regarding their suitability for the job prevent them from
breaking into the transport sector (Azad Foundation and University of Western Ontario 2014).
Harassment and threats by commuters and colleagues, lack of public toilet facilities are additional
barriers. Encouraging women in non-traditional occupations requires institutions to create a conducive
environment. Simultaneously, women’s presence at different levels in public transport authorities has
the potential of mainstreaming gender within the organization by bringing women’s issues to the fore
in its services and infrastructure.
3.5. Conclusion
This section discussed how urban mobility is gendered. While cost, personal security and time
poverty are considered as the three main factors that influence women’s transportation accessibility
(Allen, Vanderschuren and Town 2016), cultural perceptions and spatial location also shape women’s
mobility. For example, women may not travel without a male escort, or they have to be ‘decently’
dressed to prevent harassment. They may also be expected to wear markers of respectability such as
a mangalsutra (a necklace worn after marriage), and exhibit controlled body language. These beliefs
are also internalized by the women themselves (Phadke, Ranade and Khan 2009), and could result
in restricting women’s mobility and reflect a latent demand for trips not made. Similarly, peripheral
areas often do not have reliable and affordable transport, which can limit women’s employment
opportunities while increasing their time poverty from household responsibilities. A study of the
differences in travel behaviour between two low-income settlements in the city centre and peripheral
areas in Chennai revealed that 88 per cent of the trips in the centrally located slums were by non-
motorized transport (NMT) modes compared to 73 per cent in peripheral locations (Srinivasan 2004).
Therefore, policy recommendations must acknowledge the multiple dimensions shaping women and
girls’ travel, especially mobility of care and social norms, perceptions and behavior.
1920
21
4. Policy Recommendations

4.1. Urban Transport Indicators and Benchmarks
National level policies and missions have addressed women’s concerns primarily through the lens of
safety, with project and technology centric interventions. The National Urban Transport Policy (2014)
makes some recommendations such as police verified drivers and conductors, GPS for public and
intermediate public transport, closed-circuit television (CCTV) cameras in all transport infrastructure
and street lighting (MoHUA, National Urban Transport Policy 2014).

Similarly, the Jawaharlal Nehru National Urban Renewal Mission (JnNURM) was launched over
2006 with the objective of investing in urban infrastructure, introducing governance reforms and
providing basic services to the urban poor. Urban transport constituted 35 per cent of all completed
infrastructure projects and 27 per cent of the expenditure (Jana, et al. 2015). However, the gender
perspective was overlooked within JnNURM (R. Khosla 2009). The Smart Cities Mission launched
in 2015, aims to create walkable localities, promote mixed-land uses, preserve and develop open
spaces along with technology-centric pan city proposals such as CCTV cameras (MoHUA, Smart
City Features 2015) MoHUA is formulating the Green Urban Mobility Scheme which earmarks INR
70,000 crores for sustainable transport (MoHUA, New Green Urban Mobility Scheme 2016).

There is a need to create urban transport indicators and benchmarks and define a process to create,
implement, monitor and evaluate gender responsive comprehensive/green mobility plans. The
National Urban Transport Policy should adopt the sustainable development goal 11.2, which aims
to “By 2030, provide access to safe, affordable, accessible and sustainable transport systems for all,
improving road safety, notably by expanding public transport, with special attention to the needs
of those in vulnerable situations, women, children, persons with disabilities and older persons”
(UNSDSN n.d.).

Additionally, the existing service level benchmarks for urban transport cover indicators for public
transport facilities, pedestrian infrastructure, non-motorized facilities, intelligent transport systems,
street infrastructure, road safety, parking facility, pollution levels, land-use and transport integration
and financial sustainability of public transport (MoHUA n.d.). These should be modified to become
gender responsive as outlined in the subsequent sections.

                                                     22
Case: Women Friendly City Project, Seoul
In South Korea, the central government establishes basic guidelines, which are adopted by local
governments to prepare detailed plans. Women-related policies in Seoul and the Women Friendly City
program aimed to (i) address the needs of a diverse range of urban women, (ii) their daily needs, (iii)
and influence gender mainstreaming in other policies. According to an online survey, women experi-
enced the biggest inconvenience in public restrooms, followed by public transportation, driving and
parking, sidewalks, parks and public buildings.
The Convenient Seoul policy aims to improve women’s accessibility to public places and mobility by
public transportation. The Seoul metropolitan government increased the number of toilets in female
restrooms in subway stations, newly-built performance centres, stadia and parks. It also installed di-
aper-changing tables and improved lighting in public restrooms. The government designated parking
lots for women in public parking zones and installed more CCTV cameras. It lowered the height of
the sidewalk ledge and installed hump-type crosswalks. For more convenient use of public transporta-
tion, the government lowered the handles in buses and subways and installed transportation facilities
to help women and the disabled. It promoted installation of ticket gates for baby carriages in subway
stations. The Women Safety Brand Call Taxi project allows women to access a safe taxi service at
night. A phone service sends the plate number, departure time, and location via a text message to the
family members of women who use the taxi at night. The city planning committee added more wom-
en committee members to encourage women’s participation in policy-making.
Governance of the Women Friendly City Project: The Women Friendly City Project partner group
consists of 187 members with women’s civic groups, relevant officials of municipal government
organisations and experts in various fields like women’s issues, welfare, road, transportation, housing,
architecture, city competitiveness and environment. Each department holds regular meetings, and
works with officials in other relevant departments. The expert group provides professional advice to
policy makers from the planning stage to implementation and also suggests new projects.
Education and Training for Government Officials: The Seoul Foundation of Women and Family
(SFWF) developed a Women Friendly City Project manual, ‘City Designed by Women: Transforming
the City through Women’s Eyes,’ to help relevant officials recognise gender issues in their work.
The manual provides officials with simulation practice sessions and cases from other countries.
Additionally, the SFWF established an education programme for government officials and trained
instructors for it. The programme consists of two parts. The first part is about gender mainstreaming
in general. The second part consists of an action plan for the Women Friendly City Project, which
introduces its basic concepts and its practical application. Instructors are trained in gender based
analysis, gender-sensitive budget and gender-disaggregated statistics. Experts in housing, roads,
transportation, culture, environment and welfare also teach in the education programme.
Challenges: The challenges and constraints included a lack of interest by some city departments,
a need for accountability mechanisms that encourage a high level of voluntary participation and
limited gender-planning competence of city officials and professionals. Additionally, there is scant
information on the impact of this project.
Source: (UN Habitat 2008)
234.2. Comprehensive Mobility Plans
Urban mobility plans need to adopt a holistic approach towards gender inclusion as outlined in Figure
3. An institutional framework is recommended to guide the preparation, implementation, monitoring
and evaluation of the comprehensive mobility plan.
● Create a functional Unified Metropolitan Transport Authority (UMTA) in 1 million+ cities to
coordinate the planning and implementation of urban transport projects in the metropolitan region.
The UMTA should include women’s groups, gender, urban planning and transportation experts.
● Create a multi-stakeholder committee (MSC) in cities less than a population of 1 million,
comprising of the urban local body, urban development authority, traffic police, police, public
transport authorities, relevant state departments along with women’s groups, gender, urban
planning and transportation experts.
● Create a Gender Advisory Committee (GAC) within the UMTA or the multi-stakeholder
committee to review each stage of the comprehensive mobility plan process, transportation
projects, policies and programs, monitor implementation, evaluate impact and implement a
capacity building program. The GAC will include gender experts from transport organizations in
the UMTA. Identify a senior state level official, such as the Chairman of the UMTA or MSC to
preside over the GAC and become a champion for implementation of gender responsive projects in
the mobility plan.
Figure 3: Suggested approach to integrating gender in mobility plans
24Recommendation 1: Measure Gendered Mobility Patterns
● Conduct household surveys to
o Understand gendered mobility patterns such as trip origins and destinations, trip purposes, trip
chaining, mode of transport, trip lengths, trip costs and travel times.
o Understand women’s perceptions of security, comfort and convenience and aspirations from
the transportation system.
o Measure gendered inequities in travel such as time poverty, travel costs, forced mobility and
forced immobility.
● Consider time use diaries to understand how men and women structure their everyday life for
productive, care and leisure (Kuneida and Gauthier 2007).
● Conduct focus group discussions with women and men’s groups to understand their needs and
aspirations from the urban transport system.
● Conduct surveys and focus group discussions with commuters, bus conductors and public
transport officials to assess their awareness and perceptions of sexual harassment, and how it can
be addressed.
● Conduct universal accessibility and women’s safety audits to assess the quality of urban transport
infrastructure (bus and IPT stops, trains stations, terminals and interchanges).
● Assess the urban transport system using the indicators and service level benchmarks identified in
Tables 7, 8, 9, 10, 11, 12 and evaluate gaps.
The following are some concepts of gendered travel:
Mobility of care is an appraising and labeling Time poverty is the lack of time for
of care-related travel, which is predominantly rest and leisure after accounting for
undertaken by women currently. Care trips time spent working (in the labour
are often chained, shorter, cover a smaller market or performing domestic tasks)
geographical area and closer to home and on other activities.
as compared to employment trips. They Women’s greater domestic
tend to be insufficiently accounted for and responsibilities coupled with
therefore systematically under-represented in their weaker access to household
transportation statistics resources can result in the use of
(Madariaga 2013). less expensive and slower modes of
transport, especially when they are
Forced mobility is caused when lower income. This can exacerbate
functions that are taken for granted their time poverty
in some places are absent in others. (Turner and Grieco 1998).
Due to inadequate water and
sanitation infrastructure in low-
income communities, many essential
functions such as defecation and
accessing water require long, risky Forced immobility is a consequence of
trips. Women and girls may perform violence and insecurity in transport, which
the former functions under cover constrains movement (Whitzman 2013).
of darkness, facing the threat of
harassment or violence
(Whitzman 2013).
25Recommendation 2: Set Goals and Create a Mobility Plan Underpinning Women
and Girls’ Concerns
● Identify goals, targets and projects with women’s groups to increase women and girls’ mode
shares in sustainable transport i.e. walking, cycling, public transport, prevent and reduce women’s
experience of sexual harassment, reduce time poverty and improve affordability, comfort and
convenience. Table 7 identifies indicators and recommended benchmarks for a gender responsive
comprehensive mobility plan.
● Create gender disaggregated business as usual and subsequent sustainable transport scenario to
estimate reductions in greenhouse gas emissions.
Table 7: Indicators and benchmarks for comprehensive mobility plans
Indicator Recommended Benchmarks
1 People near transport At least 80 percent of women and girls live within 500m walking
(PNT), disaggregated by distance of public transport in the city and metropolitan region,
gender with a frequency of at least 6 schedules per hour
2 Mode shares, At least 80 per cent of all trips are by public and non-motorized
disaggregated by gender transport
At least 40 percent of all public and non-motorized transport trips
are by women and girls
3 Median non-motorized Women and girls’ walking trips are less than 15 minutes
trip time, disaggregated Women and girls’ cycling trips are less than 25 minutes
by gender
4 Median motorized trip Stabilized at 2017 levels or lesser
distances, disaggregated
by gender
5 Cost on transport per Not more than 10 per cent of household expenditure for low
month income households
6 State and city Specific allocations and expenditures in the state and city transport
transport allocations budget for women’s safety in urban transport
and expenditures on
transport, benefiting
women and girls
7 Improved air quality City achieves or exceeds air quality standards set by the CPCB;
50 percent of the reduction in air pollutants because of women and
girls’ use of sustainable modes of transport
26● Organize inclusive consultations and design charrettes to incorporate women’s perspectives and
prioritize projects.
Some guidelines for inclusive consultations are:
● Proactively reach out to marginalized women and men to ensure they are included, especially
street vendors and other workers in the informal economy.
● Partner with local women’s and membership based organizations to access their networks and
expertise.
● Hold consultation meetings where women or particular communities already gather (i.e. informal
settlements, markets, schools, childcare centres, parks etc.), and in settings that are accessible and
comfortable for diverse groups of women.
● Plan meetings at different times of the day and not just in the evenings as women might be
reluctant to go out at night or have family responsibilities in the evenings.
● Ensure safety at consultation events by holding them in well-lit areas, areas that have easy access
to public transportation, etc. Provide practical support such as transportation subsidies, child care,
translation for non-native English speakers, and spaces that are accessible for women and men
with disabilities.
● Ensure that information is disaggregated by gender, age, caste, income and other relevant socio-
economic factors, and provided in a lucid manner in all major languages.
Source: Adapted from (International Centre for Municipal Development 2007)
Recommendation 3: Set Goals and Create a Mobility Plan Underpinning Women
and Girls’ Concerns
● Prepare implementation and phasing plan with timelines, financial resources to meet
the gender targets, goals and projects of the comprehensive mobility plan and identify
responsible agencies.
● Gender Advisory Committee (GAC) should monitor implementation progress on an
annual or bi-annual basis.
Recommendation 4: Monitor Implementation Progress and Evaluate Outcomes
● Conduct periodic evaluations by a third party (with women’s groups) to monitor
implementation progress and assess impact.
● Share implementation challenges, successes and build capacity within UMTA or multi-
stakeholder committee.
These can be facilitated by the GAC.
27Case: Transport for London (TfL)
Women constitute 51 per cent of London’s population. A study found that women made more trips
than men, mostly for work or to escort children. In the evenings, they felt vulnerable walking to their
destination from the subway station/ bus stop (Hibbett and Meager 2003). Additionally a safety and
security survey conducted by Transport for London (TfL) revealed that 90 per cent of the commuters
who experienced sexual harassment did not report to the authorities. This led to Project Guardian,
a joint initiative launched in 2013 between British Transport Police (BTP), the Metropolitan Police
Service, the City of London Police, and TfL. The helpline number was widely publicized and
awareness campaigns were conducted to help people gain confidence in approaching the Police. TfL
staff and police officers were given special training to handle the cases of sexual harassment on public
transport in London (Project Guardian 2013).
In its approach towards gender mainstreaming, TfL held a consultation with 140 women’s groups
across London and constituted an Action Plan. This comprehensive plan was classified into five broad
categories: Accessibility, Safety and Security, Affordability, Information, and Employment (Herbel
and Gaines 2009).
Action on Equality, a 4-year action plan (2016-20) promotes equality, and enhances access to
transport services and employment for diverse groups of people. This plan takes forward the
initiatives noted under Single Equality Scheme (2012–15) i.e. accessible bus stops, legible maps, real
time information on buses and equal opportunities for all the staff. The plan has set 11 equality goals
that aim at safer and convenient public transport in London. Some of the initiatives under this plan
include speedy customer service, priority seating, improved lighting around the bus stops, safer streets
for pedestrians and cyclists, diverse workforce etc. TfL will also work with various youth groups to
run campaigns and raise awareness on safer public transport, and review the campaign and initiatives
of the goals annually (Equality & Inclusion 2016).
28Photo by Ian Kindred 29
5. Modes of Transport
The following recommendations aim to increase women’s mode shares of walking, cycling and public
transport.
Recommendation 5: Create Safe and Comfortable Walking Environments for
Women and Girls
Since a greater proportion of women make walking trips, insufficient, unshaded and poorly
maintained pedestrian infrastructure affects them to a greater degree than men. Pedestrian
infrastructure should be designed as per IRC 103: 2012 Guidelines for Pedestrian Facilities, which
proposes three zones - a dead zone, pedestrian zone and a multi-functional zone for footpaths along
with a level of service approach for determining the width of footpaths. Further, streets and pedestrian
infrastructure should be consistently lit and shaded, along with access ramps and tactile pavers to
facilitate universal accessibility. Additionally, active street edges with pedestrian friendly ground
floor uses are recommended along with low compound walls. Street vendors also provide ‘eyes on the
street’ by creating an informal surveillance system. Table 8 identifies indicators and benchmarks for a
walkable street network and pedestrian infrastructure.
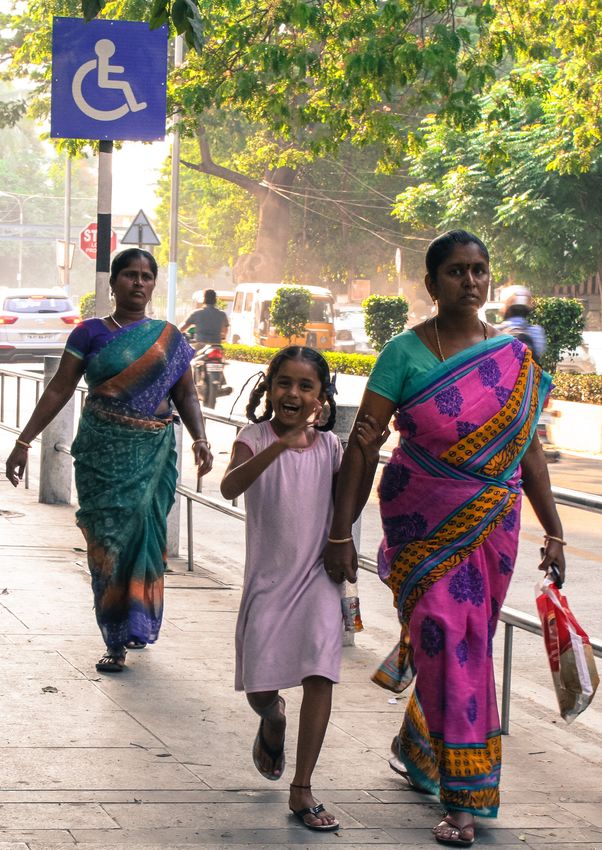
Figure 4: An active street: Jungli Maharaj Road, Pune
30You can also read