Operational Report - Public Transport Authority

Page created by Joshua Dixon
 
CONTINUE READING
Operational Report - Public Transport Authority
2. Operational Report

Public Transport Authority Annual Report 2014-15
                                                                           23
Operational Report - Public Transport Authority
2. Operational Report
     2.1 Customers and community                                          Transperth
                                                                          The Transperth PSM, which has been
     An independent market research organisation is commissioned          running for 24 years, surveyed more than
     to undertake annual Passenger Satisfaction Monitors (PSMs) to        4300 passengers, covering all modes, all the
     assess the level of passenger satisfaction with various aspects of   bus contract areas and all the rail lines.
     Transperth and Transwa services. The survey conducts detailed
     face-to-face interviews with regular public transport users,         Transperth: Level of overall customer
     covering all the main demographics.                                  satisfaction (per cent)

                                                                            100                               88.4
                                                                                  84.4   85.5   82.3   85.4
                                                                             80

                                                                             60

           88.4%
                                                                             40
                                       Overall Transperth
                                       customer satisfaction                 20

                                                                              0
                                                                                  2011   2012   2013   2014   2015

                                                                          Overall customer satisfaction with Transperth
                                                                          services system-wide (calculated as the
                                                                          weighted average across all modes) recorded
                                                                          a marked improvement in 2015, increasing
                                                                          3.5 per cent to 88.4 per cent of users from
                                                                          85.4 per cent in 2014.

24
Operational Report - Public Transport Authority
Transperth trains
The Transperth train component of the 2015
PSM interviewed 1008 train passengers.
The sample consisted of adults aged
18 years and older, residing within the Perth
metropolitan area who were current users
of Transperth train services and travelled
on train services at least once per fortnight.
School students were excluded.
The results showed that the proportion of
train passengers who were satisfied with
Transperth train services overall increased
for the second successive year with
92 per cent of users expressing satisfaction       Transperth trains: Level of overall          Among peak passengers, 91 per cent
in 2015. This was an increase of 3.4 per cent      customer satisfaction (per cent)             expressed satisfaction in 2015, a 4.6 per cent
compared with 89 per cent satisfied users                                                       increase; among off-peak passengers,
in 2014. This also followed the significant                                                     it was 93 per cent (91 per cent in 2014).
                                                     100          89            89       92
six per cent improvement achieved in 2014                  88            84                     The proportion of passengers who were
over 2013 when the proportion of satisfied            80                                        dissatisfied overall fell to its lowest level to
users was 84 per cent.                                                                          two per cent (previously three per cent).
                                                      60
                                                                                                The main reasons for dissatisfaction were
                                                      40
                                                                                                “need extra carriages” and “too crowded in
                                                      20                                        peak times”. To address these issues, the PTA
                                                                                                has ordered 66 B-Series railcars (22, three-car
                                                       0
                                                           2011   2012   2013   2014     2015   trains), of which 33 new railcars (11, three‑car
                                                                                                trains) have been delivered and were in service
                                                                                                during the year. These additional railcars were
                                                                                                used to increase the number of six-car trains
                                                                                                in operation.

Public Transport Authority Annual Report 2014-15
                                                                                                                                                   25
Operational Report - Public Transport Authority
The importance rating of the key service characteristics of Transperth train services              Transperth buses
     (other than passenger safety) and the respective levels of satisfaction are as follows:            The 2015 PSM interviewed 2409 regular
                                                                                                        bus patrons and 704 Central Area Transit
                                                Importance                   Satisfaction               (CAT) bus users. The proportion of bus users
      Service characteristic
                                                 rating %             (dissatisfaction) rating %        who expressed overall satisfaction with all
                                              2014        2015            2014           2015           Transperth bus services increased for the
                                                                                                        second successive year reaching 86 per cent,
      Cost of fares                            72          72            52 (16)        48 (15)         an increase of 3.6 per cent over the 2014 result,
      Punctuality                              63          60             95 (1)         94 (3)         which marked an improvement of 2.5 per cent
      Cleanliness on board                     48          57             90 (3)         91 (2)         over 2013.
      Speed of the trip                        66          55             93 (2)         92 (2)         At eight per cent (unchanged from last year),
      Availability of seats                    56          55            73 (17)        78 (14)         the dissatisfaction rating was the consecutive
                                                                                                        lowest in the 20 years since bus services have
      Service frequency weekdays               48          53             83 (6)        77 (10)
                                                                                                        been contracted out. The main reasons cited
      Service frequency peak times             43          53            82 (11)        81 (10)         for dissatisfaction also remained unchanged
      SmartRider                                           39                            97 (1)         and were “infrequent services”, “buses never on
                                                                                                        time”, “insufficient off-peak services”, “buses and
     In 2015, as in 2014, most respondents rated “cost of the fares” the most important service         trains don’t connect well”, and “rude drivers”.
     characteristic. The satisfaction levels fell slightly to 48 per cent in 2015 (from 52 per cent).   Transperth buses: Level of overall
     The service characteristic “time waiting for connecting bus” in the 2014 list was replaced         customer satisfaction (per cent)
     by “SmartRider” rated as one of the most important by 39 per cent of the respondents.
                                                                                                           100
     The proportion of train users who were satisfied with this service characteristic was                       82     83              83     86
                                                                                                                                81
     97 per cent.                                                                                           80

                                                                                                            60

                                                                                                            40

                                                                                                            20

                                                                                                             0
                                                                                                                 2011   2012   2013    2014   2015

26
Operational Report - Public Transport Authority
The importance rating of the key service characteristics of Transperth bus services             Transperth ferries
(other than passenger safety) and the respective levels of satisfaction are as follows:         The 2015 PSM surveyed 200 ferry patrons
                                                                                                (divided equally between Perth residents
                                           Importance                  Satisfaction             and visitors).
 Service characteristic
                                            rating %            (dissatisfaction) rating %
                                                                                                The results over the year have shown that a
                                         2014        2015            2014           2015        very high proportion of passengers express
 Punctuality                              70           68           76 (13)        78 (12)      satisfaction with the ferry service overall.
                                                                                                In 2015, for the first time, the level of overall
 Cost of fares                            58           64           56 (13)        56 (13)
                                                                                                customer satisfaction reached 100 per cent.
 Shelter provided at the bus stop         53           54           74 (17)        78 (15)
                                                                                                Transperth ferries: Level of overall
 Cleanliness on board                     43           52            94 (1)        94 (2)
                                                                                                customer satisfaction (per cent)
 Service frequency weekdays               54           48           71 (18)        71 (18)
 Bus drivers’ handling of the bus                      47                          87 (3)                                 96      97     100
                                                                                                         96      95
                                                                                                   100
 Speed of the trip                        43           47            89 (4)        92 (3)
                                                                                                    80
 Ease of connecting between
 buses and trains                                      44                          89 (6)           60

                                                                                                    40
Two new service characteristics “bus drivers’ handling of the bus” and “ease of connecting
                                                                                                    20
between buses and trains” entered the list in 2015 while “availability of seats” and “service
frequency at peak times” dropped out.                                                                0
                                                                                                         2011    2012    2013    2014    2015

Public Transport Authority Annual Report 2014-15
                                                                                                                                                    27
Operational Report - Public Transport Authority
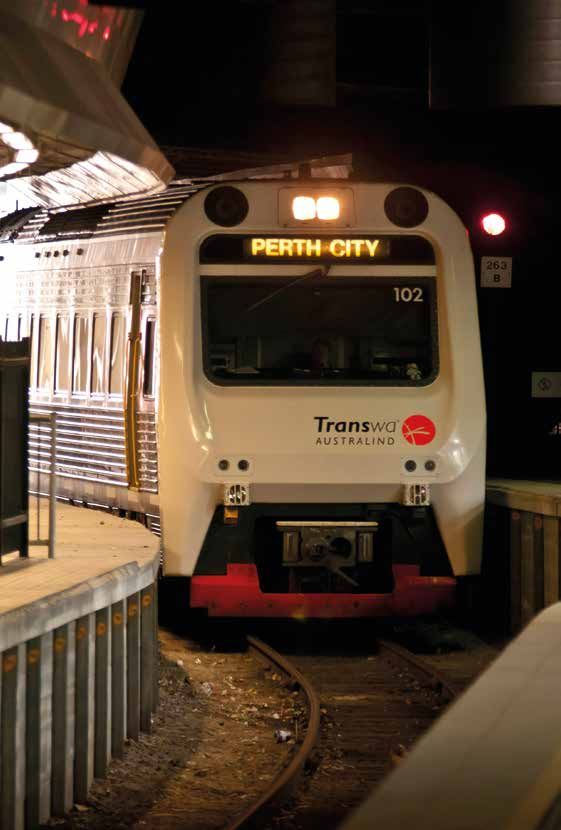
The importance rating of key service characteristics (other than passenger safety) and the      Transwa
     respective levels of satisfaction are as follows:
                                                                                                     The Transwa PSM has been running for
                                                                                                     13 years and surveyed 1502 passengers,
                                                Importance                  Satisfaction             covering road coach operations as well as all
      Service characteristic
                                                 rating %            (dissatisfaction) rating %      the rail services.
                                              2014        2015            2014          2015         Overall customer satisfaction was maintained
      Cost of the fare                         73          73            82 (2)         84 (1)       at a very high level. The Transwa PSM
      Cleanliness on board                     75          66            100 (0)        99 (0)       showed that 93 per cent of passengers
                                                                                                     were either satisfied or very satisfied with
      Service frequency weekdays               58          66            71 (18)        87 (5)
                                                                                                     service performance.
      Punctuality                              64          65            99 (0)         98 (1)
                                                                                                     Transwa: Level of overall customer
      Speed of the trip                        55          55            99 (0)         98 (1)
                                                                                                     satisfaction (per cent)
      Availability of seats                    53          54            100 (0)       100 (0)
      Shelter at the jetty                     48          49            83 (12)       81 (12)         100
      Availability of timetables                           41                           70 (2)          80

                                                                                                        60
     A new service characteristic, “availability of timetables” identified by 41 per cent of
     respondents entered the list in 2015, with 70 per cent of users satisfied, replacing “service      40
     frequency peak times”.
                                                                                                        20

                                                                                                             90

                                                                                                                    90

                                                                                                                            92

                                                                                                                                   90

                                                                                                                                          93
                                                                                                         0
                                                                                                             2011   2012   2013    2014   2015

28
Operational Report - Public Transport Authority
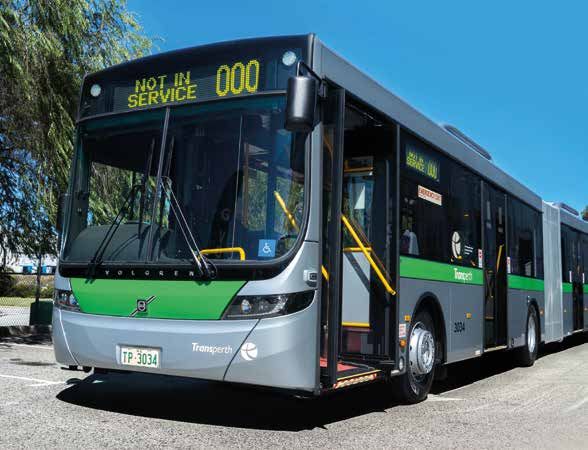
Transwa trains                                     Transwa trains: Customer satisfaction (per cent)
There were excellent satisfaction levels for
our trains - the AvonLink rating jumped              100
to 99 per cent (previously 94). A major
                                                      80
contributing factor to the significant increase
was the introduction of the additional Midland        60
to Northam services, on December 1, 2014.             40
The Australind remained high but dropped
one per cent from the previous year to                20

                                                             94
                                                             96
                                                                      75

                                                                                    86
                                                                                    93
                                                                                             87
                                                                                             90

                                                                                                            93
                                                                                                            93
                                                                                                                 84
                                                                                                                 88

                                                                                                                                87
                                                                                                                                93
                                                                                                                                     94
                                                                                                                                     92

                                                                                                                                               92
                                                                                                                                               92
                                                                                                                                                      99
                                                                                                                                                      82
92 per cent, while the Prospector approvals            0
increased significantly to 92 per cent                             2011                   2012               2013                2014              2015
(previously 87). The MerredinLink dropped                             Prospector        Australind    AvonLink & MerredinLink    *AvonLink   *MerredinLink
significantly to 82 per cent (previously 92);
this drop is attributed to the decrease in         *Note: Before 2012 AvonLink and MerredinLink results were combined.
services to one return service per week.
                                                   Transwa road coaches
                                                   The road coaches also enjoy a consistently high satisfaction level,
                                                   with 93 per cent of customers happy with road coach services.
                                                   Transwa road coaches: Customer satisfaction (per cent)

                                                      100

                                                       80

                                                       60

                                                       40

                                                       20
                                                            90

                                                                          91

                                                                                   93

                                                                                            91

                                                        0                                            93
                                                            2011      2012     2013         2014     2015

Public Transport Authority Annual Report 2014-15
                                                                                                                                                             29
Operational Report - Public Transport Authority
Customer safety and security
     The PSM assesses customer perceptions of safety during the day
     and at night, waiting for and aboard the (bus/train/ferry) service.
     Across the modes, virtually all passengers feel safe (aboard or
     waiting) during the day.
     Transperth: Customer safety (per cent)
     Proportion of respondents who generally feel safe on board
     during the day.

      100

       80

       60

       40

       20

                        100

                                                                              100

                                                                                              100
            99
                 98

                              99
                                   99
                                          99

                                                99
                                                     99
                                                          97

                                                                  99
                                                                       98

                                                                                    99
                                                                                         98
        0
                 2011              2012          2013                  2014          2015
                                          Bus    Train         Ferry

30
Operational Report - Public Transport Authority
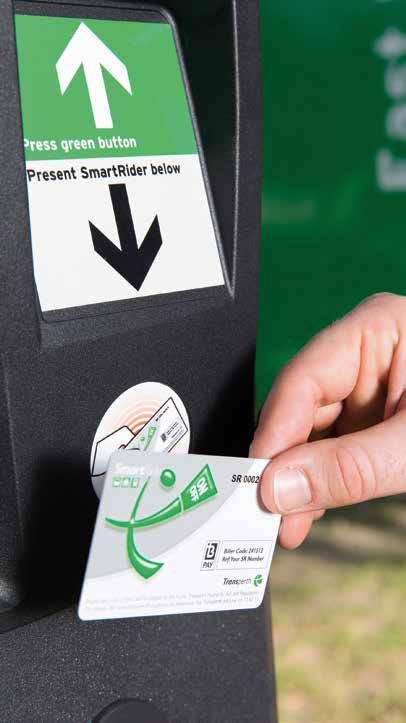
Transperth trains                                                                During the day, the proportion feeling safe on board and at the station/
The 2015 PSM asked train users: Thinking about the issue of personal             interchange was 98 per cent in each case (compared with 98 per cent
safety whilst using the service, that is how safe you feel from personal         and 97 per cent respectively).
interference or threat from other passengers, how safe do you                    The PTA is committed to ensuring that all passengers feel safe at all
generally feel?                                                                  times on the train network. To help achieve this aim, digitised CCTV
The following chart shows the proportion of respondents who “always              footage from all train stations is monitored at the Central Monitoring
or usually feel safe” on the train system.                                       Room, a state‑of‑the‑art facility which is manned 24 hours a day,
                                                                                 seven days a week.
Transperth trains: Customer perception of safety (per cent)
                                                                                 Transperth buses
 100                                                                             Bus users were also asked: Thinking about the issue of personal
                                                                                 safety whilst using the service, that is how safe you feel from personal
  80
                                                                                 interference or threat from other passengers, how safe do you
  60                                                                             generally feel?
  40                                                                             The following chart shows the proportion of respondents who
                                                                                 “always or usually feel safe” on the bus network.
  20
       98
       76
       99
       72

                    99
                    72
                    98
                    68

                                     99
                                     78
                                     98
                                     69

                                                    98
                                                    77
                                                    97
                                                    69

                                                                      98
                                                                      78
                                                                      98
                                                                      72
                                                                                 Transperth buses: Customer perception of safety (per cent)
   0
         2011            2012        2013              2014               2015
                                                                                  100
                  On board (day)     At the station/interchange (day)
                  On board (night)   At the station/interchange (night)            80

                                                                                   60
The proportion of users who said they felt safe on board at night                  40
increased marginally to 78 per cent (from 77), while the proportion
feeling safe at the station/interchange at night increased to 72 per cent          20
                                                                                        99
                                                                                        82
                                                                                        97
                                                                                        73

                                                                                                     99
                                                                                                     79
                                                                                                     97
                                                                                                     72

                                                                                                                      99
                                                                                                                      81
                                                                                                                      97
                                                                                                                      73

                                                                                                                                     99
                                                                                                                                     84
                                                                                                                                     97
                                                                                                                                     75

                                                                                                                                                       99
                                                                                                                                                       82
                                                                                                                                                       97
                                                                                                                                                       71
(from 69).                                                                          0
                                                                                          2011            2012        2013              2014               2015

                                                                                                   On board (day)     At the station/interchange (day)
                                                                                                   On board (night)   At the station/interchange (night)

Public Transport Authority Annual Report 2014-15
                                                                                                                                                                  31
Operational Report - Public Transport Authority
The proportion of bus patrons who felt safe on board and at the            Transperth ferries: Customer perception of safety (per cent)
     station/interchange in 2015 remained unchanged at the 2014 level
     of 99 per cent and 97 per cent respectively. However, the proportion          100
     of passengers who felt safe on board at night fell from 84 per cent in
                                                                                    80
     2014 to 82 per cent, while the proportion who felt safe at the station/
     interchange at night fell to 71 per cent in 2015 (from 75 per cent).           60

     Transperth has extensive security measures in place to address                 40
     concerns about personal safety expressed by passengers who use
                                                                                    20

                                                                                         100

                                                                                         100

                                                                                                                                      100

                                                                                                                                      100

                                                                                                                                                     100

                                                                                                                                                     100
     our buses and facilities at night. CCTV footage from all bus stations is

                                                                                         89

                                                                                         86

                                                                                                     99
                                                                                                     97
                                                                                                     99
                                                                                                     96

                                                                                                                    97
                                                                                                                    92
                                                                                                                    98
                                                                                                                    87

                                                                                                                                      95

                                                                                                                                      93

                                                                                                                                                     92

                                                                                                                                                     86
     monitored by Transperth Security located in the CMR on a 24/7 basis,            0
                                                                                          2011          2012           2013              2014        2015
     and a fleet of 19 patrol cars manned by security officers provide an
     effective response to any incidents of anti-social behaviour.                                      On board (day)        At the jetty (day)
                                                                                                        On board (night)      At the jetty (night)
     Transperth ferries
     Again, ferry passengers were asked: Thinking about the issue of            The 2015 PSM showed that, as in 2014, all ferry passengers felt
     personal safety whilst using the service, that is how safe you feel        safe on board and at the jetty during the day. However, at night,
     from personal interference or threat from other passengers, how            the proportion of users who felt safe on board fell to 92 per cent from
     safe do you generally feel?                                                95 per cent in 2014 and proportion who felt safe at the jetty was down
     The following chart shows the proportion of respondents who                to 86 per cent from 93 per cent.
     “always or usually feel safe” on the ferry service.                        Transwa
                                                                                Transwa continued to provide a very safe service for customers
                                                                                through its commitment to safety systems, procedures and
                                                                                processes. The number of passenger injuries during the year
                                                                                remained very low.

32
CASE STUDY

ANZAC Centenary
This year’s ANZAC Centenary celebrations saw record crowds attend dawn services
around the country, with hundreds of thousands of Australians turning up to pay their
respects to servicemen and women both past and present. Transperth was there to
ensure the public made it safely and efficiently to ANZAC Centenary events. With free
travel across the network on ANZAC Day, along with an increase in services, more than
265,000 passengers used Transperth services during the weekend.

This year marked 100 years since Australian        ‘normal’ passengers going about their
troops landed on the shores of Gallipoli           public holiday business.
and crafted the ANZAC legacy. A record
                                                   Additional train and bus services were
number of Australians attended ANZAC Day
                                                   scheduled, the shuttle bus service to Kings
services across the country and Perth was
                                                   Park was rerouted, and SmartRider and
no exception. An estimated 80,000 people
                                                   ticket machines were reprogrammed to
attended the ANZAC Centenary dawn service
                                                   ensure passengers were not charged for
at Kings Park on April 25.
                                                   their journey.
Long before the sun rose over the sombre
                                                   From very early in the morning (the first train
crowds at dawn services across the city,
                                                   services kicked off at 2.30am), staff were
numerous staff from Transperth and the
                                                   busy ensuring shuttle buses and trains were       “Congratulations on a job well done in
PTA were busy getting tens of thousands of
                                                   able to ferry passengers to the landmark          moving thousands of people efficiently and
people to where they needed to go. With the
                                                   centenary event, and the public had no small      courteously on ANZAC Day,” said passenger
State Government providing free travel for
                                                   amount of praise for their efforts.               Norm Holtzman. “You have really excelled
passengers to mark the anniversary, huge
crowds were expected.                              From letters to the editor in state and local     yourself. I don’t think it could have been any
                                                   newspapers, to numerous tweets, Facebook          better. Your staff were friendly and helpful
Over the course of the Saturday, Transperth                                                          and obviously enthusiastic and wanting to
                                                   posts and CommentLines, Transperth and
moved a massive 110,000 people to and                                                                do a good job, once again, thank you and
                                                   the PTA received resoundingly positive
from ANZAC Day events, around 26,000                                                                 well done.”
                                                   feedback from patrons.
between the football and a further 130,000

Public Transport Authority Annual Report 2014-15
                                                                                                                                                      33
Safety audits                                 yy Transdev was re-certified to AS4801             is measured against other spatial and
                                                      in January 2014 and is current until            scheduling data – in this case PSAs and
     Transperth buses                                 January 2017. Transdev is also                  service timetables.
     Safety audits and monitoring of Transperth       certified as compliant with ISO 14001
                                                                                                      Access to public transport (per cent)
     bus contractors continued in line with           Environmental Management Systems,
     standard AS4801-OSH Management                   valid to January 2017.                          Proportion of property street addresses
                                                                                                      in the Perth Public Transport Area within
     Systems. Each depot was audited at            Transdev’s Central Operations Support              500m of a Transperth stop providing an
     least once, with other documented site        Supervisor was a WA Road Transport Woman           acceptable service level.
     visits throughout the year. These regular     of the Year finalist for her role in a “Targeted
     audits and inspections have generated         Collision” campaign. Between 2012 and
     improved safety management systems                                                                100          84.6    84.7    84.6    85.0
                                                   2014, this campaign reduced the number                    83.8
     and safety focus, and our contractors’        of traffic accidents involving buses from the        80
     LTI rate continues to be well below the       Fremantle depot by about 10 per cent.                60
     industry standard.
     yy Swan Transit was re-certified to AS4801
                                                   Accessing our services                               40

        in March 2015 and is current until         About 85 per cent of Perth homes have                20
        February 2018. This contractor is also     ready access to public transport. This metric
                                                                                                         0
        certified as compliant with ISO 14001      – which has been steady for three years –                 2011   2012    2013    2014    2015
        Environmental Management Systems           reflects the proportion of PSAs (property
        valid to February 2018.                    street addresses) in the Perth public transport
                                                                                                      There were 806,483 PSAs within 500m of an
                                                   area (PPTA) that are within walking distance
     yy Path Transit is in the process of being                                                       ASL stop/station in 2015, up three per cent
                                                   (500m) of a Transperth stop or station
        re-certified to AS4801 with an expected                                                       from 783,270 in 2014, and 9.8 per cent more
                                                   providing an acceptable level of service (ASL).
        completion of August 2015 and is current                                                      than the 734,349 reported in 2011.
                                                   An ASL is defined as a 20-minute or better
        until July 2015. This contractor is also
                                                   service in the peak-flow direction during          Disability access
        certified as compliant with ISO 14001
                                                   the peak, and at least an hourly service           Transperth aims to provide universal access
        Environmental Management Systems
                                                   throughout the core of the day.                    to all its services for the wider community –
        valid to August 2015.
                                                   Transperth uses GPS data to determine              including the elderly, people with disabilities,
                                                   the exact location of all bus stops and            and parents with prams.
                                                   train stations. Access to these facilities

34
Disability Access and Inclusion Plan
The PTA continued to improve access to             yy During the year, seven accessibility bulletins   yy Organisations who participated in the
public transport for people with a disability,        were distributed via email to 25,954                program included the National Stroke
working through the 2012-17 DAIP, which               customers registered with Transperth                Foundation, Goodwill Engineering,
was released in July 2012. During the year,           Accessible Services to advise of system             Independent Living Centre, InclusionWA,
the PTA carried out a review of the DAIP to           changes, upgrades and other Transperth              TAFE, ASeTTS and Communicare.
include Outcome 7, which covers strategies            news relating to accessibility issues.              Education services were also provided to
to promote the employment of people with a         yy Completed the upgrade of Kenwick station.           the key events across the metropolitan
disability in the PTA.                                                                                    area including Abilities Expo, Homeless
                                                   yy Upgrading Transperth bus stops to
                                                                                                          Connect, CarersWA Big Day Out and
Achievements included:                                meet the requirements of the Disability
                                                                                                          Seniors Have-A-Go-Day.
                                                      Standards for Accessible Public Transport
yy Continued implementation of a long‑term
                                                      under the Government’s Bus Stop                  yy Delivered 39 presentations through the
   program to progressively replace the
                                                      Accessibility Works. Since this program             school-based Get On Board program for
   existing Transperth bus fleet with new,
                                                      started in 2010, approximately 3300                 Education Support and Intensive English
   low-floor, accessible buses – at June 30,
                                                      upgrades have been completed. Of these,             Centres. In addition, 83 tailored Get On
   90.3 per cent of our metro fleet (1291
                                                      80 bus stops were upgraded in the                   Board programs were delivered to seniors
   of 1430 buses) and 81 per cent
                                                      regional network over the past two years.           and culturally and linguistically diverse
   of our regional buses (112 of 138)
                                                                                                          (CaLD) groups.
   were accessible.                                yy Formation of Perth Busport Accessibility
                                                      and Inclusion Reference Group.                   yy Translating and Interpreting Service
yy Continued recognition of companion
                                                                                                          (TIS) - call count for InfoCentres and
   cards to allow a companion to travel with       yy The Transperth education team continued
                                                                                                          the CallCentre was 148 (July 2014 –
   a person with a permanent disability at no         to work closely with local government,
                                                                                                          May 2015).
   additional cost.                                   community organisations and colleges to
                                                      provide training on-site and at stations to      yy Active participation as a member of the
yy Managing accessibility groups via
                                                      equip staff and clients with the skills and         National Accessible Public Transport
   My Alert emails (formerly TravelEasy) as a
                                                      knowledge necessary to become safe and              Advisory Committee and Accessible Public
   mechanism to disseminate accessibility-
                                                      confident public transport users.                   Transport Jurisdictional Committee.
   specific updates to relevant organisations.

Public Transport Authority Annual Report 2014-15
                                                                                                                                                      35
Buses                                           In three contract areas, accessible buses
                                 Transperth continued its long-term program      were used for more than 90 per cent of
                                 to increase the number of accessible            service trips: Marmion (98.7 per cent),
                                 buses in its fleet. During the year, 113 new    Claremont (98.5 per cent), and Southern
                                                                                 River (91.6 per cent). On Perth CAT
     During the year,            buses were added, increasing the number
                                                                                 services, 97 per cent of the trips were by

     113
                                 of accessible buses to 1291 out of the
                                 total fleet of 1430 at June 30, 2015            accessible buses, while on CAT services
                                 (90.3 per cent). At June 30, 2014 accessible    in Fremantle and Joondalup and on the
                                 buses accounted for 87 per cent of the fleet.   Midland Shuttle, accessible buses were
                                                                                 used on all trips.
     new accessible buses        Transperth’s accessible fleet has expanded
                                 by 43 per cent since 2011.                      Between 2010-11 and 2014-15, while the
     were added to the
                                 Preference is given to operating accessible     number of service trips increased by
     Transperth fleet            buses whenever possible and they are used       27.6 per cent, trips by accessible buses
                                 on most off-peak services. In the peak, both    went up 85 per cent and the proportion
                                 accessible and non-accessible buses are         of service trips operated by accessible
                                 fully committed.                                buses rose 45 per cent. Trip numbers are
                                                                                 reported as at June 30.
                                 The proportion of service trips operated by
                                                                                 The PTA also has a responsibility to

              625
                                 accessible buses has increased significantly
                                 over the past five years. In 2014-15, out of    ensure that bus fleets in regional towns
                                 4.663 million service trips during the year,    meet Federal accessibility requirements.
     and over                    3.191m trips (68.4 per cent) were operated      To meet this responsibility, the PTA
     bus stops were upgraded     by accessible buses compared with               progressively transfers low-floor diesel
                                                                                 buses from the Transperth fleet to the
     to meet Federal Disbility   65 per cent of trips in 2013-14.
                                                                                 regional fleet.
     Standards

36
Transperth continued its Bus Stop                  The environment                                    yy Continued implementation of the energy
Accessibility Works Program (BSAWP) during                                                               efficiency measures identified as part of the
2014-15 with more than 625 bus stops being         The PTA continues to work to identify                 energy assessment of the Public Transport
upgraded to meet the requirements of the           opportunities to maximise sustainability during       Centre, including the installation of LED
Federal Disability Standards for Accessible        the development and planning of transport             lights which resulted in a downward trend
Public Transport. In 2013-14, 610 bus stops        services. In the latest year this included:           in energy use during 2014-15.
were upgraded.                                     yy Development of a Sustainability Position        yy Audited Downer Bombardier (the PTA’s
Upgrades typically involve the construction           Statement for the Forrestfield-Airport             railcar maintainer) to ensure environmental
of a concrete passenger boarding area at              Link project.                                      compliance at the PTA’s Claisebrook,
correct kerb height, installation of tactile       yy The Forrestfield-Airport Link project has          Nowergup and Mandurah depots.
ground surface indicators and a short                 adopted the Infrastructure Sustainability       yy Completed and implemented the PTA’s
connection to the existing local footpath             Council of Australia (ISCA) rating scheme          Environmental Management Systems
network. Since the program was introduced             for evaluating sustainability and driving          (EMS) manual to support the PTA in
in January 2010, more than 3300 bus stops             sustainability performance across all              achieving legal compliance, controlling
have been upgraded.                                   stages of the project.                             risks for operations and capital works,
                                                   yy Integration of infrastructure for pedestrians      and encouraging continuous improvement
Ferries                                               and cyclists.                                      in its environmental performance.
Transperth ferry services are provided by          yy Protection and restoration of air, water,       yy Developed online training for the PTA’s
two accessible ferries, MV Phillip Pendal                                                                EMS manual for staff.
                                                      soils, flora and fauna.
and MV Shelley Taylor-Smith.                                                                          yy Took delivery of 13 new articulated
                                                   yy Improving the energy efficiency of the
The Barrack Street Jetty in Perth meets                                                                  buses which comply with Euro 6 exhaust
                                                      Public Transport Centre.
the Federal accessibility standard.                                                                      emission standards.
                                                   During the year, the PTA:
Although the Mends Street Jetty in
South Perth is accessible for people in            yy Continued to implement the PTA water
wheelchairs, planning is in progress for the          efficiency management plan.
future construction of a new jetty to meet         yy Continued using recycled water and
all accessibility standards and provide               reverse osmosis to wash railcars.
improved facilities, subject to funding
being made available.

Public Transport Authority Annual Report 2014-15
                                                                                                                                                         37
yy Launched the Get On Board program
                                                                                                    dedicated website for students,
                                                                                                    teachers and parents to encourage
                                                                                                    better education of public transport
                                                                                                    amongst these groups.
                                                                                                 yy Continued to improve signage at a
                                                                                                    number of bus and train stations as part
                                                                                                    of a system-wide upgrade. The new
                                                                                                    signage improves visibility of key
                                                                                                    components of infrastructure, such as
                                                                                                    lifts, to make them easier to identify for
                                                                                                    those who need to use them.
                                                                                                 yy Continued to provide service disruption
                                                                                                    information to passengers across all
                                                                                                    modes of public transport.
                                                                                                 yy Delivered service change information to
     Communicating with our customers                                                               passengers following the continued roll
                                                                                                    out of additional bus service kilometres.
     In 2014-15, the Transperth Information and       including the Albany Commemoration in
                                                                                                 yy Continued to deliver Get On Board
     Event Services team successfully undertook a     October 2014 and the Kings Park Dawn
                                                                                                    program presentations to a broad range
     wide range of initiatives:                       Service in April 2015.
                                                                                                    of community groups.
     yy Communicated the opening and new            yy Launched the Access All Areas
                                                                                                 yy Continued to work with major event
        timetable for Butler Station.                  event guide poster in trains aimed at
                                                                                                    organisers to ensure the provision
                                                       encouraging use of public transport to
     yy Successfully launched the Show Your                                                         of special events and promote
                                                       special events in the Perth metro area.
        Good Side portrait series – a new                                                           integrated ticketing.
        behavioural campaign encouraging            yy Successfully launched a track closures
        passengers to consider others and be           campaign to educate passengers on how
        mindful of their actions.                      to stay informed of upcoming works and
                                                       how to keep moving through disruptions.
     yy Coordinated the transport requirements
        for ANZAC Centenary commemorations

38
CASE STUDY

Passenger Satisfaction Monitor – our best ever results
The PTA’s annual Passenger Satisfaction Monitor is Australia’s biggest and longest-
running public transport passenger survey. After extensive interviews of 4300 regular
Transperth passengers, the 2015 survey has revealed our best-ever results, with all-time
high levels of satisfaction across all transport modes.

Findings from the 2015 PSM displayed multiple      At a glance, below are some of the other
all-time best results compared to previous         outstanding results from the PSM:
years, revealing that nine in 10 passengers are
                                                   yy 92 per cent satisfaction from train
overall satisfied with our services.
                                                      passengers (91 per cent in peak hour and
The PSM survey, which measures performance            93 per cent during off-peak)
indicators of satisfaction across the Transperth   yy 86 per cent satisfaction from bus
network, is one of the most extensive and             passengers
in-depth public transport passenger surveys
                                                   yy Up to 97 per cent satisfaction from CAT
in Australia and we’ve been conducting it for
                                                      bus passengers
more than 24 years.
                                                   yy Fremantle CAT won the highest satisfaction
This year’s survey spoke to 4300 people,              rating from passengers at 97 per cent
covering all demographics of regular
                                                   yy The 950 Superbus remains the highest
passengers across the entire network.
                                                      performing non-CAT service since its
From this sample, high satisfaction results
                                                      introduction last year with a 94 per cent
were received from around 90 per cent of
                                                      satisfaction rating
customers who said they are happy with
the overall level of Transperth train, bus and     yy 99 per cent of users are satisfied with the
ferry services.                                       cashless SmartRider ticketing system

A stand-out achievement from the 2015              The results provide a holistic look at how our
PSM was the Transperth ferry system,               passengers feel about our services so that
which reached 100 per cent overall                 we can continue what we are doing right and
satisfaction for the first time.                   identify the areas we can improve on, to deliver
                                                   exceptional services into the future.

Public Transport Authority Annual Report 2014-15
                                                                                                      39
2.2 Performance report
                                   2.2.1 Metro                                       Fleet
                                   Transperth is the brand and operating             TTO operates an electrified suburban train
                                   name of the public transport system in            system with more than 1045 services on
                                   the greater metropolitan area of Perth.           an average weekday and more than 6645
     TTO operates an electrified                                                     services weekly. At June 30, TTO operated
                                   The Transperth system consists of a bus
     suburban train system with                                                      a fleet of 267 railcars which can be coupled
                                   network, a fully-electrified urban train system
                                                                                     in configurations of two, three, four or
                                   and a ferry service. It is managed by the
                                                                                     six‑car trains.
                                   Transperth branch of the Transperth System,
                                   Regional and School Bus Services division         The system covers 180.8km of track with
                                                                                     70 stations on five lines. The network

               1045
                                   and covers key functions such as system
                                   planning, bus service delivery, bus service       consists of the Joondalup Line (40.9km),
     more than                     security, passenger information services,         the Fremantle Line (19km), the Midland Line
     services on an average        ticketing, and bus fleet procurement.             (16km), the Armadale/Thornlie Line (30.5km
                                                                                     and a 3km spur line to Thornlie), and the
     weekday and more than         Transperth bus and ferry services are             Mandurah Line (71.4km).

     6645 services weekly
                                   provided under commercial contract
                                                                                     At June 30, the 1430-vehicle Transperth
                                   arrangements; train services are provided
                                                                                     bus fleet (up 5.6 per cent) was made up
                                   by PTA’s Transperth Train Operations
                                                                                     of 885 diesel buses (including 440 buses
                                   (TTO) division under an internal service
                                                                                     delivered under the current Volvo contract)
                                   level agreement.
                                                                                     and 545 CNG buses.
                                   Passenger information comprising
                                                                                     Of these, 13 buses (one per cent of the fleet)
                                   InfoCentre, InfoLine and customer
                                                                                     conform to the Euro 6 emissions standard,
                                   feedback services are provided under
                                                                                     447 buses (31.3 per cent) conform to
                                   contract by Serco.
                                                                                     the Euro 5 standard and 498 buses
                                                                                     (34.8 per cent) meet the Euro 4 standard.
                                                                                     The 440 new Volvo buses in the fleet meet
                                                                                     the Euro 5 EEV (enhanced environmentally
                                                                                     friendly vehicle) standard.

40
The Volvo contract will deliver 820 new                   Under the new summer timetable, the ferry service
diesel buses over an eight-year period.
                                                          operated an average of
In 2014-15, the Transperth bus system

                                                                                             600
operated 315 standard timetabled
bus routes, 296 school routes, and
nine CAT routes. On a typical weekday
                                                                                                            trips per week
this involved operating 14,914 standard
service trips, 296 school service trips
and 957 CAT service trips. Accessible              Two ferries (MV Phillip Pendal and               The timetable change resulted in an
buses were always used on 205 routes,              MV Shelley Taylor-Smith) operate the             increase in the number of service kilometres
which included nine CAT routes and                 Transperth ferry service between the             operated by the ferry service.
36 school routes. A bus service frequency          city (Barrack Street) and South Perth
                                                                                                    We also continued with the implementation
of 15 minutes or better is provided all            (Mends Street). The service is operated
                                                                                                    of the bus service expansion program
day on most major corridors, with higher           under contract by Captain Cook Cruises.
                                                                                                    which began in 2011-12, with service
frequencies in peak periods.                       The ferry timetables were changed with           improvements prioritised as follows:
The Transperth bus service network is              effect from June 1, 2014. The new summer
                                                                                                    yy Services which cannot pick up
divided into 11 geographic contract areas          timetable runs from October to May
                                                                                                       passengers due to overloading.
which are periodically subject to competitive      (previously September to April) and the winter
                                                   timetable from June to September (previously     yy Transport corridors we identified as
tender. At June 30, three contractors                                                                  providing access between key primary
operated Transperth bus services:                  May to August).
                                                                                                       and secondary centres to help achieve
yy Path Transit – Kalamunda, Morley.               Under the new summer timetable, the ferry           planned land-use outcomes proposed
                                                   service operated 92 trips a day Monday to           by the Department of Planning in
yy Swan Transit – Canning, Claremont,
                                                   Thursday and 100 trips on Friday (previously        Directions 2031.
   Marmion, Midland (including Midland
                                                   80 and 88 trips), 74 trips on a Saturday
   shuttle), and Southern River.                                                                    yy New urban areas developing on the
                                                   and 58 trips on a Sunday/public holiday.
yy Transdev – Fremantle (including                                                                     fringes of the metropolitan area.
                                                   There was no change to the number of trips
   Fremantle CAT), Joondalup (including            operated during the winter, 60 trips a day
   Joondalup CAT), Rockingham-                     Monday to Friday and 54 trips a day on
   Mandurah, and the Perth CAT contract.           weekends and public holidays.

Public Transport Authority Annual Report 2014-15
                                                                                                                                                   41
“The Transperth
                                                                                                       yy Facilitated a series of operational and
                                                                  system consists                         timetable changes.
                                                                  of a bus network,                    yy Planned for and provided safe and reliable
                                                                  a fully‑electrified                     rail services for all special events including
                                                                                                          the ANZAC Centenary Day.
                                                                  urban train                          yy Continued recruiting and training of staff
                                                                  system and a                            for the provision of safe, reliable and
                                                                                                          customer-focussed services.
                                                                  ferry service.”
                                                                                                       yy Prepared and evaluated the Expression of
                                                                                                          Interest for the supply of 300 new state-of-
                                                                                                          the-art C-Series railcars (50, six-car trains)
                                                                                                          over a ten-year period.
     The bus service expansion program added         Service extensions and improvements               yy Continued planning for the installation
     2.201 million service kilometres during the     included:                                            of the pantograph Automatic Dropping
     year to deliver a total of 65.531m kilometres                                                        Device, an overreach and platform
                                                     yy Improved frequencies on key corridors,            detection system on railcars, all of which
     in 2014-15, up 3.5 per cent from
                                                        including Alexander Drive, Albany Highway         promote safety of passengers and
     63.329m kilometres in 2013-14. This followed
                                                        and Canning Highway.                              protects railway assets.
     increases of 4.2 per cent in 2013-14,
     4.6 per cent in 2012-13 and 8.5 per cent        yy Extension of Route 100 from Curtin             yy Commenced planning for the opening
     in 2011-12.                                        University to Cannington station.                 of the new Aubin Grove Station on the
                                                     There were also a number of significant new          Mandurah Line.
     New service routes introduced during the
     year included:                                  developments during the year:                     yy Contributed to the Burswood Stadium
                                                     yy The PTA took delivery of a further                and Forrestfield-Airport Link projects and
     yy Route 406 between Glendalough                                                                     related works.
        Station and Edith Cowan University in           24 railcars (eight, three-car trains) of the
        Mount Lawley.                                   66 B-Series railcars on order. In total,
                                                        33 new railcars (11, three-car trains) were
     yy Route 491 between Butler Station
                                                        in service during the year.
        and Yanchep.
                                                     yy Commenced operation of services to the
     yy Route 565 between Warnbro Station
                                                        new Butler Station on the Joondalup Line.
        and Baldivis.

42
CASE STUDY

Euro 6 buses for a greener future
Once again, Transperth has embraced newer and greener
technology, with the introduction of 70 new Volvo Euro 6
articulated buses to our fleet. A $58.5 million investment by the
State Government will see the world’s cleanest diesel buses
introduced over five years, replacing some of the fleet’s oldest
buses and placing Western Australia at the forefront of clean
public transport. The first of the Euro 6 buses was officially
handed over to the PTA in early 2015 after extensive testing
and optimisation in both Sweden and Perth.

This year Transperth was at the forefront of introducing
environmentally-friendly technology to the streets of Perth, with the
introduction of the new Volvo Euro 6 bus.
The Euro 6 vehicles are the world’s cleanest diesel buses.
Seventy new Euro 6 articulated buses will be introduced over
five years, thanks to an investment of $58.5 million by the
State Government.
In a boost for local jobs, the Euro 6 vehicle bodies will be
assembled by local company Volgren, allowing for the employment
of 15 additional staff at Volgren’s Malaga facility.                                                                                      Volvo Bus Australia
Currently the Australian Capital Territory is the only other state or
territory to have Euro 6 buses.
The articulated buses can each carry more than 100 passengers
and will be used on Perth’s busiest bus routes, for major events, and    “We are really excited to start using Volvo’s latest technology in Perth
as rail replacement services for planned disruptions. The new buses      and even more excited to have a world-class articulated option
are roomy and fully air-conditioned, with low-floor step-less entry to   back in our local product line,” Volvo Bus Australia General Manager
allow wheelchair accessibility.                                          Sean Copeland said.

Public Transport Authority Annual Report 2014-15
                                                                                                                                                            43
Network patronage                                   The main features of Transperth patronage in      yy Fare-paying boardings also continued
                                                         2014-15 were:                                        to fall, by 1.5 per cent to 81.188m in
     Patronage by mode is reported in four                                                                    2014‑15 following the 2.6 per cent decline
     categories:                                         yy Total boardings which fell 1.4 per cent
                                                                                                              to 82.426m in 2013-14. The two previous
                                                            in 2013-14 recovered in 2014-15 to
     yy Fare-paying boardings – cash and                                                                      years recorded increases of 4.1 per cent in
                                                            record a small 0.8 per cent increase
        paid SmartRider boardings plus special                                                                2012-13 and seven per cent in 2011-12.
                                                            to 148.762 million from 147.641m in
        event boardings.                                    2013‑14. However, in the two previous          yy Free travel by seniors, aged/disability
     yy Cash and SmartRider initial                         years significantly higher growth rates           pensioners, and carers continued to
        boardings – fare-paying boardings plus              were achieved, 3.9 per cent in 2012-13            increase and accounted for 9.110m
        free travel on SmartRider*.                         and six per cent in 2011-12.                      total boardings in 2014-15, up 6.6
                                                                                                              per cent from 8.545m in 2013-14.
     yy Total initial boardings – cash and               yy Total initial boardings also recovered, with
                                                                                                              Initial boardings were 5.388m in 2014-15,
        SmartRider initial boardings plus free              an increase of 0.8 per cent in 2014-15 to
                                                                                                              up three per cent from 5.230m.
        travel on Free Transit Zone (FTZ) services,         104.234m from 103.437m in 2013-14.
        on CAT services in Perth, Fremantle and             The 2013-14 result represented a decline       Factors contributing to the continuing decline
        Joondalup, and on the Midland Shuttle               of 1.2 per cent over 2012-13, a year which     of fare-paying boardings on the Transperth
        service.                                            saw growth of 3.7 per cent following an        system were:
                                                            increase of 5.1 per cent in 2011-12.
     yy Total boardings – total initial boardings                                                          yy Increased unemployment which impacts
                                                         yy The decline in cash and SmartRider                adversely on commuter traffic.
        plus transfer boardings.
                                                            initial boardings continued for a second
                                                                                                           yy Slowing of the rate of growth in
     *Free travel on SmartRider refers to travel by         year in succession, falling 1.2 per cent
                                                                                                              population, particularly the significant drop
     WA seniors, aged and disability pensioners,            to 86.759m in 2014-15 following the
                                                                                                              in interstate migration resulting from the
     and carers on weekdays from 9am to 3.30pm              2.4 per cent fall in 2013-14 to 87.829m.
                                                                                                              reduction in mining investment.
     and all day on weekends and public holidays.           In contrast, growth rates of 4.2 per cent
     It also includes all day free travel by veterans.      and 6.9 per cent were achieved in              yy Cost of living pressures impacting largely
                                                            2012‑13 and 2011-12 respectively.                 on discretionary travel.
                                                                                                           yy Relatively low fuel prices making driving
                                                                                                              more attractive to commuters than using
                                                                                                              public transport.

44
Despite the unfavourable results in 2014-15,       Following the abolition of the carbon tax in    The Giants event
patronage on the Transperth system has             July 2014, the PTA was required to return       In February 2015, Transperth successfully met
increased over the five years since 2010-11;       to patrons the additional revenue Transperth    an unprecedented demand for its services for
total boardings by 9.4 per cent, cash and          received through the higher fares. It was       The Giants, a popular feature of the 2015 Perth
SmartRider initial boardings by 7.4 per cent       decided to meet this requirement partly         International Arts Festival.
and fare-paying boardings by 6.9 per cent.         by providing a day’s free travel on all
                                                                                                   During the three-day event (February 13-15,
                                                   Transperth bus, train and ferry services
On a per capita basis, public transport                                                            2015), estimated patronage on Transperth
                                                   to return $0.68m, and partly through a
usage within the Perth metropolitan area                                                           bus, train and ferry services was 1.748m total
                                                   revised fares schedule which came into
(including the City of Mandurah) was                                                               boardings, based on recorded boardings,
                                                   effect on November 1, 2014 to cover the
52.2 initial boardings compared with                                                               passenger counts using CCTV, and
                                                   balance $1.375m.
53.4 in 2013-14, down 2.2 per cent.                                                                staff monitoring.
The decline in per capita usage reflects           Free travel for one day was provided on
                                                                                                   Patronage specific to The Giants event was
the fall in patronage combined with an             November 3, 2014 and was estimated to
                                                                                                   estimated at 1.085m – the highest ever for a
increase in population albeit at a lower rate      have resulted in 503,000 total boardings.
                                                                                                   special event – comprising 522,000 recorded
than previously.                                   The boardings estimate was based on
                                                                                                   boardings (242,000 on bus, 276,000 on train,
                                                   recorded boardings on a similar day
Free travel on special occasions                                                                   and 4000 on ferry) and an estimated 563,000
                                                   (i.e. a Monday with both schools and
                                                                                                   unrecorded boardings (bus 94,000, train
Free travel to compensate for the                  tertiary institutions in session).
                                                                                                   457,000 and ferry 12,000).
carbon tax-related fare increase
                                                   Free travel on ANZAC Day                        Boardings were not recorded because
The carbon tax, introduced in 2012, added
                                                   The ANZAC Centenary Day was declared            Transperth, for operational and safety reasons
approximately $2 million to Transperth
                                                   a free travel day on all Transperth services.   due to the pressure of the large crowds,
operating costs. This extra cost was passed
                                                   Normal boardings for the day were               allowed passengers at particular locations to
on to public transport users by adding an
                                                   estimated based on data from Sunday April       travel without having to purchase a ticket or tag
extra 1.5 percentage points to the projected
                                                   26, 2015. System-wide, event-specific total     on their SmartRider.
increase in CPI of 2.8 per cent applied to
                                                   boardings were estimated at 110,000.            Free travel on November 3, 2014, estimated
the new fares schedule that came into effect
on July 1, 2012.                                                                                   event-specific free boardings on the ANZAC
                                                                                                   Centenary Day, and estimated unrecorded
                                                                                                   boardings during The Giants event (February
                                                                                                   13-15, 2015) have been reported as “free travel
                                                                                                   on special occasions” and form part of total
                                                                                                   boardings on each mode.
Public Transport Authority Annual Report 2014-15
                                                                                                                                                       45
Transperth: Patronage (millions)                                                         Buses
                                                                                              Total boardings on Transperth buses continued to increase but the
      150
                                                                                              rates of increase in the last two years have been significantly below
      120                                                                                     the rates achieved in the past. In 2014-15, total boardings rose to
       90                                                                                     84.143m from 83.714m in 2013-14, up 0.5 per cent, a marginal
                                                                                              improvement on an increase of 0.2 per cent in 2013-14.
       60
                                                                                              Transperth buses: Patronage (millions)
              135.975

                                100.991
                                144.130

                                                    104.713
                                                    149.697

                                                                  103.437
                                                                  147.641

                                                                                   104.234
                                                                                   148.762
              75.929
              80.817
              96.051

                                81.262
                                86.393

                                                    84.597
                                                    90.007

                                                                  82.426
                                                                  87.829

                                                                                   81.188
                                                                                   86.759
       30

        0
                2010-11            2011-12          2012-13        2013-14         2014-15      100

                          Fare-paying boardings       Cash and SmartRider initial boardings      80
                          Total initial boardings     Total boardings
                                                                                                 60

     Passenger place kilometres represent the carrying capacity of the                           40

                                                                                                      39.422
                                                                                                               42.590
                                                                                                                        76.636

                                                                                                                                 42.360
                                                                                                                                          45.703
                                                                                                                                                   80.626

                                                                                                                                                            43.945
                                                                                                                                                                     47.489
                                                                                                                                                                              83.543

                                                                                                                                                                                       43.394
                                                                                                                                                                                                46.903
                                                                                                                                                                                                         83.714

                                                                                                                                                                                                                  42.648
                                                                                                                                                                                                                           46.192
                                                                                                                                                                                                                                    84.143
     Transperth bus, train and ferry network. This metric is based on                            20
     service kilometres and the average capacity of the fleet, and has been
                                                                                                  0
     increasing steadily in recent years as new buses and trains come on                                 2010-11                    2011-12                    2012-13                   2013-14                    2014-15
     stream and our networks expand.
                                                                                                   Fare-paying boardings                           Cash and SmartRider initial boardings                           Total boardings
     Transperth: Passenger place kilometres (millions)

        15,000                                                                     13,717.6
                                                      12,382.9     12,853.7
                                      11,552.2
        12,000      10,579.9

            9,000

            6,000

            3,000

               0
                    2010-11           2011-12         2012-13       2013-14        2014-15

46
Total boardings by contract area were:                        Average boardings on the bus system continued to fall due to the fact
                                                              that, since 2011-12, bus service kilometres increased at higher rates
 Contract area               2013-14       2014-15   Change   than boardings. Furthermore, in the case of cash and SmartRider
 Kalamunda                    7.580m        7.261m    -4.2%   initial boardings, a decline was recorded in 2013-14 and 2014-15.
 Morley                      11.399m      11.379m     -0.2%   Road congestion, particularly in peak periods, and the lack of
 Canning                      8.399m        8.416m     0.2%   significant bus priority measures on major roads in Perth, impacts on
                                                              service reliability and may have affected patronage on Transperth
 Claremont                    4.373m        4.320m    -1.2%
                                                              bus services.
 Marmion                      7.629m        7.510m    -1.6%
                                                              To address this, the PTA’s Bus Priority Program completed a number
 Midland                      2.409m        2.445m     1.5%
                                                              of initiatives in 2014-15 including:
 Southern River               3.918m        3.944m     0.7%
                                                              yy The construction of a left-only turning lane into Hay Street from
 Fremantle                    9.551m        9.412m    -1.5%
                                                                 William Street to improve north-bound traffic flows previously
 Joondalup                    7.171m        7.096m    -1.0%      interfering with bus movements.
 Rockingham                   6.146m        6.155m     0.1%   yy Construction of a roundabout on Hospital Avenue at QE2 Medical
                                                                 Centre to facilitate faster turning of the high frequency 950 service.
                                                              yy Construction of a bus priority turning lane at Albany Highway
                                                                 and Nicholson Road to allow buses to bypass significant
                                                                 traffic congestion.
                                                              yy Completion of the Cockburn Link bus access tunnel, connecting
                                                                 Cockburn Central Station and Gateways Shopping Centre via a
                                                                 dedicated bus road.

           84.143 million
           total boardings on Transperth
           buses in 2014-15

Public Transport Authority Annual Report 2014-15
                                                                                                                                          47
Trains                                                                                                                                             The decrease in boardings combined with the increase in service
     Total boardings on our trains recorded a small 1.2 per cent increase in                                                                            kilometres resulted in average boardings recording a significant
     2014-15 to 64.2m, following the 3.3 per cent decline in 2013-14.                                                                                   decline. Total boardings per service kilometre fell five per cent, to
                                                                                                                                                        3.622 in 2014-15 from 3.814 in 2013-14. The cash and SmartRider
     Transperth trains: Patronage (millions)                                                                                                            initial boardings number was down 6.8 per cent at 2.273.

        75                                                                                                                                              Ferries
        60                                                                                                                                              The ferry service represents only a very small proportion of Transperth
                                                                                                                                                        system patronage (less than 0.5 per cent). Fluctuations in the tourism
        45
                                                                                                                                                        market have a significant impact on ferry boardings with tourists
        30                                                                                                                                              accounting for about half.
                36.182
                         37.884
                                  58.868

                                           38.584
                                                    40.355
                                                             63.030

                                                                       40.337
                                                                                42.184
                                                                                         65.689

                                                                                                  38.740
                                                                                                           40.615
                                                                                                                    63.492

                                                                                                                             38.287
                                                                                                                                      40.294
                                                                                                                                               64.225
        15                                                                                                                                              Transperth ferries: Patronage (millions)
         0
                   2010-11                    2011-12                     2012-13                   2013-14                    2014-15                    0.5
             Fare-paying boardings                           Cash and SmartRider initial boardings                            Total boardings             0.4

                                                                                                                                                          0.3
     Cash and SmartRider initial boardings (including free travel on
     SmartRider but excluding free train travel within the FTZ) fell                                                                                      0.2

     0.8 per cent and fare-paying boardings fell 1.2 per cent.

                                                                                                                                                                   0.324
                                                                                                                                                                           0.342
                                                                                                                                                                                   0.471

                                                                                                                                                                                           0.317
                                                                                                                                                                                                   0.335
                                                                                                                                                                                                           0.474

                                                                                                                                                                                                                   0.314
                                                                                                                                                                                                                           0.333
                                                                                                                                                                                                                                   0.465

                                                                                                                                                                                                                                           0.292
                                                                                                                                                                                                                                                   0.310
                                                                                                                                                                                                                                                           0.435

                                                                                                                                                                                                                                                                   0.252
                                                                                                                                                                                                                                                                           0.273
                                                                                                                                                                                                                                                                                   0.394
                                                                                                                                                          0.1

     Total boardings by line were:                                                                                                                        0.0
                                                                                                                                                                     2010-11                 2011-12                  2012-13                2013-14                 2014-15
      Line                                                            2013-14                     2014-15                      Change
                                                                                                                                                                Fare-paying boardings                      Cash and SmartRider initial boardings                   Total boardings
      Armadale Line                                                    9.176m                      9.067m                              -1.2%
      Fremantle Line                                                   8.285m                      8.228m                              -0.7%            In 2014-15, total boardings on ferry fell by 9.3 per cent to
      Joondalup Line                                                  16.897m                     17.106m                                1.2%           0.394 million from 0.435m in 2013-14. Cash and SmartRider initial
      Mandurah Line                                                   20.664m                     20.700m                                0.2%           boardings fell 12.1 per cent to 0.273m from 0.310m and fare‑paying
                                                                                                                                                        boardings were down 13.5 per cent to 0.252m from 0.292m.
      Midland Line                                                     6.646m                      6.661m                                0.2%

48
Total boardings per service kilometre fell 12.7 per cent to 10.468 from   Transperth: OTR by mode
11.995 in 2013-14, while cash and SmartRider initial boardings fell       Proportion of services meeting on-time targets
15.4 per cent to 7.244 from 8.563.
                                                                          100
Capacity
                                                                           80
Total capacity provided on the Transperth system increased by
                                                                           60
6.7 per cent in 2014-15, following a 3.8 per cent increase in 2013-14.
                                                                           40
During 2014-15, the train network operated 17.73 million service
kilometres, up 6.5 per cent from 16.648m service kilometres                20

                                                                                85.1
                                                                                       95.7
                                                                                              99.2

                                                                                                     79.1
                                                                                                            94.6
                                                                                                                   96.7

                                                                                                                           75.1
                                                                                                                                  93.0
                                                                                                                                          84.7

                                                                                                                                                   81.2
                                                                                                                                                          94.9
                                                                                                                                                                 97.8

                                                                                                                                                                        80.2
                                                                                                                                                                               95.0
                                                                                                                                                                                      92.0
in 2013‑14.
                                                                            0
                                                                                  2010-11              2011-12              2012-13                  2013-14             2014-15
Total capacity provided on the train network increased 8.5 per cent
to 8544.7m passenger place kilometres in 2014-15 from 7878.1m                                                        Bus          Train          Ferry
in 2013-14.
The increase in both service kilometres and passenger place               Transperth trains
kilometres resulted from the delivery of additional B-Series railcars,
                                                                          The service reliability target for Transperth trains is for 95 per cent of
allowing for more six-car trains being brought into service during
                                                                          services to arrive within four minutes of the scheduled time.
the year in addition to the extension of the Joondalup Line to
Butler Station.                                                           In 2014-15, on average, 95 per cent of train services met the target,
                                                                          up from 94.9 per cent in 2013-14.
Reliability                                                               Transperth buses
Transperth uses technology-based monitoring methods which allow           The service reliability target for Transperth buses is for 80 per cent of
precise data-gathering to measure on-time running (OTR). On its bus       services to arrive at timing point within four minutes of the scheduled
and ferry services, OTR is measured using GPS information functions       time, and never leave a terminus, or travel through a mid-way timing
in SmartRider, while the train control system is used to measure          point early.
train OTR.

Public Transport Authority Annual Report 2014-15
                                                                                                                                                                                             49
Reliability is monitored through a random        Maintenance                                         This is achieved through regular cleaning and
     sample of one per cent of trips in each bus                                                          periodic large maintenance items such as
     contract area using the GPS information          The Network and Infrastructure (N&I) division       high-pressure water cleaning and painting.
     functions in SmartRider which provides           is responsible for the asset management
                                                      of the urban passenger rail network, the            Most of the work undertaken by the PTA
     an accurate assessment of bus on-time
                                                      asset management of the country stations,           in this area remains unseen by the public.
     performance. The one per cent sample is
                                                      the asset investment program (with the              However, the impact on our customers if the
     substantial given that there are more than
                                                      exception of major projects) and the delivery       infrastructure fails is significant, so therefore
     14,900 bus trips on a typical weekday.
                                                      of information technology services.                 remains a key focus.
     GPS information functions help to identify
     under-performing services which, after           N&I has a service level agreement with
     a careful review, can be re‑scheduled to
                                                                                                          Upgrades
                                                      TTO which details its responsibility for
     ensure improved performance.                     the provision and maintenance of the                yy A program to improve the reliability and
                                                      infrastructure required to operate train               disability access of lifts and escalators is
     In 2014-15, bus services in the CBD were
                                                      services reliably, efficiently and safely.             continuing. Lifts at Warwick, Whitfords,
     adversely affected by major works resulting in
                                                                                                             Stirling and Joondalup stations have
     OTR on Transperth buses falling 1.2 per cent     Most of the division’s resources are
                                                                                                             been completed along with escalators at
     to 80.2 per cent compared with a significant     allocated to maintenance, both planned
                                                                                                             Warwick, Joondalup and one at Whitfords.
     8.2 per cent improvement to 81.2 per cent        and breakdown. Routine maintenance is
     in 2013-14.                                      planned carefully to ensure the infrastructure      yy An upgrade to security access systems
                                                      is safe and highly reliable. This ensures that         to the bike shelters was completed in
     Transperth ferries                               our customers continue to enjoy a safe                 April 2015. This new system will increase
     The service reliability target for the ferry     and dependable train service. The division             security with ingress and egress to the
     service is for 98 per cent of services to        also deploys its resources to ensure a rapid           bike shelters, with patrons required to
     arrive within three minutes of the scheduled     response to any infrastructure faults to               register onto the system.
     time. On average, 92 per cent of services        minimise delays and customer impact.                yy The new City West substation at
     met the target in 2014-15 compared with                                                                 Sutherland Street was delivered into
                                                      The rail network’s 70 urban stations and
     97.8 per cent in 2013-14. This decrease                                                                 service in April 2015. This new substation
                                                      29 country stations are highly visible
     of 5.8 per cent is attributable to ongoing                                                              provides increased traction power supply
                                                      infrastructure assets. As well as ensuring that
     construction works associated with the                                                                  resilience, and improved flexibility for track
                                                      all station facilities are reliable, considerable
     development of Elizabeth Quay at and around                                                             access to maintain the rail network.
                                                      effort is made to have them well presented.
     the Barrack Street ferry terminal.

50
yy The Bus Priority Program delivered road
   infrastructure upgrades in William Street
   Perth, Stage 2; bus priority queue-jump
   lanes at the intersection of Nicholson
   Road and Albany Highway to counter
   traffic congestion; and a two-lane
   roundabout on Aberdare Road, Shenton
   Park to accommodate the bus terminus at
   QEII Medical Centre for the high-frequency
   Route 950 bus service.
yy Upgrades to the public address system
   at Perth, Fremantle, Subiaco and
   Stirling stations were completed, with
   Glendalough, Bull Creek, Canning Bridge
   and Murdoch planned for late 2015.
yy The CCTV camera upgrade program                 Major initiatives                                yy Additional car parking capacity at Guildford
                                                                                                       Station is scheduled for completion in
   delivered 140 digital cameras across            Future initiatives include:                         September 2015, delivering an estimated
   16 stations with another 190 cameras at
                                                   yy The replacement of escalators at Perth           350 bays.
   20 stations planned for 2015-16.
                                                      Underground and Esplanade stations.           yy The purchase of a dedicated rail
yy A works program to improve the overhead
                                                   yy The rollout of a modern digital rail mobile      infrastructure inspection vehicle to gather
   line reliability started, and has eliminated
                                                      radio system over the next five years.           asset data.
   all defects on 50 per cent of the lines.
                                                   yy The continuation of the change out            yy The continuation of the resilience program
yy Alignment of overhead line equipment
                                                      of Passenger Information Displays at             to reduce the impact on services following
   and signalling infrastructure with track at
                                                      Perth station.                                   incidents on the network.
   West Leederville and the installation of
   a crossover at City West have improved          yy The delivery of new bus lanes on Stirling
   the resilience of the system.                      Highway near UWA and a bus priority
                                                      queue-jump lane at the Albany Highway
                                                      intersection with Nicholson Road.

Public Transport Authority Annual Report 2014-15
                                                                                                                                                      51
CASE STUDY

     Asbestos management                                                 Infrastructure Planning and Land Services
                                                                         IPLS provides the PTA with professional resources to support
     The IPLS environment branch managed the expenditure of              and undertake major planning and business objectives, railway
     $2.5m relating to asbestos management in 2014-15 and has            engineering, and land and environmental management.
     an approved budget of $1.8m for this task in future years.
                                                                         Environmental management
     The expenditure is in response to the PTA’s obligations
     under the Occupational Safety and Health Regulations                The IPLS environment branch provides environmental support to the
     1996, which require the PTA to identify, regularly inspect          whole of the PTA. Key services include:
     and manage asbestos in its buildings. The PTA has an                yy Coordination of environmental approvals
     Asbestos Working Group, which consists of members from              yy Environmental input into Project Definition Plans
     IPLS, Safety and Strategy, Network and Infrastructure and
                                                                         yy Response to noise and vibration complaints regarding passenger
     Transperth Buses. The Asbestos Working Group oversees the
                                                                            and freight trains
     management, review and monitoring of asbestos-containing
     materials in all areas of the organisation.                         yy Management of the PTA’s contaminated sites and asbestos-
                                                                            containing buildings
     The PTA owns 75 buildings which contain asbestos,
     the majority of which are in regional locations. Asbestos only      Land and property services
     poses a health risk when asbestos fibres can be inhaled.            IPLS plans, manages and optimises the PTA’s land assets
     When asbestos‑containing materials are in good condition            (acquisition, disposal, leasing and maintenance).
     and regularly inspected they pose no health risk to people.
     The PTA has an Asbestos Management Plan and an Asbestos             Rail infrastructure
     Register which outlines the known locations and condition of        The provision of railway engineering expertise from IPLS provides the
     asbestos in each building and assists in the prioritisation of      PTA and other State agencies, design solutions with sufficient detail
     asbestos removal.                                                   to inform planning decisions and provide the basis for costing and
                                                                         scope for the State’s public transport strategies.
     In 2014-15 the PTA engaged a licenced contractor to inspect all
     of its regional asbestos buildings. Asbestos-containing materials   Route Utilisation Strategy
     were removed from the Public Transport Centre and PTA‑owned
                                                                         The PTA’s RUS provides a holistic approach to planning for the
     buildings in Kalgoorlie, Bridgetown, Boyanup, Merredin,
                                                                         operational changes and resulting investment required to meet
     Watheroo and Mount Barker.
                                                                         forecasted future patronage demands on the urban passenger
                                                                         rail network.

52
You can also read