DETOX SHAMPOOS FOR ETHYL GLUCURONIDE IN HAIR: MORE THAN JUST A SCAM? - Britt Bekaert - Ghent University Library
←
→
Page content transcription
If your browser does not render page correctly, please read the page content below
DETOX SHAMPOOS FOR ETHYL GLUCURONIDE IN HAIR:
MORE THAN JUST A SCAM?

Britt Bekaert

A Master dissertation for the study programme Master in Drug Development

Academic year: 2017 - 2018
DETOX SHAMPOOS FOR ETHYL GLUCURONIDE IN HAIR:
MORE THAN JUST A SCAM?

Britt Bekaert

A Master dissertation for the study programme Master in Drug Development

Academic year: 2017 – 2018
COPYRIGHT

“The author and the promoters give the authorization to consult and to copy parts of this thesis for personal use
only. Any other use is limited by the laws of copyright, especially concerning the obligation to refer to the source
whenever results from this thesis are cited.”

                                                                                                     May 25th , 2018

Author

Britt Bekaert

Co-promotor

Prof. Dr. Wolfgang Weinmann
SUMMARY

        The assessment of alcohol consumption by hair analysis is well established in both clinical and forensic
toxicology. The Society of Hair Testing recommends that the direct alcohol marker ethyl glucuronide should be the
first choice in abstinence monitoring. It is believed that EtG is stable in proximal hair segments up to five cm.
However, recent in vitro studies performed at the Institute of Forensic Medicine in Bern indicated that EtG in hair
is prone to heavy washout effects when in contact with water. Individuals who lost their driving license because of
drunk driving and fail to remain abstinent to pass driving ability assessment may attempt to manipulate the EtG
concentrations in hair to attain a negative test result. Chemical and thermal hair treatments can decrease drug or
EtG concentrations in hair. In this study, we investigated if the long-term application of special so-called detox
shampoos can decrease the EtG concentration in hair by the washout or degradation of EtG.

        Distal hair segments from four subjects, obtained during a standard haircut, were incubated with washing
solutions for a duration of 2.5, 5, 7.5 and 10 hours. Whereas three shampoos performed similarly to deionized
water, the fourth shampoo showed additional significant washout effects of EtG. This shampoo was further
investigated by the incubation of proximal forensic hair samples (n=9) during eight hours with this shampoo.
Using a fully validated online-SPE-LC-MS/MS method we found a decrease in EtG of 27 % ± 25 % when washing
with deionized water and 83 % ± 18 % when applying the detox shampoo, compared to non-incubated hair strands.
The effect of this shampoo was further analyzed by incubating distal hair samples with the ingredients of the
shampoo such as ammonium lauryl sulfate, triethylamine, citric acid monohydrate, sodium thiosulfate, glycerol,
and EDTA. The alkaline triethylamine seemed to be primarily responsible for the substantial reduction in the EtG
concentration in hair whereas the acidity of citric acid reduced the recovery of EtG within the sample preparation
and experimental setup and thus disabled an accurate quantification of EtG.

        Although the investigated detox shampoos showed a tendency toward a decrease in EtG concentration in
the performed in vitro experiments, it was not investigated if the same effect can be achieved outside of the
experimental setting. Further research on living subjects will have to elucidate if the shampoos are in fact as
effective as they have proven to be in the performed experiments. In conclusion, this study shows that detox
shampoos have the potential to influence the EtG concentrations in hair. For this reason, special care must be
taken when interpreting EtG results in hair. EtG concentrations can be below 7 pg/mg despite social or even
excessive alcohol consumption if washout effects or degradation of EtG are induced intentionally by hair
treatment prior to an alcohol consumption assessment based on EtG in hair.
SAMENVATTING

        Haaranalyse voor het vaststellen van alcoholgebruik staat al jaren bekend in het gebied van de klinische
en forensische toxicologie. De ‘Society of Hair Testing’ pleit voor de analyse van de alcohol biomerker ethyl
glucuronide (EtG) in haar in de controle van alcoholonthouding. Hoewel de stabiliteit van EtG in proximale
haarsegmenten tot vijf cm lang wordt aanvaard, toonden in vitro studies uitgevoerd in het instituut voor
forensische geneeskunde in Bern aan dat EtG in haar vatbaar is voor ‘washout’ effecten bij contact met water.
Individuën die na de intrekking van hun rijbewijs de opgelegde periode van alcoholonthouding niet succesvol
doormaken, trachten de EtG concentraties in het haar te manipuleren in de hoop een negatief testresultaat te
bekomen. Van chemische en thermische haarbehandelingen is geweten dat ze geneesmiddel-, drug- en EtG
concentraties in het haar aanzienlijk doen dalen. In deze studie wordt nagegaan of de langdurige applicatie van
zogenoemde detox shampoos de ‘washout’ effecten, veroorzaakt door dagelijkse haarhygiëne, kan bevorderen.

        Distale haarsegmenten, bekomen tijdens standaard knipbeurten van vier personen, werden geïncubeerd
met wasvloeistoffen gedurende 2,5; 5; 7,5 en 10 uur. Terwijl drie shampoos gelijkaardig presteerden, vertoonde
een vierde shampoo bijkomende significante ‘washout’ effecten. Deze shampoo werd nader onderzocht door de
incubatie van proximale forensische haarstalen (n=9) gedurende acht uur in deze shampoo, aanleiding gevend tot
een daling in de EtG concentratie van 27 % ± 25 % bij gebruik van gedeïoniseerd water en van 83 % ± 18 % bij
gebruik van de detox shampoo, zoals bleek na analyse met een gevalideerde online-SPE-LC-MS/MS methode. Het
effect van deze shampoo werd verder uitgediept door het incuberen van distale haarstalen met de ingrediënten
van de shampoo, waaronder ammonium lauryl sulfaat, triethylamine, citroenzuur, natrium thiosulfaat, glycerol en
EDTA. Het basische triethylamine bleek voornamelijk verantwoordelijk voor de substantiële vermindering in EtG
terwijl het zure karakter van citroenzuur de ‘recovery’ van EtG tijdens de staalvoorbereiding aanzienlijk
verminderde, waardoor kwantificatie van EtG in haar onmogelijk werd.

        EtG concentraties kunnen lager zijn dan 7 pg/mg ondanks sociaal en zelfs overmatig alcoholgebruik,
indien ‘washout’ effecten of de chemische degradatie van EtG doelbewust geïnduceerd worden door de applicatie
van detox shampoos voorafgaand aan een haaranalyse voor EtG. Vandaar is bijzondere voorzichtigheid geboden
bij de interpretatie van EtG resultaten in haar. Niettegenstaande dat de onderzochte detox shampoos een dalende
tendens vertoonden van de EtG concentratie in haar in de uitgevoerde in vitro experimenten, is het nog onduidelijk
of een gelijkaardig effect bekomen kan worden buiten het experimentele kader. Nader onderzoek op levende
personen moet uitwijzen of de shampoos werkelijk zo doeltreffend zijn als gebleken uit de uitgevoerde studie.
ACKNOWLEDGMENTS
First, a very special gratitude goes out to my supervisor, Ph.D. student Marc Luginbühl, who was
continuously there to steer me in the right direction through the learning experience of this master thesis. I want
to thank him for his remarks, his patience and his willingness to always answer my questions and proofread my
work numerous times.
I am profoundly indebted to my promotor, Professor Christophe Stove, for introducing me to this topic and
granting me the opportunity to write this thesis abroad. I want to thank him for being very generous with his time
and knowledge throughout this experience.
My sincere thanks go to Professor Wolfgang Weinmann, my promotor at the Institute of Forensic Medicine in Bern,
for his feedback and insightful comments on my work.
I am grateful to the lab technicians and other employees of the Institute of Forensic Medicine in Bern for making
my stay abroad so pleasant. They created a friendly and cooperative atmosphere by making me feel at home and
helping me when needed.
And finally, but not least, I must express my very profound gratitude to my family and friends for their words of
encouragement and tremendous support throughout this experience.Table of Contents
1. INTRODUCTION ................................................................................................................................................................................................. 1
1.1. ALCOHOL AND HEALTH .......................................................................................................................................................................... 1
1.2. ALCOHOL ABSORPTION, DISTRIBUTION, METABOLISM AND EXCRETION (ADME) ................................................... 1
1.2.1. Oxidative pathways for ethanol metabolism ................................................................................................................. 3
1.2.2. Non-oxidative pathways for ethanol metabolism....................................................................................................... 4
1.3. BIOLOGICAL ALCOHOL MARKERS ..................................................................................................................................................... 5
1.3.1. Indirect biomarkers ........................................................................................................................................................................5
1.3.2. Direct biomarkers ........................................................................................................................................................................... 6
1.3.2.1. EtG and FAEE in body fluids............................................................................................................................................7
1.4. HAIR AS AN ALTERNATIVE MATRIX FOR ETHANOL TESTING.............................................................................................. 8
1.4.1. EtG and FAEE in hair ...................................................................................................................................................................... 9
1.4.2. Incorporation of direct biomarkers into the hair matrix ....................................................................................... 10
1.4.3. Cosmetic and thermal hair treatment ................................................................................................................................11
1.5. DETOX SHAMPOOS .................................................................................................................................................................................12
1.6. ANALYTICAL METHODS .........................................................................................................................................................................12
1.6.1. online-SPE-LC-MS/MS...................................................................................................................................................................13
1.6.2. GC-NCI-MS/MS ..................................................................................................................................................................................14
2. OBJECTIVES...................................................................................................................................................................................................... 16
3. MATERIALS AND METHODS ...................................................................................................................................................................... 18
3.1. MATERIALS................................................................................................................................................................................................. 18
3.1.1. Chemicals and reagents............................................................................................................................................................ 183.1.2. Detox shampoos............................................................................................................................................................................ 18
3.1.3. Shampoo ingredients.................................................................................................................................................................. 18
3.1.4. Hair samples.................................................................................................................................................................................... 19
3.1.4.1. Pretest ...................................................................................................................................................................................... 19
3.1.4.2. Forensic hair samples ..................................................................................................................................................... 19
3.2. METHODS ....................................................................................................................................................................................................21
3.2.1. Incubation .......................................................................................................................................................................................... 21
3.2.1.1. Pretest .......................................................................................................................................................................................21
3.2.1.2. Forensic hair samples ..................................................................................................................................................... 22
3.2.1.3. Shampoo ingredients ...................................................................................................................................................... 22
3.2.2. Sample preparation ..................................................................................................................................................................... 23
3.2.3. Sample extraction ........................................................................................................................................................................ 23
3.2.4. Preparation of calibrators and quality controls..........................................................................................................24
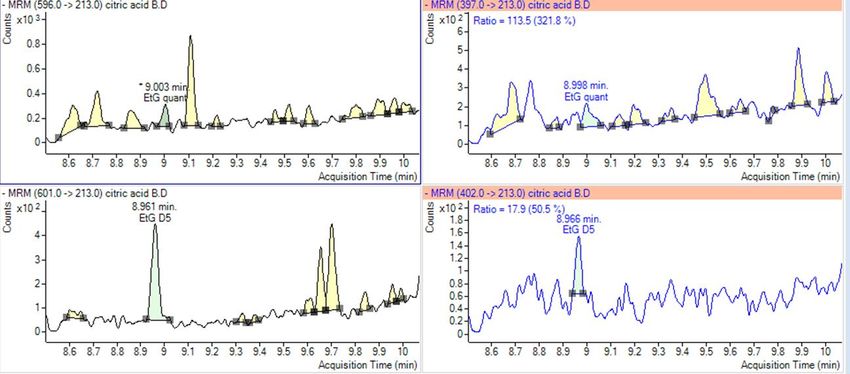
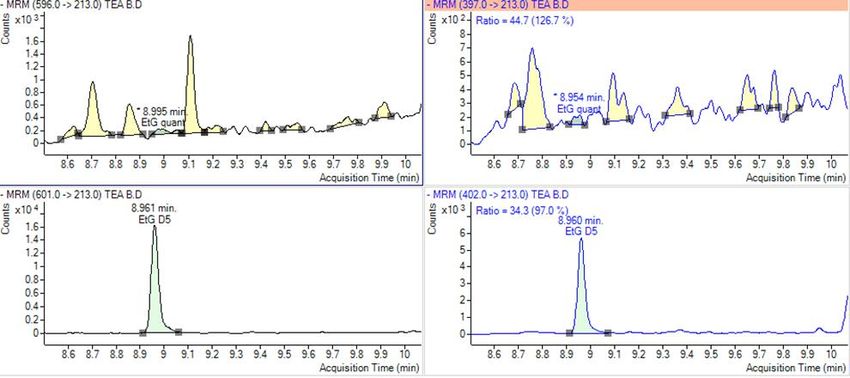
3.2.5. LC-MS/MS measurements .........................................................................................................................................................24
3.2.6. GC-MS/MS-NCI measurements .............................................................................................................................................. 28
3.2.7. Shampoo alcohol quantification ..........................................................................................................................................29
3.2.8. pH measurement of incubation solutions ......................................................................................................................29
4. RESULTS .............................................................................................................................................................................................................31
4.1. PRETEST .......................................................................................................................................................................................................31
4.2. FORENSIC HAIR SAMPLES ..................................................................................................................................................................33
4.3. SHAMPOO INGREDIENTS ....................................................................................................................................................................35
4.4. SHAMPOO ALCOHOL QUANTIFICATION ...................................................................................................................................... 39
4.5. PH-MEASUREMENT OF THE INCUBATION SOLUTIONS ...................................................................................................... 39
5. DISCUSSION ......................................................................................................................................................................................................416. CONCLUSION ................................................................................................................................................................................................... 47 7. REFERENCES .................................................................................................................................................................................................. 49
LIST OF ABBREVIATIONS

AC: Analytical column

ADH: Alcohol dehydrogenase

BAC: Blood alcohol concentration

CYP: Cytochrome P450

EDTA: Ethylenediaminetetraacetic acid disodium salt dihydrate

EtG: Ethyl glucuronide

EtS: Ethyl sulfate

FAAE: Fatty acid ethyl esters

GC: Gas chromatography

GC-NCI-MS/MS: Gas chromatography-negative chemical ionization-tandem mass spectrometry

HFBA: Heptafluorobutyric acid anhydride

HS-GC-FID: Headspace-gas chromatography-flame ionization detection

IS: Internal standard

LC: Liquid chromatography

LC-MS/MS: Liquid chromatography-tandem mass spectrometry

LOD: Limit of detection

LOQ: Limit of quantification

MEOS: Microsomal ethanol oxidizing system

MRM: Multiple reaction monitoring

MS/MS: Tandem mass spectrometry
PEth: Phosphatidylethanol

pH: potential of hydrogen

Q1 : First quadrupole

Q2 : Second quadrupole

Q3 : Third quadrupole

SoHT: Society of hair testing

SPE: Solid-phase extraction

SRM: Selected reaction monitoring

TC: Trapping column

UGT: Uridine 5'-diphospho-glucuronosyltransferase
1.   INTRODUCTION

     1.1. ALCOHOL AND HEALTH

         Alcoholism is a worldwide phenomenon wrongly treated as a low priority in public health policy. The
consumption of alcoholic beverages such as beer, wine, and liquor has been a part of society since ancient
times.(1) The legal status of this psychoactive substance makes its use widely and socially acceptable. It is said
that moderate alcohol consumption, being one or two drinks a day for women and men respectively, has beneficial
effects on decreasing the risk of heart disease and diabetes.(2, 3) However, alcohol, a drug consumed in high
amounts by an extensive part of the world population, is anything but harmless.(4, 5)

         Every year 3.3 million people worldwide die from the consequences of consuming large amounts of
alcohol. In 2012, this number amounted to 5.9 % of all deaths worldwide.(5) In addition, alcohol abuse increases
the risk of developing addiction and other diseases such as malignant neoplasms, cardiovascular diseases and
liver damage, including liver fibrosis and cirrhosis.(6) Apart from its impact on the physical and mental health of
the alcoholic, alcohol causes a great deal of socioeconomic problems. Excessive alcohol consumption causes a
large national financial cost in sectors such as health-care, justice, welfare and unemployment.(5) Furthermore,
alcoholics do not only pose a danger to themselves but also to their surroundings, family, friends and even
strangers as the abuse of alcohol leads to reckless behavior, aggression, and depression. Although there has been
a notable decrease in the involvement of alcohol in traffic accidents, alcohol-impaired driving is still the cause of
over 40 % of all traffic fatalities.(7)

     1.2. ALCOHOL ABSORPTION, DISTRIBUTION, METABOLISM AND EXCRETION (ADME)

         Despite its hydrophilic nature, ethanol readily passes biological membranes by passive diffusion while
moving from the bloodstream into the tissues.(8) The absorption of alcohol occurs both from the stomach and the
small intestine. Plicae, villi, and microvilli increase the surface area of the small intestine. As a consequence,
alcohol absorption occurs extensively from this organ.(9, 10)

         The distribution of alcohol in the tissues depends on the tissue mass, the tissue water content and the
blood flow rate. Assuming everyone differs in the percentage of body fat and water content, the distribution of

                                                                                                                   1
alcohol in the body as well as the blood alcohol concentration (BAC) is different among individuals. Women, for
example, have a higher fat percentage and therefore a lower volume of distribution for alcohol. An equivalent
dose of alcohol per kg body weight results in higher peak blood alcohol concentrations in women when compared
to men.(11) A greater extent of the first-pass metabolism of ethanol is seen in men. This contributes to the lower
BAC in males compared to females.(12)
After the ingestion of alcohol, it first reaches the stomach where it can be oxidized by α-alcohol
dehydrogenase (ADH) and class and ADH, isoforms of the enzyme alcohol dehydrogenase. However, the
importance of this first-pass metabolism is questionable.(13) The greater presence of alcohol metabolizing
enzymes such as ADH and the microsomal ethanol oxidizing system (MEOS) in the liver implies that the liver plays
the primary role in the metabolism of alcohol.(12, 14)
Metabolism of a drug aims to make a drug less toxic and more water-soluble whereby it is more
adequately excreted in the urine. Numerous pathways are responsible for the elimination of alcohol from the
human body. Up to 10 % of the ingested alcohol is not metabolized and excreted unchanged through the urine
(0.5-2.0 %), breath (1.6-6 %) and sweat (1.2.1. Oxidative pathways for ethanol metabolism
Three enzyme systems, illustrated in figure 1.1, play an important role in the oxidative metabolism of
alcohol namely ADH, the MEOS and catalase. The majority of the ingested ethanol is metabolized in the
hepatocytes by the cytosolic enzyme ADH. Partial oxidation of ethanol by ADH produces the very toxic and
carcinogenic acetaldehyde. This intermediate metabolite is then further oxidized in the hepatic mitochondria to
the less harmful byproduct acetate by acetaldehyde dehydrogenase. Acetate is ultimately metabolized to acetyl
coenzyme A, that can be incorporated into the tricarboxylic acid cycle.(8) The biotransformation of acetate
continues predominantly in organs other than the liver such as the heart, the skeletal muscles, and the brain
cells.(14)
The MEOS, consisting of a group of cytochrome P450 (CYP) isoenzymes, plays a less significant role in the
hepatic oxidative metabolism. Nonetheless, chronic alcohol consumption induces the activity of the isoenzyme
CYP2E1 and hence increases the biotransformation of ethanol to acetaldehyde. In addition, diverse reactive oxygen
species, together with the considerable amount of acetaldehyde, cause significant damage to cells and tissues.
Oxidation to acetaldehyde by catalase, an enzyme present in the peroxisomes, requires the presence of hydrogen
peroxide. As the generation of hydrogen peroxide under physiological conditions is limited, this enzyme plays a
rather negligible role in the in vivo oxidation of ethanol.(8, 12, 14, 19)
Figure 1.1: The enzymatic breakdown of ethanol. The oxidative metabolism of ethanol is carried out by three different
enzymes, resulting in the formation of acetaldehyde: ADH, the CYP2E1 enzyme (MEOS) and catalase.(20)
31.2.2. Non-oxidative pathways for ethanol metabolism
Non-oxidative metabolism only makes a minor contribution to the total metabolism of ethanol. It
primarily gives rise to fatty acid ethyl esters (FAEE), ethyl glucuronide (EtG), ethyl sulfate (EtS) and phosphatidyl
ethanol (PEth).
Ethyl esters of fatty acids are non-oxidative products of ethanol metabolism. They are formed in the
reaction between ethanol and fatty acids, triglycerides, lipoproteins, and phospholipids. The esterification is
particularly catalyzed by two enzymes, FAEE synthase and acyl-coenzyme A/ethanol O-acyl-transferase.(21) The
enzymes are predominantly active in organs largely impaired by alcoholism, such as the liver and the pancreas.
Additionally, a moderate amount of FAEE is generated in the heart, the brain cells and the adipose tissue.(15, 22)
Although more than 15 types of FAEE can be detected, the four most frequently measured ethyl esters are ethyl
myristate (E14:0), ethyl palmitate (E16:0), ethyl stearate (E18:0) and ethyl oleate (E18:1).(23, 24)
EtG and EtS are both small ethanol conjugates with polar and acidic properties. EtG is the result of a
phase- conjugation reaction between ethanol and uridine 5’-diphospho-β-glucuronic acid, the active form of
glucuronic acid. The glucuronidation reaction is catalyzed by uridine 5'-diphospho-glucuronosyltransferase
enzymes (UGTs). This minor metabolite is predominantly formed in the liver, lung, and intestine.(15) Similarly, EtS
is produced in a conjugation reaction through the action of sulfotransferase. Sulfotransferase catalyzes the
reaction between ethanol and 3’-phosphoadenosine-5’-phosphosulfate.(4, 24)
Phospholipase D is responsible for the formation of PEth, a class of abnormal membrane phospholipids
formed after excessive consumption of alcohol. Under physiological circumstances, the enzyme is responsible for
the conversion of phosphatidylcholine to phosphatidic acid, which plays a significant role in intracellular signal
transduction.(25) PEth is not considered a single molecule. It is a group of analogues consisting of a common
phosphate ethyl ester head group and two fatty acid chains, which differ in carbon length and degree of
saturation.(4, 24, 26)
41.3. BIOLOGICAL ALCOHOL MARKERS
Due to the growing number of alcohol-related problems in the Western world, priority has been given to a
more effective and objective diagnosis of hazardous drinking over the past decades. The determination of an
individual’s drinking behavior is applied in various situations including workplace drug testing, alcohol-impaired
driving, license regranting programs, child custody cases, withdrawal treatment and liver transplantation
medicine.(27-29)
Ethanol itself is not an ideal target for monitoring chronic alcohol abuse giving the relatively short
detection window.(30) The detection of ethanol in body fluids and breath only provides proof of recent drinking
events.(27) Thankfully, certain ethanol metabolites show an extended diagnostic window allowing alcohol to be
detected even after its total elimination from the body. Ethanol use is assessed in both a direct and indirect
fashion. Accordingly, two types of alcohol biomarkers can be distinguished, namely direct and indirect biomarkers.
The National Institute on Alcohol Abuse and Alcoholism defines biomarkers as “biochemical substances in the body
that can indicate the presence or progress of a condition, or any genetic predisposition toward it”.(31) Alcohol
biomarkers should provide a rough estimate of the consumed volume as well as allow a distinction between acute
and chronic harmful drinking.(27) However, at present none of the available alcohol biomarkers is ideal. The
indirect biomarkers lack sufficient sensitivity and specificity for ethanol while direct biomarkers lack a broad
detection window in blood and urine. Usually, various markers are analyzed simultaneously to avoid
misinterpretation of test results.(27, 31)
1.3.1. Indirect biomarkers
Elevated levels of liver enzymes in serum such as gamma-glutamyltransferase (GGT) and aspartate- and
aminotransferase (AST and ALT) imply damage to several organ systems, the liver in particular. Moreover, long-
term alcohol misuse results in an increase in the volume of the erythrocytes. Therefore, the average volume of the
erythrocytes, the mean corpuscular volume (MCV), is considered an indirect biomarker.(32) Carbohydrate-deficient
transferrin (CDT %) is said to be the more sensitive and specific indirect biomarker.(27) It is a glycoprotein
transferring iron through the bloodstream. Transferrin exists of polysaccharide chains containing a number of
sialic acid residues. By consuming a great daily amount of alcohol for at least two weeks the number of sialic acid
5residues decreases from four to zero, one or two. These variants of the glycoprotein are called carbohydrate-
deficient transferrins.(33, 34)
Indirect biomarkers reflect the toxic and damaging impact excessive alcohol intake has on the body. They
are normally detected in blood or serum. As biomarkers, they lack sensitivity and specificity since their presence is
not always directly linked to the use of ethanol. They rely upon the influence ethanol has on the organ systems
and/or the biochemistry of the human body. A downside to the indirect character of these biomarkers is the fact
that the detected elevation of the markers can be caused by non-alcohol related pathologies. Biliary and liver
diseases resulting in liver damage can give rise to elevated levels of liver enzymes. Apart from alcohol,
hematological and bone marrow diseases together with vitamin B12 or folic acid deficiencies can result in an
increase in the mean corpuscular volume. Thus, the measurement of indirect biomarkers often leads to false
positive results. Furthermore, the elevation is only detectable after chronic and excessive alcohol abuse. Indirect
biomarkers are not able to detect short-term drinking.(27, 30, 33, 35)
1.3.2. Direct biomarkers
In contrast, the detection of direct biomarkers furnishes reliable proof of alcohol intake. As illustrated in
figure 1.2, these biomarkers are directly derived from ethanol as their chemical structure contains the two carbon
atoms originating from the ethanol molecule. Direct biomarkers, other than ethanol, include EtG, EtS, PEth, and
FAEE. Detection of such metabolites has become interesting in the field of clinical and forensic toxicology. In
particular, their longer window of detection compared to ethanol itself makes them very useful and promising
diagnostic tools. Because of ethanol’s physical and chemical properties, it can only be measured shortly after a
drinking event in conventional matrices including body fluids and breath.(36) Other direct biomarkers have the
possibility to be assessed in alternative matrices after the total elimination of ethanol. Unconventional samples
comprise hair, meconium, nails, tissue, oral fluid and dried blood spots.(37) Direct biomarkers are most suited to
monitor alcohol abuse whereas the analysis of indirect biomarkers has more limitations, including insufficient
selectivity for ethanol.(30, 34)
6Figure 1.2: An overview of the direct alcohol biomarkers and their chemical structure. Direct alcohol biomarkers
comprise FAEE, EtG, EtS, and PEth. They are derived directly from ethanol as their chemical structure contains the
ethyl group originating from the ethanol molecule.(38)
1.3.2.1. EtG and FAEE in body fluids
EtG is a fairly stable, polar, acidic and non-volatile minor metabolite of ethanol. The direct metabolite can
be detected up to 36 hours in blood and up to five days in urine after ingesting a large amount of alcohol. This is
possible because EtG shows a slower elimination than ethanol with a half-life amounting to 2.5 hours.(39) In
these conventional matrices, EtG can be considered as a short-term alcohol biomarker.
7Fatty acid esters of ethanol can be detected in blood up to 24 hours after alcohol intake. The amount of
fatty acid esters in serum is directly proportional to the amount of alcohol consumed. However, esters do not
remain stable for long due to continuous enzyme activity.(38) Usually, the sum of the concentrations of the four
most abundant FAEE, CFAEE (ethyl myristate, ethyl palmitate, ethyl oleate and ethyl stearate) is used as an indicator
of alcohol consumption. However, in 2016, the SoHT published a new consensus for the use of alcohol markers in
hair for the assessment of abstinence and chronic excessive alcohol consumption suggesting that the use of the
concentration of ethyl palmitate results in a better analytical performance.(40)
1.4. HAIR AS AN ALTERNATIVE MATRIX FOR ETHANOL TESTING
A great disadvantage to the measurement of direct biomarkers in various body fluids is the narrow
window of detection. Using hair for drug testing provides information on the history of an individual’s drug
abuse.(24) Furthermore, head hair is a useful tool to perform segmental investigation since the average rate of
hair growth is estimated to be 1.0 to 1.3 cm per month.(41, 42) The drinking behavior can be determined over the
past several weeks, months and even years depending on the length of the hair. Information gained from hair
analysis is complementary to the short-term information gathered from urinalysis and blood analysis.
The sampling of head hair is most common. Only when scalp hair is not available or in case of strongly,
chemically treated hair, body hair can be used. However, EtG is preferably not quantified in pubic hair since its
concentration is strongly elevated in this matrix. The overestimation of the EtG concentration could be attributed
to the contact of the hair with EtG-containing urine.(43, 44) Furthermore, the peculiar physiology of body hair has
to be taken into account when interpreting the results.(45, 46)
Moreover, the collection of a hair sample is non-invasive and less of a violation of the privacy of the
donor. Hair collection is replicable for confirmation of the results in case disputes arise concerning the chain of
custody. The hair is preferably cut close to the scalp at the posterior vertex region of the head. This region is
coupled with the slightest variation in hair growth rate. Fortunately, hair is a very stable matrix allowing
preservation of hair samples at room temperature. There is no manipulation possible after sampling by the
donating subject since the sampling and storage are supervised by a competent individual. Nevertheless,
adulteration or manipulation of the hair prior to sampling is rather common.(47)
81.4.1. EtG and FAEE in hair
The determination of EtG and FAEE in hair is gradually becoming the preferred method to diagnose
chronically abusive drinking behavior and/or abstinence.(48) Considering the minor contribution of non-oxidative
biotransformation routes to ethanol metabolism, only minuscule amounts of the direct biomarkers are
incorporated into the hair fibers. Therefore, a very sensitive method is required to detect the concentrations in the
range of pg per mg of hair (pg/mg).(39, 49) The Society of Hair Testing provides cut-off values for EtG and FAEE in
hair, enabling differentiation between heavy drinking, social drinking, and abstinence. The measurement of EtG in
hair is considered to be the first choice for the monitoring of abstinence. Therefore, a positive EtG result cannot be
overruled by a negative FAEE result.(40) These SoHT guidelines ensure equal interpretation of hair testing results
by various laboratories.(47, 50)
An EtG concentration ≥ 7 pg/mg implies periodic alcohol consumption. When the concentration exceeds
30 pg/mg, chronic excessive drinking behavior may be assumed. EtG found in concentrations lower than 7 pg/mg
suggests abstinence from alcohol. Absolute abstinence, however, cannot be guaranteed. Exposure to hair
treatments and external influences can result in a decrease of the EtG concentration below the limit of detection
(LOD) and moderate consumption of alcohol does not always result in quantifiable EtG concentrations in hair. FAEE
can even be detected in the hair of teetotalers. The recommended cut-offs for FAEE concentrations depend on the
length of the hair strand used for analysis. The most recent SoHT guidelines propose an ethyl palmitate cut-off
concentration of 0.12 ng/mg. This cut-off value applies to the analysis of a 0-3 cm proximal segment of head hair.
Measuring an ethyl palmitate concentration of 0.15 ng/mg in a 0-6 cm proximal segment is not in contradiction
with abstinence from alcohol. Concentrations of 0.35 and 0.45 ng/mg, measured in the shorter and longer hair
segment respectively, presume habitual abusive alcohol consumption.(40, 51)
A positive result for EtG suggests that recent alcohol consumption is likely. However, the high sensitivity
of this biomarker can possibly lead to false positive results. There have been cases in the past where positive EtG
results were caused by an EtG-containing hair lotion and exposure to alcohol-based perfumes.(44, 52) FAEE can
also be measured in hair without prior exposure to alcohol. The formation of FAEE may occur while using alcohol-
containing hair care products.(53)
The cut-off values suggested by the SoHT assume a proportional relationship between the ingested dose
of alcohol and the measured marker concentrations. It is rather gullible assuming that such proportionality exists
9as the transition from the ingested alcoholic beverage to the incorporated ethanol metabolites is subject to many
interindividual differences.(24, 36, 50) To prevent the occurrence of false-positive and false-negative test results
as much as possible, a combined analysis of both EtG and FAEE is recommended.(40, 51) It is certainly not
advisable to exclusively use the results of hair testing to reach a decision within a forensic or clinical case.(50, 54,
55)
1.4.2. Incorporation of direct biomarkers into the hair matrix
Three main routes seem to exist for the incorporation of EtG and FAEE into the hair matrix. An overview of
the drug incorporation routes is given in figure 1.3. Alcohol markers can enter the growing hair fiber by passive
diffusion from the bloodstream supplying the dermal papilla. Bathing of the hair in sweat and sebum secreted by
the sweat and sebaceous glands is an alternative possibility. External contamination of the hair can also occur.(45)
Figure 1.3: The three main pathways responsible for the incorporation of direct alcohol markers into the hair matrix.
Alcohol markers can enter the hair by diffusion from the bloodstream and bathing of the hair in sebum and sweat
secretions. External contamination of the hair is also possible.(56)
FAEE have a lipophilic character and are therefore primarily excreted by the sebaceous glands and
deposited from there onto the hair and through the rest of the body. This deposition route explains the increase in
FAEE concentrations from the proximal to distal end of the hair. Sebum constantly submerges the hair, causing the
FAEE concentration to accumulate with increasing distance from the scalp.(57) Moreover, shampooing of long hair
10happens more thoroughly near the scalp. Most likely, this is the reason why the incorporation from sebum in the
proximal hair segments is less explicit.(58)
This is opposed to EtG, which is a polar compound. Deposition from sebum is very unlikely for this
metabolite. Research affirms that the primary incorporation route is through the secretion of sweat. Incorporation
into growing hair fibers via blood is also frequently mentioned as a main incorporation route. Authors claim that
the distribution of the latter marker differs from that of FAEE. The EtG content rather decreases from the proximal
to distal end of the hair.(21)
Both markers differ in physical properties causing them to have different ways of being incorporated into
the hair as well as being washed out of the hair. EtG and FAEE show discrepancies in stability against hair care
products, hair treatments, and external contaminating influences. Because of their lipophilic composition, FAEE in
hair are capable of withstanding frequent washing and shampooing. EtG, on the other hand, is more sensitive to
hair cosmetics and washing of the hair. This marker with acidic and polar properties acts as an anion at
physiological pH. Therefore, it does not bind to hair melanin.(21, 42, 45, 48, 50)
1.4.3. Cosmetic and thermal hair treatment
The content of alcohol markers such as EtG and FAEE in hair can be altered by cosmetic treatment. A
correct interpretation of the results of hair testing requires the consideration of these potential
manipulations.(47)
Treating hair with coloring and ethanol-containing products does not have a critical impact on the EtG
content in hair.(59) Nonetheless, bleaching, wave perming and hair straightening give rise to an alteration in the
EtG concentration.(42) Bleaching may cause a chemical degradation of EtG in addition to the leaching out of EtG
from the hair. This can be explained by the presence of oxidative, reactive ingredients such as hydrogen peroxide
and ammonium or potassium persulfate. Hair strands come into contact with excessive heat during hair
treatments such as wave perming and hair straightening causing disulfide bonds in the hair fiber to break.(59-61)
In case of heavily treated hair, body hair should be used for the analysis of EtG.(46) Another alternative
would be to analyze FAEE in hair as the content of this non-oxidative metabolite is less altered by chemical and
thermal treatments.(51, 59)
111.5. DETOX SHAMPOOS
Due to the severe consequences of a positive hair analysis result, it can be assumed that an increasing
number of alcohol consumers may attempt to manipulate the EtG concentration in hair to attain a negative test
result. Different methods, such as mentioned above (bleaching, perming, straightening but also complete shaving
of the hair), are notorious adulteration approaches.(62) Previous research indicates that even contact with water
affects the EtG content in hair. Because of its hydrophilic composition, EtG is highly soluble in water and therefore
more easily washed out of the hair.(42) Prolonged contact with chlorinated water shows a washout effect
comparable to the one seen in deionized water. The hair structure is altered allowing incorporated drugs to leach
out more easily. Chlorinated water used in swimming pools and spa facilities is necessary to reduce the microbial
count in the water. Part of the population is regularly in contact with chlorinated water such as swimmers,
wellness enthusiasts and people drinking chlorinated water. In these cases, caution must be taken when
interpreting a negative EtG test result.(63)
Lately, special so-called detox shampoos receive a lot of attention from drug abusers. A great number of
online customer reviews praise these hair “detox” kits. On various websites, people are recommending different
shampoos and explaining how they use them to enhance the leach out of drugs from the hair shaft. According to
the shampoo users, they proved to be useful in the prevention of positive hair testing results after long-term
incubation under a swimming cap.(62, 64) A few examples of such laudatory reviews are presented in figure 8.2 in
the appendix.
1.6. ANALYTICAL METHODS
Highly sensitive methods are required for the reliable quantification of EtG as only very limited amounts
of this minor ethanol metabolite accumulate in hair. Over the last decades, various analytical methods have been
applied to determine these EtG concentrations in the lower picogram range. However, the most commonly
performed methods, providing sufficient sensitivity, include liquid chromatography-tandem mass spectrometry
(LC-MS/MS) and gas chromatography-mass spectrometry (GC-MS).(39, 49) EtG analysis is preferably carried out by
LC-MS/MS, primarily because the technique does not require sample derivatization and produces results much
quicker.(21, 65)
121.6.1. online-SPE-LC-MS/MS
In this study, EtG analysis was carried out by a fully validated, automated online solid-phase extraction-
liquid chromatography-tandem mass spectrometry method (online-SPE-LC-MS/MS).(63)
Prior to detection, a mixture of compounds has to be separated. Liquid chromatography (LC) separates
molecules based on their interaction with a mobile phase and a stationary phase, an analytical column.(66)
According to the polarity of compounds, their affinity for either the mobile or stationary phase is greater. The
varying affinity of compounds results in a different retention on the stationary phase, thus an analytical
separation.
In the online-SPE setup used for the EtG determination during this study, there is a trapping column
present, enabling the retention of very polar analytes. Both the trapping column and the analytical column are
connected to a different binary pump. By the use of a valve, online column switching during the measurement is
possible. The sample is initially loaded onto the trapping column. In this first step, the valve is in the LOADING
position, allowing co-elutes to be flushed to the waste while polar analytes are retained in the packing of the
trapping column. In a second step, the valve is switched into an ELUTION position and by changing the composition
of the mobile phase to a profuse amount of more apolar solvent, the trapped analytes are eluted from the
trapping column.(67-70) The previously retained components are subsequently flushed onto the analytical
column, where analytical separation takes place. In section 3.2.5., a more detailed explanation of this methodology
is given.(71)
The polar mobile phase carrying along the desired polar analytes does not interact with the rather
hydrophobic stationary phase. This type of liquid chromatography is known as reversed-phase LC. After elution
from the analytical column, the sample reaches the mass spectrometer (MS). Tandem mass spectrometry (MS/MS),
a technique used for quantification and qualification purposes, measures the mass-to-charge ratio (m/z) of ions.
Therefore, the analytes have to be ionized prior to detection.(72)
Electrospray ionization is a commonly used tool for ionization. The sample leaving the chromatographic
system enters the ion source through a capillary tube subjected to a voltage between 2.5 and 6.0 kV. A fine stream
of charged droplets is generated. A very high temperature together with a flow of nitrogen drying gas enables the
continuous evaporation of the solvent. This results in a steady decrease in droplet size and an increase in surface
13charge density. At a certain point, a limit of electrical tension is surpassed causing the droplets to erupt and
charged analytes to be generated. Ionization is followed up by the acceleration of the ions into the MS.(73-75)
The EtG analysis was conducted by a triple quadrupole mass spectrometer. This mass analyzer, in
particular, is composed of three quadrupoles, each of them contains four parallel, hyperbolic rods subjected to
direct current and radio-frequency potentials. The rods are either negatively or positively charged. The second
quadrupole (Q2) is only subjected to radio-frequency potentials and serves as a collision cell. The first and the third
quadrupole (Q1 and Q3), on the other hand, act as mass filters. As illustrated in figure 1.4, selective or multiple
reaction monitoring was performed (SRM or MRM). In this MS/MS experiment, one m/z value is selected by the first
mass filter. The selected m/z is passed into a gas-filled collision chamber, where collision-induced dissociation
takes place. After this fragmentation, a single fragment is selected in Q3.(76) MRM or SRM can be described as the
conversion of one parent ion, selected in Q1, to one product ion, selected in Q3.(77) Thereafter, the selected
fragment is redirected to the detector.
Figure 1.4: Shown in this figure is SRM or MRM, which was performed for analyte detection. One m/z value is selected
in Q1 and passed into a collision cell (Q2). In this chamber, fragmentation takes place by collision-induced
dissociation. This results in a number of product ions. Selection of a certain product ion is carried out by Q3.(76-78)
1.6.2. GC-NCI-MS/MS
Quantification of EtG in hair is also possible with gas chromatography-negative chemical ionization
tandem mass spectrometry (GC-NCI-MS/MS). Although this method allows selective and sensitive quantification, it
is limited to volatile samples or samples that can become volatile after derivatization. Generally, alteration of
functional groups of analytes allows increased volatility and detectability. Moreover, derivatization enhances
selectivity and separation.(39, 79, 80)
14Considering the polarity of EtG, derivatization is required in order to decrease the chemical reactivity of
EtG prior to gas chromatographic (GC) analysis. The addition of heptafluorobutyric acid anhydride (HFBA) to EtG
allows an acylation reaction to take place.(80) Two heptafluorobutyryl-groups are attached to the EtG molecule in
the derivatization process, every addition of the derivatization agent is accompanied by the loss of a water
molecule by formation of an inner lactone. This ring formation occurs intramolecularly between the carboxyl
group of EtG and a non-derivatized hydroxyl group, leading to the additional loss of a water molecule.
A GC system consists of a carrier gas as the mobile phase and a capillary column, coated with a stationary
phase. The sample is carried along the column with an inert gas allowing compounds in the mixture to interact
differently with the stationary or mobile phase. Molecules differ in chemical properties and therefore vary
considerably in their affinity for the stationary phase. Components of the sample are retained to a different
degree which allows elution at distinctive retention times.
As mentioned before, mass spectrometry is only able to detect ions as it measures their mass-to-charge
ratio (m/z). Chemical ionization is a soft ionization technique that involves a reagent gas, such as methane. Firstly,
high energy electrons ionize reagent gas molecules. Ion-molecule reactions ultimately result in the formation of
analyte ions.
152. OBJECTIVES
While consuming alcohol is legal, socially accepted and widespread, alcohol is considered as one of the
most dangerous and destructive drugs, when consumed excessively. Because of alcohol’s immense impact on
health, society, the global economy, and criminality, the quest for the best method enabling the identification of
this type of substance abuse has gained significant importance. In the last ten to fifteen years, hair analysis of EtG
for the diagnosis of alcoholism and/or abstinence has gained increasing recognition.(81, 82)
Because a positive hair test result can possibly have a tremendous impact on an individual’s personal and
professional life, alcohol abusers often attempt to manipulate the EtG content in the hair. Common adulterations
include complete shaving, bleaching, perming, straightening and dying of the hair.(59-61) Since the minor ethanol
metabolite, EtG is slightly acidic and very hydrophilic, it does not bind to hair melanin and therefore has potential
to be removed from the hair shaft by normal hair hygiene.(21, 42, 54, 63, 83)
Relatively new on the market are various cleansing shampoos promising to remove drug substances from
the hair shaft.(62, 64) These detox hair products, sold all over the internet at inflated prices, are accompanied by a
lot of laudatory customer reviews as well as instructions on how to optimally use the shampoos. Long-term
incubation of the hair with the shampoo under a swimming cap as well as additional cosmetic and thermal hair
treatments, damaging the hair and thus enhancing penetration of the detox product, seem to produce the most
favorable results. As the access to these hair products is relatively easy, the extent of their effect on the EtG
concentrations in hair should be evaluated.
In this study the following questions will be addressed:
• Does the application of detox shampoos enhance the observed washout effects (or degradation) of EtG?
• Are there key ingredients which may enhance the decrease of the EtG concentration in hair?
To investigate these questions, distal hair samples were analyzed after the application of four different
detox shampoos, purchased online from the website Amazon.com. After incubation, cleaning, and washing of a hair
sample, it was furthermore subjected to a sonification extraction procedure as well as a solid-phase extraction
(SPE). The obtained samples were analyzed for EtG by a fully validated online-SPE-LC-MS/MS method. Confirmatory
analysis was performed by means of GC-NCI-MS/MS after sample derivatization.(39) The EtG analysis was
subsequently carried out on real case proximal hair samples after incubation with the best working shampoo. This
16additional assessment was performed to possibly observe an equivalent EtG decrease in a broader range of
subjects with different hair structure and length. Moreover, the ingredients of the most promising shampoo were
tested individually with the aim to identify the substances responsible for the decrease in the EtG concentration.
False positive hair testing may be encountered after using ethanol-containing hair products. In order to
assure the validity of the obtained results, the four investigated shampoos were put to the test. By means of
headspace gas chromatography coupled with flame-ionization detection (HS-GC-FID), the alcohol content of the
detox shampoos was determined. Finally, the acidity or basicity of solutions of the hair products was specified by
determining their pH-value.
173. MATERIALS AND METHODS
3.1. MATERIALS
3.1.1. Chemicals and reagents
The ultrapure water of Type 1 was obtained using a Milli-Q water System (Millipore Corporation, Billerica,
MA, USA). Merck (Darmstadt, Germany) provided acetone (LiChrosol), acetonitrile, dichloromethane (Reag. Ph. Eur.),
methanol (Reag. Ph. Eur.), aqueous ammonia solution (25 %, EMSURE) and ethyl acetate. Formic acid solution
(puriss. p.a., 50 % in water) was ordered from FlukaTM/ Honeywell (NJ, USA). The deuterated internal standards of
ethyl glucuronide, ethyl-β-D-glucuronide-d5 (1.0 mg/ml) and ethyl-β-D-glucuronide (1.0 mg/mL), were provided by
both Lipomed (Arlesheim, Switzerland) and Cerilliant (Round Rock, TX, USA). The derivatization agent for GC,
heptafluorobutyric acid anhydride, was provided by Macherey-Nagel (Oensingen, Switzerland).
3.1.2. Detox shampoos
The four investigated detox shampoos were acquired online. They were ordered from the website
Amazon.com. The shampoos include Test Pass Detox Shampoo (59 mL)(E2 Brokers Inc., Rocklin, CA, USA), Folli-
Kleen Deep Detox Shampoo (118mL) (Stinger Detox, Phoenix, USA), Folli-Cleanse High Voltage Detox Shampoo (59
mL) (High Voltage Detox, Las Vegas, USA) and Ultra Cleanse Hair Cleansing Shampoo (59 mL) (Ultra Klean Inc., Las
Vegas, USA).
3.1.3. Shampoo ingredients
An ammonium lauryl sulfate solution (~30 % in water), sodium thiosulfate, triethylamine,
ethylenediaminetetraacetic acid disodium salt dihydrate (EDTA) and citric acid monohydrate were purchased from
Sigma-Aldrich (St. Louis, USA). Glycerol was obtained from FlukaTM/ Honeywell (NJ, USA). Cocamidopropyl betaine
and other similar coconut oil derived substances were found in all of the investigated shampoos. Therefore, those
chemicals were not considered relevant and thus not acquired. DMDM hydantoin and iodopropynyl butyl
carbamate serving as preservatives were not procured because the purchase cost was rather high.
183.1.4. Hair samples
3.1.4.1. Pretest
Hair, cut from the distal end, was used to perform the pretest since a large amount of hair was required.
The distal hair segments were obtained from standard haircuts of four different subjects. The hair was previously
used in a study for the investigation of the influence of Milli-Q purified water and chlorinated water on the EtG
content in hair.(63) For this reason, rough estimates of the EtG content in the hair were available. 10.164 g of
greying black hair with an EtG concentration of approximately 90 pg/mg was available for subject one. Dark blond
hair containing roughly 19 pg/mg EtG was analyzed from subject two. The total amount of hair from this subject
weighed 7.726 g. A male with pitch-black hair and a great number of grey strands provided hair with an EtG
content of around 45 pg/mg. 7.144 g of hair from this subject three was used for analysis. Only 3.072 g of black hair
with an EtG concentration of around 40 pg/mg was available from subject four.
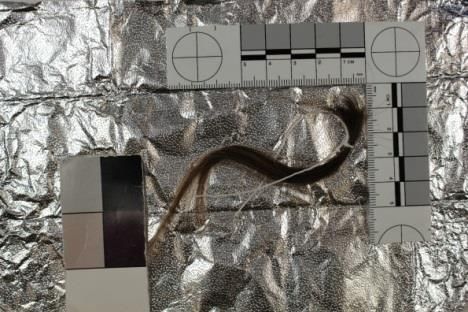
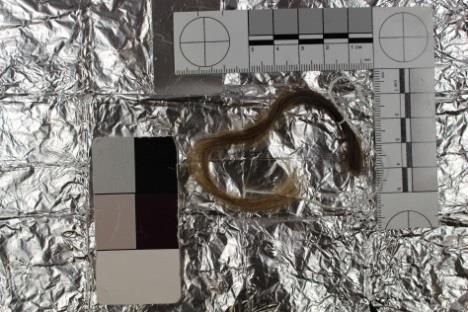
3.1.4.2. Forensic hair samples
Further exploration of the best working shampoo was performed on forensic hair samples. These samples
were selected by going through all the available stored real case samples, dated 2015 and 2016. Only those
containing a sufficient amount of head hair were suitable for further investigation. Information about these real
case samples is gathered in table 3.1. As these hair strands were previously analyzed and found to be positive, a
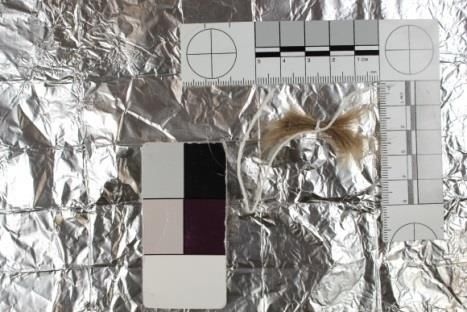
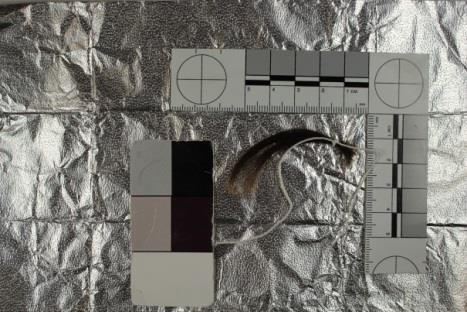
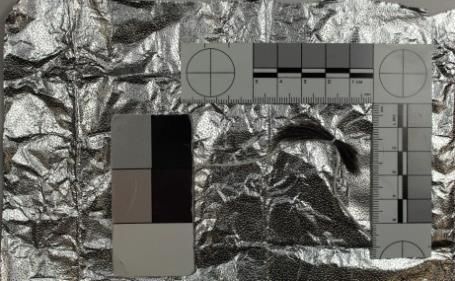
minimum EtG concentration of 7 pg/mg was assumed for each sample. Photos of the analyzed forensic hair
samples are included in the appendix, figure 8.1.
19You can also read