Examining the Social Context of Alcohol Drinking in Young Adults with Smartphone Sensing
←
→
Page content transcription
If your browser does not render page correctly, please read the page content below
121

Examining the Social Context of Alcohol Drinking in Young Adults
with Smartphone Sensing

LAKMAL MEEGAHAPOLA, Idiap Research Institute & EPFL, Switzerland
FLORIAN LABHART, Idiap Research Institute, Switzerland
THANH-TRUNG PHAN, Idiap Research Institute, Switzerland
DANIEL GATICA-PEREZ, Idiap Research Institute & EPFL, Switzerland
According to prior work, the type of relationship between a person consuming alcohol and others in the surrounding (friends,
family, spouse, etc.), and the number of those people (alone, with one person, with a group) are related to many aspects of
alcohol consumption, such as the drinking amount, location, motives, and mood. Even though the social context is recognized
as an important aspect that influences the drinking behavior of young adults in alcohol research, relatively little work has
been conducted in smartphone sensing research on this topic. In this study, we analyze the weekend nightlife drinking
behavior of 241 young adults in a European country, using a dataset consisting of self-reports and passive smartphone
sensing data over a period of three months. Using multiple statistical analyses, we show that features from modalities such as
accelerometer, location, application usage, bluetooth, and proximity could be informative about different social contexts of
drinking. We define and evaluate seven social context inference tasks using smartphone sensing data, obtaining accuracies of
the range 75%-86% in four two-class and three three-class inferences. Further, we discuss the possibility of identifying the
sex composition of a group of friends using smartphone sensor data with accuracies over 70%. The results are encouraging
towards supporting future interventions on alcohol consumption that incorporate users’ social context more meaningfully
and reducing the need for user self-reports when creating drink logs for self-tracking tools and public health studies.
CCS Concepts: • Human-centered computing → Empirical studies in HCI; Empirical studies in ubiquitous and
mobile computing; Smartphones; Mobile phones; Mobile devices; Empirical studies in collaborative and social computing;
• Computer systems organization → Sensors and actuators; • Applied computing → Consumer health; Health informatics;
Sociology; Psychology.
Additional Key Words and Phrases: passive sensing, smartphone sensing, nightlife, alcohol, drinking, social context, young
adults, mobile sensing, self-reports, interaction sensing, continuous sensing
ACM Reference Format:
Lakmal Meegahapola, Florian Labhart, Thanh-Trung Phan, and Daniel Gatica-Perez. 2021. Examining the Social Context of
Alcohol Drinking in Young Adults with Smartphone Sensing. Proc. ACM Interact. Mob. Wearable Ubiquitous Technol. 5, 3,
Article 121 (September 2021), 26 pages. https://doi.org/10.1145/3478126

1 INTRODUCTION
In western countries, alcohol consumption is a leading risk factor for mortality and morbidity [46]. The con-
sumption of several drinks in a row, commonly referred as binge drinking or heavy drinking, can lead to many
Authors’ addresses: Lakmal Meegahapola, lmeegahapola@idiap.ch, Idiap Research Institute & EPFL, Switzerland; Florian Labhart, florian@
idiap.ch, Idiap Research Institute, Switzerland; Thanh-Trung Phan, trungphan@idiap.ch, Idiap Research Institute, Switzerland; Daniel
Gatica-Perez, gatica@idiap.ch, Idiap Research Institute & EPFL, Switzerland.

Permission to make digital or hard copies of all or part of this work for personal or classroom use is granted without fee provided that
copies are not made or distributed for profit or commercial advantage and that copies bear this notice and the full citation on the first page.
Copyrights for components of this work owned by others than the author(s) must be honored. Abstracting with credit is permitted. To copy
otherwise, or republish, to post on servers or to redistribute to lists, requires prior specific permission and/or a fee. Request permissions from
permissions@acm.org.
© 2021 Copyright held by the owner/author(s). Publication rights licensed to ACM.
2474-9567/2021/9-ART121 $15.00
https://doi.org/10.1145/3478126

 Proc. ACM Interact. Mob. Wearable Ubiquitous Technol., Vol. 5, No. 3, Article 121. Publication date: September 2021.
121:2 • Meegahapola et al.

short-term adverse consequences not only for the person drinking (e.g., unprotected sex, injury, accidents or
blackouts [52]) but also at the family and community levels (e.g. violence, drunk driving [49, 58]). On a larger time
frame, heavy alcohol consumption can also lead to long-term consequences, such as poor academic achievement,
diminished work capacity, alcohol dependence and premature death [68]. Adolescence and early adulthood appear
as a particularly critical period of life for the development of risky alcohol-related behaviors since heavy alcohol
consumption in late adolescence appears to persist into adulthood [113]. In order to limit excessive drinking
among adolescents and young adults, it is essential to understand the etiology and antecedents of drinking
occasions [47]. Prior work in social and epidemiological research on alcohol has emphasized the importance of
the social context in shaping people’s alcohol use and motives [28, 47, 70] in the sense that the consumption
of alcohol or not, and the amounts consumed, vary depending on the presence or absence of family members
[85, 88, 109, 110], of friends or colleagues [26, 76, 82, 88], and of the spouse or partner [59, 61, 66]. Additionally, a
recent literature review showed that although the type of company is generally not a significant direct predictor
of alcohol-related harm, young adults tend to experience more harm, independent of increased consumption,
when they drink in larger groups [104].
 Recent developments in ambulatory assessment methods (i.e., the collection of data in almost real time, e.g.
every hour, and in the participant’s natural environment [97, 100]) using smartphones made it possible to assess
the type and the number of people present over the course of real-life drinking occasions [50, 53]. Compared to
cross-sectional retrospective surveys traditionally used in alcohol epidemiological and psychological research,
this type of approach allows to capture the interplay between drinking behaviors and contextual characteristics
at the drinking event level in more detail [51]. For instance, evidence shows that larger numbers of drinking
companions are associated with increased drinking amounts over the course of an evening or night [99, 106],
and that this relationship is mediated by the companions’ gender [107]. By repetitively collecting information
from the same individuals over multiple occasions, ambulatory assessment methods are able to capture a large
diversity of social contexts of real-life drinking occasions (e.g. romantic date with a partner, large party with
many friends, family dinner) with the advantages of being free of recall bias and of participants serving as their
own controls.
 In addition to the possibility of capturing in-situ self-reports, smartphone-based apps have the potential to
provide just-in-time adaptive interventions (JITAI) and feedback [71, 78]. Feedback systems primarily rely on
identifying users’ internal state or the context that they are in, to offer interventions or support (feedback) [45, 103].
Leveraging these ideas, recent studies in alcohol research have used mobile apps to provide interventions to
reduce alcohol consumption using questionnaires, self-monitoring, and location-based interventions [4, 36, 116].
Furthermore, mobile sensing research has used passive sensing data from wearables and smartphones to infer
aspects that could be useful in feedback systems, such as inferring drinking nights [92], inferring non-drinking,
drinking, and heavy drinking episodes [6], identifying walking under alcohol influence [40], and detecting drunk
driving [23]. Hence, given that the characteristics of the social context have been identified as central elements
of any drinking event, it appears as a central target for inferring drinking occasions. However, to the best of
our knowledge, mobile sensing has not been widely used to automatically infer the social context of alcohol
drinking events. To further understand the importance of identifying social context using mobile sensing, consider
the following example. If an app could infer a heavy-drinking episode (as shown by [6]), it could provide an
intervention. However, there is a significant difference between drinking heavily alone or with a group of friends
[32, 98]. Drinking several drinks in a row alone might indicate that the person is in emotional pain or stressed (also
known as "coping" drinking motive) [47, 98]. However, drinking several drinks is common when young adults go
for a night-out with friends [32]. In a realistic setting, for a mobile health app to provide useful interventions
or feedback, the knowledge of the social context, in addition to knowing that the user is in a heavy-drinking
episode, could be vital. Hence, understanding fine-grained contextual aspects related to alcohol consumption

Proc. ACM Interact. Mob. Wearable Ubiquitous Technol., Vol. 5, No. 3, Article 121. Publication date: September 2021.
Examining the Social Context of Alcohol Drinking in Young Adults with Smartphone Sensing • 121:3

using passive sensing is important, and could also open new doors in mobile interventions and feedback systems
for alcohol research.
 Further, there are a plethora of alcohol tracking, food tracking, and self-tracking applications in app stores, that
primarily rely on user self-reports [72, 75, 92]. Even though gaining a holistic understanding regarding eating or
drinking behavior is impossible without capturing contextual aspects regarding such behaviors, prior work has
shown that people tend to reduce the usage of apps that require a large number of self-reports, and tend to use
health and well-being applications that function passively [71]. Mobile sensing offers the opportunity to infer
attributes that otherwise require user self-reports, hence reducing user burden [71, 72, 74]. In addition, mobile
sensing could infer attributes to facilitate search acceleration in food/drink logging apps [39]. The social context
of drinking alcohol is a variable that could benefit from smartphone sensing in an alcohol tracking application.
As a whole, the idea of using smartphone sensing, in addition to capturing self-reports, is to gain a holistic
understanding regarding the user context passively, that could otherwise take a long time-span if collected using
self-reports. Considering all these aspects, We address the following research questions:

RQ1: What social contexts around drinking events can be observed by analyzing self-reports and smartphone
sensing data corresponding to weekend drinking episodes of a group of young adults?
RQ2: Can young adults’ social context of drinking be inferred using sensing data? What are the features that are
useful in making such inferences?
RQ3: Are social context inference models robust to different group sizes? Can mobile sensing features infer the
sex composition (same-sex, mixed-sex, opposite-sex), when drinking is done in a group of friends or colleagues?

 By addressing the above research questions, our work makes the following contributions:

Contribution 1: Using a fine-grained mobile sensing dataset that captures drinking event level data from 241
young adults in a European country, we first show that there are differences in self-reporting behavior among
men and women, regarding drinking events done with family members and with groups of friend/colleagues.
Next, using various statistical techniques, we show that features coming from modalities such as accelerometer,
location, bluetooth, proximity, and application usage are informative regarding different social contexts around
which alcohol is consumed.
Contribution 2: We first define seven social context types, based on the number of people in groups (e.g., alone,
with another person, with one or more people, with two or more people) and the relationship between the
participant and others in the group (e.g., family or relatives, friends or colleagues, spouse or partner). Then, based
on the above context types, we evaluate four two-class and three three-class inference tasks regarding the social
context of drinking, using different machine learning models, obtaining accuracies between 75% and 86%, with
all passive smartphone sensing data. In addition, we show that models that only take inputs from single sensor
modalities such as accelerometer and application usage, could still perform reasonably well across all seven social
context inferences, providing accuracies over 70%.
Contribution 3: For the specific case of drinking with friends or colleagues, we show that mobile sensor data
could infer the sex composition of groups (i.e. same-sex, mixed-sex, or opposite-sex) in a three-class inference
task, obtaining an accuracy of 75.8%.

 The paper is organized as follows. In Section 2, we describe the background and related work. In Section 3, we
describe the study design, data collection procedure, and feature extraction techniques. In Section 4 and Section 5,
we present a descriptive analysis and a statistical analysis of dataset features. We define and evaluate inference
tasks in Section 6. Finally, we discuss the main findings in Section 6, and conclude the paper in Section 7.

 Proc. ACM Interact. Mob. Wearable Ubiquitous Technol., Vol. 5, No. 3, Article 121. Publication date: September 2021.
121:4 • Meegahapola et al.

2 BACKGROUND AND RELATED WORK
2.1 The Social Context of Drinking Alcohol
While there are numerous definitions for the term social context in different disciplines, in this paper, we
borrow the concept commonly used in alcohol research [20, 47, 55, 70], which refers to either one or both of
the following aspects: (1) type of relationship: the relationship between an individual and the people in the
individual’s environment with whom she or he is engaging, and (2) number of people: the number of people
belonging to each type of relationship, with whom the individual is engaging. By combining the two aspects, a
holistic understanding of the social context of drinking of an individual can be attained.
 The consumption of alcohol is associated with different contextual characteristics. These characteristics include
the type of setting (e.g., drinking location), its physical attributes (e.g., light, temperature, furniture), its social
attributes (e.g., type, size, and sex-composition of the drinking group, on-going activities), and the user’s attitudes
and cognition [70]. Applied to real-life situations, this conception underlines the changing nature of the drinking
context, in the sense that the variety of situations during which alcohol might be consumed is rather large. For
instance, across three consecutive days, the same person might drink in a restaurant during a date with a romantic
partner, join a large party at a night club with many attendees, and finally, join a quiet family dinner at home.
 Among all contextual characteristics, the composition of the social context is a central element of any drinking
occasion, since the consumption of alcohol is predominantly a social activity for non-problematic drinkers [98].
Among adolescents and young adults, previous literature has shown that amounts of alcohol consumed on any
specific drinking occasion vary depending on the type and number of people present [20]. The type of relationship
that received the most attention so far is the presence of friends, in terms of number and of sex composition.
Converging evidence shows that the likelihood of drinking [11] and drinking amounts are positively associated
with the size of the drinking group [30, 99, 106]. Unfortunately, the group size is generally used as a continuous
variable, preventing the identification of a threshold at which the odds of drinking in general or drinking heavily
increase. Evidence regarding the sex composition of the group, however, provided mixed results, with some
studies indicating that more alcohol is consumed in mixed-sex groups [65, 107] while others suggesting that this
might rather be the case in same-sex groups [2]. The influence of the presence of the partner (e.g. boyfriend or
girlfriend) within a larger drinking group has not been investigated, but evidence suggests that alcohol is less
likely to be consumed and in lower amounts in a couple situation (i.e., the presence of the partner only) [38, 107].
It should be noted that these studies only suggest correlational links between the contextual characteristics and
drinking behaviors and should not be interpreted as causal relationships.
 The presence or absence of members of the family also play an important role in shaping adolescents and
young adults’ drinking behaviors. In particular, the presence of parents and their attitude towards drinking are
often described as being either limiting or facilitating factors, but evidence in this respect is inconclusive. For
instance, the absence of parental supervision was found to be associated to an increased risk for drinking at
outdoor locations and young adults’ home [108] suggesting that their presence might decrease this risk. However,
another study shows that parents’ knowledge about the happening of a party is negatively associated with the
presence of alcohol, but there was no relationship between whether a parent was present at the time of the party
and the presence of alcohol [29]. Lastly, parents might also facilitate the use of alcohol by supplying it, especially
to underage drinkers [31, 38]. To sum up, evidence on the impact of the presence or absence of parents on young
people’s drinking appears mixed as this might be related to their attitude towards drinking, with some parents
being more tolerant or strict than others [83]. Lastly, it should be noted that the presence of siblings has rarely
been investigated, but unless they have a supervision role in the absence of parents, their role within the drinking
group might be similar to one of friends.

Proc. ACM Interact. Mob. Wearable Ubiquitous Technol., Vol. 5, No. 3, Article 121. Publication date: September 2021.
Examining the Social Context of Alcohol Drinking in Young Adults with Smartphone Sensing • 121:5

2.2 Alcohol Consumption and Mobile Phones
2.2.1 Mobile Apps for Interventions in Alcohol Research. Many mobile apps in alcohol research focus on providing
interventions or feedback to users to reduce alcohol consumption [21, 25, 36]. Crane et al. [21] conducted a
randomized controlled trial using the app called "Drink Less", to provide interventions. This app relied on user
self-reports, and they concluded that the app helped reduce alcohol consumption. Moreover, Davies et al. [25]
conducted a randomized controlled trial with an app called "Drinks Meter", that provided personalized feedback
regarding drinking. This app also used self-reports to provide feedback. Similarly, many mobile health applications
in alcohol research that provide users with interventions or feedback, primarily used self-reports [15, 37, 81].
Regarding sensing, Gustafson et al. [36] deployed an intervention app called ACHESS, that provided computer-
based cognitive behavioral therapy and additional links to useful websites, and this app provided interventions
to users when they entered pre-defined high-risk zones, primarily relying on location sensing capabilities of
the smartphone. LBMI-A [27] by Dulin et al. is another study that is similar to ACHESS. As a summary, alcohol
epidemiology research that used mobile apps primarily targeted interventions based on self-reports or simple
sensing mechanisms. Even though many studies have identified that self-reports are reasonably accurate to
capture alcohol consumption amounts [64], studies have also stated that heavy-drinking episodes are often
under-reported when self-reporting [80]. In addition, unless there is a strong reason for users to self-report, there
is always the risk of users losing motivation to use the app over time.

2.2.2 Smartphone Sensing for Health and Well-Being. Smartphones allow sensing health and well-being aspects
via continuous and interaction sensing techniques, both of which are generally called passive sensing [71]. This
capability has been used in areas such as stress [13, 67], mood [62, 102], depression [14, 112], well-being [57, 63],
and eating behavior [12, 72, 74]. If we consider drinking related research in mobile sensing, Bae et al. [6] conducted
an experiment with 30 young adults for 28 days, and used smartphone sensor data to infer non-drinking, drinking,
and heavy-drinking episodes with an accuracy of 96.6%. They highlighted the possibility of using such inferences
to provide timely interventions. Santani et al. [92] deployed a mobile sensing application among 241 young
adults for a period of 3 months, to collect sensor data around weekend nightlife events. They showed that sensor
features could infer drinking and non-drinking nights with an accuracy of 76.6%. Kao et al. [40] proposed a
phone-based system to detect feature anomalies of walking under the influence of alcohol. Further, Arnold et al.
[3] deployed a mobile application called Alco Gait, to classify the number of drinks consumed by a user into sober
(0-2 drinks), tipsy (3-6 drinks) or drunk (greater than 6 drinks) using gait data, obtaining reasonable accuracies.
While most of these studies focused on detecting drinking events/episodes/nights, we focus on inferring the
social contexts of drinking events.

2.2.3 Event Detection and Event Characterization in Mobile Sensing. Smartphone sensing deployments can be
classified into two based on the study goal [71]: (a) Event Detection (e.g. drinking alcohol, eating food, smoking,
etc.) and (b) Event Characterization (characteristics of the context that helps understand the event better – e.g.
social context, concurrent activities, ambiance, location, etc.). For domains such as eating behavior, there are
studies regarding both event detection (identifying eating events [9, 77], inferring meal or snack episodes [12],
inferring food categories [73]) and event characterization (inferring the social context around eating events [72]).
Inferring mood [62, 96] as well as identifying contexts around specific moods [24] has been attempted in ubicomp.
However, even though alcohol epidemiology researchers have attempted to characterize alcohol consumption to
gain a more fine-grained understanding about drinking, mobile sensing research has not been focused on the
social context aspect thus far, even though some studies have looked into event detection [3, 6, 40, 92]. Hence, we
aim to address this research gap by focusing on the social context of drinking alcohol using smartphone sensing.

 Proc. ACM Interact. Mob. Wearable Ubiquitous Technol., Vol. 5, No. 3, Article 121. Publication date: September 2021.
121:6 • Meegahapola et al.

3 DATA, FEATURES, AND TASKS
3.1 Mobile Application, Self-Reports, and Passive Sensing
We obtained a dataset regarding young adults’ nightlife drinking behavior, from our previous work [92]. This
dataset contains smartphone sensor data and self-reports regarding the drinking behavior of a 241 young adults
(53% men) in Switzerland, during weekend nights, throughout a period of three months, and was collected as
a collaboration between alcohol researchers, behavioral scientists, and computer scientists. In this section, we
briefly describe the study design, the data collection procedure, and feature extraction technique. A full description
regarding the ethical approval, deployment, and the data collection procedure can be found in [1, 92, 93].

3.1.1 Mobile App Deployment. To collect data from study participants, an android mobile application was
deployed, and this app had two main components: (a) Drink Logger: used to collect in-situ self-reports during
weekend nights (Friday and Saturday nights, from 8.00pm to 4.00am next day). The app sent notifications
hourly, asking whether users wanted to report a new drink; and (b) Sensor Logger: used many passive sensing
modalities to collect data, including both continuous (accelerometer, battery, bluetooth, location, wifi) and
interaction (applications, screen usage) sensing. The application was deployed from September to December
2014. The study participants were young adults with ages ranging from 16 to 25 years old (mean=19.4 years old,
SD=2.5). More details regarding the deployment can be found in [92].

3.1.2 Self-Reports. Whenever they were about to drink an alcoholic or non-alcoholic drink, participants were
requested to take a picture of it and to describe its characteristics and the drinking context using a series of
self-reported questionnaires [54]. Participants labeled the drink type using a list of 6 alcoholic drinks (e.g. beer,
wine, spirits, etc.) and 6 non-alcoholic drinks (e.g. water, soda, coffee, etc.). Then, in accordance with the definition
of social context we adopted in Section 2.1, participants reported the type and number of people present for
each of the following categories: (a) partner or spouse; (b) family or relatives; (c) male friends or colleagues;
(d) female friends or colleagues; and (e) other people (called type of relationship in the remainder of the paper).
These five categories were adopted from prior work in alcohol research [55]. Next, for each type of relationship,
participants reported the number of people using a 12-point scale with 1-point increments from 0 to 10, plus ‘more
than 10’; with the exception of partner or spouse which could either be absent (coded as 0) or present (1). This
scale was designed to measure variations in the social context, following the assumption that the presence of each
person counts within small groups, but that the additional value of each extra person is less important within
larger groups (e.g. 10 or more people). Further, information about participants including age, sex, occupation,
education level, and accommodation were collected in a baseline questionnaire. Overall, by selecting self-reports
of situations when participants reported the consumption of an alcoholic drink, we were left with 1254 self-reports
for the analysis.

3.1.3 Passive Smartphone Sensing. To gain a fine-grained understanding about users’ drinking behavior, passive
sensing data were collected during the same time period when participants self-reported alcohol consumption
events. The chosen sensing modalities were Accelerometer (ACC), Applications (APP), Location (LOC), Screen
(SCR), Battery (BAT), Bluetooth (BLU), Wifi (WIF), and Proximity (PRO). A dataset summary is given in Table 1
and an extensive description is given in [86, 92].

3.2 Aggregation and Matching of Self-Reports and Passive Sensing Data
Prior studies that used this dataset primarily considered user-night as the point of analysis (e.g., inferring nights
of alcohol consumption vs. no alcohol consumption [92], inferring heavy-drinking nights [86], etc.). However,
in this study, we consider drink-level data, that is more fine-grained. We prepared the self-report dataset such

Proc. ACM Interact. Mob. Wearable Ubiquitous Technol., Vol. 5, No. 3, Article 121. Publication date: September 2021.
Examining the Social Context of Alcohol Drinking in Young Adults with Smartphone Sensing • 121:7

Table 1. Summary of features extracted from mobile sensors (134). Sensor data are aggregated for every 10-minute time slot
from 8pm to 4am. For all the given features, average, minimum, and maximum were calculated during the matching phase,
hence resulting in a total of 402 sensing features for each alcohol consumption event.

 Sensor Sensor Description
 – Feature Type (# of features) Feature Description
 Location data were continuously collected for a time period of 1-minute during each 2-minute time slot. Collected
 Location
 data included data source, longitude, latitude, signal strength, and accuracy.
 – Attributes (10) {min., max., med., avg., std.} of avg. of speed and sensor accuracy
 – Signal (3) 3 signal strengths (GPS, network, unknown)
 Values from all three axes of the sensor were collected, 10 seconds continuously, at a frequency of 50Hz, during
 every minute. we calculated (a) basic statistics from raw sensor data from the X, Y, and Z-axes [92]; (b) aggregated
 Accelerometer
 statistics related to acceleration (m, mNew, dm) and signal magnitude area (mSMA) by combining data from three
 axes [41, 69, 86]; and (c) angle between acceleration and the gravity vector [86, 92].
 – Raw (15) {min., max., med., avg., std.} of avg. of xAxis, yAxis, zAxis of accelerometer
 – Angle (15) {min., max., med., avg., std.} of angle of xAxis, yAxis, zAxis with g vector
 – Dynamic (20) {min., max., med., avg., std.} of mSMA, dm, m, mNew values
 The list of available devices was captured as Bluetooth logs, once every 5 minutes. Features such as the number of
 Bluetooth
 devices around, signal strengths, and empty scan counts were captured.
 – Count (4) number of bluetooth IDs surrounding devices, records, bluetooth scan count, empty scan count
 – Strength (5) {min., max., med., avg., std.} of bluetooth strength signal of surrounding devices
 The list of available devices was captured as WiFi logs, once every 5 minutes. Features such as the number of
 Wifi
 hotspots around, signal strengths, and the empty scan counts were captured.
 – Count (2) wifi record , wifi id set
 – Attributes (10) {min., max., med., avg., std.} of level, frequency of wifi hotspot
 Applications were categorized into 33 groups (e.g., art & design, food & drink, social, games, etc.) based on the
 Application categorization provided in google play store [33]. Using the categories and running apps, statistics such as the
 total number of running apps and the number of running apps based on categories were calculated [62, 86, 92].
 – Count (2) app count, app record
 – Category (33) normalized 33-bin histogram of 33 application categories
 Proximity Several statistical featured were derived using raw values of the proximity sensor.
 – Count (1) proximity records
 – Distance (5) {min., max., med., avg., std.} of distance from phone to objects
 Battery levels were captured once every five minutes, and status changes were captured whenever a change
 Battery occured. Hence, several features including battery full, discharging, charging, battery level, and whether the
 phone is plugged-in or not were derived.
 – Status (5) 5 battery statuses
 – Level (5) {min., max., med., avg., std.} of battery level
 – Count (2) count of battery records and plugged times
 Screen data were recorded whenever the screen status changed. Using the captured data, we derived the percentage
 Screen
 of screen-on time.
 – Usage (1) percentage of screen on time

that each entry corresponds to a drinking event. Then, to combine sensor data and self-reports in a meaningful
manner, we used the following two-phase technique, that was adopted from prior ubicomp research [5, 12, 72, 96]:
 Phase 1 (Aggregation): We aggregate raw sensor data for every ten-minute window throughout the night.
Different techniques were used for the aggregation for sensors. Hence, for a user-night, we have 48 ten-minute
windows, from 8.00pm to 4.00am next day. For each feature derived from each sensor, we have 48 values (6
ten-minute windows per hour X eight hours per night) for a user-night. For instance, if there is a feature F1
derived from sensor S1 , for each for each user and for each night, F1 would have 48 values, that represent time
windows from 8.00pm-8.09pm, 8.10pm-8.19pm, 8.20pm-8.29pm, until 03.50am-03.59am of next day.
 Phase 2 (Matching): During this phase, features are matched to alcohol consumption self-reports using a
one-hour window (approximately, from 30 minutes before the alcohol consumption self-report, to 30 minutes after
the drinking self-report). For instance, if the drinking was reported at 10.08pm, we calculate the average (_avg),
maximum (_max), and minimum (_min) values for each feature using values corresponding to six ten-minute

 Proc. ACM Interact. Mob. Wearable Ubiquitous Technol., Vol. 5, No. 3, Article 121. Publication date: September 2021.
121:8 • Meegahapola et al. Fig. 1. A schematic diagram representing the summary of the study Fig. 2. Diagram summarizing the two-phase technique for combining self-reports and sensing data windows (obtained in Phase 1) from 9.40pm to 10.39pm, and match those value to the self-report. The idea behind this aggregation is to capture sensor data around drinking events, expecting that contextual cues could be informative of different social contexts. The summary of passive sensing features is provided in Table 1. These features were derived for every ten-minute time slot throughout the night, as discussed in Phase 1 (Aggregation), resulting in a total of 134 features. Then, in accordance with the procedure in Phase 2 (Matching), a one-hour time window around each drinking self-report was considered. By considering the average, minimum, and maximum of the six values corresponding to the one-hour time window, 402 passive sensing features were included for each alcohol drinking self-report in the final dataset. This two-phase technique is summarized in Figure 2. After following this technique for all self-reports and sensor features, we obtained a dataset. We removed data points with incomplete sensor data (152 records with unavailable sensor data, mainly location, wifi, or bluetooth data), not enough data for the matching phase (102 records, for drinking events that were done between 8.00pm-8.30pm and 3.30am-4.00am), and self-reports that were produced while visiting other countries (59 records, when the participant traveled while being in the study). The final dataset contained 941 complete drinking reports with sensor features. 3.3 Deriving Two-Class and Three-Class Social Context Features In Section 2, we described how social contexts such as being with/without family members, friends/colleagues, and spouse/partner could be associated with drinking behavior. In addition, under Section 3.1.2, we described the type of social contexts reported by participants. Among them, features such as with male friends/colleagues, with female friends/colleagues, and with family members had twelve-point scales, and with partner/spouse had a two-point scale. However, for the purpose of this analysis, we reduced the twelve-point scale to low-dimensional scales (two-point and three-point), with the objective of capturing social context group dynamics, that are meaningful in terms of drinking events such as: being alone, with another person, or in a group of two or more. We followed the following steps. First, except for the feature with partner or spouse which is already two-class, we minimized the scale of other features to two-classes and three-classes. For two-class features, the values could be either zero or one, whereas – zero: the participant is not with anyone belonging to the specific social context; and one: the participant is with one or more others belonging to the specific social context (hence, in a group). For three-class features, the values could be either zero, one, or two as follows – zero: the participant is not with anyone belonging to the specific social context; one: the participant is with one other person belonging to the specific social context (hence, in a group of two people); two: the participant is with two or more people belonging to the specific social context (hence, in a larger group). Then, we derived several new features using the existing features: Proc. ACM Interact. Mob. Wearable Ubiquitous Technol., Vol. 5, No. 3, Article 121. Publication date: September 2021.
Examining the Social Context of Alcohol Drinking in Young Adults with Smartphone Sensing • 121:9

 Table 2. Summary of social contexts in the final dataset.

 Social Context Classes Interpretation
 family 2 without vs. with one/more family members/relatives
 partner 2 without vs. with the partner/spouse
 friends 2 without vs. with one/more friends/colleagues
 people 2 without vs. with one/more people
 family ℎ 3 without vs. with one vs. with two/more family members/relatives
 friends ℎ 3 without vs. with one vs. with two/more friends/colleagues
 people ℎ 3 without vs. with one vs. with two/more people

Fig. 3. Distribution of original self-report features (family, Fig. 4. Self-Reports in terms of Age
friends) and a derived feature (people)

 • without friends/colleagues vs. with friends/colleagues (two-class): this aggregated features about men and
 women friends/colleagues into a single two-class variable by discarding the sex demographic attribute of
 friends/colleagues.
 • without friends/colleagues vs. with another friend/colleague vs. with two/more friends/colleagues (three-class):
 this aggregated features about the men and women friends/colleagues into a single three-class feature.
 • without people vs. with people (two-class): this feature combines all the two-class social contexts to estimate
 the overall two-class social context of the user.
 • without people vs. with another person vs. with two/more people (three-class): this feature combines all the
 other three-class social contexts and the two-class feature with partner/spouse, to estimate the overall
 three-class social context of the user.
 The final set of social context features used for this study are summarized in Table 2. In accordance with the
definition of social context proposed in Section 3.3, these features capture two aspects. First, they capture the
relationships between the study participant and people engaging with the participant during alcohol consumption.
Second, they capture group dynamics for each relationship (e.g., alone, with another person – small group of two
people, with two/more people – comparatively large group, etc.). According to prior work in alcohol research,
both perspectives are important to obtain a fine-grained understanding about drinking behavior [8, 70]. The
summary of our analytical setting is presented in Figure 1.

4 DESCRIPTIVE ANALYSIS (RQ1)
In this section, we provide a descriptive analysis regarding self-reports using demographic information, to
understand the nature of the aggregate drinking behavior of participants.
 Self-Report Distribution Breakdown Based on Social Contexts: Figure 3 provides a distribution of self-reports.
Self-reports for partner is not shown here because it is only a binary response, and is included in Figure 5.

 Proc. ACM Interact. Mob. Wearable Ubiquitous Technol., Vol. 5, No. 3, Article 121. Publication date: September 2021.
121:10 • Meegahapola et al.

 Fig. 5. Distribution of two-class social contexts Fig. 6. Distribution of three-class social contexts

Fig. 7. Self-Reports in terms of Sex and Two-Class Social Fig. 8. Self-Reports in terms of Sex and Three-Class Social
Context Context

Figure 5 and Figure 6 provide a distribution of self-reports for four two-class social contexts and three three-class
social contexts, respectively. Results in Figure 5 show that only 47 (5.0%) drinking occasions were done alone as
compared to 894 (95.0%) occasions that were done with one/more people. Out of these 894 reports, 799 (89.4%)
were reported to have happened with two/more friends/colleagues. According to Figure 6, these 799 reports
consist of 113 (14.1%) reports that were done with one friend/colleague and 686 (85.9%) reports that were done
with two/more friends/colleagues, hence in a larger group. As a summary, participants consumed alcohol while
being alone only on a small portion of occasions. This result is comparable to prior alcohol research, which shows
that solitary drinking episodes are less frequent as compared to other social contexts [8]. Moreover, the presence
of two or more friends/colleagues was reported well over more than half of all drinking occasions (686/941 =
72.9%). This result too is in line with prior work that state that young adults tend to drink alcohol for social
facilitation and peer acceptance [8].
 Self-Report Distribution Breakdown Based on Sex: In Figure 7 and Figure 8, we present distributions of self-reports,
based on sex and social context pairs. Results indicate that social contexts ’people’ and ’friends’ reported more
drinking occasions with one/more people, for both men and women, whereas social contexts ’partner’ and ’family’
have significantly high number of drinking drinking events that were reported to be done alone. In addition,
for the social context ’friends’, Figure 8 shows that the proportion of self-reports in groups of two/more (239) is
just over half for women (239/416 = 57.5%), whereas for men, drinking events with two/more friends/colleagues
is 75.6% (397/525), which is almost a 20% difference for two sexes. This suggests that men reported a higher
proportion of drinking occasions in groups of two/more people. This result is consistent with prior literature that
state that men tend to drink in larger social contexts (specially with friends/colleagues) whereas women are less
likely to do so [108]. Further, women participants have reported drinking with family members 99 times (99/416
= 23.8%), whereas men only reported to have done so 81 times (81/525 = 15.4%), that is about 9% less than women.

Proc. ACM Interact. Mob. Wearable Ubiquitous Technol., Vol. 5, No. 3, Article 121. Publication date: September 2021.
Examining the Social Context of Alcohol Drinking in Young Adults with Smartphone Sensing • 121:11

Table 3. Pearson Correlation Co-efficient (PCC) and Point-Biserial Correlation Co-efficient (PBCC) for Sensor Features and
Social Contexts (two-class and three-class). With the top 5 features for each Social Context are included in the table. p-values
are denoted with the following notation: p-value≤10−4 :****; p-value≤10−3 :***
 .
 family partner friends alone
 Feature (Sensor) PBCC Feature (Sensor) PBCC Feature (Sensor) PBCC Feature (Sensor) PBCC
 angleXMax_min (ACC) 0.19 (+) **** yAxisAvgMax_avg (ACC) 0.14 (-) **** mMean_avg (ACC) 0.22 (+) **** mMed_max (ACC) 0.19 (+) ****
 angleXMed_min (ACC) 0.19 (+) **** food_and_drink_avg (APP) 0.13 (+) *** mSMAMean_avg (ACC) 0.22 (+) **** mSMAMed_max (ACC) 0.19 (+) ****
two-class

 angleYAvg_min (ACC) 0.18 (+) **** food_and_drink_min (APP) 0.12 (+) *** mMed_max (ACC) 0.22 (+) **** mMean_max (ACC) 0.19 (+) ****
 angleXAvg_min (ACC) 0.18 (+) **** food_and_drink_min (APP) 0.12 (+) *** mSMAMed_max (ACC) 0.22 (+) **** mSMAMean_max (ACC) 0.19 (+) ****
 angleYMax_min (ACC) 0.18 (+) **** zAxisAvgMin_avg (ACC) 0.12 (+) *** mMax_avg (ACC) 0.21 (+) **** dmListStd_max (ACC) 0.18 (+) ****
 Feature (Sensor) PCC - - Feature (Sensor) PCC Feature (Sensor) PCC
 angleXMed_min (ACC) 0.18 (+) **** - - mMean_avg (ACC) 0.24 (+) **** mMean_avg (ACC) 0.23 (+) ****
three-class

 angleXMax_min (ACC) 0.18 (+) **** - - mSMAMean_avg (ACC) 0.24 (+) **** mSMAMean_avg (ACC) 0.23 (+) ****
 angleYAvg_min (ACC) 0.18 (+) **** - - mMed_avg (ACC) 0.23 (+) **** yAxisAvgMin_min (ACC) 0.23 (-) ****
 angleYMin_min (ACC) 0.17 (+) **** - - mSMAMed_avg (ACC) 0.23 (+) **** mMean_max (ACC) 0.23 (+) ****
 angleXMean_min (ACC) 0.17 (+) **** - - mSMAMax_avg (ACC) 0.23 (+) **** mSMAMean_max (ACC) 0.23 (+) ****

 Self-Report Distribution Breakdown Based on Age: As shown in Figure 4, participants’ age ranged from 16
to 25. Except for ages 23 and 24 (31 and 29 self-reports, respectively), all other ages had over 70 self-reports.
Moreover, the highest proportion of situations with one/more friends/colleagues (115/121 = 95.0%) was reported
by participants aged 25. The lowest proportion of situations with partner/spouse (0%) was reported by the same
age group.

5 STATISTICAL ANALYSIS (RQ1)
5.1 Pearson and Point-Biserial Correlation for Social Contexts and Passive Sensing Features
We conducted Pearson (PCC) [105] and Point-biserial (PBCC) [10] correlation analyses to measure the strength
and the direction of the relationships between each of the three-class (takes values 0,1, and 2) and two-class (takes
values 0 and 1) features and passive sensing features. The results of the top five features with the highest PCC or
PBCC with each social context are summarized in Table 3. For a majority of social contexts (family , family ℎ ,
friends , friends ℎ , people , and people ℎ ), multiple accelerometer-related features were among the top
five features based on the correlation co-efficient values. The exception is the social context partner , where
application features (e.g. food and drink) were among the top five. However, most of the values suggested, at best,
weak positive or negative relationships.

5.2 Statistical Analysis of Dataset Features
Table 4 shows statistics such as t-statistic [43], p-value [34], and Cohen’s-d (effect size) with 95% confidence
interval (CI) [56] for the top five features in the dataset for the seven different social contexts. For two-class social
contexts, the objective is to identify passive sensing features that help discriminate between: without people
(alone) and with one/more people (group). Here, the term group is used because it could either be a small group of
two to three people, or a large group of more than ten people. Further, for three-class social contexts, the objective
is to identify passive sensing features that help discriminate between: (a) without people (alone) vs. with one
person (sgroup); (b) with one person (sgroup) vs. with two/more people (lgroup); and (c) without people (alone)
vs. with two/more people (lgroup), where sgroup and lgroup stands for small group and large group, respectively.
The features are ordered by the descending order of t-statistics and Cohen’s-d values. In addition, prior work
stated the lack of sufficient informativeness in p-values [60, 115]. For this reason, we calculated the Cohen’s-d
[89] to measure the statistical significance of features. We adopted the following rule-of-thumb, commonly used
to interpret Cohen’s-d values: 0.2 = small effect size; 0.5 = medium effect size; and 0.8 = large effect size. According
to this notion, the higher the value of Cohen’s-d, the higher the possibility of discerning the two groups using the

 Proc. ACM Interact. Mob. Wearable Ubiquitous Technol., Vol. 5, No. 3, Article 121. Publication date: September 2021.
121:12 • Meegahapola et al.

Table 4. t-statistic (T) (p-value≤10−4 :****; p-value≤10−3 :***; p-value≤10−2 :**), and Cohen’s-d (C) with 95% confidence
intervals (* if confidence interval include zero). Top five features are shown in decreasing order.

 Feature T Feature C Feature T Feature C
 family ℎ friends ℎ
alone vs. sgroup

 alone vs. sgroup
 blueStrengthMax_avg (BLU) 4.41**** blueStrengthMed_avg (BLU) 0.42 yAxisAvgMin_max (ACC) 4.05**** dmListMean_max (ACC) 0.37
 blueStrengthAvg_avg (BLU) 4.21**** zAxisAvgStd_min (ACC) 0.41 xAxisAvgStd_avg (ACC) 3.76*** xAxisAvgStd_avg (ACC) 0.34
 blueStrengthMed_avg (BLU) 4.21**** mMin_min (ACC) 0.41 anglexStd_avg (ACC) 3.72*** anglexStd_avg (ACC) 0.33
 blueStrengthMin_avg (BLU) 3.87*** dmListStd_min (ACC) 0.40 xAxisAvgStd_max (ACC) 3.65*** dmListMedian_max (ACC) 0.33
 blueStrengthMax_min (BLU) 2.71** zAxisAvgMean_min (ACC) 0.40 yAxisAvgMax_avg (ACC) 3.55*** angleyMin_max (ACC) 0.32
alone vs. lgroup sgroup vs. lgroup

 alone vs. lgroup sgroup vs. lgroup
 zAxisAvgMean_min (ACC) 3.22** dmListMean_min (ACC) 0.38 mMedian_avg (ACC) 3.44*** yAxisAvgMin_avg (ACC) 0.38
 zAxisAvgMedian_min (ACC) 3.08** zAxisAvgStd_min (ACC) 0.36 mMean_avg (ACC) 3.43*** yAxisAvgMean_avg (ACC) 0.35
 video_players_min (APP) 2.84** anglezMax_min (ACC) 0.34 mSMAMedian_avg (ACC) 3.41*** yAxisAvgMedian_avg (ACC) 0.35
 zAxisAvgMax_avg (ACC) 2.71** system_avg (APP) 0.32 mSMAMean_avg (ACC) 3.41*** mMax_min (ACC) 0.33
 video_players_avg (APP) 2.70** zAxisAvgMax_avg (ACC) 0.32 mNewStd_avg (ACC) 3.15*** mMedian_avg (ACC) 0.33

 system_min (APP) 5.83**** mMin_min (ACC) 0.49 mMean_avg (ACC) 8.61**** mMean_avg (ACC) 0.56
 anglexMax_min (ACC) 5.64**** zAxisAvgStd_min (ACC) 0.49 mSMAMean_avg (ACC) 8.60**** mSMAMean_avg (ACC) 0.56
 anglexMedian_min (ACC) 5.64**** anglezMedian_min (ACC) 0.48 mMedian_max (ACC) 8.44**** mMedian_max (ACC) 0.55
 angleyMean_min (ACC) 5.55**** anglexMax_min (ACC) 0.47 mSMAMedian_max (ACC) 8.40**** mSMAMedian_avg (ACC) 0.55
 angleyMin_min (ACC) 5.54**** zAxisAvgMean_min (ACC) 0.46 mMax_avg (ACC) 8.40**** mMax_avg (ACC) 0.54

 people ℎ people
alone vs. sgroup

 alone vs. group
 mSMAMedian_max (ACC) 3.81*** zAxisAvgMedian_max (ACC) 0.41 yAxisAvgMin_max (ACC) 4.05**** dmListMean_max (ACC) 0.37
 mMedian_max (ACC) 3.81*** xAxisAvgStd_max (ACC) 0.41 xAxisAvgStd_avg (ACC) 3.76*** xAxisAvgStd_avg (ACC) 0.34
 anglexStd_max (ACC) 3.79*** xAxisAvgMedian_min (ACC) 0.40 anglexStd_avg (ACC) 3.72*** anglexStd_avg (ACC) 0.33
 xAxisAvgStd_max (ACC) 3.63*** xAxisAvgMean_max (ACC) 0.40 xAxisAvgStd_max (ACC) 3.65*** dmListMedian_max (ACC) 0.33
 mMean_max (ACC) 3.60*** angleyMax_max (ACC) 0.38 yAxisAvgMax_avg (ACC) 3.55*** angleyMin_max (ACC) 0.32
 family
sgroup vs. lgroup

 alone vs. group

 yAxisAvgMin_min (ACC) 5.30**** mNewStd_avg (ACC) 0.43 anglexMax_min (ACC) 6.82**** mMin_min (ACC) 0.46
 yAxisAvgMin_avg (ACC) 5.11**** mMean_avg (ACC) 0.42 anglexMedian_min (ACC) 6.82**** zAxisAvgStd_min (ACC) 0.46
 yAxisAvgMean_min (ACC) 5.10**** mSMAMean_avg (ACC) 0.42 angleyMean_min (ACC) 6.64**** anglezMedian_min (ACC) 0.44
 yAxisAvgMedian_min (ACC) 5.07**** mSMAMax_avg (ACC) 0.42 anglexMean_min (ACC) 6.49**** dmListStd_min (ACC) 0.43
 yAxisAvgMax_min (ACC) 4.18**** mMax_avg (ACC) 0.41 angleyMax_min (ACC) 6.42**** zAxisAvgMean_min (ACC) 0.43
 partner
alone vs. lgroup

 alone vs. group

 yAxisAvgMin_min (ACC) 7.44**** xAxisAvgStd_max (ACC) 0.77 food_and_drink (APP) 4.55**** yAxisAvgMax_avg (ACC) 0.43
 zAxisAvgMin_min (ACC) 6.76**** zAxisAvgMedian_max (ACC) 0.77 food_and_drink (APP) 4.54**** zAxisAvgMin_avg (ACC) 0.33
 xAxisAvgMin_min (ACC) 6.63**** angleyMax_max (ACC) 0.75 food_and_drink (APP) 4.55**** proximityRecord_avg (PRO) 0.29
 yAxisAvgMedian_min (ACC) 6.54**** anglezMin_max (ACC) 0.75 zAxisAvgMin_avg (ACC) 4.17**** yAxisAvgStd_avg (ACC) 0.27
 yAxisAvgMean_min (ACC) 6.31**** mMedian_avg (ACC) 0.73 zAxisAvgMean_avg (ACC) 3.35**** angleyStd_avg (ACC) 0.27
 friends
 alone vs. group

 - - - - mMean_avg (ACC) 8.10**** mMean_avg (ACC) 0.52
 - - - - mSMAMean_avg (ACC) 8.08*** mSMAMean_avg (ACC) 0.52
 - - - - mMedian_max (ACC) 7.97**** mMedian_avg (ACC) 0.50
 - - - - mSMAMedian_max (ACC) 7.94**** mSMAMedian_avg (ACC) 0.50
 - - - - mMax_avg (ACC) 7.89**** yAxisAvgStd_max (ACC) 0.50

feature. In addition, 95% confidence intervals for Cohen’s-d were calculated, and if the interval does not overlap
with zero, the difference can be considered as significant [60].
 For the social context family ℎ , features from the bluetooth sensor were among the top five in terms of
t-statistic and Cohen’s-d, for the combination alone vs. sgroup. In addition, all the top five features had Cohen’s-d
values closer to medium effect size. Further, a total of 122 features had Cohen’s-d values above small effect size and
confidence intervals not including zero. For the combinations sgroup vs. lgroup and alone vs. lgroup, the majority
of features were from the accelerometer and two features (video_player and system) were from application
usage. In addition, if the hierarchy of the social contexts alone, sgroup, and lgroup is considered, sgroup is in the
middle, sandwiched by alone and lgroup, that are further apart, hence, it would be easier to discern between
these two groups. This is indicated in the results for the combination alone vs. lgroup, that have higher t-statistics

Proc. ACM Interact. Mob. Wearable Ubiquitous Technol., Vol. 5, No. 3, Article 121. Publication date: September 2021.
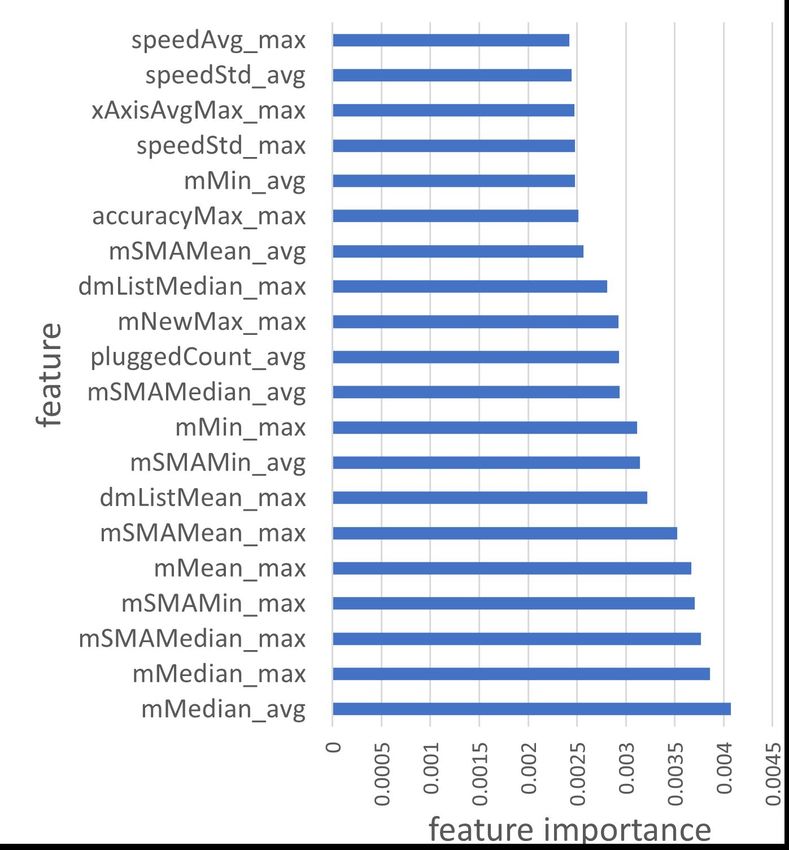
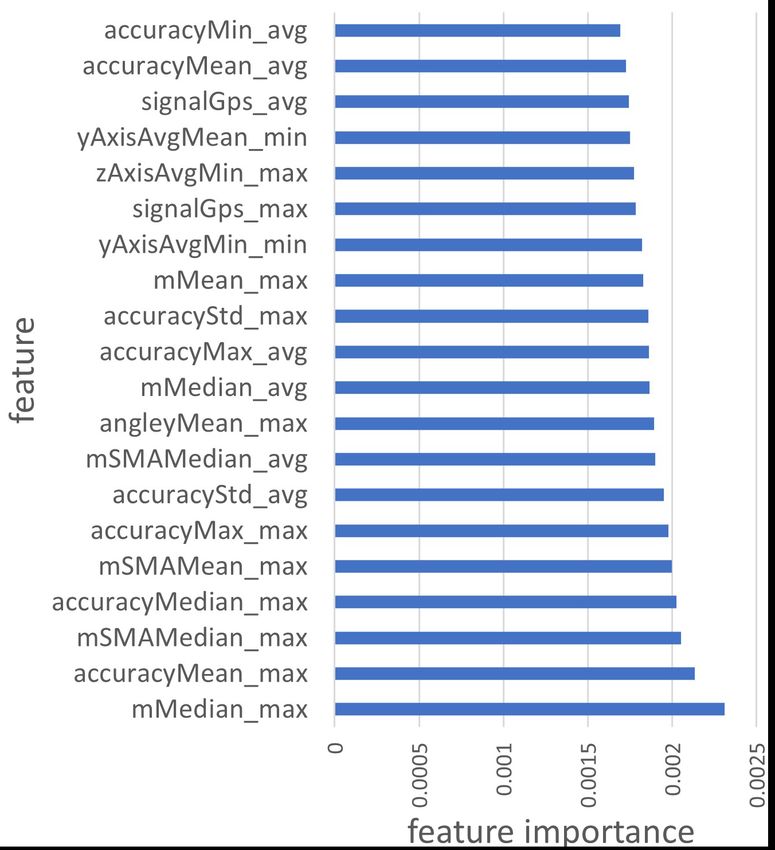
Examining the Social Context of Alcohol Drinking in Young Adults with Smartphone Sensing • 121:13

and Cohen’s-d values (some around medium effect size) compared to the other two combinations (alone vs.
sgroup and sgroup vs. lgroup). Furthermore, for the social contexts friends ℎ and people ℎ , for all three
combinations, all features in the top five in terms of both t-statistic and Cohen’s-d are from the accelerometer. In
addition, for friends ℎ , features in the combination alone vs. lgroup had high t-statistics and Cohen’s-d values
above medium effect size. In fact, 14 features, all of which are from the accelerometer had Cohen’s-d values above
medium effect size. In addition, for people ℎ , 44 features had Cohen’s-d values above medium effect size, and
the highest ones were closer to large effect size, meaning that these accelerometer feature could discriminate
between alone and lgroup social contexts.
 For two-class social contexts people , family , and friends , all features in the top five for both t-statistic
and Cohen’s-d were from the accelerometer. Further, only friends had features with Cohen’s-d above medium
effect size among all four two-class social contexts. However, for partner , several features from application
usage (food and drink app usage) were among the top five for t-statistics. In addition, a feature from the proximity
sensor had a Cohen’s-d of 0.29, which is above small effect size. As a summary, results from the statistical
analysis suggest that for all the social contexts, accelerometer features could be informative of the group dynamic.
In addition, for social contexts related to partner/spouse, app usage behavior and proximity sensors could be
informative. Moreover, bluetooth sensor had high statistical significance in discriminating social contexts related
to family members.

6 SOCIAL CONTEXT INFERENCE
6.1 Two-Class and Three-Class Social Context Inference (RQ2)
In this section, we use all the available smartphone sensing features and implement seven social context tasks,
using features defined in Section 3.3 as target variables. The tasks include four two-class inference tasks and
three three-class inference tasks: (1) family , (2) partner , (3) friends , (4) people , (5) family ℎ , (6)
friends ℎ , and (7) people ℎ . In this phase, we used scikitlearn [84] and keras [18] frameworks together
with python, and conducted experiments with several model types: (1) Random Forest Classifier [22], (2) Naive
Bayes [90], (3) Gradient Boosting [79], (4) XGBoost [17], and (5) AdaBoost [94]. These models were chosen by
considering the tabular nature of the dataset, interpretability of results, and small size of the dataset. In addition,
we used the leave k-participants out strategy (k = 20) when conducting experiments, where testing and training
splits did not have data from the same user, hence avoiding possible biases in experiments. Further, similar to
recent ubicomp studies [5, 44, 74], we used the Synthetic Minority Over-sampling Technique (SMOTE) [16] to
obtain training sets for each inference task. As recommended by Chawla et al. [16], when and where necessary,
we under-sampled the majority class/classes to match over-sampled minority class/classes to create balanced
datasets, hence not over-sampling unnecessarily beyond doubling the minority class size. In addition, we also
calculated the area under the curve (AUC) (for three-class inferences, one vs. the rest technique, using macro
averaging) using the receiver operator characteristics (ROC) curves. All experiments were repeated for ten
iterations. We report mean and standard deviation of accuracies, and mean of AUC using results from the ten
iterations.
 Table 5 summarizes the results of the experiments. All the two-class inference tasks achieved accuracies over
80%. Moreover, all the three-class inferences achieved accuracies over 75%. When considering model types,
Random Forest classifiers performed the best across five out of the seven inference tasks (family , partner ,
friends , family ℎ , and people ℎ ) and Gradient Boosting had higher accuracies for two inference tasks
(people and friends ℎ ). Generally, all models included in the study, except for Naive Bayes, performed
reasonably well. Further, low standard deviation values suggest that regardless of the samples used for training
and testing, the models generalized reasonably well. AUC scores followed a similar trend as the accuracy. These

 Proc. ACM Interact. Mob. Wearable Ubiquitous Technol., Vol. 5, No. 3, Article 121. Publication date: September 2021.
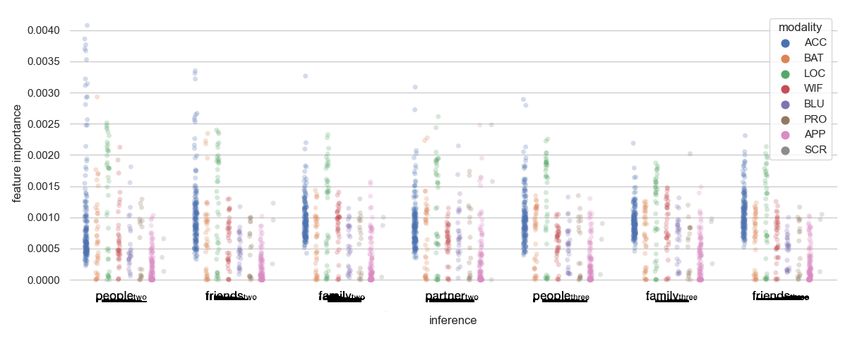
121:14 • Meegahapola et al.

Table 5. Mean (Ā) and Standard Deviation (A ) of inference accuracies and the mean area under the curve of the receiver
operator characteristic curve (AUC), calculated from 10 iterations, using five different models, for two-class and three-class
tasks, with attributes such as family, friends/colleagues, spouse/partner, and alone. Results are presented as: Ā (A ), AUC

 Target Variable Random Forest XG Boost Ada Boost Gradient Boost Naive Bayes
 baseline 50.0 (0.0), 50.0 50.0 (0.0), 50.0 50.0 (0.0), 50.0 50.0 (0.0), 50.0 50.0 (0.0), 50.0
 two-class

 family 86.1 (3.1), 84.8 82.6 (3.4), 73.2 82.5 (4.2), 71.7 83.2 (3.7), 74.2 65.6 (6.9), 67.6
 partner 87.4 (2.6), 82.6 84.6 (4.6), 74.7 83.5 (3.8), 69.3 84.7 (5.1), 78.8 68.6 (8.2), 64.2
 friends 80.1 (2.9), 81.3 78.3 (4.5), 75.2 78.0 (4.1), 70.4 78.7 (3.7), 73.7 64.0 (4.2), 61.4
 people 83.3 (3.2), 79.2 84.1 (3.1), 75.2 82.7 (4.3), 79.5 84.2 (2.8), 76.9 72.3 (4.7), 67.3
 baseline 33.3 (0.0), 50.0 33.3 (0.0), 50.0 33.3 (0.0), 50.0 33.3 (0.0), 50.0 33.3 (0.0), 50.0
 three-class

 family ℎ 85.9 (2.2), 80.5 81.4 (3.1), 73.2 73.9 (3.7), 63.2 83.0 (2.6), 70.2 63.1 (4.2), 61.8
 friends ℎ 76.7 (2.3), 78.2 77.1 (3.6), 70.1 71.0 (3.1), 68.8 77.6 (2.8), 72.3 62.2 (5.1), 63.5
 people ℎ 78.3 (2.1), 75.3 71.2 (2.6), 69.8 67.1 (3.8), 67.8 73.8 (3.2), 73.1 57.9 (6.7), 67.2

results suggest that passive mobile sensing features could be used to infer both two-class and three-class social
contexts related to alcohol consumption, with reasonable performance.

6.2 Social Context Inference for Different Sensors (RQ2)
Prior work in mobile sensing has argued for multiple inference models for the same inference task, in the case of
sensor failure [71, 92, 114]. For instance, during a weekend night, young adults could be concerned for the battery
life of their phone, and could turn-off bluetooth, wifi, and location sensors that drain the battery faster. In such
cases, having separate inference models that use different data sources to infer the same target attribute could be
beneficial. In addition, prior work has segregated passive sensing modalities into Continuous Sensing (using
embedded sensors in the smartphone) and Interaction Sensing (sensing the users’ phone usage and interaction
behavior) [71]. Considering these aspects, we conducted experiments for different feature groups based on the
sensing modality (accelerometer, applications, battery, bluetooth, proximity, location, screen, and wifi) and the
following feature group combinations that are meaningful in the context of drinking and young adults:
 • Continuous Sensing (ConSen): These sensing modalities use embedded sensors to capture context.
 Examples are accelerometer, battery, bluetooth, proximity, location, and wifi. ConSen contains features
 from all these sensing modalities, and this feature group combination can measure the capability of the
 smartphone in inferring the social context of drinking, even if the user does not necessarily use the
 smartphone, because the considered sensing modalities sample data regardless of the phone usage behavior.
 • Interaction Sensing (IntSen): These sensing modalities capture the phone usage and interaction behavior.
 Examples include screen events and application usage. In addition, these sensing modalities do not fail often
 because there is no straightforward way for users to turn-off interaction sensing modalities. Furthermore,
 these sensing modalities consume far less power compared to continuous sensing. In this context, this
 feature group combination could measure the capability of a smartphone to infer the social context of
 drinking, based on the way young adults use and interact with the smartphone.
 For the two above mentioned feature groups, we conducted experiments using the same procedure as given in
Section 6.2. Even though we got results for all models, we only present results for random forest classifiers in
Table 6 because they output feature importance values which are useful to interpret results in Section 6.3, and
they provide the results with highest accuracy and AUC values for a majority of inference tasks. Even though the
accuracies were well above baselines for both two-class and three-class inference tasks, the lowest accuracies
were recorded for SCR. This could either be because of the far too small dimensionality (only three features)
or because the features were less informative. For the inference of social context partner , APP provided
the highest accuracy of 82.92% followed by ACC that provided an accuracy of 81.21%. This suggests that the

Proc. ACM Interact. Mob. Wearable Ubiquitous Technol., Vol. 5, No. 3, Article 121. Publication date: September 2021.
You can also read