A National Study of Outdoor Arts Festivals - National Endowment for the Arts Research Report #51
←
→
Page content transcription
If your browser does not render page correctly, please read the page content below
Live
       from Your
       Neighborhood        A National Study
                                              Volume One: Summary Report

                           of Outdoor
                           Arts Festivals

National Endowment for the Arts
Research Report #51
Live
from Your
Neighborhood
A National Study
of Outdoor
Arts Festivals
Volume one: summary report
National Endowment for the Arts
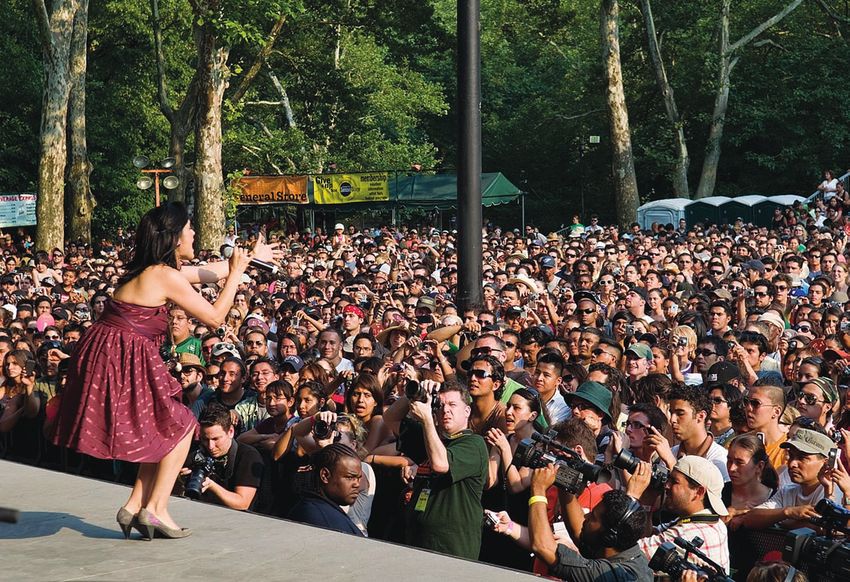
Research Report #51Research Report #51 August 2010 National Endowment for the Arts 1100 Pennsylvania Avenue, NW Washington, DC 20506-0001 Telephone: 202-682-5400 Prepared for the Office of Research & Analysis by Bohne Silber, Silber & Associates and Carole Rosenstein, PhD, George Mason University Produced by the Office of Research & Analysis Sunil Iyengar, Director Sarah Sullivan, Senior Program Analyst Other NEA staff contributors: Mario Garcia Durham, Tom Bradshaw, Bonnie Nichols, Nona Milstead, Kelli Rogowski, Patricia Shaffer, and Ellen Grantham Editorial and publication assistance by Don Ball Designed by Beth Schlenoff Design The National Endowment for the Arts would like to thank the Association of Performing Arts Presenters for providing valuable advice and feedback throughout the course of the study. Thanks are also due to the following individuals who composed an informal working group for the study: Michael Alexander, Philip Horn, Steve Schmader, Robb Woulfe, Stephanie Hughley, Huong Vu, Ted Russell, Helen Sause, Claudia Norman, David Rivel, Jennifer Lena, and Angela Han. Finally, the NEA would like to thank the organizations that helped to generate the list of festival organizers surveyed for the national study and/or that helped to distribute the survey to festival organizers. See page 67 for details. Front Cover Photo: Latin sensation Julieta Venegas reaches out to a packed crowd at SummerStage in Central Park, New York City, NY. Photo by Jack Vartoogian©/ FrontRowPhoto Printed in the United States of America Library of Congress Cataloging-in-Publication Data is not available at the time of publication. Available after September 30, 2010, in the PDF version of the report at arts.gov. 202-682-5496 Voice/TTY (a device for individuals who are deaf or hearing-impaired) Individuals who do not use conventional print materials may contact the Arts Endowment’s Office for AccessAbility at 202-682-5532 to obtain this publication in an alternate format. This publication is available free of charge at arts.gov, the website of the National Endowment for the Arts.
Live from Your Neighborhood
A Message from the Chairman

When I arrived at the NEA, I knew two words to be true:
“art works.”
    Over the past 12 months, I have used these two words
to mean three things. They are a noun—works of art—the
stuff that artists produce. They remind us of the ways that
art works on audiences to engage and inspire us, to chal-
lenge us, to comfort us. And they are a bold declaration
that arts workers are real workers who are part of this
country’s economy and communities.
    And as I have travelled around over the past year, I
have seen again and again that art works everywhere.
    It works in Memphis, Tennessee, and in San Francisco,
California. It works in Idaho Falls, Idaho, and it works in Photo by Michael Eastman
Chelsea, Michigan.
    It works in the iconic arts buildings—the museums, concert halls, and theaters—where
many of us have had seminal experiences.
    It also works in schools, community centers, and houses of worship, where many of us
have important “informal arts” experiences.
    Informal arts participation was the subject of a recent NEA Research Note, one that
was especially important to me because it was not an area that the NEA had previously
examined.
    Similarly, this report is important for its very existence. This is the most comprehensive
survey of America’s outdoor arts festivals that we know. And it is an important examination
because earlier research has shown us that some 102 million people attend arts and cultural
festivals annually in this country. That’s a lot of art working for a lot of Americans every year,
and it is time that we started to examine these festivals more closely.
    It is always my hope that NEA research reports spur questions, conversation, and action,
and the data presented here are rich fodder for all three. After you finish reading Live From
Your Neighborhood, I hope you will consider sharing your reactions with us on the Art Works
blog at arts.gov.

Rocco Landesman
Chairman
National Endowment for the Arts
Table of Contents Preface............................................................................................................................................................................................ 7 Executive Summary..................................................................................................................................................................... 9 Purpose and Background of the Study................................................................................................................................. 14 Section 1: Range of Festival Types, by Program and Mission........................................................................................ 18 Section 2: Public Access to Festivals.................................................................................................................................... 24 Section 3: A Multi-Dimensional Arts Experience............................................................................................................. 28 Section 4: Composition of Festival Audiences................................................................................................................... 32 Section 5: Integration with Community Life..................................................................................................................... 36 Section 6: Festival Administration........................................................................................................................................ 40 Section 7: Statistical Snapshots of Festivals, by Artistic Discipline............................................................................. 48 Conclusions................................................................................................................................................................................. 66 Research Methodology............................................................................................................................................................. 67 Annex: National Survey Questionnaire................................................................................................................................ 72 List of Figures Figure 1. Geographic Distribution of Festivals in the Survey........................................................................................ 15 Figure 2. Percent of Festivals, by Month(s) in Which They Occurred........................................................................ 15 Figure 3. Percent Distribution of Festivals, by Organizer’s Report of Festival Type.............................................. 20 Figure 4. Percent of Festivals, by Artistic Disciplines Represented............................................................................. 20 Figure 5. Percent of Festivals, by Number of Exhibiting or Performing Artists...................................................... 21 Figure 6. Percent of Festivals, by Total Number of Scheduled Performances.......................................................... 21 Figure 7. Percent of Festivals, by Admission Fee Structure.......................................................................................... 25 Figure 8. Percent of Festivals That Charge for Admission, by Average Fee.............................................................. 26 Figure 9. Percent of Festivals That Charge an Admission with a Discount Ticketing Program.......................... 26 Figure 10. Percent of Festivals, by Venue During Most Recent Season...................................................................... 27 Figure 11. Percent of Festivals with an Artistic Staff, Staff Person, or Volunteer Whose Primary Role Is Arts Curator or Arts Event Programmer............................................................................ 30 Figure 12. Percent of Self-identified Visual Arts Festivals That Are Juried.............................................................. 30 Figure 13. Percent of Festivals, by Number of Attenders in the Most Recent Season........................................... 33 Figure 14. Percent of Festivals, by Most Common Age Group Represented in Audience..................................... 33 Figure 15. Percent of Festivals, by Number of Years They Have Been Produced in the Same Town................. 37 Figure 16. Percent of Festivals, by Number of Workshops, Lectures, or Other Educational Events Scheduled over Festival’s Duration................................................................................................................................... 38 Figure 17. Percent of Festivals, by Source of Sponorship/Donations During the Most Recent Season............ 38 Figure 18. Percent Distribution of Festivals, by Organization’s Number of FTEs................................................... 39 Figure 19. Percent of Festivals by Type of In-kind Donations Received During Festival’s Most Recent Season......................................................................................................................................................................... 42 Figure 20. Percent of Festivals by Amount of Revenue Generated During Most Recent Season........................ 42 Figure 21. Percent of Festivals by Revenue Source for Most Recent Season............................................................ 43 Figure 22. Percent Distribution of Festivals, by Organization’s Projections for 2010 Revenue in Comparison with 2009 Revenue................................................................................................................................... 43 Figure 23. Percent of Festivals, by Organization’s Strategy for Offsetting Lower Revenue in 2010................... 44 Figure 24. Percent of Festivals, by Total Expenses During Most Recent Season..................................................... 44 Figure 25. Percent of Festivals, by Total Artist Fees Paid.............................................................................................. 45 Figure 26. Percent of Festivals, by Total Value of In-kind Payments to Artists....................................................... 45 Figure 27. Percent of Outdoor Arts Festivals, by Total Audience Size........................................................................ 51 Figure 28. Percent of Outdoor Arts Festivals, by Total Revenue During Last Season............................................ 51
Figure 29. Percent of Outdoor Arts Festivals, by Total Expenses During Last Season.......................................... 51
Figure 30. Percent of Arts and Crafts Festivals, by Total Audience Size.................................................................... 53
Figure 31. Percent of Arts and Crafts Festivals, by Total Revenue During Last Season........................................ 53
Figure 32. Percent of Arts and Crafts Festivals, by Total Expenses During Last Season....................................... 53
Figure 33. Percent of Multidisciplinary Festivals, by Total Audience Size................................................................ 55
Figure 34. Percent of Multidisciplinary Festivals, by Total Revenue During Last Season.................................... 55
Figure 35. Percent of Multidisciplinary Festivals, by Total Expenses During Last Season................................... 55
Figure 36. Percent of Music Festivals, by Total Audience Size..................................................................................... 57
Figure 37. Percent of Music Festivals, by Total Revenue During Last Season......................................................... 57
Figure 38. Percent of Music Festivals, by Total Expenses During Last Season........................................................ 57
Figure 39. Percent of Performing Arts Festivals, by Total Audience Size.................................................................. 59
Figure 40. Percent of Performing Arts Festivals, by Total Revenue During Last Season...................................... 59
Figure 41. Percent of Performing Arts Festivals, by Total Expenses During Last Season..................................... 59
Figure 42. Percent of Racial and Ethnic Festivals, by Total Audience Size............................................................... 61
Figure 43. Percent of Racial and Ethnic Festivals, by Total Revenue During Last Season................................... 61
Figure 44. Percent of Racial and Ethnic Festivals, by Total Expenses During Last Season.................................. 61
Figure 45. Percent of Theater Festivals, by Total Audience Size.................................................................................. 63
Figure 46. Percent of Theater Festivals, by Total Revenue During Last Season...................................................... 63
Figure 47. Percent of Theater Festivals, by Total Expenses During Last Season..................................................... 63
Figure 48. Percent of Visual Arts Festivals, by Total Audience Size............................................................................ 65
Figure 49. Percent of Visual Arts Festivals, by Total Revenue During Last Season................................................ 65
Figure 50. Percent of Visual Arts Festivals, by Total Expenses During Last Season............................................... 65

List of Tables

Table 1. Overview of Case Study Festival Characteristics.............................................................................................. 17
Table 2. Festival Types Listed on Survey Questionnaire................................................................................................. 19
Table 3. Percent Distribution of Events at Festivals, by Organizer’s Description of Festival Type..................... 29
Table 4. Demographic Make-up of Festival Audiences, as Reported by Festival Organizers,
  in Comparison with U.S. Census and Sppa Figures.................................................................................................... 34
Table 5. Average Number of Staff Per Festival................................................................................................................... 39
Table 6. Type of Organization................................................................................................................................................ 41
Table 7. Revenue by Self-Reported Festival Type............................................................................................................. 43
Table 8. Expenses by Festival Type....................................................................................................................................... 45
Table 9. Types of Music at Music Festivals......................................................................................................................... 56
Table 10. Types of Theater at Theater Festivals................................................................................................................ 62
Table 11. Types of Visual Arts at Visual Arts Festivals.................................................................................................... 64
Preface

T                his study began with a readily under-
                 standable impulse: to enumerate the
                 nation’s outdoor arts festivals and to
                 identify their shared and divergent
                 traits, considering factors such as
event programming, staffing, finances, and audience
demographics.
   The reason for this query is also straightforward. To
date, no single report or database carries such compre-
                                                                 A related attribute of arts festivals is a blurring of
                                                              boundaries. Nowhere is this feature more evident
                                                              than in the relationship between festivals and the
                                                              greater community. Local governments and business-
                                                              es have invested in outdoor arts festivals as a token of
                                                              civic pride, a pledge redeemed by the high level of vol-
                                                              unteerism that propels festivals year after year, sea-
                                                              son after season. Studies by sociologists Mark Stern
                                                              and Susan Seifert, coupled with the NEA’s own re-
hensive information about arts festivals nationwide.          search on the statistical links between arts participa-
Given their pervasive role in American cultural life,         tion and civic engagement, provide a context for this
this discrepancy is something more than a matter for          understanding.1
regret. Repeat iterations of the NEA’s Survey of Public          The word festival is etymologically allied with feast.
Participation in the Arts (SPPA) have shown that fes-         Festivals convey a smorgasbord of arts experiences and
tivals and fairs collectively attract more unique audi-       opportunities that would baffle even the most intrepid
ence members per year than most arts events.                  researcher. Yet this study is a modest start. By exam-
   In 2008 alone, more than 55 million U.S. adults at-        ining a cross-section of U.S. festivals—self-identified
tended at least one arts-and-crafts fair or festival in       as predominantly “outdoors” and featuring “arts and
the past year, and 47 million attended at least one           cultural” programming—we hope to have established
outdoor performing arts festival. (Approximately 14%          a basis for future exploration into their significance for
of Americans attended both.) In sheer numbers, at-            artists, audiences, and communities. Ideally, the sur-
tendance rates for festivals far exceed those for many        vey and case study results will prompt other arts orga-
single types of art activities—classical music concerts,      nizations to ask: what are festivals doing right and how
for example, or theater, ballet, or opera.                    can we replicate it?
   But the size of their audiences is not the only char-
acteristic that merits serious study of arts festivals.       Sunil Iyengar                   Mario Garcia Durham
Festival audiences, on average, are more diverse than         Director, Research              Director,
those for many other types of live art events. As the         & Analysis                      Presenting & Artist
SPPA data reveal (and as the present study observes),                                         Communities
festival audiences seem to more closely resemble the

                                                                                                                                 national study of outdoor arts festivals
general population than do other groups of art-goers.
This finding is notable as arts organizations strive not
only to build new audiences but, what may be more
important, to actuate potential audiences that already
exist among groups who engage in art through a variety
of ways not often acknowledged or studied.
   Over the last decade, arts presenters have learned to
respond to shifting expectations among live audiences,
particularly young adults. These audiences crave a new
level of interactivity, they value personal creation and
performance as part of the overall arts experience, and
they appear to prefer those activities in informal set-
tings. Outdoor arts festivals are uniquely poised to bridge
those expectations with innovative arts programming.
As the case studies in this report illustrate, festival au-
                                                              Note
diences derive special satisfaction from encounters           1
                                                               Stern and Seifert’s work can be found at www.sp2.upenn.edu/
with artists and art forms in an open space that rein-        SIAP/ and NEA’s research on the arts and civic engagement can be
forces choice, experimentation, and free movement.            found at arts.gov.
volume i: summary reportExecutive Summary
In aggregate, U.S.-based outdoor arts festivals surveyed
by the NEA display the following characteristics: “What is exciting is that there is a lot
of cross-pollination because there are
A. Diversity of Art Forms and
all these different disciplines together.
Audiences
There’s a real fueling that goes on.”
1. Activities spanning a wide array of art forms — Festival artist
converge in a single space.
• A typical outdoor festival showcases many different
types of art forms. Music is the most prevalent, with
81% of survey respondents reporting some kind of mark” arts audiences nationwide, as tracked by the
music performance at their festivals. Visual arts and NEA’s 2008 Survey of Public Participation in the Arts
crafts, dance, and folk or traditional arts also are fre- (SPPA).3, 4
quently on display. • African Americans are also in higher attendance at
• Even festivals that concentrate on a specific art form festivals than at most arts activities tracked by the
are multidisciplinary in nature. SPPA: they compose 16% of festival audiences, com-
pared with 7% of benchmark arts audiences.5
2. Festival audiences describe a demographically
diverse audience, one that appears to mirror B. Commitment to Quality
characteristics of the U.S. population. Programming
• By gender and racial/ethnic composition, festival au-
diences resemble the general population as described 3. Most outdoor arts festivals appear committed to
by U.S. Census figures. Proportionately, however, fes- achieving a high-quality arts experience for their
tival audiences have slightly more females and Afri- audiences.
can Americans, according to estimates from festival • 70% of festivals have an artistic staff or a staff person
organizers.2 or volunteer whose primary role is arts curator or
• Festival organizers report that 15% of audiences are arts event programmer.
Hispanic. This figure compares with 8% of “bench- • 56% of visual arts festivals are juried.
national study of outdoor arts festivals
ES Figure 1. Percent of Festivals, by Artistic Disciplines Represented
(Percent of Festivals Presenting the Discipline) (multiple answers allowed)
Music 81%
Visual arts/crafts 67%
Dance 42%
Folk/traditional arts 41%
Theater 22%
Literary 19%
Other 12%
Film 8%
0% 10% 20% 30% 40% 50% 60% 70% 80% 90% 100% ES Table 1. Percent Distribution of Events at Festivals, by Organizer’s Description of Festival Type
Type of Events Featured
Folk/ Visual
Dance Film Traditional Literary Music Theater Arts/Arts Other
Arts & Crafts
ALL festivals
7% 1% 9% 3% 39% 6% 32% 3% 100%
(n=1,376)
Music festivals
3%ES Figure 2. Percent of Festivals, by Number of Workshops, ES Figure 3. Percent of
Lectures, or Other Educational Events Scheduled over Festivals, by Admission
Festival’s Duration Fee Structure
80%
70% Other
63% 8%
60%
Fee for
50% all events
17%
40% Free for
all events
30% 59%
Fee for
20% 18% some events
17%
10% 7%
3% 4% 4%
1% 2%
0%
None 1–9 10–19 20–29 30–39 40–49 50–100 >100
ES Figure 4. Percent of Festivals That Charge for Admission, by Average Fee
>$50 6%
$40–$49.99 4%
$30–$39.99 6%
$20–$29.99 17%
$15–$19.99 12%
$10–$14.99 21%
$5–$9.99 21%ES Figure 5. Percent of Festivals, by Venue During the Most Recent Season (multiple answers allowed)
Plaza/park 46%
Street 25%
Outdoor theater 19%
Other 18%
Museum 10%
Concert hall 10%
School/college 9%
Public building 8%
Private grounds 8%
Community center 7%
Waterfront 6%
Restaurant/hotel 4%
Fairground 4%
Church 3%
Sports venue 2%
0% 10% 20% 30% 40% 50%
ES Figure 6. Percent of Festivals, by Number of Years They Have Occurred in the Same Town
80%
70%
60%
50%
40% 35%
30%
22% 24%
20% 15%
10%
3% 2%
0%
First time 1 year 2–4 years 5–9 years 10–20 years >20 years
• In focus groups, audiences suggested that the abil- 8. Most outdoor arts festivals (59%) have occurred
ity to enter and leave programs, to get up and move in the same community for more than a decade.
volume i: summary report
around, and to make noise and dance, renders fes- • At each case study site, more than two-thirds of audi-
tivals especially attractive to families with younger ence survey respondents affirmed that the festivals
children. have enriched community life.
• In all but one case study site,6 more than half of sur-
vey respondents who live in households with chil- 9. Support of local government agencies is crucial
dren brought children to the festivals. In some cases, to the success of outdoor arts festivals.
the percentage was very high: approaching 100% at • Case study participants reported that healthy, long-
Santa Fe Indian Market and 82% at the Houston In- term partnerships with local government agencies
ternational Festival and Lowell Folk Festival. proved essential in sustaining festivals’ contributions
•T hree-quarters (76%) of festivals in the national to community life. Local departments of parks and
survey occur in the summer months (June, July, or recreation, police, and street-and-sanitation depart-
12 August), when school typically is out. ments offer critical services to festival organizers.ES Figure 7. Percent of Festivals, by Source of Sponsorship/Donations During the Most Recent
Season (multiple answers allowed)
No sponsors/donors 12%
Corporate sponsor 72%
Local, municipal government 44%
Foundation 36%
State government 28%
Regional funder 13%
Federal government 8%
0% 10% 20% 30% 40% 50% 60% 70% 80%
ES Figure 8. Percent Distribution of Festivals,7 Notes
by Organization’s Number of FTEs8 2
Age comparisons could not be made because of limitations on the
age data for festival audiences. Survey respondents were allowed
to check more than one age category to describe the festival
50–100 audience. The “multiple response” nature of these data precluded
3% comparisons to U.S. Census figures.
30–49
3% >100
6%
3
To facilitate analysis of long-term trends in the survey
data, certain art forms have been designated in the SPPA as
“benchmark” activities. There are seven benchmark arts activities:
jazz, classical music, opera, musical plays, non-musical plays,
10–29
10% ballet, and visits to art museums or galleries.
4
The SPPA, a general population survey, measures only adult (18
5 or less years and over) attenders, whereas all age groups are included in
6–9 70%
8% the festival audience estimates from the national survey.
5
The 2008 SPPA collected information on crafts fairs, visual arts
festivals, and outdoor performing arts festivals. Demographic
characteristics of individuals attending festivals and fairs are
similar to those attending benchmark arts and, thus, are not
reported separately. However, audiences for outdoor performing
arts festivals in the SPPA showed greater racial/ethnic diversity
national study of outdoor arts festivals
than audiences for many benchmark live arts events.
6
Chicago Jazz Festival was the only case study site where fewer
than half of survey respondents (39%) who live in households with
Festivals simply cannot take place without the coop- children brought children to the festival.
eration of public agencies to provide services, licenses, 7
The unit of analysis is the responding organization, of which
and permits. there were 1,264, and not the 1,413 festivals that the organizers
• After corporate sponsorship, support from local represented. Festivals, and not organizations, constitute the unit
and/or municipal governments is the most common of analysis for the remainder of the report.
source of funding, with 44% of festivals saying they
8
The question asked about the number of people working for
the festival. If the festival was part of an organization, then the
received such support. survey asked also about the number of people working for the
organization.
10. Outdoor arts festivals rely heavily on volunteers
and a small number of dedicated staff.
• 70% of festivals are run by five or fewer full-time
equivalent (FTE) staff members.
• 61% of festivals have year-round volunteers (the me-
dian number is 2 volunteers), and 77% depend on
seasonal volunteer staff (the median number is 20
volunteers). 13Purpose and Background
of the Study
O ver a five-year period ending in Oc-
tober 2009, the NEA awarded over
$14,667,735 in grants to 859 orga-
nizations that characterized them-
selves or their projects as fairs or
festivals. Festivals are uniquely suited to build new au-
diences of all age groups, socio-economic backgrounds,
geographical areas, and degrees of prior exposure to
the arts. The 2008 Survey of Public Participation in
Additional information on the study methodology can
be found on page 67.
I. National Survey
The questionnaire for the online survey contained ap-
proximately 40 items. Topics ranged from the num-
ber and type of events held at the festival to sources of
revenue to the number of employees and volunteers
the Arts revealed that outdoor performing arts festi- engaged. Two screener questions at the start of the sur-
vals attract a more diverse audience than many other vey ensured that organizations completing the survey
live arts activities that the NEA currently tracks.9 Yet were arts and/or cultural festivals with at least 50% of
there is no comprehensive research or database that their activities held outdoors.
describes the range and impact of arts festivals in the A list of more than 8,000 festival organizers was com-
United States. piled from the applicant, grantee, and/or member data-
Between April and October 2009, the NEA con- bases of the NEA, regional arts organizations, state arts
ducted a study of outdoor arts festivals in the U.S. The agencies, arts service organizations, and state festival
purpose of the study was to learn about the number and event associations. Of the 2,440 organizations that
and variety of festivals in this country, the artists they visited the survey website, over half (1,264) qualified to
employ, the communities they serve, and the role they take the survey.
play in our nation’s cities, towns, and neighborhoods. The 1,264 survey respondents10 reported on a total of
The study provides information about an important, 1,413 outdoor arts festivals.11 Unless noted otherwise,
relatively unknown segment of NEA constituency, thus the survey results in this report pertain to those festi-
allowing the agency to better address the field through vals only; the 1,413 festivals—not the 1,264 responding
relevant programs. At the same time, the study will cre- organizations—are our unit of study and analysis.
ate a platform for further analyses of the field and will Figure 1, which illustrates the geographic distribu-
allow more empirically based discussions about festi- tion of the 1,413 festivals, shows that every state in the
val planning to occur among organizers and arts and country except for Alaska was represented in the
civic leaders. survey.12
The study used a mixed-methods approach consist- Ninety-seven (8%) of the 1,264 responding organi-
ing of a national survey and seven case studies. The zations said they produce more than one outdoor arts
goal of the nationwide, online survey was to attempt to festival at the present time. Of those, most (81%) pro-
characterize, for the first time, the nation’s outdoor arts duce two festivals, but 6% said they produce four or
volume i: summary report
festivals in a comprehensive, systematic way—to ask more outdoor arts festivals.
festival organizers about their audiences, arts program- Eighty-eight percent (88%) of festivals in the na-
ming, budgets, and operating structure. The purpose tional survey occur from May through August; July is
of the case studies was to gather detailed, contextual- the most common month (see Figure 2). Three-fourths
ized data about festivals, festival-sponsoring organiza- of festivals (76%) last one to three days,13 and 95% oc-
tions, artists, volunteers, and festival audiences. The cur once a year.
scope of the investigation was deliberately broad and
included interviews, focus groups, audience surveys, II. Case Studies
and background research about the festivals and their
communities. In addition to the national survey, seven case studies
This report combines key results from the two in- were conducted to showcase the range and diversity
14 vestigative efforts, described in further detail below. of events that make up “arts festivals” and to exploreFigure 1. Geographic Distribution of Festivals in the Survey
Figure 2. Percent of Festivals, by Month(s) in Which They Occurred
(Respondents Could Name More than One Month)
January 1%
February 2%
national study of outdoor arts festivals
March 2%
April 7%
May 12%
June 25%
July 28%
August 23%
September 21%
October 12%
November 4%
December 2%
0% 5% 10% 15% 20% 25% 30% 35% 40%
15organizational structure, how festivals function, au- contextualize and enhance the reader’s understand-
dience patterns, and festivals’ relationships with and ing of the main survey findings. However, where the
impact on the local community. The following festivals case study findings do resemble the national survey
were chosen as case study sites: results, the fact has been noted.
1. Houston International Festival, Houston, Texas,
April 25–26, 2009 Notes
2. Piccolo Spoleto Festival, Charleston, South Carolina, 9
The Survey of Public Participation in the Arts is the nation’s
May 22–24, 2009 largest and most representative periodic study of adult
participation in arts events and activities. It is conducted by
3. Lowell Folk Festival, Lowell, Massachusetts, July the NEA in partnership with the U.S. Census Bureau. The full
25–26, 2009 summary report is available at http://www.nea.gov/research/
4. Santa Fe Indian Market, Santa Fe, New Mexico, Au- ResearchReports_chrono.html.
gust 22–23, 2009 10
Festival organizers (i.e. individuals involved in producing the
5. Chicago Jazz Festival, Chicago, Illinois, September events) completed the survey on the festival(s) they produced.
5–6, 2009
11
Survey respondents were contacted by postal and electronic mail
and requested to participate in the survey. A full discussion of the
6. Tamejavi Festival, Fresno, California, September research methodology begins on page 67.
19–20, 2009 12
Three Alaskan festivals responded to the national survey;
7. D.U.M.B.O. Art Under the Bridge Festival, Brooklyn, however, none of them qualified to participate, as only 1–24% of
New York, September 26–27, 2009 their events are held outdoors. As noted above, only festivals that
had at least 50% of their events outdoors were allowed to take the
survey.
The research team spent one to two days on-site at 13
When festivals lasted more than one day, the days typically were
each festival collecting quantitative and qualitative consecutive.
data about audiences at the festival, the participating
artists, the festival’s operations, and the festival’s en-
gagement with its surrounding community. At each
case study site, in-depth interviews were conducted
with the festival administrator; focus group discus-
sions occurred with festival artists and volunteers; and
two surveys were given to festival attenders.
Case study sites were selected to provide diversity
across the following dimensions: geography, gover-
nance structure, entrance fee, mission, and arts dis-
cipline. The seven sites span the six U.S. regions of the
regional arts organizations: Arts Midwest (IA, IL, IN,
MI, MN, ND, OH, SD, WI), Mid-America Arts Alliance
(AR, KS, MO, NE, OK, TX), Mid Atlantic Arts Foun-
dation (DC, DE, MD, NJ, NY, PA, VA, VI, WV), New
England Foundation for the Arts (CT, MA, ME, NH,
RI, VT), South Arts (AL, FL, GA, KY, LA, MS, NC, SC,
TN), and Western States Arts Federation (AK, AZ, CA,
CO, HI, ID, MT, NM, NV, OR, UT, WA, WY). Festivals
also must have been in existence for at least five years
and demonstrated the capacity to support the kind of
volume i: summary report
research undertaken for this project.
Details about the case study selection criteria and
research instruments appear in the Research Meth-
odology section beginning on page 67. Table 1 on the
following page shows the range of characteristics rep-
resented by the sample of case study festivals.
Due to the selection criteria applied and the limited
number of sites chosen, the case studies throughout
this report cannot be viewed as mirroring the larger,
national survey results. Rather, the case study find-
16 ings included throughout this report are intended toTable 1. Overview of Case Study Festival Characteristics
Houston Piccolo Lowell Folk Santa Fe Chicago Tamejavi D.U.M.B.O.
International Spoleto Festival Indian Jazz Festival Art Under the
Festival Market Festival Bridge Festival
Organizational 501(c)3 501(c)3 - Public- 501(c)3 Public- 501(c)3 501(c)3 –
Form* privatized private private association collaboration
public agency partnership partnership of religious with corporate
organizations partner
Festival Budget $3 million $2.5 million $1.3 million $1.1 million $680,000 $603,000 $132,000
Size (2007)
Audience Size 425,000 250,000 200,000 100,000 300,000 1,000 100,000
Pricing* Ticketed for Free and Free Free and Free Free Free
adults 13 and ticketed events ticketed
over ($15) ($10–$15) events ($15)
Geography* Mid-America South New England West Mid-West West Mid Atlantic
(NEA Region)
Primary Arts Music Multi- Music Visual Arts Music Multi- Visual Arts
Discipline* disciplinary disciplinary
*Festival characteristics that were explicitly part of the case study selection criteria. Diversity was sought across these dimensions.
national study of outdoor arts festivals
17The Filene Center at Wolf Trap National Park for the Performing Arts in Virginia.
Photo by Robert Llewellyn
The Pan-Valley Institute was founded with the
mission of providing opportunities for immigrants
to get skills to learn how to be more civically
engaged. In our other programs, we saw how
much importance our clients gave to their cultural
lives. And there were not too many opportunities
to express that. By providing these opportunities
for cultural expression, we could also provide
opportunities for engagement—what we call
cultural organizing. Our principles allow our
participants to guide the process of their own
organizing. We always allow the space for sharing
stories. This was really important for bringing
volume i: summary report
people together. We work with immigrants. Even
though they all are immigrants, they are so diverse
and have different statuses—refugees and so
on. To share cultural practices brings out their
similarities. We saw that this works. It has been
very effective in building interethnic relationships
and providing opportunities for immigrants to
build skills.
18 — Festival administratorSection 1
Range of Festival Types, by Program and Mission
O utdoor arts festivals are diverse in
nature, content, and purpose. No one
festival type describes the majority of
festivals, nor is there a common mis-
sion that drives all festivals. A variety
of arts disciplines are on display; and festivals range in
terms of the number of exhibiting and performing art-
ists engaged and the number of events scheduled.
As Figure 3 shows, 8% of festivals were unable to find
a single best description and wrote in a description un-
der “other.” The most common “other” type of festival
was fine arts, followed by folk arts, environmental, and
cultural. The pie wedge labeled “else” refers to a com-
bined 12% of festivals that chose a description named
by 2% of respondents or fewer. These categories in-
cluded historical, holiday, and charity festivals.
I. The National Survey Diversity in Programming
Another survey question asked festival organizers to
A wide variety of festivals met the study’s screening identify the artistic disciplines represented by the fes-
criteria for constituting an “outdoor arts festival” (see tival’s programming—regardless of how the organizers
page 67 for details on the criteria). They ranged from a described their festival type. Across the many kinds of
swinging-bridge festival to an ice festival to a fish festi- festivals, music played a significant role: 81% of all out-
val. All reported that arts and/or culture programming door arts festivals have a music component (see Figure
are a core part of the festival’s activities and that at 4). Festivals that do not host music events are typically
least half the events are held outdoors. visual arts, including arts and crafts or theater festi-
vals. Visual arts and crafts-related activities are also
Festival Type fundamental to many outdoor arts festivals, appearing
Respondents identified their festival type by choosing in 67% of festivals in the survey.
the “one best description” from a list of 27 types. See Figure 4 shows in greater detail the different kinds
Table 2 for the event types festival organizers could of events making up a festival. Respondents marked all
choose from. The most commonly reported types of out- the answers that applied.
door arts festivals in the survey were music (22%), arts
and crafts (19%), and multidisciplinary (14%), although
many other festival types also were represented.
national study of outdoor arts festivals
Table 2. Festival Types Listed on Survey Questionnaire
Multidisciplinary Education Mardi Gras
Anniversary or Commemorative Festival Linked to an Official Mummers Festival
Arts and Crafts Holiday Music
Bazaar Film Performing Arts
Carnival Food Festival Racial/Ethnic Heritage
Charity Event Fringe Religious
Children/Family Historical Theme (e.g., Theater
Community Networking Renaissance) Visual Arts
County Fair/State Fair International Other:
Dance Literary
19Figure 3. Percent Distribution of Festivals, arts festivals have no scheduled performances.16 These
by Organizer’s Report of Festival Type festivals are mostly arts and crafts-focused.
Diversity of Mission
Child/Family Else
The survey questionnaire concluded with an open-
3% 12% ended prompt about the festival’s mission, and respon-
Performing Arts Music
4% 22% dents described their festival’s purpose with enthusi-
Theater asm and passion. While festivals exist for a variety of
4% reasons and purposes, respondents commonly said the
Racial/Ethnic festival is an opportunity to showcase their community,
7% Arts & Crafts
19% give the public the gift of art and culture, and promote
Visual Arts cultural understanding, appreciation, and acceptance.
7%
The following are excerpts from respondents’ an-
Other
8%
Multi- swers to the question, “Why was your festival founded,
disciplinary
14% what is your organization’s purpose for holding the
festival, or what is the benefit the festival brings to the
“Other” refers to write-in answers by respondents who community?”
did not choose a festival type from the list provided. “Else” • To honor our local jazz musicians and to expose our
refers to infrequent choices (selected by 2% or less) from underserved area to excellent music and professional
the list of festival types provided to respondents.
jazz.
• To bring the world’s finest artists to an appreciative
Artists and Performances crowd of all ages representing a broad spectrum of cul-
The number of artists and performances varies widely turally relevant music, dance, art, film, and theater. Our
across festivals and is correlated14 with the size of the belief is exposure to great art helps cross-cultural un-
festival audience; the larger the festival audience, the derstanding and acceptance/celebration of differences.
more artists and performances. • Our festival keeps the soul of our community alive. Our
More than half the festivals (58%) have fewer than cotton mill closed in 1969 and our organization’s mis-
100 performers;15 43% have 100 or more (see Figure 5). sion is to keep alive the traditions, values, history, and
Arts and crafts are more likely to have more than 100 heritage of our ancestors. The festival serves as a re-
performers or exhibitors and music festivals are more union for the “old-timers” and a way for new people to
likely to have fewer than 100 performers or exhibitors. be adopted as neighbors. Each year there is a “theme,”
A third (33%) of festivals have a total of one to nine some aspect of the rich legacy we try to pass on.
scheduled performances, and 25% have 10 to 19 (see • The mission is to provide a gathering place at the an-
Figure 6). Figure 6 shows that only 2% of all outdoor nual festival for people of different cultures, races,
Figure 4. Percent of Festivals, by Artistic Disciplines Represented
(Percent of Festivals Naming the Discipline) (multiple answers allowed)
Music 81%
Visual arts/crafts 67%
volume i: summary report
Dance 42%
Folk/traditional arts 41%
Theater 22%
Literary 19%
Other 12%
Film 8%
20 0% 10% 20% 30% 40% 50% 60% 70% 80% 90% 100%Figure 5. Percent of Festivals, by Number of Exhibiting or Performing Artists
40%
30%
27%
20% 18%
16%
14%
10% 9%
10%
4%
3%
0%
1–24 25–49 50–74 75–99 100–249 250–399 400–600 >600
Figure 6. Percent of Festivals, by Total Number of Scheduled Performances
40%
33%
30% 25%
20%
14%
10% 9%
5%
7% 6%
2%
0%
None 1–9 10–19 20–29 30–39 40–49 50–100 >100
national study of outdoor arts festivals
ethnicities, and religions. It is an anticipated family local artists to be featured along with regional and na-
homecoming event where people of many cultures and tional touring acts displaying their talents.
races come together in a relaxed, family atmosphere • We provide this festival as a means of demonstrat-
and celebrate cultural diversity on a personal basis. ing to the audience arts that have been handed down
The festival allows people to display their own cultural from generation to generation. . . We focus on [local]
background and learn about others, experience music artisans that produce works that reflect on [our local]
and dance of different cultures, taste and enjoy the food, heritage.
and learn cultural traditions from our area and other
parts of the world. We introduce new performing art- II. The Case Study Sites
ists from other cultural groups and serve as a resource
to organizations and individuals who want to promote The case studies, chosen to represent the diversity
awareness with smaller cultural gatherings. of the nation’s outdoor arts festivals, provided an in-
• . . . founded to expose the public to the genre of music depth look at the breadth of discipline and missions
known as Blues. It is an opportunity to promote our observed in the national study.
town, which is a unique place that we feel will become
a destination for event attenders. The event also allows 21Diversity in Programming and understanding among immigrants and long-stand-
As the national survey of festivals demonstrated, festi- ing residents of the Central Valley near Fresno; and to
vals include a variety of disciplines—music and visual open a public space that enhances expressions of cre-
arts and crafts in particular. The case studies support ativity to stimulate a sense of belonging and promote
this finding. The Houston International Festival (iFest) civic participation. D.U.M.B.O. Art Under the Bridge
presents music, dance, visual arts, cuisine, heritage, Festival celebrates fringe culture in the visual arts and
and educational programming focusing on a country calls itself “the largest urban forum for experimental
or culture. Piccolo Spoleto has seven main categories of art in the United States.”
programming: children and family events, dance, film
and literary arts, music, special events, theater, and vi-
sual arts. Lowell Folk Festival is a celebration of music, Notes
visual arts, and ethnic food. Santa Fe Indian Market 14
Correlation is r=.6, which indicates a moderately strong
emphasizes traditional Native-American art forms correlation between number of artists and performances and size
such as jewelry, pottery, and textiles, and, recently, of festival audience.
painting, sculpture, and newer styles and techniques. 15
A performer is anyone who is performing or displaying at the
festival. Survey respondents were instructed to give the combined
Chicago Jazz Festival focuses on jazz but includes a number of artists who perform during the season. For a group
number of educational opportunities for the audience performance, such as a symphony, each artist in the group was
and community. Tamejavi Festival has several program counted. Multiple appearances by the same artist were counted
only once.
components, such as artistic presentations, films, po-
16
The questionnaire asked respondents to “include performances
etry readings, an outdoor marketplace, and events for
such as concerts, plays, and dance performances but do not
children and families. The artistic presentations vary include unscheduled performances. Count a double-bill as two
but include theater, dance, music, multimedia, and performances.”
storytelling. D.U.M.B.O. Art Under the Bridge Festival 17
Spoleto Festival USA, founded in 1977 by composer Gian Carlo
showcases peer-reviewed contemporary works and Menotti, describes itself as one of the world’s premier performing
arts festivals. Each year, world-renowned artists, American
installations ranging from paintings to printmaking, premieres, and new commissions are presented at the 17-day
tapestry, film, and video art. long festival. The mission of Spoleto Festival USA is to create a
comprehensive and innovative arts festival in Charleston, South
Carolina. The festival produces and presents events featuring an
Diversity of Mission international mix of distinguished artists and emerging talent.
The core purpose of the case study festivals is a cel-
ebration of the arts, but the festivals differ in the de-
tails, including the specific kind of art being celebrated.
Houston’s iFest promotes diversity and educates at-
tenders about diverse cultures through arts, cultural,
and educational programming. Piccolo Spoleto’s mis-
sion is to give access to the larger Spoleto USA Festi-
val17 for everyone, regardless of their economic, social,
or physical circumstances, and to provide an oppor-
tunity for local and regional artists, writers, and per-
formers to appear in Piccolo’s local venue. The Lowell
Folk Festival is billed by organizers as the largest free
music festival in the United States, drawing hundreds
of thousands of people from the local area, the coun-
try, and beyond. Santa Fe Indian Market is one of the
volume i: summary report
world’s preeminent venues for seeing and purchasing
Native-American art. Indian Market provides opportu-
nities to meet contemporary Native–American artists
and to learn about Native-American cultures. Central
to the mission of the Chicago Jazz Festival is celebrat-
ing and honoring the history of jazz in the city. Festival
organizers reach out to potential attenders who have
limited exposure to jazz music; the organizers hope
to educate and build a broader audience for the genre.
The Tamejavi Festival’s mission is threefold: to offer
a medium through which immigrants express them-
22 selves and voice their ideas; to build new relationshipsnational study of outdoor arts festivals
23Sean Capone’s Camera Rosetum, 2009, displayed at the 13th Annual D.U.M.B.O. Art
Under the Bridge Festival in Brooklyn, New York. Photo by Oleg Lugovskoy Jr.
We open the door to the City of Lowell, to the
downtown. It’s not just about hearing the
mariachi, it’s about seeing architecture, the food
you’re eating, the whole experience. The festival
is so layered. It is a chance to hear and listen to
music that I would never have listened to otherwise
and be able to speak with artists and learn about
their craft and see kids being hands-on and eat
the food and listen to music at the same time. It is
so layered that you can expose yourself to many
volume i: summary report
different kinds of art. One of the other things that
the festival does is that it gives people access to
the local artists who are here. We have lots of
smokestacks in Lowell and we have a visual artist
who lights the smokestacks. All kinds of creativity
are released when people see these artistic
activities.
— Festival board member
24Section 2
Public Access to Festivals
A defining characteristic of outdoor arts
festivals is their accessibility for the
public. The majority of festivals have
free admission. Of the admission-
charging festivals, most charge less
than $20 per ticket and have a reduced-fee program.
Festivals are often held in public venues, such as plazas
and parks, and occur in communities of all sizes, from
large cities to small towns.
Figure 7. Percent of Festivals, by Admission
Fee Structure
Fee for
all events
17%
Other
8%
Free for
all events
I. National Survey Results Fee for
59%
some events
Ticketing 17%
Most festivals are priced to make them affordable;
many are free. Over half of the festivals (59%) offer
free admission, and another 17% charge only for select
events (see Figure 7). For 8% of festivals, organizers
described the pricing structure as “other:” something
they believed was other than free, and yet not quite cent (18%) of festivals occur in “other” locations, ven-
free. Such responses included: “The festival is free to ues not found in the choices provided in the survey.
attend but there’s a $6 charge to enter the festival gar- Those additional venues included the parking lot of a
dens;” “the general public pays for admission, but stu- shopping center, a bank parking lot, a horse racetrack,
dents and teachers get in for free on set days;” “this is a an ice arena, artist studios, and a municipal airport.
camp, and students pay tuition;” and “we recommend
a donation of $5.” Community Size
Of all festivals that charge an admission fee for some Outdoor arts festivals are not just the domain of large
or all events (34% of festivals), 56% charge less than cities. In big cities and small towns alike, Americans
$15 per ticket and 68% charge below $20 (Figure 8). have access to festivals. Only 17% of festivals take place
national study of outdoor arts festivals
Only 24 festivals in the national survey charge $50 or in cities with a population of 500,000 or more; 77% oc-
more per ticket, 71% of which are music festivals. cur in towns with fewer than 250,000 residents and
Most festivals that charge $5 or more for admission 30% in towns with fewer than 10,000.
have a reduced fee program. As Figure 9 shows, 75%
of festivals that ordinarily charge admission have a II. Case Study Results
formal program to distribute free tickets or tickets at
a reduced price. The case study results support the national survey find-
ings that outdoor arts festivals are widely accessible to
Venue the public, with few barriers to attendance.
Outdoor arts festivals are held in locations accessible
to the public. The most common venue is a public pla- Ticketing
za or park: 46% of all festival held some or all of their Six of the seven case study festivals offer free admis-
events there, and 25% held some or all of their events sion; only the Houston International Festival charges
in a street. About a third of festivals are held in more an admission fee for all events,18 and through the Target
than one venue; conversely, two-thirds take place in Foundation, iFest provides free admission to all chil-
one venue only. Figure 10 shows the full list of venues dren who are 12 years old and younger. Most of Piccolo
where outdoor arts festivals occur, ranging from res- Spoleto’s programs are free, but some events are tick-
taurants to museums to concert halls. Eighteen per- eted and cost $10–$15. Piccolo Spoleto, which includes 25Figure 8. Percent of Festivals That Charge for Admisison, by Average Fee
>$50 6%
$40–$49.99 4%
$30–$39.99 6%
$20–$29.99 17%
$15–$19.99 12%
$10–$14.99 21%
$5–$9.99 21%You can also read


