COVID-19 Image Data Collection: Prospective Predictions are the Future
←
→
Page content transcription
If your browser does not render page correctly, please read the page content below
COVID-19 Image Data Collection: Prospective Predictions are the Future

                                                                  COVID-19 Image Data Collection:
                                                                Prospective Predictions are the Future

                                           Joseph Paul Cohen                                                              joseph@josephpcohen.com
                                           Mila, University of Montreal
                                           Paul Morrison                                                                paul.j.f.morrison@gmail.com
                                           Mila, Fontbonne University
                                           Lan Dao
arXiv:2006.11988v2 [q-bio.QM] 1 Oct 2020

                                                                                                                       phuong.lan.dao@umontreal.ca
                                           Department of Medicine
                                           Mila, University of Montreal
                                           Karsten Roth                                                                      karsten.rh1@gmail.com
                                           Vector, Mila, Heidelberg University
                                           Tim Q Duong                                                            tim.duong@stonybrookmedicine.edu
                                           Stony Brook Medicine
                                           Marzyeh Ghassemi                                                                 marzyeh@cs.toronto.edu
                                           Vector, University of Toronto

                                           Editor:

                                                                                        Abstract
                                                Across the world’s coronavirus disease 2019 (COVID-19) hot spots, the need to streamline
                                                patient diagnosis and management has become more pressing than ever. As one of the main
                                                imaging tools, chest X-rays (CXRs) are common, fast, non-invasive, relatively cheap, and
                                                potentially bedside to monitor the progression of the disease. This paper describes the first
                                                public COVID-19 image data collection as well as a preliminary exploration of possible use
                                                cases for the data. This dataset currently contains hundreds of frontal view X-rays and is
                                                the largest public resource for COVID-19 image and prognostic data, making it a necessary
                                                resource to develop and evaluate tools to aid in the treatment of COVID-19. It was manually
                                                aggregated from publication figures as well as various web based repositories into a machine
                                                learning (ML) friendly format with accompanying dataloader code. We collected frontal
                                                and lateral view imagery and metadata such as the time since first symptoms, intensive
                                                care unit (ICU) status, survival status, intubation status, or hospital location. We present
                                                multiple possible use cases for the data such as predicting the need for the ICU, predicting
                                                patient survival, and understanding a patient’s trajectory during treatment. Data can be
                                                accessed here: https://github.com/ieee8023/covid-chestxray-dataset

                                           1. Introduction

                                           In the times of the rapidly emerging coronavirus disease 2019 (COVID-19), hot spots and
                                           growing concerns about a second wave are making it crucial to streamline patient diagnosis
                                           and management. Many experts in the medical community believe that artificial intelligence
                                           (AI) systems could lessen the burden on hospitals dealing with outbreaks by processing
                                           imaging data [Kim, 2020; Rubin et al., 2020]. Hospitals have deployed AI-driven computed
                                           tomography (CT) scan interpreters in China [Simonite, 2020] and Italy [Lyman, 2020], as well

                                                                                             1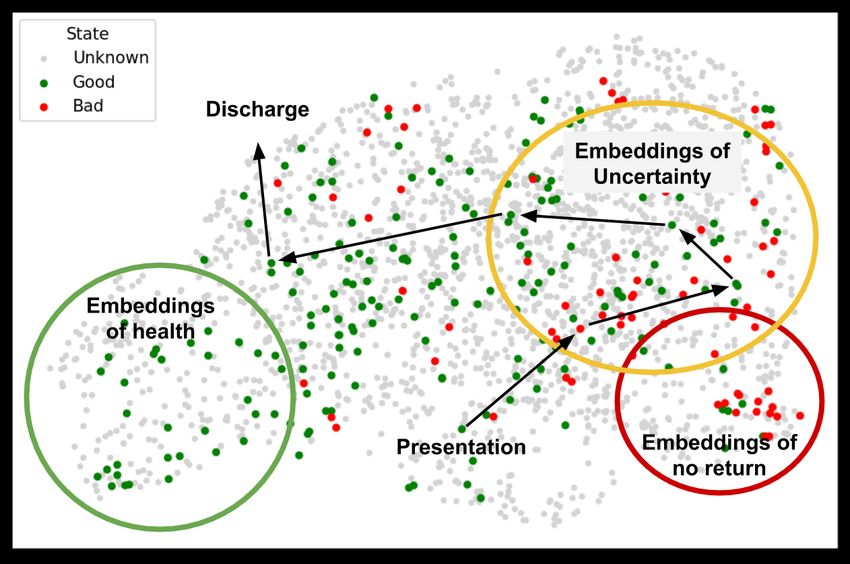
Cohen, Morrison, Dao, Roth, Duong, Ghassemi

as AI initiatives to improve triaging of COVID-19 patients (i.e., discharge, general admission,
or ICU care) and allocation of hospital resources [Strickland, 2020; Hao, 2020].
    Carefully curated and annotated data is the first step to developing any diagnostic or
management tool. While there exist large public datasets of more typical chest X-rays (CXR)
[Wang et al., 2017; Bustos et al., 2019; Irvin et al., 2019; Johnson et al., 2019; Demner-
Fushman et al., 2016], there was no public collection of COVID-19 CXR or CT scans designed
to be used for computational analysis at the time of creating our dataset. We first made
data public in mid February 2020 and the dataset has rapidly grown [Cohen et al., 2020c].
More recently, in June, the BIMCV COVID-19+ dataset [De La Iglesia Vayá et al., 2020]
was released. While it has more samples than the dataset we present, we complement their
work with a focus on prospective metadata from multiple medical centers and countries.
    Many physicians remain reluctant to share their patients’ anonymized imaging data
in open datasets, even after obtaining consent, due to ethical concerns over privacy and
confidentiality and a hospital culture that, in our experience, does not reward sharing [Keen
et al., 2013; Lee and Yoon, 2017; Kostkova et al., 2016; Floca, 2014]. In order to access data in
one hospital, researchers must submit a protocol to the hospital’s institutional review board
(IRB) for approval and build their own data management system. While this is important
for patient safety, such routines must be repeated for every hospital, resulting in a lengthy
bureaucratic process that hurts reproducibility and external validation.
    The ultimate goal of this project is to aggregate all publicly available radiographs,
including papers and other remixable datasets. For research articles, images are extracted
by hand, while for websites, such as Radiopaedia and Eurorad, data collection is partially
automated using scrapers that extract a subset of the metadata while we hand review case
notes to determine clinical events. This work provides three primary contributions:

   • We create the first public COVID-19 CXR image data collection, currently totalling 679
     frontal chest X-ray images from 412 people from 26 countries and growing. The dataset
     contains clinical attributes about survival, ICU stay, intubation events, blood tests,
     location, and freeform clinical notes for each image/case. In contrast to other works,
     we focus on prospective metadata for the development of prognostic and management
     tools from CXR. Images collected have already been made public and are presented in
     an ML-ready dataset with toolchains that are easily used in many testable settings.

   • We also present and discuss clinical use-cases and propose ML tasks that may address
     these clinical use cases such as predicting pneumonia severity, survival outcome, and
     need for the intensive care unit (ICU). Benchmark results using transfer learning with
     neural networks are included.

   • We also discuss how to use the location information in this dataset for a Leave-One-
     Country/Continent-Out (LOCO) evaluation to simulate domain shift and provide a
     more robust evaluation.

    Currently, all images and data are released under the following GitHub URL1 . We hope
that this dataset and tasks will allow for quick uptake of COVID-related prediction problems
in the machine learning community.
 1. https://github.com/ieee8023/covid-chestxray-dataset

                                               2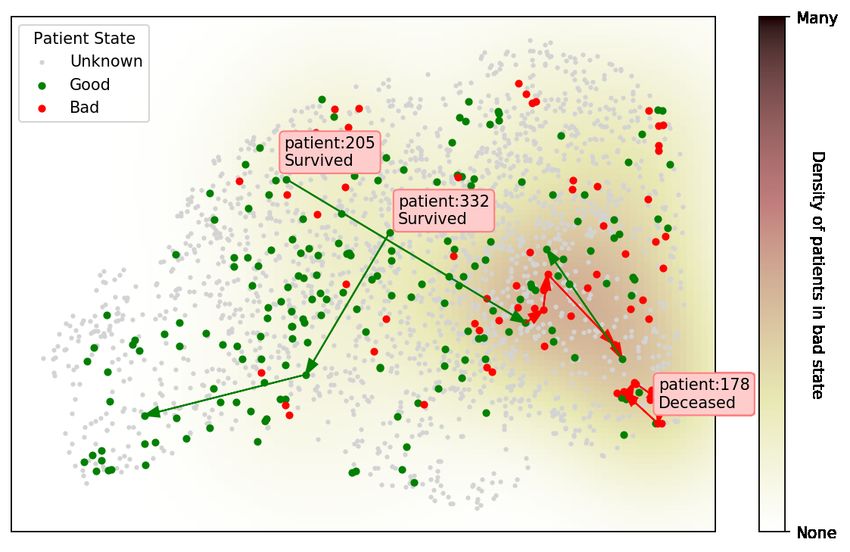
COVID-19 Image Data Collection: Prospective Predictions are the Future

2. Background and Related Work
2.1 Learning in Medical Imaging
In recent years, ML applications on CXR data have seen rising interest, such as lung
segmentation [Gordienko et al., 2018; Islam and Zhang, 2018], tuberculosis and cancer analysis
[Gordienko et al., 2018; Stirenko et al., 2018; Lakhani and Sundaram, 2017], abnormality
detection [Islam et al., 2017], explanation [Singla et al., 2020], and multi-modality predictions
Rubin et al. [2018]; Hashir et al. [2020]. With the availability of large-scale public CXR
datasets created with ML in mind (e.g. CheXpert [Irvin et al., 2019], Chest-xray8 [Wang et al.,
2017], PadChest [Bustos et al., 2019] or MIMIC-CXR [Johnson et al., 2019]), neural networks
have even reported being able to achieve performance near radiologist levels [Rajpurkar
et al., 2018, 2017; Irvin et al., 2019; Putha et al., 2018a; Majkowska et al., 2019; Putha et al.,
2018b]. However, there adoption has its own challenges [Couzin-Frankel, 2019].

2.2 Use of Imaging for COVID-19
In this section we will give a high level overview of the recommendations for the clinical use
of imaging in COVID-19 patient management. It should be noted that this list is only meant
to help guide algorithm development and is not medically comprehensive.
    Ever since the dawn of the outbreak, imaging has stood out as a promising avenue of
research and care [Zu et al., 2020; Poggiali et al., 2020]. Particularly in the beginning of the
outbreak, computed tomography (CT) scans captured the attention of both the medical [Ng
et al., 2020; Kanne et al., 2020] and the ML [McCall, 2020] communities.
    From March to May 2020, the Fleischner Society [Rubin et al., 2020], American College
of Radiology (ACR) [ACR, 2020], Canadian Association of Radiologists (CAR) [Dennie et al.,
2020a], Canadian Society of Thoracic Radiology (CSTR) Dennie et al. [2020b], and British
Society of Thoracic Imaging (BSTI) [Nair et al., 2020] released the following recommendations:

   1. Imaging tests (CXR and chest CT scans) should not be used alone to diagnose COVID-
      19 nor used systematically on all patients with suspected COVID-19;

   2. Findings on CT scans and CXR are non-specific and these imaging techniques should
      not be used to inform decisions on whether to test a patient for COVID-19 (in other
      words, normal chest imaging results do not exclude the possibility of COVID-19 infection
      and abnormal chest imaging findings are not specific for diagnosis);

   3. CXR and chest CT scans can be used for patients at risk of disease progression and
      with worsening respiratory status as well as in resource-constrained environments for
      triage of patients with suspected COVID-19.

    However, CXRs remain the first choice in terms of the initial imaging test when caring
for patients with suspected COVID-19. CXRs are the preferred initial imaging modality
when pneumonia is suspected [ACR, 2018] and the radiation dose of CXR (0.02 mSv for a
PA film) is lower than the radiation dose of chest CT scans (7 mSv), putting the patients
less at risk of radiation-related diseases such as cancer [FDA, 2017].
    In addition, CXR are cheaper than CT scans, making them more viable financially for
healthcare systems and patients. [Beek, 2015; Ball et al., 2017]. Finally, portable CXR units

                                                3
Cohen, Morrison, Dao, Roth, Duong, Ghassemi
can be wheeled into ICU as well as emergency rooms (ER) and are easily cleaned afterwards,
reducing impact on patient flow and risks of infection [Dennie et al., 2020a; ACR, 2020].
A recent hypothesis that is increasingly confirmed by research suggesting that COVID-19
is not a pulmonary but rather a vascular disease [Varga et al., 2020] [Ackermann et al.,
2020]. This could explain the wide variety of symptoms and clinical presentations which do
not necessarily include pneumonia but can still lead to ICU hospitalization [Wadman et al.,
2020].
2.3 COVID-19 Prediction from CXR
While many works have attempted to predict COVID-19 through medical imaging, the results
have been on small or private data. Many of these methods use the dataset presented here.
For example, while promising results were achieved by Raj [2020] (90% AUC), these were
reported over a large private dataset and are not reproducible. Additionally, much research is
presented without appropriate evaluations, potentially leading to overfitting and performance
overestimation [Maguolo and Nanni, 2020; Tartaglione et al., 2020; DeGrave et al., 2020].
Many prediction models are not viable for use in clinical practice, as they are inadequately
reported, particularly with regard to their performance, and at strong risk of bias Wynants
et al. [2020]. As study by Murphy et al. [2020] found that an AI system achieved an AUC of
0.81 and was comparable with that of six independent readers.
Most ML work using this dataset has focused on COVID-19 Prediction similar to our
task definition in §5.1. Many have used a transfer learning approach, similar to what we use
for baselines in this work, where a model that is pretrained on existing CXR datasets is used
to construct features from the images in this dataset which are lower dimensional and are
less prone to overfitting [Apostolopoulos and Mpesiana, 2020] [Minaee et al., 2020]. Another
similar approach taken is utilizing a multi-task network which predicts both standard CXR
tasks as well as a COVID-19 task to assign a likelihood to samples and perform anomaly
detection [Zhang et al., 2020]. Another work has utilized the pathology hierarchy we provide
to improve predictions by using the Clus-HMC method [Pereira et al., 2020].
Many groups have also used this dataset to make severity and survival outcome predictions
similar to our task definition in §5.2 and 5.3. Such work like Signoroni et al. [2020] focused
on predicting a Brixia Score which has been clinically studied against severity and outcomes
[Borghesi and Maroldi, 2020b]. It is laborious to create these annotations so an approach by
Amer et al. [2020] predicts a lung segmentation, generates a prediction saliency, and then
calculates the ratio of coverage which acts as a proxy for the Brixia and geographic extent
scores we discuss later.
3. Cohort Details
The current statistics as of September 18th 2020 are shown in Table 1, which presents the
distribution of frontal CXR by diagnosis, types of pneumonia and responsible micro-organisms
when applicable. For each image, attributes shown in Table 2 are collected. Statistics are
presented by sub-region in Table 3 and by projection/view in Table 4. Figures 1 and 2 present
demographics for patients and frontal CXR images. In terms of unique patients the M/F ratio
is 230/139. In total, 761 images were collected, of which 679 are frontal and 82 are lateral
view. Of the frontal views 518 are standard frontal PA/AP (Posteroanterior/Anteroposterior)
4COVID-19 Image Data Collection: Prospective Predictions are the Future
Table 1: Counts of each pneumonia frontal CXR by
type and genus or species when applicable. The hier-
archy structure is shown in the table from left to right.
Information is collected by manually reading clinical
notes for a mention of a confirmed test.
Type Genus or Species Image Count
Viral COVID-19 (SARSr-CoV-2) 468
SARS (SARSr-CoV-1) 16
MERS-CoV 10
Varicella 5
Influenza 4 Figure 1: Age per patient
Herpes 3
Bacterial Streptococcus spp. 13
Klebsiella spp. 9
Escherichia coli 4
Nocardia spp. 4
Mycoplasma spp. 5
Legionella spp. 7
Unknown 2
Chlamydophila spp. 1
Staphylococcus spp. 1
Fungal Pneumocystis spp. 24
Aspergillosis spp. 2
Lipoid Not applicable 8 Figure 2: Offset per image
Aspiration Not applicable 1
Unknown Unknown 59
views and 161 are AP Supine (Anteroposterior laying down). The images originate from
various hospitals across 26 different countries.
3.1 Data Collection
As mentioned earlier, data was largely compiled from public databases on websites such as
Radiopaedia.org, the Italian Society of Medical and Interventional Radiology2 , Figure1.com3 ,
and the Hannover Medical School [Winther et al., 2020b], both manually and using scrapers.
A full list of publications is included in Appendix §C.1.
Images were extracted from online publications, websites, or directly from the PDF using
the tool pdfimages4 . Throughout data collection, we aimed to maintain the quality of the
images. Many articles were found using the list of literature provided by Peng et al. [2020].
A limitation of this approach is that we have no control over the processing between the PAC
system and the pdf or website. However, we believe that information about the radiological
finding was maintained otherwise the image in publication would not be useful.
2. https://www.sirm.org/category/senza-categoria/covid-19/
3. https://www.figure1.com/covid-19-clinical-cases
4. https://poppler.freedesktop.org/
5Cohen, Morrison, Dao, Roth, Duong, Ghassemi
Table 2: Descriptions of each attribute of the metadata
Attribute Description
patientid Internal identifier
offset Number of days since the start of symptoms or hospitalization for each image. If a
report indicates "after a few days", then 5 days is assumed.
sex Male (M), Female (F), or blank
age Age of the patient in years
finding Type of pneumonia
RT_PCR_positive Yes (Y) or no (N) or blank if not reported/taken
survival If the patient survived the disease. Yes (Y) or no (N)
intubated Yes (Y) if the patient was intubated (or ventilated) at any point during this illness or
No (N) or blank if unknown.
went_icu Yes (Y) if the patient was in the ICU (intensive care unit) or CCU (critical care unit)
at any point during this illness or No (N) or blank if unknown.
needed_supplemental_O2 Yes (Y) if the patient required supplemental oxygen at any point during this illness
or No (N) or blank if unknown.
extubated Yes (Y) if the patient was successfully extubated or No (N) or blank if unknown.
temperature Temperature of the patient in Celsius at the time of the image.
view Posteroanterior (PA), Anteroposterior (AP), AP Supine (APS), or Lateral (L) for
X-rays; Axial or Coronal for CT scans
modality CT, X-ray, or something else
date Date on which the image was acquired
location Hospital name, city, state, country
filename Name with extension
doi Digital object identifier (DOI) of the research article
url URL of the paper or website where the image came from
license License of the image such as CC BY-NC-SA. Blank if unknown
clinical_notes Clinical notes about the image and/or the patient
other_notes e.g. credit
Table 3: Statistics with respect to sub-regions. Y/N counts represent only the subset of
images which are labelled.
Frontal Went RT-PCR
Patient CXR Age Survival ICU Intubation COVID-19 Positive Male
Region Sub-region Count Count Mean Y/N Y/N Y/N Count Count Ratio
Africa Northern Africa 5 13 40.00 0/1 0/0 0/0 0 0 0.00
Americas Latin Amer./Caribbean 5 5 42.80 1/0 1/1 0/1 3 1 0.80
Northern America 27 46 53.12 6/5 11/2 11/4 17 15 0.56
Asia Eastern Asia 54 90 55.14 16/6 6/5 8/6 50 40 0.35
South-eastern Asia 9 17 46.67 4/1 1/3 1/3 8 8 0.56
Southern Asia 15 24 48.27 4/0 3/0 3/0 14 14 0.73
Western Asia 13 20 46.92 2/0 3/0 2/0 6 4 0.54
Europe Eastern Europe 4 7 67.50 1/0 0/0 0/0 1 1 0.50
Northern Europe 31 60 58.78 3/3 7/0 7/1 22 18 0.55
Southern Europe 123 195 59.30 31/4 25/9 13/22 91 74 0.63
Western Europe 53 92 52.83 19/2 19/29 1/1 49 5 0.60
Oceania Australia/New Zealand 42 60 50.48 4/0 1/1 1/1 1 2 0.57
Unknown Unknown 31 50 53.64 3/3 6/0 7/2 19 0 0.55
Totals 412 679 55.1 119 133 95 281 182 0.55
A challenge in extracting metadata is the alignment with images. To belong in the same
row as an image, a clinical measurement must have been taken on the same day. It can
be difficult to automatically determine when the measurement was taken if the metadata
6COVID-19 Image Data Collection: Prospective Predictions are the Future
Table 4: Statistics with respect to the projection/view of the CXR. Y/N counts represent
only the subset of images which are labelled.
Patient Age Survival ICU Intubation COVID-19 RT-PCR Male
View/Projection Count Mean Y/N Y/N Y/N Count Positive Ratio
PosteroAnterior (PA) 326 52.21 104/19 53/67 33/55 191 112 0.54
AnteroPosterior (AP) 192 57.93 36/13 58/6 51/15 141 109 0.54
AP Supine 161 57.84 51/20 89/11 42/6 136 64 0.64
Lateral (L) 82 49.78 25/2 5/11 2/16 25 20 0.73
appears outside of image captions. For details on scraper design, see §Appendix C. All scripts
are made publicly available.
4. Experimental Setup
Using this dataset as a benchmark is very challenging because, by the nature of its construction,
it is very biased and unbalanced (recall geographically unbalanced labels in Table 3). This
can lead to many negative outcomes if treated as a typical benchmark dataset [Maguolo and
Nanni, 2020; Cohen et al., 2020b; Seyyed-Kalantari et al., 2020; Kelly et al., 2019]. Unless
otherwise specified only AP and PA views are used to avoid confounding image artifacts of
the AP Supine view.
4.1 Leave-One-Country/Continent-Out (LOCO) Evaluation:
In order to deal with issues of bias, we perform a “leave one country/continent out” (LOCO)
evaluation. This approach is motivated from training bias common in small, unbalanced
datasets. For our evaluation the test set will be composed of data from a single continent.
Ideally, we would separate by countries, but this is not possible given the current distribution
of data. We also note that not every sample is labelled, so models may be trained and
evaluated on data from the same continent, but we ensured that samples in training and
evaluation did not originate from the same research group/image source.
This approach should give us a distributional shift that will allow us to correctly evaluate
the model. For each task, a subset of the samples will have enough representation to be
included. Continents which do not have at least one representative for each class are filtered
out and not used.
4.2 Models and Features
In place of images, features are extracted using a pre-trained DenseNet model [Huang et al.,
2017] from the TorchXRayVison library [Cohen et al., 2020d] which is trained on 7 large
CXR datasets as described in Cohen et al. [2020b]. These datasets were manually aligned
with each other on 18 common radiological finding tasks in order to train a model using all
datasets at once (atelectasis, consolidation, infiltration, pneumothorax, edema, emphysema,
fibrosis, fibrosis, effusion, pneumonia, pleural thickening, cardiomegaly, nodule, mass, hernia,
lung lesion, fracture, lung opacity, and enlarged cardiomediastinum). For example “pleural
effusion" from one dataset is considered the same as “effusion" from another dataset in order
7Cohen, Morrison, Dao, Roth, Duong, Ghassemi
to consider these labels equal. In total, 88,079 non-COVID-19 images were used to train the
model on these tasks. We will use the term pre-sigmoid which refers to the output of the last
layer of the network multiplied by a weight vector corresponding to each task which would
normally then be passed through a sigmoid function. Features will be used in the following
constructions (as in Cohen et al. [2020a]):
• Intermediate features - the result of the convolutional layers and global averaging
(1024 dim vector);
• 18 outputs - each image was represented by the 18 outputs (pre-sigmoid) here:
Atelectasis, Consolidation, Infiltration, Pneumothorax, Edema, Emphysema, Fibrosis,
Effusion, Pneumonia, Pleural Thickening, Cardiomegaly, Nodule, Mass, Hernia, Lung
Lesion, Fracture, Lung Opacity, Enlarged Cardiomediastinum;
• 4 outputs - a hand picked subset of the above mentioned outputs (pre-sigmoid)
were used containing radiological findings more frequent in pneumonia: Lung Opacity,
Pneumonia, Infiltration, and Consolidation;
• Lung Opacity output - the single output (pre-sigmoid) for lung opacity was used
because it was very related to this task. This feature was different from the opacity
score that we would like to predict;
• Image pixels - the image itself as a vector of pixels (224×224=50176).
• Baseline prevalence - to compare against a model which predicted based on the
prevalence of the labels only.
Model training is done using linear or logistic regression with default parameters from
Sci-kit learn [Pedregosa et al., 2011]. An L2 penalty was used with an LBFGS solver. In the
case of “image pixels” an MLP is used with 100 hidden units and ReLU activations Glorot
et al. [2011]. It is trained with full batch gradient decent using an Adam optimizer Kingma
and Ba [2014] (with β1 = 0.9, β2 = 0.999, = 1e−8 , a learning rate of 0.001, and 10% of the
data used for early stopping.
5. Task Ideas with Baseline Evaluations
We present multiple clinical use cases and potential tools which could be built using this
dataset and present a baseline task which is evaluated. We describe the scenarios in detail to
both convey what our group has learned while interacting with clinicians as well as solidify
what the value is of such a model to avoid misguided efforts solving a problem that doesn’t
exist. For the results presented in Tables 6 and 5 a full listing over all data splits is presented
in Appendix §C.2.
5.1 Complement to COVID-19 Pneumonia Diagnosis and Management
Motivation: While reverse transcriptase polymerase chain reaction (RTPCR) assay re-
mains the gold standard for diagnosis, CXR play a major role as the top initial imaging test
for patients with suspected COVID-19 pneumonia [Dennie et al., 2020b]. Because of their
8COVID-19 Image Data Collection: Prospective Predictions are the Future
Table 5: Classification tasks. Evaluation is performed using LOCO evaluation. The metrics
here are the average over each hold out countries test set. AUROC is the area under the
TPR-FRP (ROC) curve, and AUPRC is the area under the precision-recall curve. The scores
are averages over the held out test countries
Task Test Regions Features # params AUROC AUPRC
18 outputs 18+1 0.58±0.12 0.78±0.16
COVID-19
Americas, Intermediate features 1024+1 0.57±0.12 0.77±0.15
0Cohen, Morrison, Dao, Roth, Duong, Ghassemi
Task Specification: The hierarchy of labels (Table 1) allows us to perform multiple
different classification tasks. A first task is to classify COVID-19 from other causal agents
of pneumonia such as bacteria or other viruses. A second task is to distinguish viral from
bacterial pneumonia.
Results: When classifying between COVID/non-COVID most recent works using this
dataset have taken other datasets and treated them as non-COVID-19 [Wang and Wong, 2020;
Apostolopoulos and Mpesiana, 2020] while results with balanced datasets from Tartaglione
et al. [2020] report much lower performance. Our LOCO evaluation aims to avoid these
issues and in Table 5 we find that the best performance is only slightly higher than random
guessing which would yield a 0.5 AUROC. We specifically note that the “4 outputs” which
are commonly associated with Pneumonia are not predictive possibly implying something
about the disease that should be explored more. We find that predicting between bacterial
and viral yields reasonably good performance using intermediate features or the 18 specific
outputs.
5.2 Severity Prediction, Including Intensive Care Unit (ICU) Stay
Motivation: The ICU is reserved for patients who require life support such as mechanical
ventilation. In this invasive intervention reserved for patients unable to breathe on their
own, an endotracheal tube is inserted into the windpipe (intubation) and the lungs are
mechanically inflated and deflated [Tobin and Manthous, 2017]. Predicting the need for
mechanical ventilation in advance could help plan management or prepare the patient.
Another challenge is knowing when to remove mechanical ventilation (extubation), which
falls in a specific window of time [Thille et al., 2013].
Assessing the severity of a patient’s condition is a key aspect of patient management. The
Brixia score [Borghesi and Maroldi, 2020b; Signoroni et al., 2020] and the modified RALE
score [Wong et al., 2019; Cohen et al., 2020a] were developed specifically with in context of
assessing COVID-19 severity from CXR. 94 severity score labels were contributed to images
in this dataset by Cohen et al. [2020a] and 192 images were given a Brixia score by Signoroni
et al. [2020]. Non-ML work by Allenbach et al. [2020] combines information from CT scans
and CXR with other clinical information to create a score-based predictive model for transfer
to the ICU. A model which predicts the severity of COVID-19 pneumonia and pneumonia in
general based on CXR could be used as an assistive tool when managing patient care for
escalation or de-escalation of care, especially in the ICU.
Predicting these events could be confounded by the presence of an endotracheal tube
in the CXR of a mechanically ventilated patient; when available, this is annotated in our
dataset.
Due to the reduced mobility of ICU patients, CXR are often obtained with the patient
lying down in a view referred to as “AP supine” [Khan et al., 2009], which includes but is
not limited to patients who are intubated or soon to be. Because this position drastically
modifies the appearance of the CXR, a naive approach could confound such changes with
the need to be intubated.
Task Specification: The severity scores created for this dataset by Cohen et al. [2020a]
provide two scores for 94 PA images: Geographic Extent (0-8), how much opacity covers
10COVID-19 Image Data Collection: Prospective Predictions are the Future
Table 6: Regression Tasks. Evaluation is performed using LOCO evaluation. The metrics
here are the average over each held-out-continents test set. R2 : coefficient of determination;
MAE: mean absolute error. “4 outputs" refers to Lung Opacity, Pneumonia, Infiltration, and
Consolidation.
# of Pearson
Task Test Regions Features R2 MAE
parameters Correlation
4 outputs 4+1 0.82±0.05 0.62±0.05 1.11±0.08
Geographic
18 outputs 18+1 0.80±0.09 0.59±0.17 1.15±0.15
Extent
Asia, Europe lung opacity output 1+1 0.80±0.05 0.58±0.02 1.15±0.01
N=94
Intermediate features 1024+1 0.77±0.06 0.41±0.17 1.41±0.08
Baseline prevalence 1+1 0.00±0.00 -0.33±0.25 2.14±0.31
4 outputs 4+1 0.79±0.07 0.61±0.11 0.73±0.10
Opacity lung opacity output 1+1 0.79±0.07 0.60±0.09 0.76±0.10
N=94 Asia, Europe 18 outputs 18+1 0.66±0.13 0.29±0.26 0.90±0.16
Intermediate features 1024+1 0.68±0.11 -0.09±0.45 1.20±0.26
Baseline prevalence 1+1 0.00±0.00 -0.26±0.20 1.30±0.00
the lungs, and Opacity (0-6), how opaque the lungs are. Images are scored by two chest
radiologists (each with at least 20 years of experience) and a radiology resident. The scoring
system has been adapted from Wong et al. [2019].
Also, an ICU stay and the patient being intubated are both predicted given patients
between 0 and 8 days from symptoms/presentation. Images marked as intubation present
are excluded from the evaluation as this would be a visible confounder in the image. For
ICU stay prediction images marked as already in the ICU are excluded.
Results: Table 6 shows performance similar to that reported by Cohen et al. [2020a]. The
evaluation used in that work is not LOCO.
Table 5 shows ICU stay is predicted reasonably well at 0.81 AUROC using all 18 outputs.
The improvement over the “4 outputs” which are associated with Pneumonia may imply that
ICU stay is predictive by features not related to pneumonia. Intubation is predicted poorly.
5.3 Survival outcome
Motivation: Not too dissimilar to severity prediction, determining at what point survival
can be predicted could be useful for patient management. Given a series of patient chest
X-rays over time, it could be possible to determine the probability of survival.
Non ML models are able to predict in-hospital mortality for patients with COVID-19
using an original severity score for CXR (Brixia score) combined with two predictive factors,
which are patient age and immunosuppressive conditions [Borghesi et al., 2020a]. ML models
are able to predict survival based on clinical features (lactate deshydrogenase, lymphocyte
count, and high-sensitivity C-reactive protein) with high accuracy [Yan et al., 2020].
Task Specification: In order to make predictions which are relevant to the clinical context,
it is important to control for the time period when the patient is observed. Our evaluation is
on data between 0 and 8 days since symptoms or admission in order to simulate predicting
at the beginning of management. Predictions will be made on non-intubated patients to
avoid this confounder of severity.
11Cohen, Morrison, Dao, Roth, Duong, Ghassemi
(a) Illustration of Idea (b) Current realization
Figure 3: A UMAP [McInnes et al., 2018] visualization of each CXR from this dataset
together with the Kaggle RSNA pneumonia images. CXRs with a trajectory are shown with
an arrow between timepoints. If survival outcome is known the arrows and/or points are
colored. The background is colored based on the density of points in the ICU or that are
intubated.
Results: In Table 5, almost random performance of 0.55 AUROC is obtained using lung
opacity and the 4 hand picked features of Pneumonia. In general, no method works well.
5.4 Trajectory Prediction
Motivation: The ability to gauge severity of COVID-19 lung infections could be used
to complement other severity tools for escalation or de-escalation of care, especially in the
ICU. Following diagnosis, patients’ CXR could be scored periodically to objectively and
quantitatively track pulmonary disease progression and treatment response. Eventually,
physicians could track patients’ response to various drugs and treatments using CXR and
uploading the images to the dataset, allowing researchers to create predictive tools to measure
recuperation. Such a model could also be used as an objective tool to compare response to
different management algorithms and inspire better management strategies.
If the representation is expressive enough, patients can be plotted as shown in Figure 3a.
A conceptual figure and our current realization are shown using a pre-trained CXR model
showing the available trajectories and patient outcomes. This approach could serve as a way
to iterate quickly with a medical team (to simply explore the learned representation instead
of building complete tools) to make sense of the complexities of these models and patients.
Task Specification: Using this dataset, we could visualize a model’s representation of
CXRs and plot the trajectory of patients according to a color scheme representing their
state/image (good or bad). The representation is based off of the 18 pre-sigmoid outputs of
the DenseNet discussed. A good state is defined as non-intubated, not in the ICU, or the
last state before discharge. An bad state is defined as intubated, in the ICU, or any state
preceding death. A kernel density estimation is taken of the 2d embeddings of all bad states
to illustrate severity. Here PA, AP, and AP Supine images are used to maximize the data
visualized as we did not observe any shift in the representation.
12COVID-19 Image Data Collection: Prospective Predictions are the Future
Results: Figure 3b shows proximity of image embeddings which represent patients in a
good or bad state, demonstrating the potential insight already contained in these pre-trained
models. The three patients display trajectories as we would imagine. Patient 1785 spirals
in an area which appears bad. Patient 2056 progresses into bad states but manages to pull
themselves out. Patient 332 [Sivakorn et al., 2020] seems to recover quickly to a region which
is only populated by good states.
6. Future Task Ideas
There are many potential tasks that we were not able to explore in this work, primarily the
use of saliency maps and the utility of out-of-distribution models.
Evaluating saliency maps can be challenging, but it is a useful evaluation for methods
which aim to explain model predictions [Taghanaki et al., 2019; Singla et al., 2020]. Our
dataset contains lung bounding boxes, which were contributed by Andrew Gough at General
Blockchain, Inc., Inc for 167 images annotated for the left and right lung. Also, 209 generated
lung segmentations were added to the dataset by Selvan et al. [2020]; the team trained a
model on an external dataset and applied it to our dataset. As there are no “ground truth”
segmentations, these can be used to examine if saliency maps are located reasonably within
lung regions to detect overfitting. This can be seen by checking if the predictive regions
of the image lie outside of the region of interest [Ross et al., 2017; Badgeley et al., 2019;
Viviano et al., 2019].
General anomaly detection could be a useful model when trying to identify what is
new about a illness such as COVID-19. Out-of-distribution (OoD) tools [Shafaei et al.,
2018] or unpaired distribution matching models [Zhu et al., 2017; Kim et al., 2017] could
capture the shift in distributions and present them as changes to images Cohen et al. [2018].
Identifying what about the COVID-19 distribution is different from other viral or bacterial
pneumonias could aid in studying both the disease as well as the models representations for
overfitting [Singla et al., 2020]. Transfer learning methods actively under development in
the ML community such as few/zero-shot [Wang et al., 2019; Tian et al., 2020b; Larochelle
et al., 2008; Ren et al., 2019], meta-learning [Andrychowicz et al., 2016; Snell et al., 2017],
deep metric learning [Roth et al., 2020], and domain adaptation [Motiian et al., 2017] will
likely be useful in this setting.
7. Conclusion
This paper presents a dataset of COVID-19 images together with clinical metadata which
can be used for a variety of tasks. This dataset puts existing ML algorithms to the test.
Given the number of existing large CXR datasets, novel tasks related to COVID-19 present
a relevant challenge to overcome. We note that a major limitation of this work is the
selection bias when gathering publicly available images which are likely made public for
educational reasons because they are clear examples or interesting cases. Therefore, they
do not represent the real world distribution of cases. Furthermore, another selection bias
is that the information given on public platforms such as Figure 1 or Radiopaedia might
5. https://www.eurorad.org/case/16660
6. https://radiopaedia.org/cases/covid-19-pneumonia-progression-and-regression
13Cohen, Morrison, Dao, Roth, Duong, Ghassemi
not be complete for all patients and/or omit normal values (e.g., presence or absence of
transfer to the ICU, lymphocyte count). Lastly, we do not yet have variables such as ethnic
background, pre-existing conditions, and immunosuppression status. Any clinical claims
made from models must therefore be backed by rigorous evaluation and take into account
these limitations. Nevertheless, we believe that this dataset and the discussion of clinical
context will contribute towards the machine learning community developing solutions with
potential use in healthcare.
Broader Impact
This project aims to make a dataset of patients with a novel life-threatening disease accessible
to researchers so that tools can be created to aid in the care of future patients. The manner
in which we collect existing public data ensures that patients are not put at risk.
Data impact: Image data linked with clinically relevant attributes in a public dataset
that is designed for ML will enable parallel development of diagnosis and management tools
and rapid local validation of models. Furthermore, this data can be used for a variety of
different tasks.
Tool impact: Tools developed using this data and with the ideas presented can give
physicians an edge and allow them to act with more confidence while they wait for the
analysis of a radiologist by having a digital second opinion confirm their assessment of a
patient’s condition. In addition, these tools can provide quantitative scores which can enable
large scale analysis of CXR without the need for costly/time consuming manual annotations.
Acknowledgements
We thank Dr. Errol Colak, Luke Oakden-Rayner, Rupert Brooks, Hadrien Bertrand, Dr.
Michaël Chassé, and Dr. Carl Chartrand-Lefebvre for their input. This research is based
on work partially supported by the CIFAR AI and COVID-19 Catalyst Grants. This work
utilized the supercomputing facilities managed by Compute Canada and Calcul Quebec. We
thank AcademicTorrents.com for making data available for our research.
Ethics
This project is approved by the University of Montreal’s Ethics Committee #CERSES-20-
058-D
References
Maximilian Ackermann, Stijn E Verleden, Mark Kuehnel, Axel Haverich, Tobias Welte, Florian
Laenger, Arno Vanstapel, Christopher Werlein, Helge Stark, Alexandar Tzankov, et al. Pulmonary
vascular endothelialitis, thrombosis, and angiogenesis in covid-19. New England Journal of Medicine,
2020.
ACR. ACR Appropriateness Criteria for Acute Respiratory Illness in Immunocompetent Patients.
Technical report, American College of Radiology, 2018.
14COVID-19 Image Data Collection: Prospective Predictions are the Future
ACR. ACR Recommendations for the use of Chest Radiography and Computed Tomogra-
phy (CT) for Suspected COVID-19 Infection. Technical report, American College of Radiol-
ogy, 2020. URL https://www.acr.org/Advocacy-and-Economics/ACR-Position-Statements/
Recommendations-for-Chest-Radiography-and-CT-for-Suspected-COVID19-Infection.
Taha Ahmed, Ronak J Shah, Shab E Gul Rahim, Monica Flores, and Amy OLinn. Coronavirus disease
2019 (covid-19) complicated by acute respiratory distress syndrome: An internist’s perspective.
Cureus, 2020. doi: 10.7759/cureus.7482.
Clemens Aigner, Ulf Dittmer, Markus Kamler, Stephane Collaud, and Christian Taube. Covid-
19 in a lung transplant recipient. The Journal of Heart and Lung Transplantation, 2020. doi:
10.1016/j.healun.2020.04.004.
Carolyn M. Allen, Hamdan H. Al-Jahdali, Klaus L. Irion, Sarah Ai Al Ghanem, Alaa Gouda, and
Ali Nawaz Khan. Imaging lung manifestations of HIV/AIDS, 10 2010. ISSN 18171737.
Yves Allenbach, David Saadoun, Georgina Maalouf, Matheus Vieira, Alexandra Hellio, Jacques
Boddaert, Helene Gros, Joe Elie Salem, Matthieu Resche-Rigon, Lucie Biard, Olivier Benveniste,
and Patrice Cacoub. Multivariable prediction model of intensive care unit transfer and death: a
French prospective cohort study of COVID-19 patients. medRxiv, page 2020.05.04.20090118, 5
2020. doi: 10.1101/2020.05.04.20090118.
Rula Amer, Maayan Frid-Adar, Ophir Gozes, Jannette Nassar, and Hayit Greenspan. COVID-19
in CXR: from Detection and Severity Scoring to Patient Disease Monitoring. 8 2020. URL
http://arxiv.org/abs/2008.02150.
Peng An, Ping Song, Kai Lian, and Yong Wang. Ct manifestations of novel coronavirus pneumonia:
A case report. Balkan Medical Journal, 2020. doi: 10.4274/balkanmedj.galenos.2020.2020.2.15.
Marcin Andrychowicz, Misha Denil, Sergio Gómez Colmenarejo, Matthew W. Hoffman, David Pfau,
Tom Schaul, Brendan Shillingford, Nando de Freitas, Sergio Gomez, Matthew W. Hoffman, David
Pfau, Tom Schaul, and Nando de Freitas. Learning to learn by gradient descent by gradient descent.
Neural Information Processing Systems, 6 2016. ISSN 0219-1377. doi: 10.1007/s10115-008-0151-5.
URL http://arxiv.org/abs/1606.04474.
Ioannis D. Apostolopoulos and Tzani A. Mpesiana. COVID-19: automatic detection from X-ray
images utilizing transfer learning with convolutional neural networks. Physical and Engineering
Sciences in Medicine, pages 1–6, 4 2020. ISSN 2662-4729. doi: 10.1007/s13246-020-00865-4.
Akshay Avula, Krishna Nalleballe, Naureen Narula, Steven Sapozhnikov, Vasuki Dandu, Sudhamshi
Toom, Allison Glaser, and Dany Elsayegh. Covid-19 presenting as stroke. Brain, Behavior, and
Immunity, 2020. doi: 10.1016/j.bbi.2020.04.077.
Shuhei Azekawa, Ho Namkoong, Keiko Mitamura, Yoshihiro Kawaoka, and Fumitake Saito. Co-
infection with SARS-CoV-2 and influenza a virus. IDCases, 20:e00775, 2020. doi: 10.1016/j.idcr.
2020.e00775. URL https://doi.org/10.1016/j.idcr.2020.e00775.
Marcus A. Badgeley, John R. Zech, Luke Oakden-Rayner, Benjamin S. Glicksberg, Manway Liu,
William Gale, Michael V. McConnell, Bethany Percha, Thomas M. Snyder, and Joel T. Dudley.
Deep learning predicts hip fracture using confounding patient and healthcare variables. npj Digital
Medicine, 2(1):1–10, 12 2019. ISSN 2398-6352. doi: 10.1038/s41746-019-0105-1.
Lorenzo Ball, Veronica Vercesi, Federico Costantino, Karthikka Chandrapatham, and Paolo Pelosi.
Lung imaging: How to get better look inside the lung, 7 2017. ISSN 23055847.
15Cohen, Morrison, Dao, Roth, Duong, Ghassemi
Debasish Banerjee, Joyce Popoola, Sapna Shah, Irina Chis Ster, Virginia Quan, and Mysore Phanish.
Covid-19 infection in kidney transplant recipients. Kidney International, 2020. doi: 10.1016/j.kint.
2020.03.018.
Edwin JR van Beek. Lung cancer screening: Computed tomography or chest radiographs? World
Journal of Radiology, 7(8):189, 2015. ISSN 1949-8470. doi: 10.4329/wjr.v7.i8.189.
Pavan K. Bhatraju, Bijan J. Ghassemieh, Michelle Nichols, Richard Kim, Keith R. Jerome, Arun K.
Nalla, Alexander L. Greninger, Sudhakar Pipavath, Mark M. Wurfel, Laura Evans, Patricia A.
Kritek, T. Eoin West, Andrew Luks, Anthony Gerbino, Chris R. Dale, Jason D. Goldman, Shane
O’Mahony, and Carmen Mikacenic. Covid-19 in critically ill patients in the seattle region —case
series. New England Journal of Medicine, 2020. doi: 10.1056/nejmoa2004500.
Andrea Borghesi and Roberto Maroldi. Covid-19 outbreak in italy: experimental chest x-ray scoring
system for quantifying and monitoring disease progression. La radiologia medica, 2020a. doi:
10.1007/s11547-020-01200-3.
Andrea Borghesi and Roberto Maroldi. COVID-19 outbreak in Italy: experimental chest X-ray
scoring system for quantifying and monitoring disease progression. Radiologia Medica, 2020b. ISSN
18266983. doi: 10.1007/s11547-020-01200-3.
Andrea Borghesi, Angelo Zigliani, Salvatore Golemi, Nicola Carapella, Patrizia Maculotti, Davide
Farina, and Roberto Maroldi. Chest X-ray severity index as a predictor of in-hospital mortality in
coronavirus disease 2019: A study of 302 patients from Italy. International Journal of Infectious
Diseases, 5 2020a. ISSN 12019712. doi: 10.1016/j.ijid.2020.05.021.
Andrea Borghesi, Angelo Zigliani, Roberto Masciullo, Salvatore Golemi, Patrizia Maculotti, Davide
Farina, and Roberto Maroldi. Radiographic severity index in covid-19 pneumonia: relationship to
age and sex in 783 italian patients. La radiologia medica, 2020b. doi: 10.1007/s11547-020-01202-1.
Aurelia Bustos, Antonio Pertusa, Jose-Maria Salinas, and Maria de la Iglesia-Vayá. PadChest: A
large chest x-ray image dataset with multi-label annotated reports. arXiv preprint, 1 2019. URL
http://arxiv.org/abs/1901.07441.
Xiao Qing Cai, Pi Qi Jiao, Tao Wu, Fu Ming Chen, Bao Shi Han, Jiu Cong Zhang, Yong Jiu Xiao,
Zhi Feng Chen, Jun Li, Yu Ying Zhao, Ling Ma, Yan Liu, Ya Jun Shi, Pei Jun Dai, and Yun Dai
Chen. Armarium facilitating angina management post myocardial infarction concomitant with
coronavirus disease 2019, 2020. ISSN 16715411.
Nanshan Chen, Min Zhou, Xuan Dong, Jieming Qu, Fengyun Gong, Yang Han, Yang Qiu, Jingli Wang,
Ying Liu, Yuan Wei, Jiaan Xia, Ting Yu, Xinxin Zhang, and Li Zhang. Epidemiological and clinical
characteristics of 99 cases of 2019 novel coronavirus pneumonia in wuhan, china: a descriptive
study. The Lancet, 395(10223):507–513, February 2020. doi: 10.1016/s0140-6736(20)30211-7. URL
https://doi.org/10.1016/s0140-6736(20)30211-7.
Shao-Chung Cheng, Yuan-Chia Chang, Yu-Long Fan Chiang, Yu-Chan Chien, Mingte Cheng, Chin-
Hua Yang, Chia-Husn Huang, and Yuan-Nian Hsu. First case of coronavirus disease 2019 (COVID-
19) pneumonia in taiwan. Journal of the Formosan Medical Association, 119(3):747–751, March
2020. doi: 10.1016/j.jfma.2020.02.007. URL https://doi.org/10.1016/j.jfma.2020.02.007.
Joseph Paul Cohen, Margaux Luck, and Sina Honari. Distribution Matching Losses Can Hallucinate
Features in Medical Image Translation. In Medical Image Computing & Computer Assisted
Intervention (MICCAI), 2018.
16COVID-19 Image Data Collection: Prospective Predictions are the Future
Joseph Paul Cohen, Lan Dao, Paul Morrison, Karsten Roth, Yoshua Bengio, Beiyi Shen, Almas
Abbasi, Mahsa Hoshmand-Kochi, Marzyeh Ghassemi, Haifang Li, and Tim Q Duong. Predicting
COVID-19 Pneumonia Severity on Chest X-ray with Deep Learning. arXiv:2005.11856, 5 2020a.
URL http://arxiv.org/abs/2005.11856.
Joseph Paul Cohen, Mohammad Hashir, Rupert Brooks, and Hadrien Bertrand. On the limits
of cross-domain generalization in automated X-ray prediction. In Medical Imaging with Deep
Learning, 2020b. URL https://arxiv.org/abs/2002.02497.
Joseph Paul Cohen, Paul Morrison, and Lan Dao. COVID-19 Image Data Collection.
https://github.com/ieee8023/covid-chestxray-dataset, 2020c. URL https://arxiv.org/abs/2003.
11597.
Joseph Paul Cohen, Joseph Viviano, Mohammad Hashir, and Hadrien Bertrand. TorchXRayVision:
A library of chest X-ray datasets and models. https://github.com/mlmed/torchxrayvision, 2020d.
URL https://github.com/mlmed/torchxrayvision.
Raul Coimbra, Sara Edwards, Hayato Kurihara, Gary Alan Bass, Zsolt J. Balogh, Jonathan Tilsed,
Roberto Faccincani, Michele Carlucci, Isidro Martínez Casas, Christine Gaarder, Arnold Tabuenca,
Bruno C. Coimbra, and Ingo Marzi. European society of trauma and emergency surgery (estes)
recommendations for trauma and emergency surgery preparation during times of covid-19 infection.
European Journal of Trauma and Emergency Surgery, 2020. doi: 10.1007/s00068-020-01364-7.
Jennifer Couzin-Frankel. Medicine contends with how to use artificial intelligence, 6 2019. ISSN
10959203. URL https://science.sciencemag.org/content/364/6446/1119https://science.
sciencemag.org/content/364/6446/1119.abstract.
Le Van Cuong, Hoang Thi Nam Giang, Le Khac Linh, Jaffer Shah, Le Van Sy, Trinh Huu Hung,
Abdullah Reda, Luong Ngoc Truong, Do Xuan Tien, and Nguyen Tien Huy. The first vietnamese
case of COVID-19 acquired from china. The Lancet Infectious Diseases, February 2020. doi:
10.1016/s1473-3099(20)30111-0. URL https://doi.org/10.1016/s1473-3099(20)30111-0.
Farzaneh Dastan, Ali Saffaei, Seyed Mehdi Mortazavi, Hamidreza Jamaati, Nadia Adnani,
Sasan Samiee Roudi, Arda Kiani, Atefeh Abedini, and Seyed MohammadReza Hashemian. Con-
tinues renal replacement therapy (crrt) with disposable hemoperfusion cartridge: A promis-
ing option for severe covid-19. Journal of Global Antimicrobial Resistance, 2020. doi:
10.1016/j.jgar.2020.04.024.
Maria De La Iglesia Vayá, Jose Manuel Saborit, Joaquim Angel Montell, Antonio Pertusa, Aurelia
Bustos, Miguel Cazorla, Joaquin Galant, Xavier Barber, Domingo Orozco-Beltrán, Francisco
Garcia, Marisa Caparrós, Germán González, and Jose María Salinas. BIMCV COVID-19+: a
large annotated dataset of RX and CT images from COVID-19 patients. arXiv:2006.01174, 2020.
Alex J DeGrave, Joseph D Janizek, and Su-In Lee. AI for radiographic COVID-19 detection selects
shortcuts over signal. medRxiv, page 2020.09.13.20193565, 1 2020. doi: 10.1101/2020.09.13.20193565.
URL http://medrxiv.org/content/early/2020/09/14/2020.09.13.20193565.abstract.
Dina Demner-Fushman, Marc D. Kohli, Marc B. Rosenman, Sonya E. Shooshan, Laritza Rodriguez,
Sameer Antani, George R. Thoma, and Clement J. McDonald. Preparing a collection of radiol-
ogy examinations for distribution and retrieval. Journal of the American Medical Informatics
Association, 23(2):304–310, 3 2016. ISSN 1527974X. doi: 10.1093/jamia/ocv080.
Carole Dennie, Cameron Hague, Robert S. Lim, Daria Manos, Brett F. Memauri, Elsie T. Nguyen,
and Jana Taylor. Canadian Society of Thoracic Radiology/Canadian Association of Radiologists
17Cohen, Morrison, Dao, Roth, Duong, Ghassemi
Consensus Statement Regarding Chest Imaging in Suspected and Confirmed COVID-19, 2020a.
ISSN 14882361. URL http://journals.sagepub.com/doi/10.1177/0846537120924606.
Carole Dennie, Cameron Hague, Robert S Lim, Daria Manos, Brett F Memauri, Elsie T Nguyen, and
Jana Taylor. The Canadian Society of Thoracic Radiology (CSTR) and Canadian Association of
Radiologists (CAR) Consensus Statement Regarding Chest Imaging in Suspected and Confirmed
COVID-19. Technical report, 4 2020b. URL https://car.ca/covid-19/.
Elisa Ebrille, Maria Teresa Lucciola, Claudia Amellone, Flavia Ballocca, Fabrizio Orlando, and
Massimo Giammaria. Syncope as the presenting symptom of covid-19 infection. HeartRhythm
Case Reports, 2020. doi: 10.1016/j.hrcr.2020.04.015.
FDA. What are the Radiation Risks from CT? Technical report, U.S. Food and Drug Administration,
2017. URL https://www.fda.gov/radiation-emitting-products/medical-x-ray-imaging/
what-are-radiation-risks-ct.
Giulia Fichera, Roberto Stramare, Giorgio De Conti, Raffaella Motta, and Chiara Giraudo. It’s not
over until it’s over: the chameleonic behavior of covid-19 over a six-day period. La radiologia
medica, 2020. doi: 10.1007/s11547-020-01203-0.
Vural Fidan. New type of corona virus induced acute otitis media in adult. American Journal of
Otolaryngology, 2020. doi: 10.1016/j.amjoto.2020.102487.
Asia Filatov, Pamraj Sharma, Fawzi Hindi, and Patricio S Espinosa. Neurological complications of
coronavirus disease (covid-19): Encephalopathy. Cureus, 2020. doi: 10.7759/cureus.7352.
Ralf Floca. Challenges of Open Data in Medical Research. In Opening Science, pages 297–307.
Springer International Publishing, 2014. doi: 10.1007/978-3-319-00026-8{\_}22.
Xavier Glorot, Antoine Bordes, and Yoshua Bengio. Deep Sparse Rectifier Neural Networks. pages
315–323. Journal of Machine Learning Research, 6 2011. URL http://proceedings.mlr.press/
v15/glorot11a.html.
Yu. Gordienko, Peng Gang, Jiang Hui, Wei Zeng, Yu. Kochura, O Alienin, O Rokovyi, and S Stirenko.
Deep Learning with Lung Segmentation and Bone Shadow Exclusion Techniques for Chest X-
Ray Analysis of Lung Cancer. Advances in Computer Science for Engineering and Education,
page 638–647, 5 2018. ISSN 2194-5365. doi: 10.1007/978-3-319-91008-6{\_}63. URL http:
//dx.doi.org/10.1007/978-3-319-91008-6_63.
Karen Hao. AI is helping triage coronavirus patients. The tools may be here to stay. MIT
Technology Review, 2020. URL https://www.technologyreview.com/2020/04/23/1000410/
ai-triage-covid-19-patients-health-care/.
S.S. Hare, J.C.L. Rodrigues, A. Nair, J. Jacob, S. Upile, A. Johnstone, R. Mcstay, A. Edey, and
G. Robinson. The continuing evolution of covid-19 imaging pathways in the uk: a british society
of thoracic imaging expert reference group update. Clinical Radiology, 2020. doi: 10.1016/j.crad.
2020.04.002.
Mohammad Hashir, Hadrien Bertrand, and Joseph Paul Cohen. Quantifying the Value of Lateral
Views in Deep Learning for Chest X-rays. In Medical Imaging with Deep Learning, 2020.
Carl Heneghan, Annette Pluddemann, and Kamal R. Mahtani. Differentiating viral from bacterial
pneumonia. Technical report, Centre for Evidence-Based Medicine, Nuffield Department of Pri-
mary Care Health Sciences University of Oxford, 2020. URL https://www.cebm.net/covid-19/
differentiating-viral-from-bacterial-pneumonia/.
18COVID-19 Image Data Collection: Prospective Predictions are the Future
Mariko Hiramatsu, Naoki Nishio, Masayuki Ozaki, Yuichiro Shindo, Katsunao Suzuki, Takanori
Yamamoto, Yasushi Fujimoto, and Michihiko Sone. Anesthetic and surgical management of
tracheostomy in a patient with covid-19. Auris Nasus Larynx, 2020. doi: 10.1016/j.anl.2020.04.002.
Michelle L. Holshue, Chas DeBolt, Scott Lindquist, Kathy H. Lofy, John Wiesman, Hollianne
Bruce, Christopher Spitters, Keith Ericson, Sara Wilkerson, Ahmet Tural, George Diaz, Amanda
Cohn, LeAnne Fox, Anita Patel, Susan I. Gerber, Lindsay Kim, Suxiang Tong, Xiaoyan Lu,
Steve Lindstrom, Mark A. Pallansch, William C. Weldon, Holly M. Biggs, Timothy M. Uyeki,
and Satish K. Pillai. First case of 2019 novel coronavirus in the united states. New England
Journal of Medicine, 382(10):929–936, March 2020. doi: 10.1056/nejmoa2001191. URL https:
//doi.org/10.1056/nejmoa2001191.
Wen-Hsin Hsih, Meng-Yu Cheng, Mao-Wang Ho, Chia-Huei Chou, Po-Chang Lin, Chih-Yu Chi,
Wei-Chih Liao, Chih-Yu Chen, Lih-Ying Leong, Ni Tien, Huan-Cheng Lai, Yi-Chyi Lai, and
Min-Chi Lu. Featuring COVID-19 cases via screening symptomatic patients with epidemiologic
link during flu season in a medical center of central taiwan. Journal of Microbiology, Immunology
and Infection, March 2020. doi: 10.1016/j.jmii.2020.03.008. URL https://doi.org/10.1016/j.
jmii.2020.03.008.
Gao Huang, Zhuang Liu, Laurens van der Maaten, and Kilian Q. Weinberger. Densely Connected
Convolutional Networks. In Computer Vision and Pattern Recognition, 2017. URL https:
//arxiv.org/abs/1608.06993.
Wei-Hsuan Huang, Ling-Chiao Teng, Ting-Kuang Yeh, Yu-Jen Chen, Wei-Jung Lo, Ming-Ju Wu,
Chun-Shih Chin, Yu-Tse Tsan, Tzu-Chieh Lin, Jyh-Wen Chai, Chin-Fu Lin, Chien-Hao Tseng,
Chia-Wei Liu, Chi-Mei Wu, Po-Yen Chen, Zhi-Yuan Shi, and Po-Yu Liu. 2019 novel coronavirus
disease (covid-19) in taiwan: Reports of two cases from wuhan, china. Journal of Microbiology,
Immunology and Infection, 2020. doi: 10.1016/j.jmii.2020.02.009.
Jeremy Irvin, Pranav Rajpurkar, Michael Ko, Yifan Yu, Silviana Ciurea-Ilcus, Chris Chute, Henrik
Marklund, Behzad Haghgoo, Robyn Ball, Katie Shpanskaya, Jayne Seekins, David A. Mong,
Safwan S. Halabi, Jesse K. Sandberg, Ricky Jones, David B. Larson, Curtis P. Langlotz, Bhavik N.
Patel, Matthew P. Lungren, and Andrew Y. Ng. CheXpert: A Large Chest Radiograph Dataset
with Uncertainty Labels and Expert Comparison. In AAAI Conference on Artificial Intelligence, 1
2019. URL http://arxiv.org/abs/1901.07031.
Jyoti Islam and Yanqing Zhang. Towards robust lung segmentation in chest radiographs with deep
learning, 2018.
Mohammad Tariqul Islam, Md Abdul Aowal, Ahmed Tahseen Minhaz, and Khalid Ashraf. Ab-
normality detection and localization in chest x-rays using deep convolutional neural networks,
2017.
Ying-Hui Jin, , Lin Cai, Zhen-Shun Cheng, Hong Cheng, Tong Deng, Yi-Pin Fan, Cheng Fang,
Di Huang, Lu-Qi Huang, Qiao Huang, Yong Han, Bo Hu, Fen Hu, Bing-Hui Li, Yi-Rong Li,
Ke Liang, Li-Kai Lin, Li-Sha Luo, Jing Ma, Lin-Lu Ma, Zhi-Yong Peng, Yun-Bao Pan, Zhen-
Yu Pan, Xue-Qun Ren, Hui-Min Sun, Ying Wang, Yun-Yun Wang, Hong Weng, Chao-Jie Wei,
Dong-Fang Wu, Jian Xia, Yong Xiong, Hai-Bo Xu, Xiao-Mei Yao, Yu-Feng Yuan, Tai-Sheng Ye,
Xiao-Chun Zhang, Ying-Wen Zhang, Yin-Gao Zhang, Hua-Min Zhang, Yan Zhao, Ming-Juan Zhao,
Hao Zi, Xian-Tao Zeng, Yong-Yan Wang, and Xing-Huan Wang. A rapid advice guideline for
the diagnosis and treatment of 2019 novel coronavirus (2019-ncov) infected pneumonia (standard
version). Military Medical Research, 2020. doi: 10.1186/s40779-020-0233-6.
19You can also read