Buttressing the Middle: A Case for Reskilling and Upskilling America's Middle-Skill Workers in the 21st Century
←
→
Page content transcription
If your browser does not render page correctly, please read the page content below

Policy Report
                          Buttressing the Middle:
                          A Case for Reskilling and
                  Upskilling America’s Middle-Skill
                      Workers in the 21st Century

                                                     Irwin Kirsch, Anita Sands,
                                            Steve Robbins, Madeline Goodman
                                                        and Rick Tannenbaum

                THE ETS CENTER FOR RESEARCH ON HUMAN CAPITAL AND EDUCATION

Table of Contents

Table of Contents                                                                             This report was written by:

Preface ..................................................................................1   Irwin Kirsch
                                                                                              Anita M. Sands
Introduction ..........................................................................3      Steven B. Robbins
                                                                                              Madeline J. Goodman
Context ..................................................................................4   Richard J. Tannenbaum
The Future of Skills ..............................................................7          The views expressed in this
      Knowledge, Skill, and Ability Expectations ................7                            report are those of the authors
                                                                                              and do not necessarily reflect
      Knowledge, Skill, and Ability Expectations for                                          the views of the officers and
      Emergent Jobs ............................................................ 11           trustees of Educational Testing
                                                                                              Service.
The Paradox of Increasing Skill Expectations ................ 14
Action Agenda ................................................................... 18          Copyright © 2021 by ETS. All
                                                                                              rights reserved. ETS and the
      A Theory of Action for Developing Targeted                                              ETS logo are registered
      Interventions to Improve Adult Skills ...................... 18                         trademarks of ETS. All other
                                                                                              trademarks are the property of
             The Approach ..................................................... 19            their respective owners.
             Components of an ECD Learning and
             Assessment System ........................................... 20                 March 2021

             Mechanisms of an ECD Learning and                                                ETS Center for Research on
             Assessment System ........................................... 22                     Human Capital and
                                                                                                  Education
             Initial Outcomes ................................................. 23
             Long-Term Outcomes ....................................... 24                    Research and Development
Some Final Thoughts ........................................................ 26               Educational Testing Service
                                                                                              Rosedale Road
Appendices ........................................................................ 27        Princeton, NJ 08541-0001
      Appendix A: Bright Outlook Occupations, O*NET
      Crosswork................................................................... 27
      Appendix B: PIAAC Literacy Skills by Level of                                           Suggested citation:
      Educational Attainment, Population 16–34, 2012/                                         Kirsch, Irwin, Anita M. Sands, Steven B.
                                                                                              Robbins, Madeline J. Goodman, and
      2014 ............................................................................ 35    Richard J. Tannenbaum, Buttressing the
                                                                                              Middle: A Case for Reskilling and
About the Authors ............................................................ 36             Upskilling America's Middle-Skill Workers
                                                                                              in the 21st Century. Princeton, NJ:
                                                                                              Educational Testing Service, 2021.

         Buttressing the Middle: A Case for Reskilling and Upskilling America's Middle-Skill Workers in the 21st Century
1                                                                                                                       Preface

Preface
As this report was being written, the tragedy of COVID-19 unfolded. Hundreds of thousands
in the United States lost their lives to the virus, many more lost loved ones, jobs, and homes,
and the U.S. economy plummeted. The path forward will demand much of our nation. We
believe that one of the many critical challenges confronting us is to ensure that American
workers are better insulated from future disruptions. For today's—and by all
estimates—tomorrow's middle skill labor force, that insulation will be significantly improved
through opportunities to acquire quality education and skills.

This new report from the ETS Center for Research on Human Capital and Education argues
that the education and skills individuals possess have become increasingly important to their
overall quality of life. As technology and automation continue to alter the workplace and the
nature of work, the ability of individuals to acquire and augment their skills will remain a key
challenge. Changes in the nature of work over this period have led to what economists refer
to as "employment polarization." The share of employment in well-paid, middle-skill
occupations such as manufacturing has declined while the share in the upper and lower ends
of the occupational skill distribution has increased. In addition, the relative earnings around
the middle of the wage distribution have declined precipitously, leaving these workers with
relatively small wage gains. The important question raised here—and one that has become
even more urgent due to the COVID-19 pandemic—is what to do about this phenomenon.

This paper begins with a discussion of data and reports that identify future job skills and
places them in the context of current skill distributions in the United States. Using data from
a recent international assessment of adult populations, the Programme for the International
Assessment of Adult Competencies (PIAAC), the authors show that large segments of our
adult population fail to demonstrate levels of literacy and numeracy that are associated with
important social and labor market outcomes. Further analyses of these data reveal that
adequate levels of literacy and numeracy skills are also associated with strong performance
on the PIAAC problem-solving tasks. We note that although there are increasing calls for
upskilling higher-order skills such as critical thinking and problem-solving for America's
middle-skill workers, literacy and numeracy skills are the foundations on which these higher-
order skills depend.

The final section of this paper advances a theory of action to address this skills challenge that
involves the development of a learning and assessment system. Based on evidence centered
design principles, this system can be used in a variety of workplace and educational contexts
to significantly improve the literacy, numeracy, and digital skills of tens of millions of adults
who are being left behind. The proposed theory of action is intended to provide policy
makers, researchers, funders, and other stake-holders with a strategy that reimagines the
approach to improving essential skills so that those adults who need upskilling and reskilling
are better able to adapt and thrive in a rapidly changing world—one where education and
skills are likely to play an increasingly important role.

Irwin Kirsch and Anita Sands
The ETS Center for Research on Human Capital and Education

      Buttressing the Middle: A Case for Reskilling and Upskilling America's Middle-Skill Workers in the 21st Century
Acknowledgments                                                                                                         2

Acknowledgments
The authors wish to acknowledge the thoughtful comments and suggestions received from
our reviewers Brent Bridgeman, Patrick Kyllonen, and John Mazzeo of Educational Testing
Service (ETS). While those who reviewed the paper provided valuable comments, all errors of
fact or interpretation are those of the authors. The authors are also grateful for the editorial
support from Kim Fryer and Ayleen Gontz, who improved the paper with their thoughtful
edits. And, finally, the authors wish to thank Nicole Fiorentino and Lingjun Wong for
developing the cover art and for graphics support and Phillip Leung and Darla Mellors for
production and publication support.

      Buttressing the Middle: A Case for Reskilling and Upskilling America's Middle-Skill Workers in the 21st Century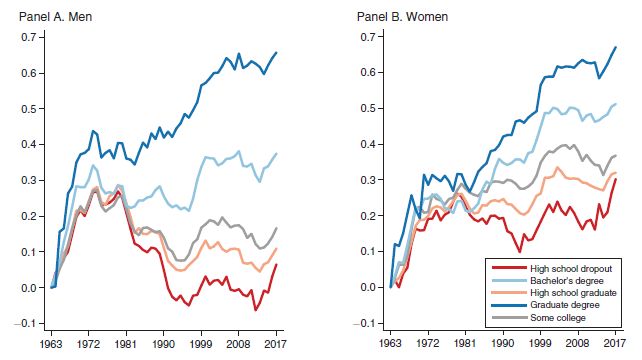
3                                                                                                               Introduction

Introduction
There is clear agreement by now that the role of education and skills in relation to work has
undergone dramatic shifts over the last 40 years. The Council on Foreign Relations® summed
up the issue well in a recent report, noting that the "most important challenge facing the
United States—given the seismic forces of innovation, automation, and globalization that are
changing the nature of work—is to create better pathways for all Americans to adapt and
thrive."1

Myriad policy reports document how technological advances, changes in global supply and
demand chains, and public policies have altered the world of work for many adults currently
in the U.S. labor market and for young adults entering the labor market for the first time.2
The Organisation for Economic Co-operation and Development (OECD®) recently warned
that the COVID-19 crisis will likely speed up changes in global economies as more automation
is introduced into the production process to offset economic downturns.3 Middle-skill
workers, particularly those in traditionally blue-collar and semiskilled white-collar industries
such as manufacturing and clerical work, are being displaced or asked to upskill or retrain at
rates not witnessed since the industrial revolution more than a century ago.4 The Council on
Foreign Relations estimates that, by 2030, as many as a third of American workers will either
need to change occupations or acquire new skills.5

Our goal with this report is to present a case for why we must develop strategic interventions
to buttress America's middle-skill workers not only with higher levels of education but also,
critically, with the skills they need so they are better equipped for the jobs of today—and
those that will most certainly exist in the future. To make this case, we explore the most
pressing future skill demands of middle-skill jobs by examining occupational data and trends.
We also look at what experts suggest are the skill expectations for emergent jobs and how
these skills are distributed in what are now understood to be middle-skill jobs—that is, jobs
requiring education beyond a high school degree but less than a 4-year bachelor's degree.6
The National Academies of Sciences® also refers to these types of jobs as skilled technical
jobs that have emerged "due to the increased complexity of job specific task expectations
tied to technology and automation."7 Part of the aim of this paper is to understand the
demands of these types of jobs not simply in terms of educational attainment, but rather in
terms of the skills likely needed to perform such work successfully. To provide a context for
understanding what we see as a troubling skills challenge ahead for middle-skill workers, we
explore data from international surveys of adult skills along with national data on student
reading and math skills. These assessments reveal important deficits in the very skills that
support success in the work of the future. We end our paper with a theory of action for policy
makers, researchers, and funders that we believe will significantly improve the literacy,
numeracy, and digital skills of adults and put them on a pathway for future educational and
occupational growth. Our approach relies on the development of a learning and assessment
system rooted in evidence centered design (ECD) principles and applicable in a variety of
workplace and educational contexts.

      Buttressing the Middle: A Case for Reskilling and Upskilling America's Middle-Skill Workers in the 21st Century
Context 4
Context
The business, education, and research communities have begun to focus more pointedly on
how work—and the skills and tasks that workers are required to have and perform—has
changed for many who once made up the bulk of the burgeoning middle class throughout
much of the 20th century. In fact, the definition of what constitutes middle-skill work has
shifted dramatically over the course of the last 70 years, as has our understanding of the type
of education and skills needed for this work.
The growth in levels of education through the 20th century is clear in Figure 1, which shows
that about a quarter of the population age 25 and older had earned at least a high school
degree in 1940; 75 years later, in 2015, nearly 90 percent had completed high school.8
Figure 1: High School and College Completion Percentages for the U.S.
Population 25 and Older (1940–2015)
Graph
1940
includes
The
school
There
from
30 percent
y-1940
x-
lower
top
2010
to
was
axis
details
degree
2015.
line
anline
also
to
shows
had
equivalent
represents
of
2015.
on
in
the
growth
completed
1940;
the
percentages
years
figure
In graph
1940,
credential.
in
75
the
from
shows
the
years
college.
percentage
represents
around
percentage
1940
inlater,
that
increments
to5about
2015
in
percent
the
of
2015,
of
the
in
apercent
the
quarter
of
increments
population
of
nearly
population
10
the
points,
of
population
90
ofpopulation
the
ofof
25
from
the
25
population
10
years
years
population
years
025to
25
and
and
100.
and
years
until
older
age
older
older
2010,
25
and
25with
and
had
and
with
older
where
older
acompleted
older
high
college
with
the
had
school
had
aincrement
completion
College
completed
earned
college.
completion
compltion
at
By
is(lower
high
least
five
2015,
which
years
school.
aline)
high
nearly
from
Note: "High school completion" includes equivalent.
Source: U.S. Census Bureau, 1947–2015, Current Population Survey and 1940 Decennial Census9
The steady rise of high school graduation rates in the mid-20th century (as well as increased
years of schooling, even for those who did not earn a high school degree or equivalent)
dovetailed with the growth of more complex manufacturing jobs that required the ability to
read manuals, interpret blueprints, or maintain machinery. Semiskilled and skilled white-
collar work (e.g., clerical, managerial) grew alongside what scholars refer to as the "high
school movement" in the United States.10 During this time, the economy witnessed a large
increase in both productivity and prosperity (in terms of income compensation) with the two
growing in lockstep from roughly 1947–1970.
Buttressing the Middle: A Case for Reskilling and Upskilling America's Middle-Skill Workers in the 21st Century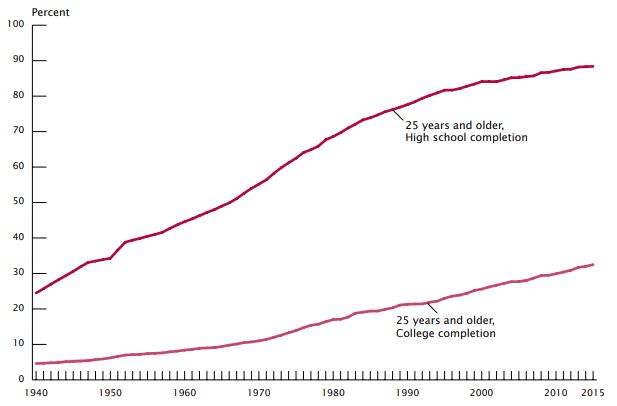
5                                                                                                                            Context

Beginning in the 1970s, though, levels of productivity and wages began to diverge.
Productivity benefited from a combination of technology growth (automation) and the
globalization of supply chains, while the wages of workers became increasingly stratified by
levels of educational attainment. Thus, as one labor economist sums up the period between
1980 and 2010, "Productivity11
                               growth did not translate into shared prosperity, but rather into
employment polarization." This polarization was characterized by the emergence (or
growth) of well-remunerated jobs for highly skilled individuals as well as a growing service
sector that did not require high levels of skills (and/or educational attainment) and
commanded lower wages.

Figure 2 illustrates this polarization by showing the growth in weekly earnings of men and
women ages 16–64 with different levels of educational attainment across roughly five
decades. What is evident for both men and women is that the relative change in weekly
earnings was about the same regardless of level of educational attainment until the late
1970s. After this point, there is a dramatic shift. While earnings for those with higher levels of
education continued to grow—sharply in some cases—the growth in earnings for those with
lower levels of educational attainment dropped off, especially for men. The reasons for this
departure are numerous and complex;12 however, shifts in return to education and skills
played—and continue to play—an important role in this ongoing process.

Figure 2: Cumulative Change in Weekly Earnings of Working Age Adults
16–64, 1963–201713

Graph
The
Lines
College,
For
the highest
    both
    y-axis
    x-axis
      show
       details
         High
         men
           ofcumulative
             for
              each
               School
               and
                 those
                    graph
                    women,
                       Graduate,
                       with
                         change
                          shows
                            acumulative
                              graduate
                                 in
                                  High
                                  percentage
                                  years
                                    wages
                                       School
                                        degree.
                                        from
                                         change
                                           at five
                                               1963
                                               culumlataive
                                                Dropout
                                                   in
                                                    levels
                                                      to
                                                      weekly
                                                         2017
                                                           from
                                                           of education:
                                                               earnings
                                                               in
                                                               change
                                                                 1963
                                                                  increments
                                                                       toinare
                                                                            2017.
                                                                            Graduate
                                                                             weekly
                                                                               atof
                                                                                  the
                                                                                    9earnings
                                                                                      years
                                                                                      lowest
                                                                                       Degree,
                                                                                            tofor
                                                                                               in
                                                                                               2017.
                                                                                                 Bachelor's
                                                                                                  increments
                                                                                                  high school
                                                                                                            Degree,
                                                                                                              of
                                                                                                              drop
                                                                                                                 0.1outs
                                                                                                                    points.
                                                                                                                     Someand at
Source: David H. Autor, "Work of the Past, Work of the Future," AEA Papers and Proceedings 109 (May 2019): 1–32, https://doi.org/
10.1257/pandp.20191110, based on Current Population Survey (CPS) Annual Social and Economic Supplement. Copyright © 2019
American Economic Association; reproduced with permission of the AEA Papers and Proceedings.

The data presented in Figure 2 provides strong evidence for the fact that the nature of work,
and the skills and education required to do work that is well remunerated, has undergone
dramatic changes over the course of the last 40 years. Following World War II, wages for
workers with high school–level skills grew at a similar rate to those with higher levels of
education and skills; increasingly after 1970, this was no the longer the case.

        Buttressing the Middle: A Case for Reskilling and Upskilling America's Middle-Skill Workers in the 21st Century
Context 6
Moreover, the technological and policy shifts that have engulfed our society over these past
five decades have had disparate impacts, with America's working- and middle-class families
bearing a heavy burden. This shift is perhaps most evident in work from two Princeton
University economists, Anne Case and Angus Deaton, who detailed a decline in American life
expectancy and suggested that these "deaths of despair," which they defined as premature
deaths in prime age from suicides, alcohol-related liver diseases, and drug overdose, can be
in part attributed to a deterioration in the lives of Americans who entered adulthood after
1970 without a college degree—the skills measure used in their analysis.14
The concern for those with less than postsecondary education is not new, of course.
President Barack Obama called for sharp increases in postsecondary education for young
adults in order to help address the significant shifts in our economy and labor market.15
Other efforts include the Lumina Foundation®, which challenged the nation to have at least
60 percent of all adults obtain some postsecondary training by 2025.16 A growing body of
research suggests that although postsecondary education leading to a certificate, degree,
and/or credential is important to improving opportunities for the future, the actual skill levels
that workers possess play an even more important role in explaining employment
outcomes.17 What's more, a troubling pattern is emerging where degrees are not as closely
connected to skills as widely thought.18 A powerful example of this finding comes from an
examination of data from a large-scale assessment of adult skills, which indicates that over
half (53 percent) of young adults ages 16–34 with a high school degree and some
postsecondary education, typical of middle-skills workers, lack the skills that many experts
believe are required to meet the challenges of today's technological workplace where middle-
skill occupations are increasingly demanding higher levels of cognitive skills.19
Buttressing the Middle: A Case for Reskilling and Upskilling America's Middle-Skill Workers in the 21st Century7 The Future of Skills
The Future of Skills
Knowledge, Skill, and Ability Expectations
Given the realities we face, how do we best understand what constitutes middle-skills work at
present and how do we best prepare workers to succeed in occupations that make up the
bulk of work in middle-skills occupations? An important aspect of addressing these questions
is to first have a better sense of the types of skills that are expected of workers in middle-skill
jobs.
Middle-skill jobs or occupations (as noted, sometimes referred to as skilled technical jobs) are
a category of jobs and occupations that are variously defined by wage levels, educational
requirements, and/or types of tasks that workers perform.20 Research indicates that the
measure of skill involved in performing tasks required in middle-skill occupations is key to
distinguishing the work within this broad occupational category.21 In addition, labor
economists generally agree that middle-skill work requires specialized education/training
after high school.22 Career and technical educationprograms within the community college
system are typically the vehicle for training and advancement for many middle-skill
occupations.
To understand better the characteristics of work in middle-skill occupations, we turn to data
from the U.S. Department of Labor's Occupational Information Network (O*NET®). O*NET is
a comprehensive, data-driven, occupational classification system. Using a combination of
surveys, expert ratings, and employer data, the O*NET data document knowledge, skill,
ability, and work-style requirements across jobs on five different levels of education,
experience, and training expectations. These levels are referred to as zones and range from 1
(little or no preparation needed) to 5 (extensive preparation needed), with Zone 3 (medium
preparation needed) generally requiring some postsecondary training and certification.23
Our focus is on the skill expectations of jobs in Zone 3. We also want to look at Zone 2 as "on-
ramp" jobs and at Zone 4 as those jobs mostly require a bachelor's degree to investigate
whether Zone 3 and Zone 4 job skill expectations are blurring. Examples of jobs in these
zones include customer service representatives and security guards in Zone 2; electricians,
court reporters, and medical assistants in Zone 3; and sales managers, graphic designers,
and chemists in Zone 4. Jobs in Zones 1 and 5 are excluded from the discussion because our
focus is on creating on-ramps for middle-skill work with the goal of understanding the level
and type of skills that are increasingly expected of middle-skill workers today and into the
future.
Golubovich, Su, and Robbins (2017) investigated the core competencies of middle-skill
workers across multiple domains including abilities, skills, and work styles using data from
O*NET to identify key core competencies of middle-skill jobs.24 Our focus in this report is on
abilities and skills. Abilities are defined as "relatively stable psychological characteristics that
allow individuals to perform particular types of tasks."25 These abilities typically fall across
four categories: cognitive, physical, psychomotor, and sensory, with cognitive abilities
considered to be the best predictor for job performance and training.26 Skills are defined as
"a set of strategies and processes that enable individuals to acquire and work with
information within a specific performance domain." Skills are typically developed over time
and considered "one of the direct determinants of job performance."27 We do not focus on
work styles, which comprise interpersonal and intrapersonal qualities frequently referred to
Buttressing the Middle: A Case for Reskilling and Upskilling America's Middle-Skill Workers in the 21st CenturyThe Future of Skills 8
as noncognitive skills.28 Tables 1 and 2 summarize the key abilities and skills by O*NET job
zone identified by Golubovich et al. to be "integral to success across the majority of middle-
skill jobs."29
Table 1 presents the percentage of jobs by zone where workers' abilities "that influence the
acquisition and application of verbal information in problem solving"30 are deemed important
or very important for success.31 What is immediately clear is that for Zone 4 jobs—a majority
of which require a bachelor's degree—written comprehension (100 percent), written
expression (97.7 percent) inductive reasoning (97.7 percent), and category flexibility (97.7
percent) are deemed to be important or very important worker abilities. Fluency of ideas (79.5
percent) and bringing originality to work to solve problems (75 percent) are also regarded as
important or very important for workers in a majority of Zone 4 jobs. Not surprisingly, from
this analysis, cognitive skills in the service of problem-solving would be essential for success
in Zone 4 jobs.
According to O*NET classifications, Zone 3 jobs typically require a medium level of
preparation and 1 to 2 years of job experience, with most occupations in this zone requiring
vocational school training, on-the-job training, or an associate's degree or more.32 An
analysis of Zone 3 jobs shows a similar pattern as that of Zone 4 jobs for abilities in written
comprehension (90.2 percent), inductive reasoning (88.4 percent), flexibility in thinking (84.8
percent), and the ability to communicate effectively in writing (written expression, 75.9
percent). In other words, as with Zone 4 jobs, an array of cognitive abilities is integral for a
majority of jobs in this largely middle-skill job zone.33 Where Zone 3 and Zone 4 differ is with
respect to the fluency of ideas and originality. This finding may reflect the way expectations
increase to solve problems with a level of creativity and innovation commensurate with
increased job complexity.
Zone 2 jobs require some preparation and are available to those with limited work
experience; the typical level of education for Zone 2 jobs is a high school degree, though
some of the jobs in this zone do require vocational training or more. As can be seen in Table
1, Zone 2 jobs do not rise to the level of cognitive demand seen in Zone 3 and Zone 4 jobs.
Nevertheless, written comprehension and inductive reasoning are considered integral for
half of the jobs in this zone.
Buttressing the Middle: A Case for Reskilling and Upskilling America's Middle-Skill Workers in the 21st Century9 The Future of Skills
Table 1: Select Cognitive Abilities Rated as Important or Very Important by Experts34
O*NET, COGNITIVE ABILITIES DEFINITION JOB JOB JOB DIFF. DIFF. DIFF.
ZONE 2 ZONE 3 ZONE 4 ZONE ZONE ZONE
2-3 2-4 3-4
Written Comprehension The ability to read and 50.7 90.2 100 39.5 49.3 9.8
understand information
and ideas presented in
writing.
Written Expression The ability to 23.2 75.9 97.7 52.7 74.5 21.8
communicate
information and ideas in
writing so others will
understand.
Fluency of Ideas The ability to come up 5.1 33 79.5 27.9 74.4 46.5
with a number of ideas
about a topic (the
number of ideas is
important, not their
quality, correctness, or
creativity).
Originality The ability to come up 6.5 25.9 75 19.4 68.5 49.1
with unusual or clever
ideas about a given topic
or situation, or to
develop creative ways to
solve a problem.
Inductive Reasoning The ability to combine 53.6 88.4 97.7 34.8 44.1 9.3
pieces of information to
form general rules or
conclusions (includes
finding a relationship
among seemingly
unrelated events)
Category Flexibility The ability to generate or 34.1 84.8 97.7 50.7 63.6 12.9
use different sets of
rules for combining or
grouping things in
different ways.
Note. Percent of occupations within zone that have important or very important attribute ratings.35
Data from O*NET OnLine by the U.S. Department of Labor, Employment and Training Administration (USDOL/ETA). Used under
the CC BY 4.0 license. O*NET® is a trademark of USDOL/ETA.
Table 2 examines jobs in Zones 2, 3, and 4 based on the importance of core skills necessary
to "facilitate learning or the more rapid acquisition of knowledge."36 This table shows that for
most jobs in Zone 4, skills such as active learning (95.5 percent), coordination (97.7 percent),
complex problem-solving (93.2 percent), judgment and decision-making (98.9 percent), and
time management (95.5 percent) are judged to be important or very important skills. Reading
comprehension skills are uniformly considered integral (100 percent) across Zone 4 jobs,
which given the strong connection between reading comprehension and knowledge building
is largely expected.37
Buttressing the Middle: A Case for Reskilling and Upskilling America's Middle-Skill Workers in the 21st CenturyThe Future of Skills 10
Zone 3 jobs follow a similar pattern to Zone 4 jobs on skill attributes, especially regarding
reading comprehension (88.4 percent), complex problem-solving (84.8 percent), and
judgment and decision-making (83 percent) skills. Zone 2 jobs largely depart from the pattern
evident in Zones 3 and 4; however, reading comprehension remains an important skill
attribute for nearly half of the jobs in this zone (47.1 percent).
Table 2: Select Skills Rated as Important or Very Important by Experts38
O*NET SKILLS DEFINITION JOB JOB JOB DIFF. DIFF. DIFF.
ZONE 2 ZONE 3 ZONE 4 ZONE ZONE ZONE
2-3 2-4 3-4
Reading Comprehension Understanding written 47.1 88.4 100 41.3 52.9 11.6
sentences and
paragraphs in work
related documents.
Writing Communicating 18.1 65.2 54.7 47.1 36.6 -10.5
effectively in writing as
appropriate for the
needs of the audience.
Active Learning Understanding the 8.7 62.5 95.5 53.8 86.8 33
implications of new
information for both
current and future
problem-solving and
decision-making.
Social Perceptiveness Being aware of others' 34.1 67 86.4 32.9 52.3 19.4
reactions and
understanding why they
react as they do.
Coordination Adjusting actions in 45.7 76.8 97.7 31.1 52 20.9
relation to others'
actions.
Complex Problem-Solving Identifying complex 34.1 84.8 93.2 50.7 59.1 8.4
problems and reviewing
related information to
develop and evaluate
options and implement
solutions.
Judgment and Decision Making Considering the relative 37.7 83 98.9 45.3 61.2 15.9
costs and benefits of
potential actions to
choose the most
appropriate one.
Time Management Managing one's own 32.6 75.9 95.5 43.3 62.9 19.6
time and the time of
others.
Note. Percent of occupations within zone that have important or very important attribute ratings.39
Data from O*NET OnLine by the U.S. Department of Labor, Employment and Training Administration (USDOL/ETA). Used under
the CC BY 4.0 license. O*NET® is a trademark of USDOL/ETA.
A key takeaway from the analysis of attributes and skills by job zone classification is the
substantial degree of similarity in the cognitive abilities and skills deemed integral for jobs in
Zone 3 and Zone 4, despite the differences in training typically associated with these zones.
This finding suggests that the abilities and skills needed for middle-skill jobs, which are
traditionally associated with postsecondary education below a 4-year bachelor's degree and
Buttressing the Middle: A Case for Reskilling and Upskilling America's Middle-Skill Workers in the 21st Century11 The Future of Skills
most prevalent in Zone 3, are similar to those in demand for Zone 4 jobs, which typically
require a bachelor's degree. Also noteworthy is the fact that Zone 3 jobs are well
differentiated from those in Zone 2. These findings have important implications for middle-
skill workers regarding their training/retraining and educational pathways.
Knowledge, Skill, and Ability Expectations for Emergent Jobs
In order to explore the types of skills needed for the future labor market, we examined a
number of different projections, including our own estimate based on O*NET's Bright
Outlook occupations.40 Bright Outlook occupations are those that are expected to grow
faster than average (employment increase of 7 percent or more) from 2018–2028 and/or are
projected to have 100,000 or more job openings in that same period. To understand the skill
needs of jobs in these occupations, each Bright Outlook occupation was recoded to an
O*NET job zone using the O*NET Online Crosswalk search.41 As shown in Figure 3, nearly
half of the Bright Outlook occupations will fall into Zones 3 and 4 by 2028, with less than a
quarter falling below Zone 3 and 29 percent falling in the highest zone. The takeaway here is
that a majority of the growth occupations, according to O*NET, will be in job zones that
require increasingly higher levels of skills.
Figure 3: Percentage of O*NET Bright Outlook Occupations by Job Zone,
2018–2028
35%
29%
30%
25%
25%
23%
20%
20%
15%
10%
5%
3%
0%
Job Zone 1 Job Zone 2 Job Zone 3 Job Zone 4 Job Zone 5
Graph
The
From
Zoney-axis
x-axis
4left
details
is 23
to
shows
right,
percent
the
theand
percentage
barsJob
show:
Zoneof
Job
5Bright
isZone
29 percent.
Outlook
one is 3 occupations
percent, Job Zone
in
byincrements
Job2Zone.
is 20 percent,
of 5 points,
Job Zone
from30isto25
35percent,
percent.Job
Source: O*NET Bright Outlook occupations crosswalked to O*NET job zones by authors using O*NET crosswalk information. See
Appendix A for crosswalk results.
Data from the McKinsey Global Institute (MGI) offer a slightly different take on future skill
demands by analyzing hours worked across all labor sectors using a five-cluster, 25-skill
taxonomy, again, informed by O*NET.42 Specifically, MGI examined the distribution of labor
Buttressing the Middle: A Case for Reskilling and Upskilling America's Middle-Skill Workers in the 21st CenturyThe Future of Skills 12
hours in 2016 and as estimated for 2030 based on automation and macroeconomic trends
and projections. By their calculations, physical and basic cognitive skill hours will decline by
14 percent and 15 percent respectively, while higher cognitive, social and emotional, and
technological skills will increase by 8, 24, and 55 percent respectively (Figure 4). The increases
in the latter three classifications of skills were slightly higher, 9, 26, and 60 percent
respectively, when just considering the United States. With regard to cognitive skills, these
findings may be misleading in the sense that whereas jobs requiring only basic cognitive skill
hours are diminishing, this does not mean that basic or essential skill expectations are not
still required; rather, having this level of skills is subsumed in the higher-order cognitive skills
growth. The notion that one needs these essential cognitive skills in order to build higher-
order cognitive skills is an assumption that we explore in the next section of this paper.
Figure 4: Skills Needed in a Changing Workforce
Graph
Hours
hours
Physical
Basic
Higher
Social
and Technological
cognitive
and
worked
worked
details
cognitive
and
emotional
manual
from
in
skills
skills
2016:
skills
2016
(115
(-15
skills
skills
(140
(8(73
(55
percent),
percent),
to
billion
(203
(-14
(119
(24
billion
billion
percent).
2030:
percent),
percent),
billion
billion
hours),
hours),
hours).
hours),
hours),
Source: Figure from Jacques Bughin, Eric Hazan, Susan Lund, Peter Dahlström, Anna Wiesinger, and Amresh Subramaniam, Skill
Shift: Automation and the Future of the Workforce (Washington, DC: McKinsey Global Institute, 2018), https://www.mckinsey.com/fea-
tured-insights/future-of-work/skill-shift-automation-and-the-future-of-the-workforce. Copyright © 2020 McKinsey & Company. All
rights reserved. Reprinted by permission
Buttressing the Middle: A Case for Reskilling and Upskilling America's Middle-Skill Workers in the 21st Century13 The Future of Skills
Other research similarly supports the contention that more and higher levels of skills have
redefined the baseline needed for today's workplace. Pearson and Nesta (formerly NESTA,
National Endowment for Science, Technology and the Arts) gathered expert panels and
applied trend analyses and machine learning to O*NET data to organize occupations into
high-growth clusters, including advanced manufacturing, skilled trades, health care,
computer and mathematical operations, personal care and service, and engineering and
technology.43 They then examined critical skills required in these emergent jobs, which
allowed them to extrapolate future skill demands. Top-ranked skills included the following:44
• Interpersonal skills
• Higher-order cognitive skills (e.g., critical thinking and decision-making)
• Fluency of ideas skills (e.g., oral and written communication)
• Digital technology skills
• Intercultural fluency skills
Given findings discussed in this section, workers in middle-skill occupations will need higher
levels of skills including, for example, the ability to problem solve and think critically in order
to work effectively alongside new technology and automated processes.In the next section,
we explore one critical question: are middle-skill workers prepared?
Buttressing the Middle: A Case for Reskilling and Upskilling America's Middle-Skill Workers in the 21st CenturyThe Paradox of Increasing Skill Expectations 14
The Paradox of Increasing Skill Expectations
Many readily acknowledge that skills such as problem-solving and critical thinking are
increasingly important, but perhaps what is not fully appreciated is the extent to which these
skills rely upon a strong foundation of literacy and numeracy skills that are increasingly
associated with digital environments. It is difficult—if not impossible—to critically evaluate,
interpret or make meaningful inferences, or problem solve in any area of knowledge without
the ability to decipher various kinds of texts and to meaningfully understand and apply
numeric information in both work and everyday contexts. Research also shows that across a
range of issues including wages, health, and indicators of civic engagement and trust, adults
with higher levels of literacy and numeracy skills fare better than their counterparts with
lower skill levels.45
As we argued previously, the literacy and numeracy skills gained in a typical U.S. high school
education may have been sufficient to acquire and maintain a job paying middle-class wages
during much of the last century. Increasingly since the mid-1970s, however, these skills have
become "just the starting point"46 toward mastering the kinds of competencies needed for
emerging middle-skills jobs.
Extensive research on adult literacy conveys a similar message. As Kirsch et al. noted at the
turn of this century, "[L]iteracy can be thought of as a currency in this society. Just as adults
with little money have difficulty meeting their basic needs, those with limited literacy skills are
likely to find it more challenging to pursue their goals—whether these involve job
advancement, consumer decision making, citizenship, or other aspects of their lives." If this
was an apt statement two decades ago, it is even more so today. In fact, the authors
prophetically warned at the time that "even if adults who performed in the lowest literacy
levels are not experiencing difficulties at present, they may be at risk as the nation's economy
and social fabric continue to change."47
Large-scale assessments of adult proficiencies can help us evaluate the extent to which key
segments of our population are prepared for the challenges they are currently confronting
and those that will almost certainly lie ahead. First administered in 2012, the PIAAC, overseen
by the OECD, seeks to measure the key cognitive and workplace skills individuals need to
succeed in the marketplace and to fully participate in society. This household survey of adults
ages 16–65 years of age is designed to assess essential 21st century literacy and numeracy
skills. Real-world assessment tasks probe respondents' ability to distinguish between relevant
and irrelevant information; correctly fill out online forms; integrate, synthesize, and interpret
arguments offered in various forms of media; understand employment requirements; and
calculate the costs and benefits of retirement plans, to name a few.
Results from PIAAC, shown in Figure 5, reveal that large segments of the U.S. population
(ages 16–65) currently do not possess some of the essential skills upon which they will need
to build their future. In fact, half perform below what many experts identify as a minimum
standard (Level 3) for literacy, and 61.2 percent perform below the minimum standard for
numeracy.48 Moreover, the PIAAC results expose a striking paradox: although a larger
proportion of our young adults (ages 16–34) than ever before are graduating high school or
obtaining certificates and completing some form of postsecondary education, many lack the
essential skills they will likely need to prosper.49 For example, approximately 36 million, or
nearly half of this young age cohort, performs below the minimum standard for literacy, and
nearly 46 million (60 percent of the cohort) performs below the minimum standard for
Buttressing the Middle: A Case for Reskilling and Upskilling America's Middle-Skill Workers in the 21st Century15 The Paradox of Increasing Skill Expectations
numeracy, despite the large share of this cohort graduating from high school and pursuing
postsecondary education and the fact that they are the most recent products of the
educational system.50
Figure 5: Percent of Population by Age Group at Select Performance Levels,
PIAAC Literacy and Numeracy Skills, 2012/2014
% Below Level 3 % At or Above Level 3
100%
80%
60% 50% 53%
40% 39% 40%
20%
0%
20%
40%
60%
51% 47% 60%
61%
80%
100%
Literacy Numeracy Literacy Numeracy
Ages 16-65 Ages 16-34
Graph
percentage
The
ages
Ages
Below
At orhorizontal
percentage
vertical
16
Above
Level
details
— 34
65of
axis
Level
3 on
Literacy:
Numeracy:
(51
(62
(47
(60
student
axis
of
begins
shows
the
percent)
3students
shows
(50
(39
(53
(40
right.
who
percent)
percentage
at 100%,
the
fall
who
two
atdecreases
fall
or
domains,
inabove
below
increments
level
to
literacy
0%3 of
(where
are
and
20%.
represented
numeracy,
0% is the midpoint)
the
by
bythe
vertical
agevertical
group,
and
barthen
bar
with
below
above
increases
ages
the16
the
midpoint,
—midpoint.
again
65 onto
and
the
100%.
the
left and
Source: Graphic prepared by authors using data from the Organisation for Economic Co-operation and Development (OECD),
Programme for the International Assessment of Adult Competencies (PIAAC), 2012/2014
In general, a key difference between the kinds of tasks that those who perform at or above
Level 3 can do compared to those below this standard hinges on the complexity of what an
individual is being asked to do with a text or display of information. For example, in
numeracy, those who perform at Level 2 can likely interpret simple representations of data,
but they struggle to recognize and work with more complex mathematical patterns and
relationships and to interpret and act upon numerical information embedded in a broader
range of common contexts. In literacy, those who perform at Level 2 can likely paraphrase
main ideas contained in relatively short texts or make low-level inferences, yet they struggle
to compare, contrast, evaluate, interpret, and synthesize one or more pieces of information
that require varying levels of inference as well as to construct meaning across a variety of
texts.
In addition to assessing literacy and numeracy skills, the PIAAC assessment includes a
domain called problem-solving in technology-rich environments (PS-TRE). PS-TRE is defined
by the OECD as "using digital technology, communication tools, and networks to acquire and
evaluate information, communicate with others, and perform practical tasks."51 Tasks in this
Buttressing the Middle: A Case for Reskilling and Upskilling America's Middle-Skill Workers in the 21st CenturyThe Paradox of Increasing Skill Expectations 16
domain measure a range of problem-solving skills and abilities including goal setting,
planning, selecting, evaluating, organizing, and communicating results in digital environments
such as interactive web pages, spreadsheets, and email.
Figure 6 demonstrates the important relationship between literacy and higher-order skills by
showing the association between performance on the PIAAC literacy assessment and the
ability of adults to perform well on the PS-TRE tasks. In order to answer just half of the items
correctly on the PS-TRE assessment in PIAAC, one would need to perform in the middle of
Level 3 on the assessment (276–325 on a 0–500 scale). According to the PIAAC results,
approximately 68 percent of young adults in the United States, or slightly over two-thirds of
individuals ages 16–34, performed below the literacy level needed to obtain a score of 50
percent correct on the PS-TRE tasks. Findings were similar for those who pursued
postsecondary education including for over two-thirds of those who either earned a
certificate, attended a trade school, or obtained an associate's degree. Results were
worse—that is, percentages were higher across the board—when looking at the relationship
between numeracy skills and performance on the PS-TRE assessment.
Figure 6: Association of PIAAC Literacy Proficiency with Expected Scores in
PIAAC Problem-Solving in Technology Rich Environments (PS-TRE),
Population 16–34, 2012/14
Graph
increments
literacy
A
The
porportion
expected
vertical
vertical
horizontal
main
line
details
scores
graph
line
proportion
correct
of
axis
intersects
on
50
increase.
shows
axis
shows
the
points.
of
shows
graph
correct
lower
that
the
the
literacy
68%
expected
has
than
trend
onof
aPS-TRE).
50%)
postive
the
line
profiency
proportion
population
where
and
trend,
32%
by
the
means
of
where
of
expected
(53.1
the
correct
population
of
million
thePIAAC
expected
items
porportion
people)
literacy
of
fall
PS-TRE,
proportion
to
fall
correct
scale
right
toinleft
score,
of
increments
onthe
of
ofPSTRE
correct
this
ranging
vertical
vertical
is of
50%.
items
line
from
.10,
line
(having
increases
from
75(with
to0.0
475,
over
an
to
asexpected
in
1.0.
50%
PIAAC
Source: Graphic prepared by authors using data from the Organisation for Economic Co-operation and Development (OECD),
Programme for the International Assessment of Adult Competencies (PIAAC), 2012/2014.
The skills challenge is likewise prevalent among the U.S. incarcerated population, many of
whom will be released into society and in search of sustainable employment opportunities.52
Research shows that large percentages of those who reenter do so, according to the U.S.
PIAAC Survey of Incarcerated Adults, without adequate levels of literacy and numeracy skills.53
We also acknowledge that noncognitive skills associated with risk-taking, lack of emotional
regulation, and social skills are important determinants of workplace success.54
The results from adult skill assessments are matched by equally troubling overall
performance outcomes in reading as well as in mathematics from the National Assessment
of Educational Progress (NAEP) at Grades 4, 8, and 12 (Figure 7). Here again, it is the more
complex knowledge and skills that many of our students are lacking. In reading at Grade 12,
Buttressing the Middle: A Case for Reskilling and Upskilling America's Middle-Skill Workers in the 21st Century17 The Paradox of Increasing Skill Expectations
for example, students below NAEP proficient struggle to locate and integrate information
using sophisticated analyses of the meaning and forms of the text and to provide specific text
support for inferences, interpretative statements, and comparisons. Similarly, 12th graders
who perform below NAEP proficient in mathematics have difficulty not only recognizing when
mathematical concepts, procedures, and strategies are appropriate, but also selecting,
integrating, and applying them to solve mathematical problems.55
Figure 7: NAEP Achievement Levels by Select Subject Area and Grade, 2019
Below Basic Basic Proficient Advanced
100%
80%
60%
9% 9% 4% 10% 6%
40%
3%
20% 32% 29% 31%
26% 24% 21%
0%
20% 31% 35% 33% 35%
40% 39%
40%
60%
34% 19% 27% 31% 30%
80%
40%
100%
Reading Math Reading Math Reading Math
4th Grade 8th Grade 12th Grade
Graph
vertical
represented
The
4th
8th
12th
Below
Basic
Proficiency
Advanced
grade
percentage
vertical
horizontal
grade
(34
(19
(27
(31
(30
(40
Basic
details
bar
percent)
reading:
Math:
=Math:
(9
(4
(10
(6
(3
reading:
(26
(32
(29
(24
(31
(21
below
axis
(9
(31
(40
(39
(33
(35
percent)
bypercent)
percent)
axis
percent)
the
percent)
of
begins
shows
the
students
shows
stacked
midpoint,
percentage
at 100%,
grade
vertical
who and
level
decreases
fallin
bar
in
the
increments
data
the
above
percentage
below
for
to 0%
the
4thbasic
of
(where
midpoint.
grade,
20%.
of and
student
0%
8thbasic
is
grade
the
who
proficiency
midpoint)
and
fall 12th
in thelevels
across
and
proficient
then
are
twoincreases
represented
domains,
and advanced
again
reading
in the
to
levels
100%.
stacked
andare
math.
Source: Graphic prepared by authors using data from the U.S. Department of Education, Institute of Education Sciences, National
Center for Education Statistics, National Assessment of Educational Progress (NAEP), 2019.
Skills deficits evident in this large-scale data are part of a deep and complex problem that we
are currently facing:56 too many adults do not have the essential literacy and numeracy skills
required to support the changing demands of life in our fast-paced, technological world. And,
as the NAEP data reveal, we do not seem to be growing our way out of the problem by
preparing younger students with the skills they will need in the future. This skills issue is an
especially difficult challenge for underskilled workers who will need increasing levels of
literacy and numeracy to adapt to and work alongside technological advances happening
across many middle-skill occupations. A key challenge before us, then, is to develop policies
and interventions that can be put in place to meaningfully improve the literacy and numeracy
proficiencies of those with low skills in order to help pave the way for their success given the
increasing demands of middle-skill work.
Buttressing the Middle: A Case for Reskilling and Upskilling America's Middle-Skill Workers in the 21st CenturyAction Agenda 18
Action Agenda
Increasingly, various stakeholders in the business community, policy makers, and researchers
are calling for significant investments in reskilling and upskilling America's workers, especially
in response to the economic and labor market crises related to COVID-19.57 However, for
reskilling and upskilling efforts to be successful for middle-skill workers, we must be clear
about the kinds of skills these workers will need, the skills many currently have, and how best
to bridge any divide.
To do this, we believe, requires high-quality, targeted interventions grounded in the
assumption that adults with insufficient levels of literacy, numeracy, and increasingly
important digital skills—no matter what level of education or career—can significantly
improve their skill levels when provided with learning and assessment systems that focus on
key underlying constructs that reflect the types of knowledge and skills required for work,
education, and everyday life. To accomplish this, we believe that interventions need to be
developed using coherent, evidence-centered frameworks that clearly define and then
systematically operationalize the acquisition of skills and knowledge that underlie key
cognitive constructs. Moreover, we think this content should be delivered efficiently to
learners through an integrated learning and assessment system that relies on innovative and
flexible approaches that meet the current and future needs of adult learners.
A Theory of Action for Developing Targeted Interventions to
Improve Adult Skills
The theory of action (TOA) presented here is intended to highlight thinking on how to best
develop these targeted solutions. Creating a conceptual framework and highlighting assumed
linkages among actions, the mechanisms of change, and outcomes are common practices
that have a long history in program evaluation research literature.58 Two examples of
researchers using TOA include Randy Bennett in 2010, who used a TOA to describe a
comprehensive formative and summative assessment model for K–12 learners, and Maurice
Cogan Hauck et al., in 2016, who used a TOA to propose a model for English learner language
proficiency assessments within the United States.59 Both presented an explicit rationale for
each component supported by research and theory.
As shown in Figure 8, our approach relies on ECD and includes an innovative delivery
platform that is designed to stimulate and motivate learners and instructors/trainers
throughout the learning experience. After describing our approach, we offer a model that
describes the key components of a learning and assessment system for adults that are
intended to work together to bring about a set of desired or intended outcomes. We also
suggest a set of mechanisms that are likely to bring about the intended outcomes.
Buttressing the Middle: A Case for Reskilling and Upskilling America's Middle-Skill Workers in the 21st Century19 Action Agenda
Figure 8: Theory of Action to Promote Adult Skills Acquisition
EVIDENCE CENTERED DESIGN (ECD) LEARNING AND ASSESSMENT SYSTEM TO IMPROVE SKILLS
Innovative, technology-based delivery platform
COMPONENTS MECHANISMS INITIAL OUTCOMES LONG-TERM OUTCOMES
• Professional materials • Promote efficient and • Learners acquire desired • Learners can successfully
that guide the effective use of the competencies at continue career or
understanding and use learning system for sufficient levels educational
of the system trainers opportunities
• Trainers and instructors
• Instructional materials • Asynchonous and understand the learning • Data is collected to
developed to reflect synchronous instruction and assessment system inform continuous
desired constructs; supporting varied in order to effectively improvement
content can be general learning options support learners • Business leaders,
or job specific
• Motivational strategies • Increase use of formative educators and policy
• Assessments that support learners assessments to support makers value skill gains
and guide learning among key populations
◦ Formative • Immediate feedback to
assessments support learning
containing item sets • Actionable data to
representing specific
evaluate program
competencies,
effectiveness
practice exercises
and interpretative
information
(feedback)
◦ Baseline and
summative
assessments
representing
targeted learning
progressions and
proficiency
benchmarks
The Approach
Recent advances in measurement science provide a model for the design and development
of assessments that focus on the collection of validity evidence to support the development
and appropriate use of the instruments. Linking learning materials with these assessments
requires the same rigor and understanding needed to develop assessments. The approach
used to develop this type of learning and assessment system is referred to as evidence
centered design, or ECD, and offers a critical roadmap for the development of coherent and
quality interventions.60
In brief, an ECD approach requires a conceptual framework in which there is agreement on
an operational definition of target constructs, including the knowledge and skills that should
be assessed and an understanding of how the assessment data will be used. The operational
definition for each construct is developed in collaboration with one or more groups of
domain experts in order to ensure that it reflects current research and thinking in the field.
The conceptual framework then expands upon that definition to further identify the
knowledge and skills of interest. This framework forms a blueprint for the development of an
assessment designed to collect the types of evidence needed to locate individuals along a
continuum or scale of key competencies in the domain of interest (e.g., literacy, numeracy, or
digital skills). With this information, assessment developers can create short descriptions of
the tasks that fall along the scale representing the underlying construct using the features
that were used to build the tasks. Once the assessment items are developed and
Buttressing the Middle: A Case for Reskilling and Upskilling America's Middle-Skill Workers in the 21st CenturyAction Agenda 20
administered, statistical analyses are used to place items along the domain scale, ranging
from easiest to hardest. Then developers create short descriptions of those items, focusing
on the key task features that were defined in the framework and used to build the tasks.
Such descriptions make it possible to go beyond simply identifying that one item was more
difficult than another and, instead, define levels of performance by articulating how the skills
and knowledge required to successfully complete the items progressively change and
increase along the scale. Using such a model provides an opportunity to design and build
standardized assessments that allow for benchmarking proficiency and diagnostic
information that is tied to desired learning progressions. In addition, this model also allows
users to gauge progress and evaluate the need for continued learning.
An effective intervention system should be developed around an innovative, technology-
based delivery platform that will deliver learning and assessment materials in an efficient and
effective manner while also offering maximum flexibility for instructors and learners through
the use of flexible learning options and embedded motivational strategies.
Further, the design features—innovative, technology-based design and delivery—of this
learning and assessment system are expected to support both instructors and learners with
nimble and flexible content delivery options including synchronous, asynchronous, and
blended approaches that can be used across a variety of settings.
Synchronous instruction supports learning by allowing instructors to use their knowledge of
the framework to communicate and elaborate on the learning materials provided. This
approach also allows for, and promotes, interactions among the learners. The system should
be designed to also provide "on demand," or asynchronous learning, that enables learners to
engage in learning and practice at their convenience. The flexibility of the system would fully
support blending these approaches where doing so makes the most sense for learners.
The most important pedagogical features provided by enhanced digital technologies across
learning environments are that the instructional content is presented in small "chunks" or
"micro lessons" that allow for rapid absorption and rehearsal and that practice items are
followed by immediate feedback. Ultimately, the instructional content should be relevant,
allow for learner and instructor control of the learning process, be provided over a relatively
brief period of time, and demonstrate explicit and manageable activities in a proposed task-
interaction learning analytics model.61
Such an approach to learning and instruction supports successive or incremental "wins" for
learners. If learners are expected to sustain their commitment to learning, they need to see
that they are progressing and that they are acquiring the knowledge and skills expected, even
if progress is sometimes slower than learners may wish. This approach is a fundamental
principle of motivation (i.e., building learner self-efficacy).62 If learners do not see even small,
continuous progress, they are less likely to remain committed to their own growth and
development.
Components of an ECD Learning and Assessment System
As Figure 8 illustrates, the underlying premise in our TOA is that targeted interventions that
successfully build on ECD principles tend to share a set of core, integrated components:
support materials that guide understanding and use of the system; instructional materials
grounded in ECD design principles that can be general or job specific; and, assessments,
including formative assessments that guide learning through practice and feedback on
Buttressing the Middle: A Case for Reskilling and Upskilling America's Middle-Skill Workers in the 21st CenturyYou can also read