Skills Mismatches - An Impediment to the Competitiveness of EU Businesses - STUDY - European Economic and Social Committee
←
→
Page content transcription
If your browser does not render page correctly, please read the page content below
© shutterstock: Lightspring

                              Skills Mismatches
                              – An Impediment to the
                              Competitiveness of EU Businesses

                                                                             STUDY

                                    European Economic and Social Committee
Skills Mismatches
         An Impediment to the Competitiveness
                  of EU Businesses

 The information and views set out in this study are those of the authors and do not necessarily
   reflect the official opinion of the European Economic and Social Committee. The European
  Economic and Social Committee does not guarantee the accuracy of the data included in this
                                                 study.
 Neither the European Economic and Social Committee nor any person acting on the European
Economic and Social Committee’s behalf may be held responsible for the use which may be made
                                 of the information contained therein.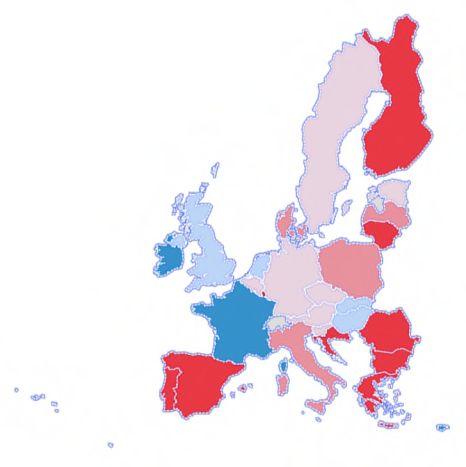
General information

STUDY FOR                           The European Economic and Social Committee
                                    (EESC)

REQUESTING SERVICE                  The Employers' Group

STUDY MANAGING SERVICE              Relations with Organised Civil Society
                                    And Forward Studies Unit
                                    Information and Studies Centr

DATE                                July 2018

MAIN CONTRACTOR                     Institute for
                                    Market Economics

AUTHORS                             Adrian Nikolov; Desislava Nikolova, PhD;
                                    Peter Ganev; Yavor Aleksiev

CONTACTS                            Institute for Market Economics
                                    10 Patriarch Evtimii blvd., fl. 2
                                    Sofia 1142, Bulgaria
                                    e-mail: mail@ime.bg www.ime.bg

IDENTIFIERS

PRINT                QE-02-18-922-EN-C   978-92-830-4158-0     10.2864/448258
PDF                  QE-02-18-922-EN-N   978-92-830-4159-7     10.2864/052607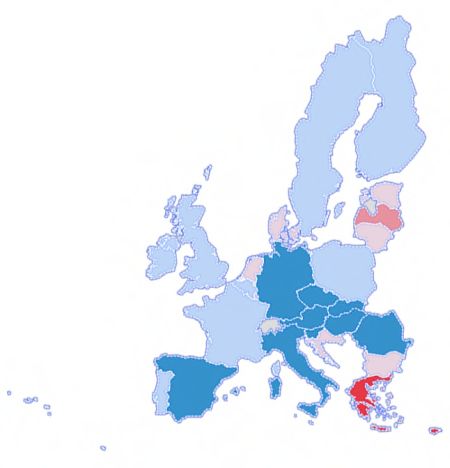
Table of Contents
Abstract................................................................................................................................................... 5
Executive Summary ................................................................................................................................ 6
Methodology ......................................................................................................................................... 10
1. Macroeconomic Background: Productivity and Competitiveness of EU Economies....................... 11
2. The Study of Skills Mismatches ....................................................................................................... 15
   2.1 Skills Mismatches and Labour Market Outcomes ...................................................................... 17
   2.2 Skills Mismatches, Education and Productivity.......................................................................... 18
       2.2.1. Relevant literature............................................................................................................... 18
       2.2.2. Estimated Quantitative Effects of Existing Mismatches on Productivity ........................... 19
   2.3 The Role of VET......................................................................................................................... 21
   2.4 Validation and Recognition of Skills .......................................................................................... 23
   2.5 Skill Obsolescence ...................................................................................................................... 24
3. Skills Mismatches in the EU............................................................................................................. 26
   3.1 IME Survey on Skills Mismatches.............................................................................................. 26
   3.2 A Review of ESJS Results .......................................................................................................... 33
       3.2.1 Which Skills Are the Most Important? ................................................................................ 33
       3.2.2 How Do EU Workers Rate Their Own Skill Level?............................................................ 36
   3.3 Which Skills Actually Matter?.................................................................................................... 39
4. Labour Shortages as a Manifestation of Skills Mismatches ............................................................. 41
   4.1 Labour Market Overview............................................................................................................ 41
   4.2 Mismatch Priority Occupations .................................................................................................. 45
5. Reference Country Labour Market Profiles...................................................................................... 48
   5.1 Austria......................................................................................................................................... 48
   5.2 Bulgaria....................................................................................................................................... 52
   5.3 Finland ........................................................................................................................................ 55
   5.4 Germany...................................................................................................................................... 57
   5.5 Spain ........................................................................................................................................... 60
6. Policy Discussion and Recommendations ........................................................................................ 63
References............................................................................................................................................. 69
Annexes ................................................................................................................................................ 73
Annex 1: EURES Job posts by ISCO codes ..................................................................................... 73
Annex 2: Perceived Importance of Skills by Employees and Employers......................................... 76
Annex 3: Survey Questionnaire ........................................................................................................ 79
2List of Abbreviations
ALMP Active labour market policy
AMS Public Employment Office (Austria)
BA Federal Employment Agency (Germany)
Cedefop Centre for the Development of Vocational Training
DTLA Dynamic Trade Link Analysis
EA Employment Agency (Bulgaria)
EC European Commission
ECB European Central Bank
EDIT Economic Development via Innovation and Technology (Bulgaria)
EIB European Investment Bank
EESC European Economic and Social Committee
ESF European Social Fund
ESJS European Skills and Jobs Survey
EU European Union
EURES European Employment Services
EQF European Qualifications System
FDI Foreign direct investment
FSO Federal Statistical Office (Germany)
GDP Gross domestic product
GVA Gross value added
GVC Global value chains
IAB Institute for Employment Research (Germany)
ICT Information and Communications Technology
ILO International Labour Organization
IME Institute for Market Economics (Bulgaria)
ISCO International Standard Classification of Occupations
IT Information Technology
IVET Initial vocational education and training
KldB German classification of occupations
MPO Mismatch priority occupation
NACE Nomenclature of economic activities
NSI National Statistical Institute (Bulgaria)
NQF National Qualifications System
OECD Organization for Economic Cooperation and Development
PIAAC Program for the International Assessment of Adult Competencies
SA Statistics Austria
SME Small and medium-sized enterprises
VET Vocational education and training
WEF World Economic Forum
XML Extensible Markup Language
3List of Figures
№ Figure Page
1 Productivity Growth in the EU, North America and Asia 12
2 Revealed Comparative Advantage of EU Countries by Export Groups 13
3 European Innovation Scoreboard 2017 14
4 Forms of Skills Mismatches 16
5 Skills, Productivity Growth and Public Policy 20
6 Skills Mismatches and Productivity: Methodological Approach 21
7 Conceptions of Vocational Education 22
8 Labour Market Outcomes – Time Lapse before Finding a Job 23
9 Typology of Skill Obsolescence 25
10 Main Characteristics of Reporting Companies 27
11 Company Perceptions Regarding Employee Recruitment 28
12 Company Perceptions Regarding Employee Recruitment (Past, Present and Future) 29
13 Additional Training and Susceptibility to Skills Mismatches 29
14 Time Required to Fill-In a Vacancy 31
15 Causes and Effects of Skills Mismatches 32
16 Share of Workers According to Chosen Level of Required Fundamental Skills 35
17 Importance of Fundamental and Transversal Skills 36
18 Share of Workers Reporting a Highest Mismatch Rate in Fundamental Skills 38
19 Share of Workers Reporting a Highest Mismatch Rate in Transversal Skills 39
20 Discrepancies between the Perceived Importance of Skills by Employees and Employers 40
21 Overview of Employee Perception Regarding the Importance of Skills 41
22 Factors Limiting Production – Labour 43
23 The Beveridge Curve Explained 44
24 Beveridge Curves for the EU and the Reference Countries 45
25 Higher Skill Level Mismatch Priority Occupations According to Cedefop 46
26 ISCO Groups of Posts 47
27 Beveridge Curve for Austria 49
28 Economic Activities with Rising Employment and Job Vacancy Rates in Austria 51
29 Beveridge Curve for Bulgaria 53
30 Change in the Number of People Employed in Bulgarian Manufacturing 55
31 Number of People Employed in the Bulgarian ICT Sector 55
32 Beveridge Curve for Finland 56
33 Beveridge Curve for Germany 58
34 Job Vacancy Statistics for Germany 59
35 Beveridge Curve for Spain 61
36 Labour Demand for Engineers in Catalonia 62
37 Policy Induced Sources of Skills Mismatches 67
38 Most Problematic Factors for Doing Business in the Reference Countries 68
4Abstract
Skills mismatches are widely accepted as a factor that drags down on potential economic growth and
as such require concrete policy measures both at the EU and national level.
This report was prepared by the Institute for Market Economics (IME) and is dedicated to the study of
skills mismatches in the EU and their effect on the competitiveness of EU businesses. It includes a
comprehensive review of existing literature on the issue and outlines some of the main conclusions
regarding the relation of skill mismatches to education, personal and aggregate productivity, labour
market dynamics and outcomes, innovation capacity and competitiveness. The study also includes the
results of a dedicated survey designed to shed further light on the causes and effects of skills
mismatches from the point of view of companies.
We provide further evidence of the importance of Mismatch Priority Occupations (as identified by
Cedefop), as well as additional insight into potential labour market bottleneck is five reference
countries (Austria, Bulgaria, Finland, Germany and Spain).
Current and long-term demographic trends make skills mismatches an issue of particular acuteness -
against a projected decline in the labour force and an increase in the average age, European economies
cannot afford to waste human capital. We find that efforts in achieving effective VET, lifelong
learning and labour intermediation practices have to be supported by general competitiveness-
enhancing reforms in EU economies. We estimate an EU-wide annual productivity loss of 2.14% due
to existing mismatches.
5Executive Summary
Skills mismatches are widely accepted as a factor that drags down on potential economic growth and
as such require concrete policy measures both at the EU and national level. Current and long-term
demographic trends make this an issue of particular acuteness - against a projected decline in the
labour force and an increase in the average age, European economies cannot afford to waste
human capital.
Previous studies1 on the causes and effects of skills mismatches have shown that:
o Skills mismatches can adversely affect labour productivity and can explain some of the
existing cross-country productivity gaps, while also being reflective of differences in the
policy environment, including education and labour market related regulations and programs;
o Economies which include larger shares of adults with irrelevant skills find it difficult to
introduce productivity-enhancing technologies and new ways of working;
o Skill requirements have and will continue to change rapidly in the presence of technological
advancements and increasing international competition. For instance, basic information and
communications technology (ICT) skills are no longer perceived as sufficient by most EU
workers – the overwhelming majority of them believe that they need moderate ICT skills in
order to do their job;
o The results from both the Program for the International Assessment of Adult Competencies
(PIAAC) and the European Skills and Jobs Survey (ESJS) show that a larger part of the
mismatch is due to over-skilling/education;
o This is a consequence of both ineffective resource allocation (leading to underutilization of
the existing stock of skills) and general imbalances between the skills of the workforce and
labour market demand;
o Efficient education, vocational education and training (VET) and lifelong learning policies
are key to addressing the skills mismatches problem and should be supported by adequate
active labour market policies and intermediation services on behalf of employment agencies;
o Vocational education provides participants with some of the tools necessary to minimize the
risk of prolonged labour market inactivity that can have lasting scarring effect on a person’s
long-term career prospects. The latter is of particular importance, as inactivity itself can be a
potential source of skills mismatches because of the inability of the long-term unemployed to
“keep up” with changing skill requirements.
This report is dedicated to the study of skills mismatches in the EU, while also providing insight on
five pre-selected EU reference countries (Austria, Bulgaria, Finland, Germany and Spain). This
selection ensures that both “newer” and “older”, core and peripheral EU Member States are taken into
account, while also controlling for variations in economic and labour market cycles.
Our findings are supported by macroeconomic, microeconomic and survey-based data, as well as an
extensive review of available research related to ongoing labour market developments at the EU,
national and sectoral levels.
1
An in-depth review of existing studies is available on pages 15-25.
6We conclude that:
Addressing skills mismatches can increase the competitiveness of EU businesses
o Businesses across economic activities in the majority of EU Member States have experienced
a gradual increase of both qualitative and quantitative labour shortages, which is one of the
main macroeconomic manifestations of skills mismatches;
o Effective labour allocation and skill-pool utilization is a vital prerequisite for ensuring the
ability of EU enterprises to continue to develop their innovation capacity and to withstand
increasing competitive pressures;
o Our quantitative assessment of the effect of skills mismatches on the EU economy (based on
ESJS data) indicates an estimated annual productivity loss of 2.14% due to existing
mismatches, which equates to EUR 0.80 per hour worked in 2014 in nominal terms (ESJS’s
reference year);
o Our research provides additional evidence in support of the Mismatch Priority Occupations
(MPOs), established by Cedefop. These are occupations with critical shortage that have
important economic implications. MPOs include both high skilled (ICT professionals,
medical doctors; science, technology, engineering, and mathematics (STEM) professionals;
nurses and midwives; teachers) and intermediate level skilled occupations (such as welders,
cooks and truck drivers).
Businesses are affected negatively by the skills mismatches issue in a variety of ways
In order to gain additional perspective on the causes and effects of skills mismatches, the Institute for
Market Economics (IME) prepared an online survey2 that was carried out in Q4 2017 among Austrian
and Bulgarian companies. The survey was designed with the aim to provide further information on
different aspects of skills mismatches from the point of view of companies. Our results indicate that:
o Skills mismatches affect companies in a variety of ways, among which the need for additional
expenditures on employee training, loss of competitiveness and slower hiring of additional
workers;
o The companies that took part in our survey point to “insufficient traditions in lifelong
learning and (re)qualification” as the most significant factor for skills mismatches;
o While skill mismatches have moderate effect on the expansion plans of companies, firms in
economic activities such as professional, scientific and technical activities, ICT,
transportation and manufacturing are among the most affected in this regard;
o People aged less than 24 years and over 65 years are deemed most susceptible to skills
mismatches, while those aged 40-54 years are perceived as the least likely to be affected by
skills mismatches;
o 71% of companies engaged in professional, scientific or technical services and 67% of ICT
companies assign high significance to the effect that skill mismatches have on the hiring of
additional workers;
o The general consensus among companies is that “finding suitable employees used to be
easier, is currently hard and will become increasingly difficult in the future”;
2
The online survey was carried out in German and Bulgarian among Austrian and Bulgarian employers, respectively. It consisted of 10
questions, covering a variety of topics related to skills mismatches and the way they affect businesses. All questions are available in the
Annexes.
7o Companies face difficulties when trying to find highly qualified workers. They usually need
more than 90 days to fill in positions for professionals and managers, technicians or associate
professionals. On the other hand, finding suitable clerical support or employees in elementary
occupations usually takes less than 30 days.
VET, life-long learning and effective labour intermediation - key to bridging existing skill gaps
o Efficient VET practices and their popularization, as well as further emphasis on lifelong
learning are key to ensuring cross-sectoral mobility. This further fosters flexibility on the
labour supply side in the face of rapid technological advances and international
competitiveness pressures;
o The correct validation of skills acquired outside of formal education systems can only be
supportive of labour mobility, and thus can help alleviate one of the causes of skills
mismatches – informational asymmetry. This is especially true in today’s context with both
learning methods and skill requirements for different occupations changing rapidly with the
onset of new economic and social models;
o Our own survey and the ESJS both point to the need of better points of reference that workers
and companies can use in order to determine their own skill level or that of their employees.
While this may be difficult to achieve in regard to transversal skills (such as teamwork), it
may prove useful in terms of ICT, literacy and numeracy skill levels;
o The capacity of ЕU-level information and intermediation services such as EURES should be
further increased by the adoption of a more closely integrated approach to government labour
market intermediation services. EURES’s dataset should be published as continuously
updated open data. This would enable more timely and comprehensive analysis of labour
market processes, which may be beneficial to both businesses and policymakers in identifying
labour and skills shortages, as well as labour market bottlenecks;
o An in-depth mirror study of the ESJS (a similar study among employers) may be beneficial
for the further study of skills mismatches, as there remains the concern that there is no
sufficient understanding regarding the actual skill requirements of various jobs on the part of
employers.
Broader reforms are also needed
o While there has been significant progress in the design and implementation of EU-wide
support mechanisms that aim to increase the overall competitiveness, access to funds, as well
as the innovation and internationalization capacity of EU enterprises, some of the underlying
structural deterrents to the development of EU businesses are still in place;
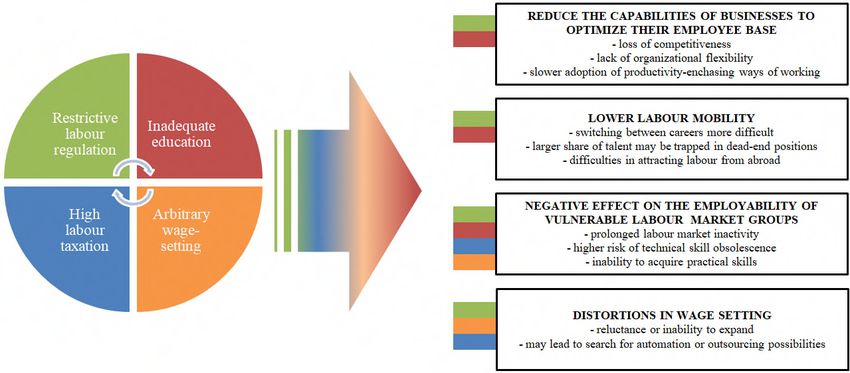
o Certain policy-induced sources of skills mismatches can be traced back to slow educational
reforms, overreaching labour market regulations, excessive labour taxation and arbitrary wage
setting mechanisms. For instance, recent economic and policy developments in countries such
as Finland have underlined the importance of flexible wage setting mechanisms as a tool for
ensuring international competitiveness and more efficient utilization of the existing skill pool;
o Europe needs to bring the competitiveness agenda back to the centre of the economic and
industrial policy debate and addressing skills mismatches is one of the key factors for these
policies to be efficient;
8o The successful tackling of issues related to skills mismatches require a “whole-of-
government” approach which includes both national and regional authorities, educational
institutions, social partners, employers and other stakeholders;
o A regulatory and institutional environment that supports the effective allocation of labour
resources and thus facilitates the skill demand and supply matching process is an important
prerequisite for businesses to adopt new technologies, working processes and business
models;
o Smooth labour migration within the EU, as well as targeted migration from third countries, is
instrumental in addressing the skills mismatches issue and labour shortages in general.
9Methodology
In this research paper we adopt a multidisciplinary approach to the study of skills mismatches, in line
with previous theoretic and empirical work on this topic. We have carried out a comprehensive review
of existing studies on skills mismatches and have outlined some of the main conclusions regarding
education, personal and aggregate productivity, labour market dynamics and outcomes, innovation
capacity and competitiveness.
Our analysis relies on aggregated EU data, as well as country specific data for five reference countries
(Austria, Bulgaria, Finland, Germany and Spain). We have made use of Cedefop’s micro data from
the European Skills and Jobs Survey (ESJS) and primary survey-based information that we have
gathered via our own online survey among companies in Bulgaria and Austria. In the case of
Bulgaria, we have developed a dedicated web application for collecting and processing data from the
online resources of the Employment Agency (EA).
Since methods of collecting, processing and publishing relevant data differ across Member States we
have tried to identify and make use of the most comprehensive official information available (usually
provided by national employment agencies). Where needed, we have supplemented our analysis with
additional information sources. In the country profiles section, we have relied upon the most relevant
and detailed vacancy and wage statistics available, as well as previously published studies.
The policy discussion part of this research paper is based on a comprehensive review of previous
studies into the causes and implications of skills mismatches. We have looked at both the policy-
induced and market-related sources of skills mismatches. Finally, our recommendations are in line
with what we have identified as potential best practices in addressing these issues.
101. Macroeconomic Background: Productivity and Competitiveness of EU Economies
Ever since 2013 labour productivity (per person employed) in the EU has been increasing3 at a modest
pace of about 1.0% annually, which is about two times slower that the average for the pre-crisis
period. While it has traditionally surpassed growth in Northern America, other parts of the world,
such as Asia, have been consistently outperforming both, as can be seen on Figure 1. Differences
remain significant, but workers in Asian countries nowadays achieve 31.2% and 29.0% of the average
productivity in the EU-28 and North America, respectively, compared to just 11.0% and 8.6% back in
1985.
Figure 1: Productivity Growth in the EU, North America and Asia (1985-2016)*
Annual change (3-period moving average), % Change for the entire period (2016 USD)
9 100000
8 90000
7 80000
6 70000
60000
5
50000
4
40000
3
30000
2 20000
1 10000
0 0
-1 1985 2017
-2
1988
1990
1992
1994
1996
1998
2000
2002
2004
2006
2008
2010
2012
2014
2016
*Labour productivity per person employed in 2016 USD
(converted to 2016 price level with updated 2011 PPPs)
Legend: Asia EU-28 North America
Source: The Conference Board Total Economy Database™ (Adjusted version), May 2017
The consequences of these developments in regard to export competitiveness are clearly seen in the
Dynamic Trade Link Analysis4 (DTLA) carried out by the Competitiveness Research Network5
(CompNet). According to CompNet estimates, EU countries and China are direct competitors in
62% of all active product markets and this share has gradually increased for all EU Member
States over time6. In addition, estimates show that these countries’ exports are susceptible to a
possible crowding-out effect by China on between 6 and 11% of these markets.
The revealed comparative advantage (RCA) of EU Member States is most prominent in medium-high
tech exports (Figure 2), which is hardly surprising, since that is where most patenting and R&D
activities are concentrated.
3
European Commission. Employment and Social Developments in Europe (ESDE), Annual Review 2017,p. 22.
4
DTLA monitors the trade links (viewed as a binary variable) of two exporting countries to a common destination market over time. A trade
link is a binary variable that takes the value 1 if there is an active export link and 0 otherwise. By monitoring more than 5000 products in
every bilateral importer-exporter relationship CompNet is able to calculate a number of variables among which the changing share of
overlapping product markets between the EU and China, as well as to identify markets which the EU has “lost” to this competitor.
5
The Competitiveness Research Network(CompNet) is a research network founded in 2012 by the European System of Central Banks
(ESCB). It aims to foster the debate on competitiveness issues by providing a robust theoretical and empirical link between drivers of
competitiveness and macroeconomic performance for the purposes of research and policy analysis.
6
Karadeloglou, P et al., Compendium on the Diagnostic Toolkit for Competitiveness, ECB Occasional Paper No 163, July 2015, p. 37
11Figure 2: Revealed Comparative Advantage of EU Countries by Export Groups (2014)
High-tech industries exports RCA Medium high-tech exports RCA Intermediates RCA
RCA change in reference countries (2014/2000) Map legend
2,00 High tech products 2000 2014
1,50
1,00
0,50
0,00
2,50 Medium high tech products 2000 2014
2,00 Note: A value above 1 means
1,50 that the country has revealed
1,00 comparative advantage in the
0,50 relevant export group. Values
0,00 below 1 are indicative of low
international competitiveness.
1,60
Intermediate products 2000 2014
1,10
0,60
0,10
-0,40
Source: CompNet, IME calculations
12Innovation and Competitiveness
These processes are also reflected in a number of international competitiveness and innovation
rankings. According to the 2017 edition7 of the European Innovation Scoreboard the EU is gradually
catching up to USA (which has deteriorated slightly in the last few years), while still lagging behind
countries such as Japan and South Korea and rapidly losing its edge to China. Further evidence in
support of the need for structural reforms can be found in WEF’s Global Competitiveness Index
reports8. According to WEF’s findings “Europe’s median performance is weakest across the
innovation indicators”9.
Figure 3: European Innovation Scoreboard 2017
Global performance Change in global performance (relative to 2010)
South Korea 130,7 China 13,9
Canada 123,1 South Korea 8
Australia 114,6 Japan 5,9
Japan 111,5 Russia 5,5
United States 102,3 Brazil 3,9
EU 101,8 India 2,3
China 80 South Africa 2,2
Brazil 58,7 Australia 1,8
Russia 52,6 EU 1,8
South Africa 50,2 United States -0,4
India 44,2 Canada -4,1
0 50 100 150 -5 0 5 10 15
Source: European Innovation Scoreboard (2017)
While there has been significant progress in the design and implementation of EU-wide support
mechanisms10 (that aim to increase the overall competitiveness, access to financing, as well as the
innovation and internationalization capacity of enterprises), some of the underlying structural
deterrents to the development of EU businesses are still in place.
Governments have been slow to address long-established issues that affect both the supply and
demand of labour, which has put EU businesses at a disadvantage compared to some of their
international competitors. Concerns are visible even prior to the crisis with the ECB concluding11 that
“labour regulations and relatively heavy taxation, both of households and businesses, are identified
as the prime source of disadvantage, inhibiting technological innovation and ultimately possibly
hurting export performance.”
7
European Innovation Scoreboard, 2017, p. 29
8
WEF. The Global Competitiveness Report 2016-2017, 2016
9
WEF (2016), p. 11
10
Such as the 2007-2013 Competitiveness and Innovation Framework Programme (CIP) and the 2014-2017 Programme for the
Competitiveness of Enterprises and SMEs (COSME).
11
ECB, Competitiveness and the Export Performance of the Euro Area, ECB Occasional Papers No. 30, June 2005, p. 9
13EIB’s definition of competitiveness is “the ability of firms to mobilise and efficiently employ the
productive resources required to successfully offer their goods and services in a global economic
environment”12. If we adopt this definition, then higher productivity (at the firm, industry and national
level) is key to achieving higher international competitiveness13 with efficient matching of skills
demand and supply being one of the key factors for success. The latter is especially important
when we take into account the relative differences in the price of the factors of production (most
notably labour) between EU and some of its major export competitors14.
Effective capital and labour allocation, as well as skill-pool utilization is a vital prerequisite for
ensuring the ability of EU enterprises to continue developing their innovation capacity and to
withstand increasing competitive pressures15.
12
EIB. Restoring EU Competitiveness: 2016 Updated Version. Projects Directorate and the Economics Department of the EIB, 2016, p. 11
13
Another good starting point in understanding the interlinked factors behind increasing competitiveness is Michael Porter’s Diamond
Model of the competitive position of a nation in global environment (see Porter, M. The Competitive Advantage of Nations. The Free Press,
1990.). It looks beyond the classical factors for comparative advantage (such as land, location, natural resources, labour and population size)
and presents four advanced factors, also interlinked, all of which are to some extent influenced by government policy: 1) Firm strategy,
structure and rivalry (competition breeds innovation and raises productivity); 2) Factor conditions (access to human, physical, knowledge,
capital and infrastructure resources); 3) Related support industries (the mutual influence between firms and their suppliers); 4) Demand
conditions (such as the size and growth of domestic demand and the level of buyers’ sophistication, which pushes innovation).
14
China, in particular, is catching up not only in terms of innovation, but in terms of product sophistication as well.
15
Indeed, the development of more sophisticated intra-EU value chains via the outsourcing of production processes to newer EU member
states in the last decade has been an undoubtedly export-enhancing factor for many industries, including the automotive industry, ICT and
business services.
142. The Study of Skills Mismatches
Skills mismatches are a growing concern in the EU, despite the fact that the characteristics and
severity of the problem vary across member states, economic activities and occupations. Public
policy, human capital and formal education institutions find it increasingly difficult to adjust to
rapidly changing labour market conditions. It is this trend, brought upon by globalization and
technological advances, as well as intra- and extra-EU competitive pressures, which determines the
rising importance of lifelong learning, effective VET practices, validation of competences and other
relevant public policies.
The two main factors behind skills mismatches can be generally described as follows:
o Slow adaptability of education and training systems (and thus skills in general) to the process
of creative destruction16 in the economy - i.e. the permanent replacement of established
products, businesses and activities with new alternatives;
o Low labour mobility across economic activities and regions, including due to cultural factors,
information asymmetries, labour market bottlenecks (including diploma/qualification
recognition), deficiencies in labour intermediation and existing public policies and
regulations.
There are five widely accepted17 forms of skills mismatches, as presented in Figure 4.
Figure 4: Forms of Skills Mismatches
Demand for a particular type of skill exceeds the supply of people with that skill at
Skill shortage
equilibrium rates of pay.
The level/field of qualification is different from that required to perform the job
Qualification mismatch
adequately.
Over-(Under-) The level of qualification/education is higher or lower than what is required to perform
qualification/education the job adequately.
Skill gap The type or level of skills is different from that required to perform the job adequately.
Over-(Under-) skilling The level of skill is higher or lower than required to adequately perform the job.
Sources: OECD, Cedefop, WEF
Skills mismatches are also related to other labour market and economic phenomena that are
increasingly monitored and analysed in recent years such as rate of underemployment, structural
unemployment, unemployment and inactivity traps, job polarization, income inequality, etc. The
higher the mismatches (in all their dimensions), the larger the drag on actual and potential economic
growth. This issue is of particular acuteness in Europe, which ranks among the world’s regions with
the worst demographic trends.
Despite numerous attempts by organizations and individual researchers to develop methodologies for
the identification and evaluation of skill mismatches, a more widely accepted approach is yet to be
adopted. As with other economic and social phenomena that have relatively recently gained wider
recognition as drivers for public policy, the main challenges to the development of a comprehensive
16
Schumpeter, J. Capitalism, Socialism and Democracy. 1942, pp 81-86.
17
WEF. Matching Skills and Labour Market Needs Building Social Partnerships for Better Skills and Better Jobs. Global Agenda Council
on Employment at the World Economic Forum (WEF), 2014, p. 7.
15theoretical apparatus are the lack of accumulated data and (to a lesser extent) studies on the subject.
Since the “skills” of the labour force are not measured by regular EU-wide statistical surveys, it is
common to analyse their relation to labour market developments by adopting the use of proxy
indicators such as education levels and duration of unemployment spells, as well as labour demand
and wage dynamics across sectors and occupations.
Some studies18 rely on comparable cross-country macroeconomic data (such as that provided by
regular labour force surveys) in order to construct coefficients of variation among the employed
people by educational attainment, Beveridge curves, and variance of relative unemployment rates.
Relative wage levels and wage growth rates, as well as employment and unemployment rates and job
vacancy ratios in different occupations are also among the most widely used indicators of skill
shortage in an economy or a particular sector.
This approach has been most promising when used in medium- and long- term analysis of general
labour market dynamics. In the current EU context, skill mismatches should not be analysed in a
“labour cost free vacuum”, since both labour and capital are able to move relatively freely across
borders. This allows employers to adopt a variety of approaches to address the skill mismatches
problem - such as investment in contemporary capital equipment that reduces the labour input
required, outsourcing of activities (including abroad), as well as purely organizational means (such as
redistributing the workload).
In their analysis for the Employment and Social Affairs Committee (EMPL) Reymen, D. et al. (2015)
point to employers and national governments as the prime actors in addressing labour shortages, but
also underline EU’s role in supporting measures aimed at increasing intra-union mobility, labour
market transparency and the efficient use of structural funds. They make an important distinction19
between quantitative and qualitative labour shortages:
o In case of a quantitative labour shortage, there is an absolute lack of workers in the labour
market. Labour demand is larger than labour supply, resulting in a large share of difficult-to-
fill vacancies and a low unemployment rate.
o In case of a qualitative labour shortage, labour demand and labour supply are roughly in
equilibrium, but a large share of unfilled vacancies and a high unemployment rate exist
simultaneously, which implies lack of relevant skills.
In some cases, qualitative shortages can be traced back to the lack of sufficient and correct labour
market information both on the demand and the supply side (i.e. employers and employees), but may
also be a function of low labour mobility, or low job attractiveness due to a wide variety of country
specific or even international factors.
Other studies focus on the analysis of data from specialized surveys such as OECD’s Programme for
the International Assessment of Adult Competencies (PIAAC) and the European Skills and Jobs
Survey (ESJS), conducted by the European Centre for the Development of Vocational Training
(Cedefop). This approach allows for a more in-depth review of various countries and economic
18
A comprehensive review of various methodologies is provided by Johansen, J., Gatelli, D. Measuring Mismatch in ETF Partner
Countries: A Methodological Note, European Training Foundation (ETF), 2012.
19
Reymen D. et al. Labour Market Shortages in the European Union, Directorate General for Internal Policies, Policy Department A:
Economic and Scientific Policy, March 2015.
16activities and in some cases, manages to better address the heterogeneity of labour markets and the
extent to which skills are over- or underutilized.
However, the data that they rely on is still not collected regularly and in general does not allow for
mid- or long-term comparisons. Sloane (2014) points out that ideally comprehensive analysis of
education and skill mismatches and their relation to job dynamics, satisfaction, mobility and wages
“requires the use of panel data, which consist of repeated observations for the same individuals over
time”20.
2.1 Skills Mismatches and Labour Market Outcomes
Skill mismatches can affect the labour market behaviour of both employers and employees. Gambin et
al. (2016) argue21 that employers are risk averse when they are looking to recruit, which means
that they are unlikely to expand their employee base unless they are confident in the abilities of
potential employees to fulfil the tasks required. In addition, a study by Howard and Rimini (2016)
indicates22 that public perception of the appeal of VET still leaves a lot to be desired. Many employers
are yet to be convinced in the medium to long-term effects of the reliance upon contemporary VET
systems, which also relates to their insecurity when it comes to retaining the employees that they have
invested in.
Varhaest and Omey (2006) conclude that matched workers are more likely to engage in on-the-job
training than workers who consider themselves over-skilled. The latter are inclined to search for new
job opportunities23, since their skills are underutilized24, which may also result in a relative wage
penalty, as well as lower job satisfaction. Some researchers view over-qualification as a transitional
phenomenon, arguing that the probability of it occurring decreases with time as workers gain
additional labour market experience. In addition, instances of over-skilling may be attributed to
factors, which are hard to control for in practice, such as non-pecuniary advantages of the job in
question, personal interests, household characteristics, etc. In his panel data analysis25 of the
Australian labour market Sloane (2014) comes to another conclusion - there is no wage penalty for
males which are overeducated or over-skilled, but there is a penalty to those that are both. He also
argues that overeducated workers find it easier to change jobs than over-skilled workers.
Other researchers are of the opinion that increasing skill surpluses (i.e. overeducation and
overqualification) pose a significant threat to prosperity on both the national and EU-wide level.
Holmes and Mayhew (2015) argue26 that the EU has in general seen its supply of graduates increase at
a pace that outstrips the growth of high-skilled jobs. They claim that demand for graduates has not
kept up with their increasing supply, which can lead to instances of underemployment and lower
job satisfaction. This has caused a “filtering down” process that has left some workers with jobs that
20
Sloane, P. Overeducation, Skill mismatches, and Labour Market Outcomes for College Graduates. IZA World of Labour 2014: 88, p. 9
21
Gambin et al. Research to Understand the Extent, Nature and Impact of Skills Mismatches in the Economy. BIS Research Paper №265,
Department for Business, Innovation and Skills, January 2016.
22
Howard, C. Rimini, C. Skills Mismatch 3: Apprenticeship Supply in the European Union, Youth Engagement and theLabour Market,
Think Young, 2016.
23
See also Sicherman, N. “Overeducation” in the Labour Market, Journal of Labour Economics, Vol. 9, pp.101-122, 1991
24
It is possible that due to the so-called “job-up-skilling process”, some over-skilled workers eventually find themselves matched to their
occupation, provided they stay long enough in the job.
25
Sloane uses data from the Household, Income, and Labour Dynamics in Australia (HILDA) survey, which allows for such comparisons
over time.
26
See Holmes, C. Mayhew, K. Over-qualification and Skills Mismatch in the Graduate Labour Market. CIPD Policy Report, August 2015.,
p. 30
17do not require higher education and thus – do not fully utilize their abilities27. On the other hand,
Quintini, G. (2011) concludes that over-qualification may “hide skill heterogeneity – a skill deficit of
over-qualified workers relative to well-matched workers with the same qualifications – rather than a
systematic underutilization of skills"28. In some cases the reasons behind this process may be traced
back to the increasing accessibility of higher education. Such a country is Bulgaria, where traditional
but also government-inspired stress29 on the importance of higher education in pursuit of Europe 2020
targets and the struggle for state subsidies on behalf of universities has lead to an “inflationary” effect
on diplomas with universities continuously lowering both entrance and graduation standards with the
aim of securing state funding30.
2.2 Skills Mismatches, Education and Productivity
The direct effects of mismatches on productivity are yet to be thoroughly explored by economists, but
there is increasing evidence that suggests that skills mismatches can explain some of the existing
cross-country productivity gaps and that they are also reflective of differences in the policy
environment, including education and labour market related regulations and programs. Labour
mobility and adaptability are also determined by the quality and reliance upon contemporary VET
systems and lifelong learning practices.
2.2.1. Relevant literature
Adalet and Andrews (2015) analyze31 the link between skill and qualification mismatches and labour
productivity across 19 OECD countries, concluding that mismatches can adversely affect labour
productivity via the allocation of employment across firms of varying productivity levels. From the
perspective of any given company, employment of over-skilled workers may prove beneficial,
provided their excess productivity is not offset by any adverse effects (such as low job satisfaction). In
the short term this resource misallocation may lead to a crowding out effect of high-productivity
companies with more growth potential by less productive ones, especially in the case of labour
markets with low regional, sectoral and occupational mobility, as well as inflexible wage setting.
Thus, aggregate productivity is being suppressed due to the difficulties that more productive
enterprises face in attracting suitable labour since human talent is occupied by inefficient
companies/activities.
According to Adalet and Andrews32the level of skill use (constructed from PIAAC data) can
explain some of the cross-country variation in aggregate labour productivity even amongst
developed countries. Simply put, they view over-qualification and over-skilling as positively related
27
The opposite process is often referred to as “job-upgrading”, meaning that the actual skill requirements of some economic activities and
occupations have been increasing as a result of changes in economic and labour market relations.
28
Quintini, G. Over-Qualified or Under-Skilled: A Review of Existing Literature, OECD Social, Employment and Migration Working
Papers, No. 121, OECD Publishing, Paris, 2011, p. 21
29
Nikolov, A. Financing Higher Education: Perspectives for Bulgaria in Light of International Experience. Institute for Market Economics
(IME), April 2013.
30
The bulk of state subsidies to universities in Bulgaria depend on the number of students.
31
Adalet McGowan, M., D. Andrews. Labour Market Mismatch and Labour Productivity: Evidence from PIAAC Data, OECD Economics
Department Working Papers, No. 1209, OECD Publishing, Paris, 2015.
32
Adalet and Andrews (2015), p. 32
18with within-firm productivity, but as negatively related to the efficiency of allocation and thus –
aggregate productivity33.
In their theoretical model (Figure 5) an increased stock of skills and its effective allocation leads to
more innovation and faster adoption of best practices, which in turn raises aggregate productivity.
Education, VET and lifelong learning policies all contribute to this process and should be
supported by effective active labour market policies (ALMPs) and labour intermediation.
Figure 5: Skills, Productivity Growth and Public Policy
AGGREGATE PRODUCTIVITY
GROWTH
Innovation and adoption
Effective supply of skills
Increased stock of Better allocation of
skills existing stock of skills
Lifelong learning, ALMPs, better
Education policies Framework policies
information
Source: Adalet and Andrews (2015)
Naturally, skill requirements will continue to change rapidly in the presence of technological
advancements and increasing international competition. Employee proficiency in foundational skills
such as literacy, numeracy, problem solving and (increasingly) digital literacy are no longer
“supportive”, but rather indicative of any firm’s capacity to adopt new practices and
technologies.
These studies, among many others, underline the importance of well-informed policy responses and
efficient labour market regulation in the face of increasing labour shortages. Stringent labour market
regulations, as well as structural factors such as low regional and cross-country labour mobility
(including, but not limited to EU Member States), may also hamper wage adjustments across
industries. Skills mismatches are not only deterrents to productivity and innovation, but also
affect the social well-being of individuals, by extending potential unemployment and inactivity spells
and suppressing employment opportunities – all at the cost of aggregate productivity losses.
2.2.2. Estimated Quantitative Effects of Existing Mismatches on Productivity
Since the ESJS dataset does not contain a direct measure of productivity, our quantitative assessment
of the effect of skills mismatches on the EU economy uses the wages reported by respondents as a
proxy indicator. The assumption we make is that the variation in the wages of workers with different
33
We would argue this may be even more significant in economic activities where wage differences between companies are not large
enough to encourage a quicker cross-company turnover of workers (i.e. sectors where labour costs are determined via collective bargaining).
19skill levels is an appropriate proxy for the difference in their productivity – i.e. that employers reward
higher productivity with higher salary, without taking into account any other considerations.
Our country aggregation estimate puts the lost productivity at 2.14%. This means that under our
assumptions, the actual productivity in the EU is 2.14% lower than the one that would have been
achieved if all the workers had the productivity of the workers who perceive themselves to be
perfectly matched for their jobs.
The OECD puts the average productivity in the EU expressed as GDP per hour worked in 2014 at
36.16 euro per hour, which in turn means that if there were no skills mismatches, the productivity
would have instead reached 36.93 euro per hour, using the country aggregation. Thus, based on this
approach we can, with a decent degree of certainty, claim that the loss of productivity due to skills
mismatches in the EU is around 0.8 euro for every hour worked.
Figure 6: Skills Mismatch and Productivity: Methodological Approach
In order to avoid equating mismatches in different skills, we used ESJS data regarding EU workers’ self-
evaluation of overall skills (on a scale from 1 to 3).
On the basis of this self-evaluation, the arithmetic mean salary of the respondents was calculated for the three
separate skill levels across EU countries. The non-euro mean salaries were recalculated in euro, on the basis of
the average annual exchange rate for the year of conducting of the interviews.
Assuming that the middle skill level approximates matched skills, the lower one – underskilled and the higher
one – overskilled workers, a new mean wage per country was calculated on the basis of the mean earnings of
matched workers and the difference in the number of matched workers and the number of mismatched workers.
Finally, the estimated effect of mismatches of productivity was calculated as the difference between the actual
mean salary per country and the salary which could have been achieved in a hypothetical situation where all
the workers have perfectly matched skills. This estimation, expressed as an equation takes the following form:
where x is the actual salary of the workers in the ESJS dataset, z is the salary of those workers in a scenario
with full skills match, and y is the number of workers in the particular countries and economic activities.
The EU-level aggregation was done by weighing the country-level losses by the number of respondents
included in the dataset, under the assumption that they are representative for EU member-states. Consequently,
as the estimate is based on the complete ESJS dataset, it has the same statistical power as the rest of the
statistics derived from it. For the EU-wide conclusions this would mean a margin of error of 0.5% on the 99%
confidence level – sufficiently precise for the needs of this study.
202.3 The Role of VET
There is broad academic and political consensus
Figure 7: Conceptions of Vocational Education
about the growing importance of VET and its
Cedefop outlines four main conceptions of vocational
role in limiting skills mismatches. This is
education. While most of them co-exist in EU Member
especially relevant in regard to economic States, there is usually a dominant model in each country.
activities and occupations in which skill
VET as work-based or dual initial training
obsolescence is a growing concern. The Mainly found in: Germany, Denmark and Austria
development of tools for understanding and Some elements in: Slovakia and Hungary
anticipating future skill needs is an important This model is centred on the concept of “learning by
prerequisite for the effective structuring of both doing” (apprenticeship system) as a first step into a
possible career towards the degree of “Meister” which
educational and active labour market policies.
then qualifies to be trainer/teacher and opens the
According to Cedefop, about 90% of secondary perspective for entrepreneurship (“Meisterbetrieb”). This
system relies upon an active participation on behalf of
school graduates are satisfied with their general
businesses (through both financial and organizational
skills, but in terms of practical skills the share of means) and close coordination between the social
satisfied vocational education graduates (87%) partners. Companies are the de-facto learning sites and the
is much higher than their counterparts in general main reference persons are in-company trainers, rather
education – 62%. This is why vocational than teachers.
education plays a key role in matching the VET as initial vocational education
Mainly found in: Bulgaria, Spain, Malta, Romania
supply of worker skills and labour market Some elements in: most CEE countries
demand.
Education takes place primarily in government-run and
Cedefop’s opinion survey 34
on vocational state-financed schools (participants are students). It
includes the development of practical skills, but this
education and training in Europe shows that
usually happens under the supervision of teachers and in
vocational education participants face a shorter the schools themselves. The focal point of this model is
time lapse between finishing their studies and individual progression, rather than ensuring the supply of
finding a job – 60% of them have managed to qualified workforce.
do it before, or less than a month after VET as further training
completing their education, compared to 49% Mainly found in: UK and Ireland
Some elements in: Cyprus
for general education participants.
VET is mainly understood as on-the-job training for all
It is no coincidence that countries such as age groups and its main goal is to increase labour market
Germany and Austria, in which the share of participation by increasing the employability of the
workforce.
vocational education graduates is higher than
the EU average, also post some of the lowest VET as (part of) lifelong learning
Mainly found in: Finland, France
youth unemployment numbers. Weiner (2015) Some elements in: Greece, Croatia, Italy and Luxembourg
points out35 that even during the crisis, countries VET includes a diverse set of learning approaches,
that have work-based or dual vocational learning providers and sites for different age groups that
education register relatively lower youth lead to different occupation specific and broader
unemployment levels. This is due to the vocational outcomes.
system’s improved chances of early market Source: Cedefop (2017). The Changing Nature and Role of
Vocational Education and Training in Europe. Volume 2: Results
attachment (including differentiated minimum of a Survey among European VET Experts. Luxembourg:
Publications Office. Cedefop research paper; No 64.
34
Cedefop. Cedefop Opinion Survey on Vocational Education and Training in Europe, 2017
35
Eichhorst, W. Does vocational training help young people find a (good) job, IZA (Institute for the Study of Labor), 2015, p. 3.
21wages for apprentices in countries such as Germany), concluding that “... wages are higher following
an apprenticeship, with better job placement rates and lower job destruction rates after some years of
experience.” After studying36 the work-to-school transition of Hungarian graduates, Horn (2013)
estimates that vocational education that includes on-the-job training and is not limited to the school
system itself provides students with 10-15% better chance of being employed right after graduation,
as well as higher likelihood of receiving long-term work contracts.
Vocational education provides participants with some of the tools necessary to minimize the risk of
prolonged labour market inactivity that can have lasting scarring effect on a person’s long-term career
prospects. The latter is of particular importance, as inactivity itself can be a potential source of skills
mismatches because of the inability of the long-term unemployed to “keep up” with changing skill
requirements.
Figure 8: Labour Market Outcomes – Time Lapse before Finding a Job (%)
0 5 10 15 20 25 30 35
30
Before the end of studies
23
30
Less than a month
26
24
One month to less than a year
32
9
One year or more
13
7
No long-term job/n.a/Don't know
6
Vocational education participants General education participants
Source: Cedefop
Despite its proven effectiveness in providing employment opportunities, vocational education remains
less popular37 than its alternatives. The dedicated EU-wide Cedefop opinion survey has shown that
23% out of a total 35,646 respondents claim that vocational education for people aged 16-18 has a
negative image in their country. The advantages38 that vocational education graduates enjoy when it
comes to labour market prospects have been well documented39, but there are concerns that the image
of VET suffers from a perceived “narrowness” in comparison with general education. Some
vocational education programs provide little pathways for follow-up education, thus implying a hard-
to-reverse choice of skill specialization relatively early in students’ life.
36
Horn, D. School-based vocational or workplace-based apprenticeship training? Evidence on the school-to-work transition of Hungarian
graduates, European University Institute, 2013.
37
The share of EU citizens that believe it is possible to obtain skills outside formal education (62%), through on-the job training (54%), or
even via self-education (47%) is relatively higher than those who would choose “courses other than schools, VET or university” (45%), or
online courses (27%). See: European Commission. Special Eurobarometer 417: European Area of Skills and Qualifications, 2014, pp 15-
16.
38
Evidence of higher wages, labour mobility and productivity are provided in Cedefop’s European Centre for the Development of
Vocational Training see: Cedefop. The Benefits of Vocational Education and Training, Luxembourg: Publications Office. Research Paper
No 10, 2011.
39
See: Hoeckel, K. Costs and Benefits in Vocational Education and Training, OECD, 2008
22You can also read