The importance of size ranges in aerosol instrument intercomparisons: a case study for the Atmospheric Tomography Mission - Recent
←
→
Page content transcription
If your browser does not render page correctly, please read the page content below
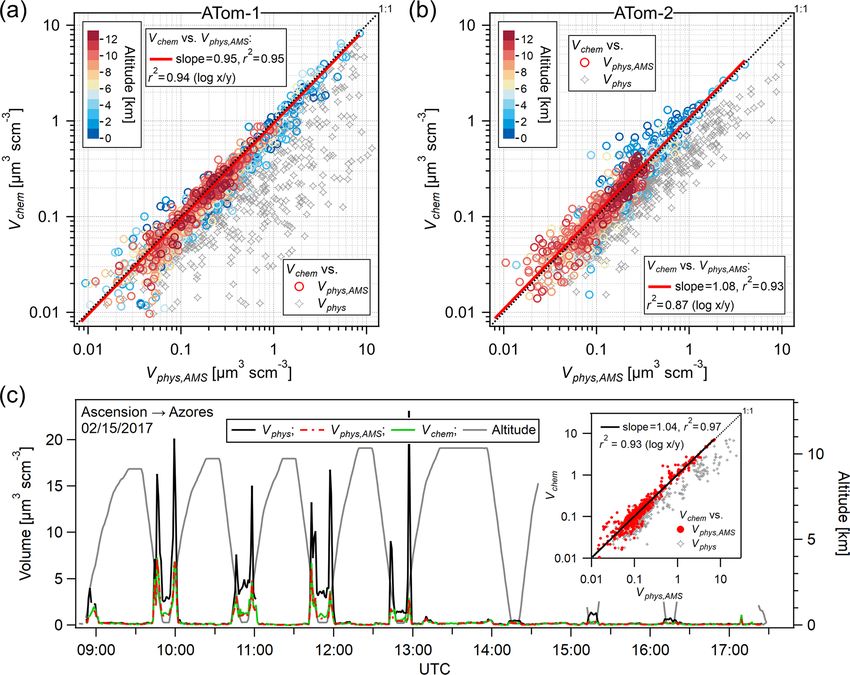
Atmos. Meas. Tech., 14, 3631–3655, 2021
https://doi.org/10.5194/amt-14-3631-2021
© Author(s) 2021. This work is distributed under
the Creative Commons Attribution 4.0 License.

The importance of size ranges in aerosol instrument
intercomparisons: a case study for the Atmospheric
Tomography Mission
Hongyu Guo1,2 , Pedro Campuzano-Jost1,2 , Benjamin A. Nault1,2,a , Douglas A. Day1,2 , Jason C. Schroder1,2,b ,
Dongwook Kim1,2 , Jack E. Dibb3 , Maximilian Dollner4 , Bernadett Weinzierl4 , and Jose L. Jimenez1,2
1 Department  of Chemistry, University of Colorado Boulder, Boulder, CO, 80309, USA
2 Cooperative  Institute for Research in Environmental Sciences, University of Colorado Boulder, Boulder, CO, 80309, USA
3 Earth Systems Research Center, Institute for the Study of Earth, Oceans, and Space, University of New Hampshire,

Durham, NH, 03824, USA
4 University of Vienna, Faculty of Physics, Aerosol Physics and Environmental Physics, Vienna, 1090, Austria
a now at: Aerodyne Research Incorporated, Billerica, MA, 01821, USA
b now at: Air Pollution Control Division, Colorado Department of Public Health and Environment, Denver, CO, 80246, USA

Correspondence: Jose L. Jimenez (jose.jimenez@colorado.edu)

Received: 10 June 2020 – Discussion started: 15 June 2020
Revised: 10 March 2021 – Accepted: 24 March 2021 – Published: 20 May 2021

Abstract. Aerosol intercomparisons are inherently complex          rate comparisons across instruments with inevitably differ-
as they convolve instrument-dependent detection efficiencies       ent size cuts. Observed differences between campaigns em-
vs. size (which often change with pressure, temperature, or        phasize the importance of characterizing AMS transmission
humidity) and variations in the sampled aerosol population,        for each instrument and field study for meaningful interpreta-
in addition to differences in chemical detection principles        tion of instrument comparisons. Good agreement (regression
(e.g., inorganic-only nitrate vs. inorganic plus organic nitrate   slope = 0.949 and 1.083 for ATom-1 and ATom-2, respec-
for two instruments). The NASA Atmospheric Tomography              tively; SD = 0.003) was found between the composition-
Mission (ATom) spanned four separate aircraft deployments          based volume (including AMS-quantified sea salt) and that
which sampled the remote marine troposphere from 86◦ S to          derived from AMP after applying the AMS inlet transmis-
82◦ N over different seasons with a wide range of aerosol          sion. The AMS captured, on average, 95 ± 15 % of the stan-
concentrations and compositions. Aerosols were quantified          dard PM1 volume (referred to as the URG Corp. standard cut
with a set of carefully characterized and calibrated instru-       1 µm cyclone operated at its nominal efficiency). These re-
ments, some based on particle sizing and some on compo-            sults support the absence of significant unknown biases and
sition measurements. This study aims to provide a critical         the appropriateness of the accuracy estimates for AMS to-
evaluation of inlet transmissions impacting aerosol intercom-      tal mass and volume for the mostly aged air masses encoun-
parisons, and of aerosol quantification during ATom, with a        tered in ATom. The particle size ranges (and their altitude
focus on the aerosol mass spectrometer (AMS). The volume           dependence) that are sampled by the AMS and complemen-
determined from physical sizing instruments (aerosol micro-        tary composition instruments (such as soluble acidic gases
physical properties, AMP, 2.7 nm to 4.8 µm optical diame-          and aerosol, SAGA, and particle analysis by laser mass spec-
ter) is compared in detail with that derived from the chem-        trometry, PALMS) are investigated to inform their use in fu-
ical measurements of the AMS and the single particle soot          ture studies.
photometer (SP2). Special attention was paid to characterize
the upper end of the AMS size-dependent transmission with
in-field calibrations, which we show to be critical for accu-

Published by Copernicus Publications on behalf of the European Geosciences Union.
3632                                                H. Guo et al.: The importance of size ranges in aerosol intercomparisons

1   Introduction                                                    Volume comparison probes the ability of the AMS to quan-
                                                                    tify total aerosol mass and predict aerosol density (based on
Aerosols are ubiquitous in the atmosphere and have a life-          fractional composition) accurately, and hence it is the most
time of about a week, and thus they can travel long distances       direct method to evaluate the AMS overall quantification (un-
(Tsigaridis et al., 2014), and have important effects on cli-       like, e.g., comparing total mass to extinction that depends on
mate forcing through both direct (Pilinis et al., 1995; Hay-        mass extinction efficiency). We examine in detail the accu-
wood and Boucher, 2000) and indirect effects (Lohmann and           rate quantification and application of the AMS transmission
Feichter, 2005; IPCC, 2013). Remote regions account for             efficiency (EL ) to the particle volume intercomparisons in
much of the Earth’s surface and are infrequently sampled,           this study. This study also serves as the basis for a future
and thus they have especially uncertain aerosol distributions       study on individual chemical species intercomparisons.
and radiative impacts (IPCC, 2013; Hodzic et al., 2020). The
NASA Atmospheric Tomography Mission (ATom) sampled
the remote marine troposphere from 86◦ S to 82◦ N over four         2     Methods
different seasons with a comprehensive suite of high-quality
                                                                    2.1    ATom overview
and carefully calibrated and operated physical and chemical
aerosol instruments. It provides a unique dataset to improve        Over 2 years, the DC-8 aircraft was deployed once a sea-
our understanding of the remote atmospheric aerosols and            son: July–August 2016 (ATom-1), January–February 2017
thus refine global model predictions. A prerequisite for that       (ATom-2), September–October 2017 (ATom-3), and April–
purpose is to evaluate the accuracy and consistency of the          May 2018 (ATom-4). During these flights, the DC-8 repeat-
ATom aerosol instruments.                                           edly ascended and descended between ∼ 0.18 and ∼ 13 km
   The ATom physical sizing instruments have been re-               altitudes at regular intervals, typically every hour (with a sin-
cently described and evaluated in Williamson et al. (2018),         gle vertical profile lasting ∼ 25 min), leading to the execution
Kupc et al. (2018), Brock et al. (2019a), and Spanu et              of ∼ 140 vertical profiles of the troposphere per deployment
al. (2020), while the particle analysis by laser mass spectrom-     (the vertical profile of sampling time is shown in the Supple-
eter (PALMS) chemical instrument during ATom has been               ment in Fig. S1). The unique spatiotemporal coverage and
described in Froyd et al. (2019). In this paper, we focus on the    high-quality measurements of this campaign ensure that its
Aerodyne aerosol mass spectrometer (AMS). AMS (Cana-                data will be used very widely, such as to evaluate and con-
garatna et al., 2007) and aerosol chemical speciation monitor       strain global modeling. Therefore it is of high interest to doc-
(ACSM; smaller, lower cost, and simpler to operate versions)        ument the consistency of the multiple aerosol measurements.
(Ng et al., 2011) have been deployed extensively worldwide          This analysis is also useful to re-evaluate the quantification
for ground aerosol monitoring (Jimenez et al., 2009; Crenn et       uncertainties of the AMS for a wide range of particle concen-
al., 2015; Hu et al., 2015; Kiendler-Scharr et al., 2016; Zhang     trations and composition (e.g., Fig. S2). Due to the similar-
et al., 2018; ACTRIS, 2021). AMS has been deployed in               ities in the geographic coverage of ATom studies, we focus
most advanced atmospheric chemistry aircraft experiments            on the intercomparisons for the first two ATom campaigns in
worldwide (Dunlea et al., 2009; Middlebrook et al., 2012;           the following analysis.
Barth et al., 2015; Schroder et al., 2018; Garofalo et al., 2019;
Hodzic et al., 2020; Mei et al., 2020; Morgan et al., 2020).        2.2    Definitions of particle diameters
The overall AMS concentration uncertainty (2σ ) is normally
reported as ±38 % for organic aerosol (OA) and ±34 % for            Conversions between different particle diameter definitions
inorganics, while the precision is typically much better, ex-       are required for meaningful instrument comparisons. For ex-
cept at concentrations near the detection limit (Bahreini et        ample, particle size spectrometers report estimated geometric
al., 2009; Jimenez et al., 2016). A detailed evaluation of those    diameter (dp ), which is derived from multiple condensation
uncertainties requires both very careful AMS characteriza-          particle counters using an inversion method, or from light
tion and calibration, as well as high-quality collocated mea-       scattering signals by using an assumed constant refractive
surements, as was the case in ATom. Concerns about AMS              index for aerosols. AMS transmission operates in vacuum
quantification raised by Murphy (2016a) motivate rigorous           aerodynamic diameter (dva ) since its aerodynamic lens and
evaluation of this topic despite some questions being solved        supersonic expansion operate in the free molecular regime
in the following discussions (Jimenez et al., 2016; Murphy,         (DeCarlo et al., 2004). Impactors (Marple et al., 1991, 2014)
2016b).                                                             and cyclones (typically sourced from URG Corp., Chapel
   This work uses the extensive ATom field dataset for re-          Hill, NC, USA) are often installed upstream of aerosol instru-
mote aerosols to evaluate (1) the consistency of the different      ments to preselect desired aerosol ranges for ground or air-
submicron aerosol volume measurements, (2) the quantifica-          craft measurements. The cutoff sizes of both devices follow
tion ability of the AMS for remote aerosols, and (3) the size       the transition-regime aerodynamic diameter (dta ; as the size
ranges contributing chemical composition information to dif-        range of interest to this study is in the transition regime, re-
ferent instruments for ATom and their variation with altitude.      quiring a “slip correction”). A detailed discussion of particle

Atmos. Meas. Tech., 14, 3631–3655, 2021                                              https://doi.org/10.5194/amt-14-3631-2021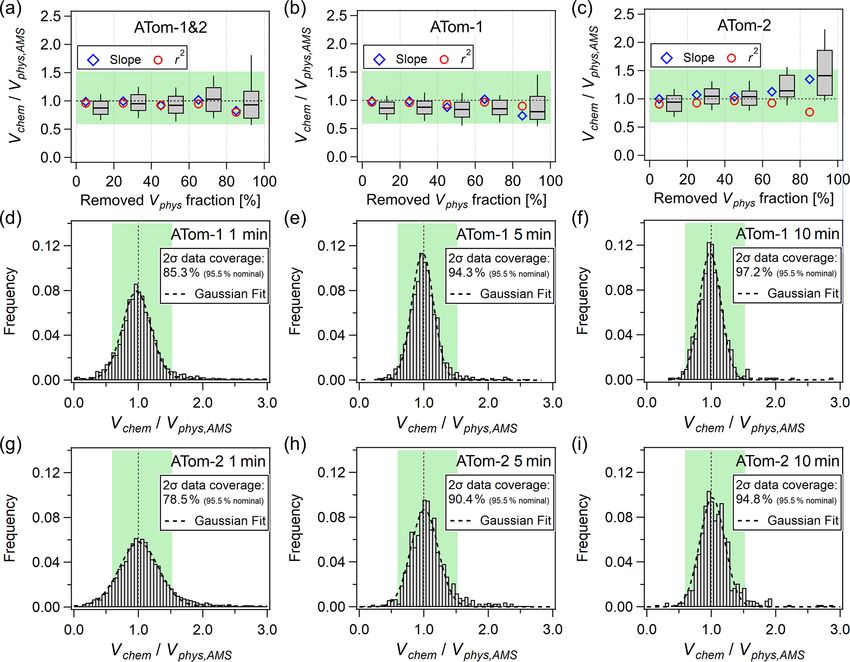
H. Guo et al.: The importance of size ranges in aerosol intercomparisons                                                     3633

diameter definitions can be found in DeCarlo et al. (2004).        of species s (to nitrate), IENO3 is the ionization efficiency of
The dva value is related to the volume-equivalent diameter         nitrate, Q is the volume flow rate into the AMS, NA is Avo-
(dve , the diameter that would result if the particle was melted   gadro’s number, Is,i is the ion signal from ion i produced
to form a sphere of the same density as the particle and with-     from species s, and the 1012 factor accounts for unit conver-
out any internal voids) as                                         sions.
                                                                      CE is typically defined as the efficiency with which parti-
        ρp dve                                                     cles entering the AMS inlet are detected. It has been formally
dva =          ,                                            (1)
        ρ0 χv                                                      defined as a product of aerodynamic lens transmission effi-
                                                                   ciency for spherical particles (EL ), transmission efficiency
where ρp is the particle density, ρ0 is the standard den-
                                                                   correction for non-spherical particles (Es ) due to additional
sity (1 g cm−3 ), and χv is the vacuum (i.e., free-molecular
                                                                   particle beam broadening, and detection efficiency at the va-
regime) dynamic shape factor (= 1 for spheres and > 1 for
                                                                   porizer (Eb ), which can be reduced due to particle bounce. It
non-spherical particles). Since the aerosols sampled during
                                                                   is thus expressed as
ATom were remote and aged, we assume χv ∼ 1 and dve ∼
dp . The transition-regime aerodynamic diameter can be cal-        CE = EL × Es × Eb                                           (4)
culated as
                                                                   (Huffman et al., 2005; Canagaratna et al., 2007; Middlebrook
          s
             1 ρp Cc (dve )                                        et al., 2012). Previous studies have shown that Es ∼ 1 for am-
dta = dve                   ,                            (2)       bient particles (Huffman et al., 2005; Salcedo et al., 2007),
            χt ρ0 Cc (dta )
                                                                   and thus CE is determined by EL and Eb . When the mass
where χt is the transition-regime dynamic shape factor, and        size distribution being sampled is mostly within the region
Cc is the Cunningham slip correction factor. In this study, χt     where EL ∼ 1, then CE ∼ Eb . Most papers in the literature
is assumed to be 1, and Cc is calculated based on air pres-        make that implicit approximation, although it is not clear
sure. Although a given particle always has the same dry dp         that the approximation is always justified since EL changes
and dva , the dry dta changes with pressure. To distinguish the    in time and between instruments and is infrequently quanti-
dta calculated at different altitudes, we use dta,sea to denote    fied as it is experimentally challenging to do so. Eb depends
that calculated at sea level (P = 1013 mbar) and dta,air for       on particle viscosity and thus phase (Matthew et al., 2008;
sampling aloft with an aircraft (or at an elevated ground site).   Middlebrook et al., 2012; Pajunoja et al., 2016). With the
In addition, all diameters change under humid/dry conditions       “standard vaporizer” used in this study (Hu et al., 2020), am-
due to water uptake or evaporation (DeCarlo et al., 2004).         bient aerosols in continental regions typically have Eb ∼ 0.5,
                                                                   but a range between 0.5 to 1 can be observed (Middlebrook
2.3    AMS description and quantification                          et al., 2012; Hu et al., 2017, 2020). Eb increases for certain
                                                                   compositions, which leads to less viscous particles, such as
The highly customized University of Colorado (CU) high-            high ammonium nitrate mass fraction or high acidity condi-
resolution time-of-flight aerosol mass spectrometer (HR-           tions, which can be estimated with a parameterization based
ToF-AMS, hereafter referred to as AMS; Aerodyne Research           on aerosol composition (Middlebrook et al., 2012; Hu et
Inc., Billerica, MA) (DeCarlo et al., 2006) measured non-          al., 2017, 2020; Nault et al., 2018). Such parametrizations
refractory, bulk submicron particle compositions at 1 Hz res-      assume internally mixed aerosols, which is typically the case
olution. The AMS uses an aerodynamic lens to sample par-           for submicron ambient aerosol away from sources due to
ticles into a high vacuum, where they impact and vaporize          condensation and coagulation (Petters et al., 2006; Wang et
on a hot porous tungsten vaporizer (600 ◦ C). The evaporated       al., 2010; Mei et al., 2013).
constituents undergo electron ionization (EI), with the result-       The main submicron inorganic ambient aerosol species are
ing ions being detected by a mass spectrometer (Jayne et           ammonium (NH4 ), sulfate (SO4 ), nitrate (pNO3 ), chloride
al., 2000; Jimenez et al., 2003; Drewnick et al., 2005; De-        (Cl), and, in marine areas, sea salt. The charges are omit-
Carlo et al., 2006; Canagaratna et al., 2007). The mass con-       ted for the AMS-measured nominally inorganic species as
centration of a species, s, within a multi-component aerosol       the AMS may also detect some SO4 or NO3 signals from
particle can be calculated from the measured ion signal with       organosulfates or organonitrates (Farmer et al., 2010). To
the following equation (Alfarra et al., 2004; Canagaratna et       avoid the confusion between the NO3 radical and particle
al., 2007; Jimenez et al., 2016):                                  NO3 , pNO3 is used to denote total particle NO3 explicitly
                                                                   (Nault et al., 2018). RIEs for the inorganic species can be
        1012   MWNO3       X                                       calibrated regularly (including in the field). However, simi-
Cs =                             Is,i ,                     (3)
        CEs RIEs IENO3 QNA all,i                                   lar explicit calibrations cannot be readily performed for the
                                                                   thousands of individual organic aerosol (OA) molecules in
where Cs is the mass concentration of species s, MWNO3 is          ambient particles. Thus, laboratory-based calibrations with
the molecular weight of nitrate, CEs is the collection effi-       a limited set of OA species have been used to estimate
ciency of species s, RIEs is the relative ionization efficiency    RIEOA (Slowik et al., 2004; Dzepina et al., 2007; Jimenez

https://doi.org/10.5194/amt-14-3631-2021                                             Atmos. Meas. Tech., 14, 3631–3655, 2021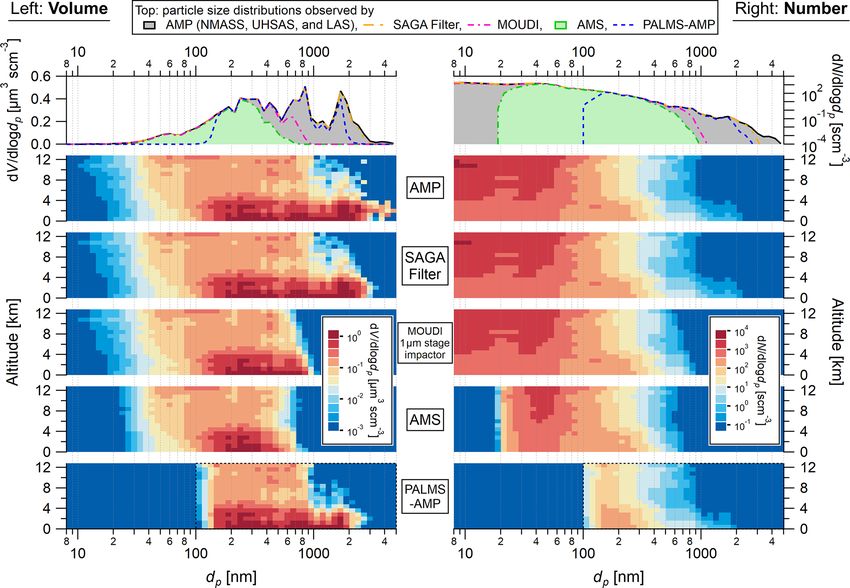
3634                                              H. Guo et al.: The importance of size ranges in aerosol intercomparisons

et al., 2016; Robinson et al., 2017; Xu et al., 2018), and this   trometer through an aerodynamic focusing lens operated
approach has been verified using laboratory and field inter-      at 2.00 mbar (1.50 Torr). Due to the much lower ambient
comparisons with other instruments (Takegawa et al., 2005;        air pressure at high altitudes, the PCI pressure cannot be
Dzepina et al., 2007; DeCarlo et al., 2008; Bahreini et           maintained at 250 mbar above ∼ 9 km, resulting in a drop
al., 2009; Dunlea et al., 2009; Timonen et al., 2010; Docherty    in lens pressure (down to 1.00 Torr) and flow (down to
et al., 2011; Middlebrook et al., 2012; Crenn et al., 2015).      55 scm3 min−1 ) at the max altitude (12.5 km). Residence
Bahreini et al. (2009) estimated the uncertainty in RIENH4        times from the tip of the HIMIL to the aerosol vaporizer var-
(which is always calibrated in the field) to be ∼ 10 % vs.        ied from ∼ 0.5 s in the boundary layer to ∼ 0.9 s at 12 km
15 % for the other inorganics (sulfate, chloride; since most      during ATom (Fig. S3; note that a detailed characterization
AMS users do not perform in-field calibrations for those or       of HIMIL and PCI performance is included in the Supple-
do so less frequently). Compared to the inorganics, the un-       ment in Sect. S4 with Figs. S3–S10). The relative humidity
certainty in RIEOA was estimated to be higher at 20 % to ac-      (RH) in the line was not actively controlled but was very low,
count for the diversity of species (Bahreini et al., 2009). An    on average 10 ± 21 % in ATom-1 and ATom-2 with a me-
average RIEOA ∼ 1.4 was determined from laboratory cali-          dian of 0.4 %, due to the thermal gradients between the plane
brations. However, there are conflicting reports for RIEOA of     cabin and ambient conditions (Track − Tambient = 27 ± 13 K)
chemically reduced species such as hydrocarbons, with some        (8 % of the data was > 40 % RH, including 3 % > 80 % RH,
values around 1.4 and others higher (Slowik et al., 2004;         which could increase CE). Composition-dependent CE was
Dzepina et al., 2007; Docherty et al., 2011; Jimenez et           estimated based on the Middlebrook et al. (2012) parameter-
al., 2016; Reyes-Villegas et al., 2018; Xu et al., 2018). How-    ization and was on average 0.87 ± 0.15 and 0.90 ± 0.13 for
ever, such species were insignificant during ATom. For more       ATom-1 and ATom-2, respectively, mainly due to high acid-
oxidized species relevant for most biomass burning OA and         ity (Fig. S11). After every research flight, IENO3 was cali-
secondary organic aerosol (SOA), average laboratory RIEOA         brated by atomizing pure NH4 NO3 solutions and selecting
overlaps within uncertainties of 1.4 (Jimenez et al., 2016; Xu    dry (desiccated with a Nafion dryer) 400 nm (mobility diam-
et al., 2018). Reviews on this topic (Jimenez et al., 2016;       eter, dm ; equivalent to dva = 550 nm) (DeCarlo et al., 2004)
Murphy, 2016a, b) have emphasized the need for the addi-          particles with a differential mobility analyzer (DMA; TSI
tional investigation of AMS quantification in the field.          model 3081, St. Paul, MN, USA) into the AMS. RIEs for
                                                                  sulfate, ammonium, and chloride were determined by multi-
2.4    AMS operation during ATom                                  ple in-field calibrations.
                                                                     A summary plot of the in-field calibrations of these pa-
The aircraft operation of the CU AMS has been discussed           rameters is shown in Fig. S12. Assuming a constant instru-
previously (DeCarlo et al., 2006, 2008, 2010; Dunlea et           ment response over the course of each deployment, the vari-
al., 2009; Cubison et al., 2011; Kimmel et al., 2011; Schroder    ability in the calibrations can be taken as an estimate of the
et al., 2018). The specific operational procedures used dur-      random component of RIE uncertainty. Uncertainties (2σ )
ing ATom have been discussed in Nault et al. (2018) and           for RIENH4 , RIESO4 , and RIECl are hence 4 % (6 %), 4 %
Hodzic et al. (2020). Important operation details of AMS          (2 %), and 5 % (8 %), respectively, for ATom-1 (ATom-2), all
that are relevant to this study are described below. Per air-     smaller than the reported values from Bahreini et al. (2009).
craft conventions, mass concentrations are reported in mi-        The 2σ variability in IENO3 (normalized as its ratio to the
crograms per cubic meter air volume at standard conditions        air beam signal, IENO3 /AB) is 6 % for ATom-1 and 15 %
of T = 273.15 K and P = 1013 mbar (µg sm−3 ), hereafter re-       for ATom-2. The propagated AMS uncertainties using these
ferred to as STP. Note that many definitions of STP are in use,   values, 31 % for inorganics and 37 % for organics, are simi-
especially in other fields).                                      lar to those from Bahreini et al. (2009) due to the dominant
   Ambient aerosols were sampled through a National Center        uncertainty contribution from CE (30 %). For the AMS re-
for Atmospheric Research (NCAR) high-performance instru-          ported mass concentration, uncertainties (i.e., accuracies) in
mented airborne platform for environmental research (HIA-         CE, RIEs, and IENO3 dominate the total reported uncertain-
PER) modular inlet (HIMIL) (Stith et al., 2009) mounted on        ties in most situations, although precision (statistical) error
a 400 raised platform on the window plate to ensure that sam-     becomes important at low concentrations and short averag-
pling occurred consistently outside the DC-8 boundary layer       ing times.
(Vay et al., 2003). Aerosols were introduced at a constant           IENO3 calibrations, performed in event trigger mode with
standard flow rate of 9 sL min−1 (up to ∼ 9 km, 15 L min−1        400 nm ammonium nitrate aerosols (Nault, 2016; Schroder
above that; “s” refers to standard conditions, and no “s” in-     et al., 2018), also provided multiple AMS transmission mea-
dicates a volumetric flow at in situ T and P ), with 1 L min−1    surements throughout the campaign by a direct comparison
being continuously subsampled into a pressure controlled          of the single-particle AMS counts with a condensation parti-
inlet (PCI) operated at 250 mbar (187 Torr) (Bahreini et          cle counter (CPC) (Nault et al., 2018). Besides these single-
al., 2008). A fraction of that flow, 86 scm3 min−1 , was then     size (at the edge of the EL ∼ 1 range) post-flight calibrations,
sampled into the high vacuum region of the mass spec-             the upper end of the AMS transmission curve was charac-

Atmos. Meas. Tech., 14, 3631–3655, 2021                                            https://doi.org/10.5194/amt-14-3631-2021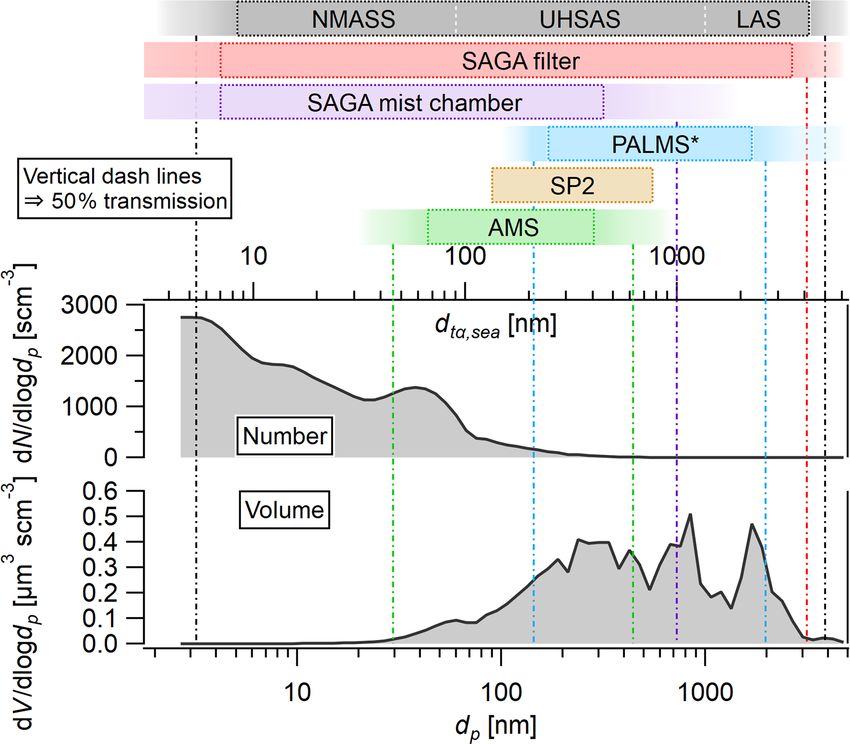
H. Guo et al.: The importance of size ranges in aerosol intercomparisons                                                    3635

terized on the aircraft during ATom-2 by measuring multi-           size distributions. The interpolated average of two consec-
ple sizes of monodisperse ammonium nitrate (dm range 350–           utive background signals (beam closed) was subtracted from
850 nm) by comparing the mass measured by AMS to that               1 s ambient signals (beam open). Also, fast blanks (20 s) were
by CPC (i.e., CPC counts × single particle volume). Multi-          scheduled every 18 min by directing ambient air through a
ply charged ammonium nitrate aerosols were removed by the           high-efficiency particulate air (HEPA) filter serving to char-
impactor upstream of the DMA, and the removal was con-              acterize the AMS zero (field background) and as a leak check
firmed by the AMS size-resolved measurements. The result-           downstream of the HEPA filter (Nault et al., 2018). It also
ing transmission accounts for all the losses in the PCI and         serves as a frequent confirmation for the real-time contin-
aerodynamic lens. A calculation of the inlet line losses is         uous detection limits estimated using the method proposed
presented in the Supplement (Fig. S4), and based on these           in Drewnick et al. (2009). AMS data were reported at 1 s
calculations additional losses are very small and can be ig-        and 1 min time resolutions. For the 1 min product, the raw
nored. These calculations do not include the transmission           mass spectra were averaged prior to data reduction and anal-
of the actual HIMIL aircraft inlet (Stith et al., 2009) nor         ysis, which reduces nonlinear spectral fitting noise for the
the secondary diffuser inside the HIMIL. To confirm that            least-squares error minimization method. This is observed
the aircraft-probe-related size-dependent losses or enhance-        because a fit to the 1 min average spectrum has less fitting
ments did not impact the overall transmission, the AMS sam-         noise than the average of the fits to the 1 s spectra. In the
pled several times at different altitudes off the University of     following analysis, the 1 min data product is used due to the
Hawaii (UH) and NASA Langley Aerosol Research Group                 improved signal-to-noise ratio (SNR). Since the aerosol load-
inlet (LARGE inlet hereafter) used by the NOAA instru-              ings were typically low and changed slowly in the global
ments over the course of the four ATom deployments, which           remote regions, longer averaging times were used for some
transmits particles to ∼ 3–5 µm dta,air with 50 % passing ef-       analyses. Continuous time-dependent detection limits (DLs)
ficiency (McNaughton et al., 2007; Brock et al., 2019a). No         were estimated using the method of Drewnick et al. (2009)
difference in volume comparison (discussed in Sect. 3.3) was        and corrected by comparison with the periodic filter blanks.
found under those conditions or in previous missions with on        The average DLs for the 1 min data were 76, 10, 6, 1, 7,
average larger accumulation mode peaks (Fig. S5); hence, we         and 30 ng sm−3 during ATom-1 and 133, 18, 9, 2, 10, and
conclude that this is a valid assumption. The lower-end AMS         40 ng sm−3 during ATom-2 for OA, SO4 , pNO3 , NH4 , Cl,
transmission for small particles is more difficult to quantify      and sea salt, respectively. Sea salt is an important submi-
than the upper end due to the challenges of making monodis-         cron aerosol component when sampling the marine bound-
perse particles in the sub-200 nm (dva ) size range for which       ary layer in ATom. Although sea salt is not a standard AMS
the DMA impactors cannot effectively remove the multiple-           data product, in this study we report AMS sea salt mass con-
charged particles, being limited by the airflows. In the lab,       centrations with the method from Ovadnevaite et al. (2012)
a newly constructed evaporation–condensation particle gen-          with a laboratory-calibrated response factor, 9.8 × 10⁻³ , for
erator produces monodisperse small oleic acid particles reli-       the AMS sea salt marker Na35 Cl. Additional species were
ably in the range of 20–250 nm. The lower-end mass-based            reported for ATom, with DLs for MSA (methanesulfonic
transmission was characterized in the summer of 2020 as the         acid) and ClOx (perchlorate) of 2 and 1 ng sm−3 during
best estimate for ATom.                                             ATom-1 and ATom-3, and 2 ng sm−3 during ATom-2. Io-
   Another concern for airborne sampling with an AMS is             dine and bromine were also quantified with DLs of 0.4 and
the misalignment of the aerodynamic lens due to mechanical          1.5 ng sm−3 during ATom-1 and 0.5 and 2 ng sm−3 during
stress during flight. Such a misalignment will not necessarily      ATom-2, as reported by Koenig et al. (2020). The variation
be caught by the previously described calibrations since they       in AMS detection limits across species is mostly controlled
do not probe the full surface of the vaporizer and since lens       by differences in background signals for different ions. Many
focusing can have some size-dependence. Hence for ATom-             of these detection limits are lower than for typical AMS air-
2–4, a particle beam width probe (Huffman et al., 2005)             craft operation, especially during the first several hours of
was flown, and profiles of both the air and particle signal         each flight, due to the use of a cryopump in the CU AMS
were taken at most airports during the mission, as shown in         (Jayne, 2004; DeCarlo, 2009). The above customizations of
Fig. S10, directly confirming the lack of change in lens align-     the CU AMS, such as the cryopump and PCI, optimize the
ment.                                                               instrument performance for aircraft deployments but do not
   During ATom, the AMS was operated in the fast mass               substantially make the intercomparisons less relevant to other
spectrum mode (FMS; Kimmel et al., 2011), allowing                  AMSs.
for high-time-resolution measurements at 1 Hz. For every
minute, AMS started with FMS with the particle beam                 2.5   Other aerosol measurements used in this study
blocked (instrumental background measurement; 6 s) and
then with the beam open (background plus ambient air and            The following instruments all sampled through the LARGE
particles; 46 s) and ended with efficient particle time-of-flight   inlet except soluble acidic gases and aerosol (SAGA). The
(ePToF) mode (nominally 8 s), which measured speciated              transmission efficiency for this inlet has been characterized

https://doi.org/10.5194/amt-14-3631-2021                                             Atmos. Meas. Tech., 14, 3631–3655, 2021
3636                                              H. Guo et al.: The importance of size ranges in aerosol intercomparisons

as a function of particle size by flying the NASA DC-8 in a       resolution and coverage in the submicron size range that mat-
previous campaign (McNaughton et al., 2007), demonstrat-          ters the most for the analysis presented in this work, CAPS
ing a unity efficiency up to supermicron size ranges and          data in this paper are only used to screen for in-cloud sam-
reaching 50 % at dta,air of ∼ 5 µm at the surface and 3.2 µm at   pling. Brock et al. (2021) combine the data from AMP and
12 km. Hereafter, we refer to the 50 % transmission diameter      CAPS to derive a size distribution product that covers a wider
as d50 .                                                          size range in which the CAPS data are used above 1.01 µm
   Particle size spectrometers. Dry particle size distributions   (and up to 50 µm) and the LAS data are used between 0.50
for dp from 2.7 nm to 4.8 µm were reported at 1 Hz using          and 1.01 µm. In this study, the LAS data are used between
three optical particle spectrometers, including a nucleation-     0.50 and 4.8 µm (Brock et al., 2019a).
mode aerosol size spectrometer (NMASS; custom-built;                 SP2. Refractory black carbon (rBC; as defined in Pet-
0.003–0.06 µm) (Williamson et al., 2018), an ultra-high sen-      zold et al., 2013) mass concentrations in the accumulation
sitivity aerosol spectrometer (UHSAS; Droplet Measurement         mode size range were measured by the NOAA single parti-
Technologies, Longmont, CO, USA; 0.06–1 µm) (Kupc et              cle soot photometer (SP2; Droplet Measurement Technolo-
al., 2018), and a laser aerosol spectrometer (LAS; LAS            gies, Longmont, CO, USA) (Schwarz et al., 2010b; Katich
3340, TSI, St. Paul, MN, USA; 0.12–4.8 µm), all operated          et al., 2018). The ATom SP2 detection system was operated
by NOAA Earth System Research Laboratory (ESRL). Two              as in Schwarz et al. (2010a) with a size range for rBC mass
NMASSs, two UHSASs (during ATom-2 and ATom-3, a                   of dve ∼ 90–550 nm (Schwarz et al., 2010b). This size range
300 ◦ C thermodenuder was installed upstream of the detector      typically contains ∼ 90 % of the total rBC mass in the am-
of the second UHSAS to volatilize refractory components),         bient accumulation mode (Schwarz et al., 2008; Shiraiwa et
and one LAS comprise the package of aerosol microphysical         al., 2008).
properties (AMP). Brock et al. (2019a) discussed extensively         PALMS. The particle analysis by laser mass spectrometry
the data inversion method to merge the three non-thermally        (PALMS) is a single-particle laser-ablation and ionization
denuded size distributions into one in the size resolution of     mass spectrometer instrument that measures size-resolved
20 bins per decade. Hereafter, we refer to the non-thermally      (dp ∼ 0.1–5 µm) particle chemical composition with a fast
denuded integrated volume (2.7 nm–4.8 µm) as the physical         response (Thomson et al., 2000; Murphy et al., 2006). Par-
sizing-based volume (Vphys ). AMP gives nearly unity detec-       ticle mass concentrations can be derived as a function of
tion efficiency of the ∼ 5 nm to ∼ 4 µm aerosols at sea level:    size when mapping the PALMS chemical composition to the
(1) the NMASS had nearly unity detection efficiency from          size distributions reported from the UHSAS and LAS (above
∼ 5 to 100 nm but only reported up to 60 nm; (2) the UHSAS        100 nm dp ), which is referred to as the PALMS-AMP prod-
had > 90 % counting efficiency from 63 to 1000 nm; and            ucts (Froyd et al., 2019). In this study, we focus on the dif-
(3) the LAS had high detection efficiency between 120 nm          ferent particle size ranges observed by PALMS and AMS,
and 10 µm; however, the max size was limited to < 4.8 µm          to illustrate the strengths and applications of the two aerosol
by the aircraft inlet (Brock et al., 2019a). AMP performed        composition instruments on board the DC-8. PALMS is the
well and consistency was found in the overlapping size range      most complex of the chemical composition instruments used
during ATom. For instance, Brock et al. (2019a) found agree-      in ATom. It has both a very steep detection efficiency vs. par-
ment within 1 % for particle number and 9 % for integrated        ticle size in the smaller particle range and the ability to mea-
volume for the overlap between the UHSAS and LAS dur-             sure much larger particles than the AMS. While the total re-
ing ATom-1. Although the NMASS barely overlapped with             ported mass (with some density uncertainty) of the PALMS-
the UHSAS, the two size distributions appear to agree well        AMP products will always match the physical volume mea-
with each other as shown in Fig. 6 in Brock et al. (2019a).       surement over the range that PALMS reports (100–5000 nm
Most relevant to the AMS size range, the UHSAS reported           dp ), the uneven sampling data coverage of particles across
volume was estimated to have an asymmetric uncertainty of         each size bin, as well as the broadness of the bins chosen for
+12.4 %/ − 27.5 % due to the differences in refractive index      PALMS-AMP analysis, can lead to a chemical bias if com-
(n) between ambient particles and assumed ammonium sul-           position gradients exist within a bin (Fig. S13). Therefore,
fate particles (n = 1.527, which is similar to the refractive     care must be taken to balance statistical representativeness
index found for aged ambient OA; Aldhaif et al., 2018). This      against the need for unvarying particle composition across
uncertainty range is estimated to be between 1σ and 2σ de-        the size range over which those statistics are obtained (Froyd
pending on the conditions. Here we assume that it represents      et al., 2019). In addition to the allocated four size bins that
1.5σ when using it for uncertainty analyses.                      assume 100 % data coverage (Froyd et al., 2019), we also
   Other than the AMP that was operated in the cabin of the       characterize the operational size coverage of PALMS based
DC-8 and provided dry particle size distributions, the sec-       on the reported size resolution of the AMP particle size distri-
ond generation cloud, aerosol, and precipitation spectrome-       butions (i.e., at higher size resolution) for ease of comparison
ter (CAPS) was installed underwing to monitor the aerosol         with other instruments. The details can be found in Sect. S8.
and cloud droplet size distributions at near-ambient condi-          SAGA. Gas-phase HNO3 plus particulate inorganic nitrate
tions (Spanu et al., 2020). Since the CAPS has limited size       and sulfate were measured online with the University of

Atmos. Meas. Tech., 14, 3631–3655, 2021                                            https://doi.org/10.5194/amt-14-3631-2021
H. Guo et al.: The importance of size ranges in aerosol intercomparisons                                                     3637

New Hampshire (UNH) SAGA mist chamber (MC) ion chro-               The combined density of SO4 , NH4 , and pNO3 is assumed
matography (IC) at a time resolution of ∼ 80 s. Water-soluble      to be 1.75 g cm−3 , an approximation from ammonium sul-
chemical species were also measured offline by collecting          fate, ammonium bisulfate, and ammonium nitrate (Sloane
particles with Zefluor filters (9 cm diameter, 1 mm thick, and     et al., 1991; Stein et al., 1994; Salcedo et al., 2006). The
1 µm pore size, from MilliporeSigma Corp., Burlington, MA,         non-refractory chloride density is assumed to be 1.52 g cm−3
USA) with subsequent procedures as described by Dibb et            based on ammonium chloride (Salcedo et al., 2006). The sea
al. (1999, 2000) and Heim et al. (2020). In brief, filter sam-     salt volume is estimated from its AMS mass concentration
ples were collected during level portions of each flight, stored   with a density of 1.45 g cm−3 , assuming particles had not
over dry ice, extracted with ultrapure water, and sent back to     fully effloresced prior to detection (Froyd et al., 2019). Sea
the lab in UNH for IC analysis to quantify more species than       salt is typically externally mixed with sulfate, organic, and
the MC (Dibb, 2019).                                               nitrate internally mixed particles (Froyd et al., 2019); there-
   SAGA filters were sampled from the UNH inlet with an            fore, it is not routinely considered in the aerosol density es-
estimated cutoff size of 4.1 µm (dta,sea,50 ) at the surface and   timation (such as in Eq. 5). The rBC volume is estimated
2.6 µm (dta,air,50 ) at 12 km (McNaughton et al., 2007). The       from SP2 mass measurements (Katich et al., 2018) with a
SAGA MC sampled from a glass-coated (vapor deposited)              density of 1.77 g cm−3 (Park et al., 2004). The frequency
manifold (8 cm inner diameter) with high airflow (on the or-       distributions of ρm and ρOA are summarized in Fig. S21.
der of 2000 sL m−3 at low altitude) (as shown in Fig. S17).        The mass-weighted average ρm is 1.60 ± 0.14 g cm−3 and
The diffuser type configuration at the manifold entrance           1.66 ± 0.10 g cm−3 , and ρOA (averaged from concentrations
boosts airflow, and the surrounding piece at the pipe tip ex-      above OA DL) is 1.51 ± 0.19 g cm−3 and 1.59 ± 0.24 g cm−3
cludes cloud droplets and giant sea salt particles (Talbot et      for ATom-1 and ATom-2, respectively. Negative AMS mass
al., 2003). The in-cabin part of the pipe till MC was heated to    concentrations exist at low concentrations since the AMS
50 ◦ C to minimize HNO3 wall deposition, although sampled          uses a difference measurement (signal minus background).
air T is assumed to be the same as ambient due to the high         These negative AMS mass concentrations are kept as they are
airflow and short residence time (∼ 0.2 s). A small glass tube     in deriving Vchem , otherwise a positive statistical bias would
from MC, which is sealed at the bottom and opens a small           be introduced if a zero or a positive value was artificially as-
hole on the downstream side, sticks down into the manifold.        signed to those data points.
This configuration provides a particle cutoff size of ∼ 1 µm          The exclusion of dust in the volume closure is reasonable
(dta,sea,50 ) at the surface and lower at higher altitudes (van    in general based on the results in Sect. 3.2 due to the lim-
Donkelaar et al., 2008).                                           ited impacts from dust for ATom, on average 1.1 ± 4.3 %
   To be compared with other ATom aerosol measurements,            (median = 0.0 %) of the AMS observed volume, but it can
the pressure-dependent SAGA MC and filter inlet transmis-          contribute as high as 95 % for occasional short plumes en-
sions are calculated based on the ATom conditions and sum-         countered in ATom-2 (Fig. S22) (Froyd et al., 2019). Besides,
marized in the Supplement in Figs. S18 and S19, respec-            we exclude the last ATom-1 research flight (a transit flight
tively.                                                            in the continental United States from Minneapolis, MN, to
                                                                   Palmdale, CA, different from the remote marine atmosphere
2.6    Estimating aerosol volume from chemical                     of the other ATom flights) and < 10 min of sampling im-
       instruments                                                 pacted by volcanic ash near Hawaii in ATom-2 (Research
                                                                   Flight 203, 30 January 2017). As discussed above, we use
For instrument comparisons, we estimate the aerosol vol-           1 min AMS data for intercomparison, and 1 s Vphys is aver-
ume based on the chemical instruments (Vchem ). Vchem is de-       aged to the same timescale. There may be a minor bias in-
termined from the AMS non-refractory mass concentrations           troduced from this approach since AMS periodic blank mea-
plus the refractory species sea salt and rBC by assuming vol-      surements exclude some 1 s data points from the AMS but
ume additivity, with an average particle density (ρm ) esti-       not from Vphys (∼ 3 % of the total 1 s Vphys points), and sim-
mated as in DeCarlo et al. (2004) and Salcedo et al. (2006).       ilarly, some data are removed from the sizing measurements
       OA + SO4 + pNO3 + NH4 + Cl + Seasalt + rBC                  due to cloud masking but not for the AMS (13 %, discussed
ρm =                                                        (5)    below in Sect. 3.2). In this study, the particle volume is re-
          OA
          ρOA   + SO4 +pNO
                        1.75
                            3 +NH4    Cl
                                   + 1.52 + Seasalt rBC
                                             1.45 + 1.77
                                                                   ported in units of µm3 scm−3 , where scm−3 are cubic cen-
   The OA density (ρOA ) is estimated with the AMS mea-            timeters of air under STP. When comparing Vchem to Vphys ,
sured O/C and H/C atomic ratios of OA using the param-             orthogonal distance regression (ODR) is always used to de-
eterization of Kuwata et al. (2012) (when OA is under the          rive the linear fitting slope (for comparing two variables with
DL and hence no elemental ratios can be calculated, we             uncertainties), such as in Figs. 4–6.
assumed a default ρOA of 1.7 g cm−3 based on typical OA
elemental ratios found for concentrations close to the DL;
Fig. S20). The “improved-ambient” method was used for OA
elemental analysis (Canagaratna et al., 2015; Hu et al., 2018).

https://doi.org/10.5194/amt-14-3631-2021                                             Atmos. Meas. Tech., 14, 3631–3655, 2021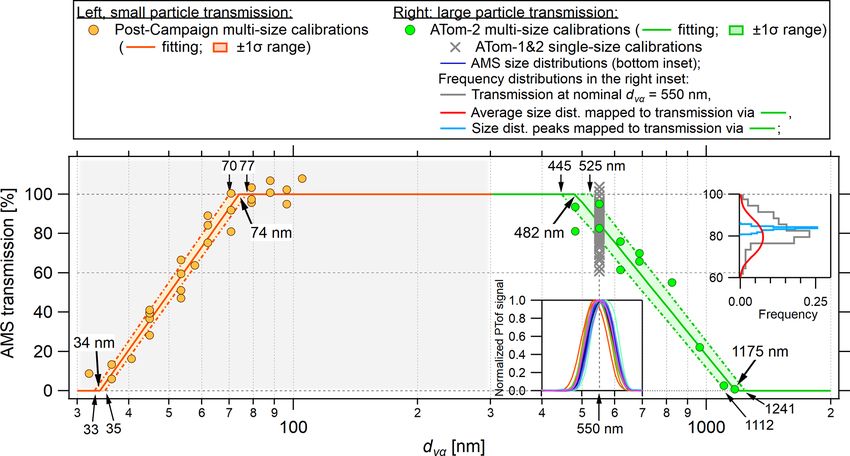
3638                                                  H. Guo et al.: The importance of size ranges in aerosol intercomparisons

2.7    Summary of the ATom aerosol size distribution and
       in-cabin instrument size ranges

Figure 1 summarizes the ATom-2 campaign-averaged num-
ber and volume size distributions from AMP and compares
them to the subranges observed from several ATom aerosol
instruments to provide context for this study and future in-
strument comparisons based on the ATom dataset (Brock et
al., 2021, present a wider size coverage by combining the
data from AMP and CAPS. Fig. S23 is the same as Fig. 1 ex-
cept for showing the number size distribution in a log scale.).
The upper cutoff sizes for LAS, SAGA MC, and filter, de-
termined from their inlets, move towards smaller particles
at higher altitudes; thus the size ranges plotted in Fig. 1 for
these instruments are the best-case scenario (in the planetary
boundary layer). In contrast, the AMS transmission stays the
same up to ∼ 9 km. Based on Fig. 1, the AMS size range
is more closely comparable to SAGA MC, and comparison
to all the other instruments requires considering the different
size ranges. Therefore, accurately characterizing AMS trans-           Figure 1. Approximate particle size ranges quantified by AMS,
                                                                       SP2, PALMS, SAGA MC, SAGA filters, and AMP (NMASS, UH-
mission is a prerequisite for quantitative instrumental inter-
                                                                       SAS, and LAS), plotted with the campaign-averaged AMP number
comparisons. While the focus of this work is on in-cabin in-
                                                                       and volume size distributions during ATom-2. For each instrument
strument comparisons, we want to emphasize that a properly             (except PALMS), the box indicates 100 % inlet transmission and
characterized size cut is also important for model compar-             the transition shade on both sides indicates a decrease from 100 % to
isons and that the size bins used in most global models, typi-         0 %, with 50 % denoted by the vertical dashed line. The PALMS bar
cally reported as dp , vary widely (Hodzic et al., 2020).              represents the approximate observable size range at a 60 min aver-
                                                                       aging timescale (at AMP size resolution) for composition data only
                                                                       (see Sect. S8). The top horizontal axis shows aerodynamic diame-
3     Results and discussion                                           ter (dta,sea ) and the bottom geometric diameter (dp ); the conversion
                                                                       between the two diameters is based on ATom-2 campaign-averaged
                                                                       aerosol density of 1.70 g cm−3 and sea level P of 1013 mbar using
3.1    AMS transmission
                                                                       Eq. (2).
AMP gives nearly unity detection efficiency of the particles
(not lost in the inlet) from ∼ 5 nm to ∼ 4 µm (dp ) at sea level
and 50 % transmission at 2.7 nm and 4.8 µm (inlet-limited),            and a 100 % transmission at 74 nm (70–77 nm). The sizes
of which AMS, SAGA MC, PALMS, and SP2 observe a sub-                   are slightly better than previous and scarce measurements
range (McNaughton et al., 2007; Brock et al., 2019a). There-           (Zhang et al., 2004; Knote et al., 2011), 0 % at 35 nm and
fore, the volume derived from the AMP size distributions               100 % at 100 nm. Other than new particle formation and
(Vphys ) can be used as the basis for intercomparisons. Charac-        growth events, the small particle end of the transmission
terizing AMS transmission (EL ) is critical for a meaningful           curve is less critical in determining submicron aerosol vol-
comparison of Vphys vs. Vchem .                                        ume since volume is normally dominated by the accumula-
   AMS transmission (always specified vs. dva ) can be quite           tion mode (which normally refers to the range 100–1000 nm
variable between instruments and can also change for a spe-            dta ) (Seinfeld and Pandis, 2016) instead of the Aitken mode
cific AMS in time, so it is critical to characterize the trans-        (10–100 nm dta ). Brock et al. (2019a) found the accumu-
mission in the field for meaningful instrumental intercom-             lation mode during ATom to be 60–500 nm dp , equivalent
parisons (Liu et al., 2007; Knote et al., 2011; Hu et al., 2017;       to 93–674 nm in dta,sea , as remote particles were far away
Nault et al., 2018). During ATom, the large particle region            from sources of precursor gases that could sustain growth to
(∼ 500–1200 nm, dva ) of the CU AMS transmission was cali-             larger sizes. Sensitivity tests on the small particle transmis-
brated in the field (Fig. 2). A fit to the multi-size field calibra-   sion points (Sect. 3.4 below) confirm a lack of impact on the
tions indicates a 100 % transmission at dva of ∼ 483 nm (1σ            volume comparison for ATom conditions. AMS transmission
range: 445–525 nm) and a 0 % transmission at ∼ 1175 nm                 curves for all ATom campaigns are shown in Fig. 3. Impor-
(1112–1241 nm), with 50 % transmission at 754 nm. This                 tantly, the AMS transmission for large particles improved no-
transmission was stable throughout the ATom-1 and ATom-                ticeably for ATom-4 compared to the prior ATom legs pos-
2 deployments. The small particle region was calibrated in             sibly due to small changes in the inlet during reassembly.
the lab, showing a 0 % transmission at 34 nm (33–35 nm)                This shows the importance of characterizing EL for each

Atmos. Meas. Tech., 14, 3631–3655, 2021                                                   https://doi.org/10.5194/amt-14-3631-2021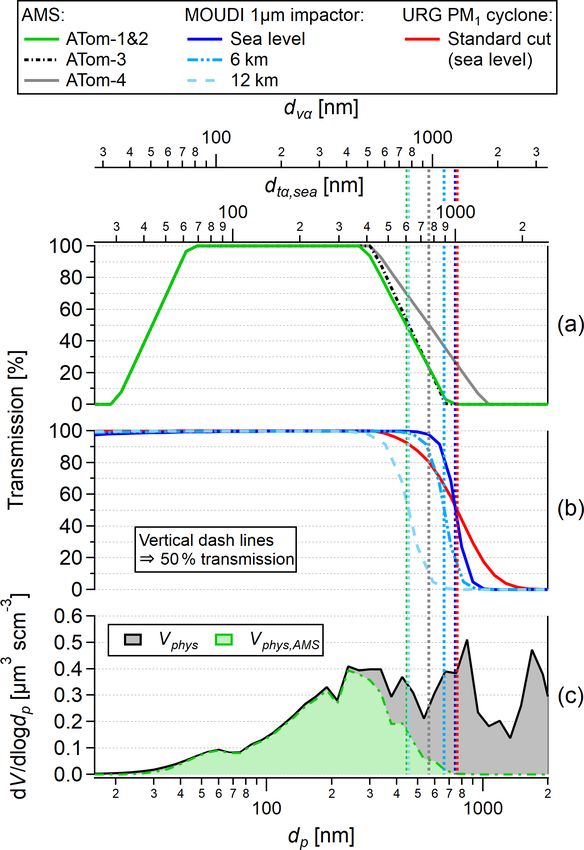
H. Guo et al.: The importance of size ranges in aerosol intercomparisons 3639
campaign for quantitative intercomparisons. Similar changes ATom-4). Thus the cutoff size of the AMS in ATom is more
have been observed in the past for other aircraft and ground stringent than a MOUDI nominal PM1 cut at the surface and
campaigns. 6 km and less stringent at the higher altitudes in ATom-4. Im-
portantly, the AMS transmission stays constant up to ∼ 9 km
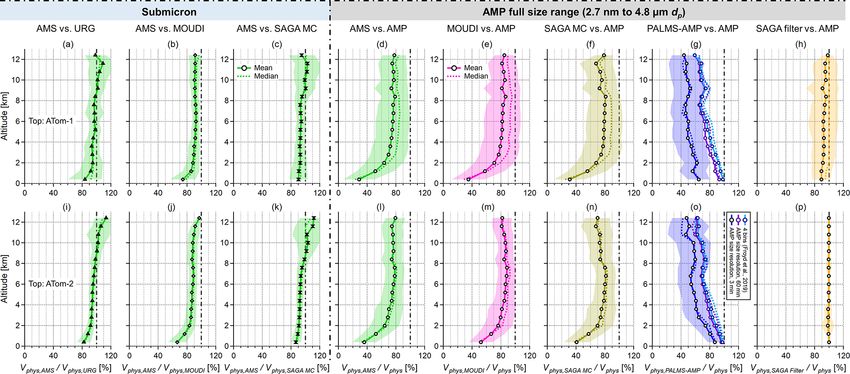
3.2 Comparison of AMS vs. standard PM1 size cuts in altitude for the implemented PCI. No in-field characteri-
zation of the AMS transmission at higher altitudes (when in-
AMS is often described as an approximate “PM1 ” or “sub- let pressure slips) was performed, but laboratory calibration
micron” instrument. Since the standard definition of PM1 is shows no change in transmission at 710 nm dva at the max
based on devices that impose an aerodynamic diameter (dta ) altitude inlet pressure (1.05 Torr).
cut under ground-level pressure, temperature (e.g., defined as For ground studies, URG PM1 standard cut (model: URG-
T = 293.15 K and P = 1013 mbar; Marple et al., 1991), and 2000-30EHB) and sharp cut (model: SCC 2.229) cyclones
humidity, the equivalent AMS transmission in dta depends are widely used for non-AMS instruments. The estimated
on particle density and composition, as well as the EL of diffusion loss of small particles in the URG cyclones was
the specific AMS for a given study. The careful transmission negligible (e.g., 5 % loss at dta,sea = 5 nm and less loss
calibrations and extensive sampling of ATom allow for more expected at larger sizes), calculated with a nominal flow
precise characterizations of this cutoff size for the CU air- rate of 16.7 L m−3 and assumed cyclone internal dimen-
craft AMS and remote aerosols. sions of 0.50 inch (1.27 cm) in diameter and 50 cm in
For aircraft sampling when a submicron cut is desired length (Reynolds number = 2100, indicating a likely turbu-
(not including the AMS), the single 1 µm stage from a lent flow). The two cyclones offer cutoff sizes at 1 µm at
micro-orifice uniform deposit impactor (MOUDI) (Marple T = 293.15 K and P = 1013 mbar (Fig. S24) and smaller
et al., 1991, 2014) is often used (e.g., Peltier et al., 2008; cuts when such cyclones are deployed at lower ambient pres-
Brock et al., 2011; Guo et al., 2016) to preselect submicron sure and the nominal volumetric flow, e.g., at a mountain site.
particles (the transmission is shown in Fig. S24). Here, we One additional complexity arises since the standard PM1
choose MOUDI instead of SAGA MC, also known as a sub- cut made with URG cyclones are under ambient humidity
micron cut instrument deployed for aircraft studies, due to conditions (i.e., particles are not dried prior to sampling).
the lack of a published transmission curve for SAGA MC. Thus, the equivalent dry particle cut size is below 1 µm at
Due to the higher temperature in cabin vs. ambient air (Guo sea level and depends on the amount of liquid water asso-
et al., 2016), the MOUDI impactor (operating at cabin T and ciated with the particles. For the ATom conditions, parti-
ambient P ) is expected to size-select dry particles, similar cle size shrinks on average ∼ 20 % (assuming a complete
to the AMS. The impactor provides a nominal PM1 cut at loss of the predicted particle liquid water content from the
T = 293.15 K and P = 1013 mbar, but the dta,50 for a given higher ambient RH, mean/median(± SD) = 40/36(±29) %,
particle is pressure and temperature dependent, and thus it to the lower inlet RH, 10/0.4/(±21) %; Fig. S2c–d), and
varies with altitude. For instance, at an aerosol density of the frequency distribution plots are shown in Fig. S25 (SD
1.7 g cm−3 (the ATom-2 campaign average), dta,air,50 drops stands for standard deviation). While AMS transmission is
from 1 µm to 912 nm at 6 km and to 686 nm at 12 km height, characterized by dry particles, a smaller difference between
based on the US standard atmosphere (NOAA et al., 1976), the AMS transmissions and the cyclone transmissions is ex-
as shown in Fig. 3. Even lower cut sizes, 752 nm at 6 km and pected compared to Fig. 3. Taking the estimated ∼ 20 %
400 nm at 12 km, are expected if the impactor was operated shrinkage in particle size from drying in the sample line (for
under ambient T (not typically done and best avoided for an the ATom-1 and ATom-2 conditions), the AMS transmission
optimal particle cut; summarized in Table S1). Hence, the would be equivalent to a standard PM0.75 and a PM0.95 cut
deviation from the nominal 1 µm cut size can be very signifi- during ATom-2 and ATom-4, respectively, in terms of ambi-
cant at high altitudes (although it could in principle be mod- ent aerosol size.
ulated by changing the flow rate vs. altitude). The pressure- Since aerosol density affects the conversion between dva
dependent diffusion loss of small particles for MOUDI is es- and dta (Eqs. 1–2), a higher AMS dta,50 is expected if sam-
timated using the inlet system on board the NCAR/NSF C- pling aerosols with lower densities than the ATom-2 cam-
130 from Guo et al. (2016), a ∼ 2.5 m tubing with an inner di- paign average of 1.70 g cm−3 . To illustrate this point further,
ameter of ∼ 1.1 cm. Given a flow rate of 30 L m−3 , Reynolds results based on an assumed 0.9 g cm−3 aerosol density, typi-
number is 3858 at sea level and increases with altitude, indi- cal of hydrocarbon-like OA from lubricating oil or oleic acid
cating a turbulent flow in the inlet. as a cooking aerosol surrogate (Kuwata et al., 2012; Herring
If we compare the AMS transmission to ground-level- et al., 2015), are shown in the Supplement in Fig. S26b. In
based dry dta (using a dry particle density of 1.7 g cm−3 to this case, the ATom-2 and ATom-4 AMS dta,sea,50 values in-
calculate dta from dva ), the ATom-2, ATom-3, and ATom-4 crease to 789 and 1006 nm, respectively, making the ATom-4
dta,sea,50 values are 599, 615, and 758 nm, respectively (the AMS a dry PM1 cut when performing experiments with those
dta,air,50 values are higher and listed in Table S1; for example, aerosols.
dta,air,50 is 782 and 837 nm at 6 and 12 km, respectively, for
https://doi.org/10.5194/amt-14-3631-2021 Atmos. Meas. Tech., 14, 3631–3655, 20213640 H. Guo et al.: The importance of size ranges in aerosol intercomparisons
Figure 2. Results of AMS transmission calibrations vs. vacuum aerodynamic diameter (dva ) for ATom-1 and ATom-2. The small particle
transmission was calibrated with oleic acid post-campaign (left), and the large particle transmission was calibrated with NH4 NO3 particles
in the field. On the right side, the green markers are multi-size field calibrations, and the gray cross markers are single-size (at dm = 400 nm,
equivalent to 550 nm dva ) field calibrations after every research flight. The insets show the frequency distributions of measured transmissions
(right, top) and observed, normalized size distributions (left, bottom) of these single-size calibrations. A fit shows 100 % transmission at
483 nm (1σ uncertainty of the fit: 445–525 nm) and 0 % transmission at 1175 nm (1σ : 1112–1241 nm). When forcing 0 % transmission
at 1175 nm (confirmed by (NH4 )2 SO4 calibrations), the fit to all data gives 100 % transmission at 482 nm (1σ : 479–485 nm, not shown),
consistent with the 483 nm fitted values based only on the ATom-2 multi-size field calibrations.
It is also useful to compare the sharpness of the different the AMS (Eq. 5). This volume is referred to as Vphys,AMS
transmission curves. The sharpness of transmission is com- (the AMS-transmission-corrected Vphys ). The comparisons
monly defined as (dta,16 /dta,84 )0.5 , where dta,16 and dta,84 are between Vphys,AMS and Vchem for ATom-1 and ATom-2 are
particle aerodynamic diameters at 84 % and 16 % transmis- shown in Fig. 4. Good agreement is observed, with the data
sions (Peters et al., 2001). The sharpness of the AMS trans- points distributed around the 1 : 1 line over a 3-order-of-
mission profiles is similar to that of a URG PM1 standard magnitude range of concentrations. For ATom-1 the regres-
cut cyclone: 1.34 in ATom-2 and 1.49 in ATom-4 compared sion slope is 0.95 (0.949 ± 0.003), and r 2 is 0.95. The larger
to 1.35 and 1.17 of the URG standard cut and sharp cut cy- volume concentrations were generally detected in the bound-
clones (a lower number indicates a sharper cut). The MOUDI ary layer. Time averaging reduces random noise (more dom-
1 µm stage impactor provides the sharpest cut at 1.12 at sea inant at smaller volumes), as evidenced when comparing this
level, but the sharpness decreases at higher altitudes, 1.15 at analysis for 1, 5, and 10 min averages (Fig. S27). The fitting
6 km and 1.22 at 12 km. slope being slightly further from 1 (1.083±0.003) in ATom-2
Including all effects, the CU aircraft AMS was approxi- (r 2 of 0.93) may be due to the larger contribution of sea salt
mately equivalent to a standard ground-level PM0.75 instru- in ATom-2 in the boundary layer (Hodzic et al., 2020) and
ment during ATom-2 and a PM0.95 instrument during ATom- hence the larger uncertainty arising from applying the AMS
4. For laboratory or field experiments with oily particles with size cut. Nevertheless, the slopes for ATom-1 and ATom-2
an aerosol density of 0.9 g cm−3 , the same AMS would be a are well within the combined instrumental uncertainties (dis-
PM0.79 or PM1.0 instrument in terms of dry aerosol size. cussed in this section). To illustrate the impacts of sea salt,
we replotted the comparisons (Fig. 4a–b) colored by sea salt
3.3 Volume closure shown in Fig. S28a–b, which suggests that some outliers in
ATom-2 are observed at high sea salt concentrations. We also
AMS observes a fraction of the full AMP size distribu- investigate the potential differences in the data products due
tions, as shown in Fig. 3. To properly characterize the part to the differences in raw data processing criteria for cloud
of Vphys observed by the AMS, we first convert the cal- artifacts between AMS and AMP and find no clear evidence
ibrated dva -based AMS transmission to its dp -based form (Fig. S28c–d). Furthermore, we confirm that excluding sub-
(using Eq. 1) with the time-resolved ρm estimated from
Atmos. Meas. Tech., 14, 3631–3655, 2021 https://doi.org/10.5194/amt-14-3631-2021H. Guo et al.: The importance of size ranges in aerosol intercomparisons 3641
(0.4 % deviation in slope for 10 bins per decade and ∼ 1.6 %
for 5 bins per decade) despite the slightly larger scatter as
expected from applying AMS transmission to a coarser size
distribution (Fig. S29).
Species density is used to convert the AMS mass to vol-
ume concentrations and thus affects the volume comparison.
As discussed above (Fig. S21), ρOA in this study is estimated
with the parameterization method of Kuwata et al. (2012).
The ρOA parameterization method from Kuwata et al. (2012)
was validated up to 1.9 g cm−3 (i.e., oxalic acid), and the lab
generated SOA in that study had up to 1.46 g cm−3 ρOA with
an O/C of 0.72. The estimated ATom-1 and ATom-2 ρOA
is close to that of succinic acid, 1.57 g cm−3 , which has a
similar O/C ratio (ATom-1 and ATom-2 vs. succinic acid:
1.05 ± 0.44 vs. 1.0), and falls into the observed ρOA density
range, 1.5–1.7 g cm−3 , for low mass concentrations of SOA
(< 3 µg m−3 , as was the case during most ATom flights) made
from α-pinene and ozone from a chamber study (Shilling
et al., 2009). However, ρOA estimated from PALMS, 1.35–
1.45 g cm−3 (Froyd et al., 2019), is ∼ 0.2 g cm−3 lower than
that estimated from AMS for reasons that are not yet under-
stood. As a sensitivity check, we recalculate Vchem by sub-
tracting 0.2 g cm−3 from the AMS estimated ρOA (Fig. S30).
Compared to the base cases (Fig. 4a–b), the r 2 values barely
change, and the slopes increase by 5 % or 8 % due to the
higher estimated OA volume in Vchem . Therefore, this uncer-
tainty is below 10 % and does not undermine the agreement
within the uncertainties between Vchem and Vphys,AMS .
To illustrate that applying the AMS transmission to Vphys
is a prerequisite for a meaningful comparison, Fig. 4c illus-
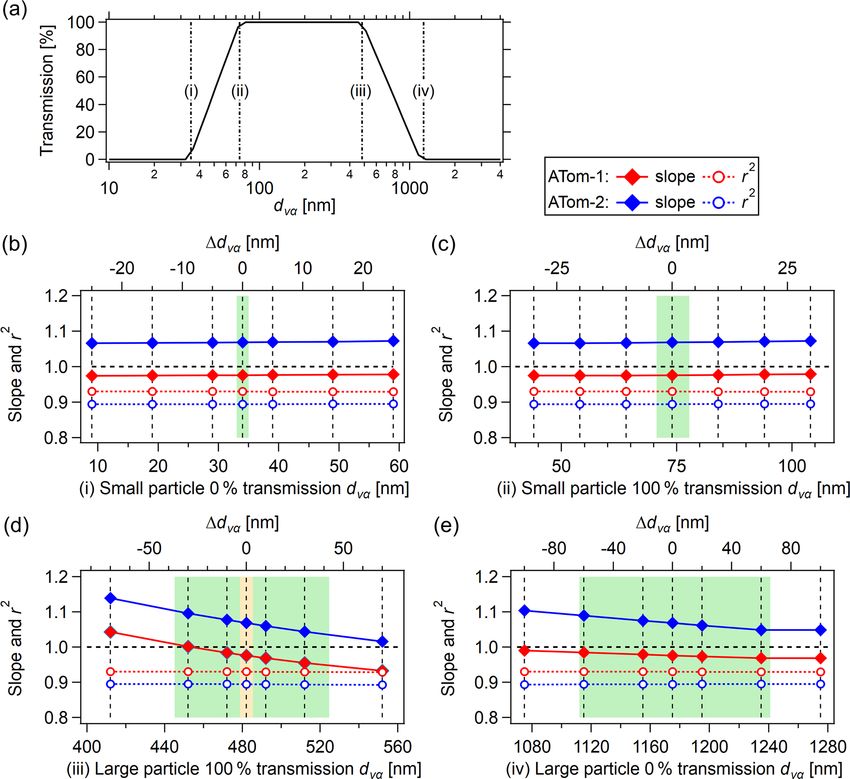
Figure 3. Transmission curves (a) for AMS during ATom-1 (same trates the volume closure for a research flight in ATom-2
for ATom-2), ATom-3, and ATom-4 deployments and (b) for (RF208, 15 February 2017, from Ascension to the Azores), in
MOUDI 1 µm stage impactor operated at sea level, 6 km, and 12 km which the contribution of supermicron particles to total vol-
(at T = 293 K as typical cabin temperature and P based on the US ume is significant. Although Vphys was, in general, several
standard atmosphere) (NOAA et al., 1976) and for URG PM1 cy- times larger than Vchem when the DC-8 flew at lower alti-
clone (sea level). (c) Average AMP volume distribution (Vphys ) and tudes (below ∼ 3 km), Vphys,AMS agrees very well with Vchem
the fraction observed by AMS (Vphys,AMS ) for ATom-2. Particle with a regression slope of 1.04 and an r 2 of 0.97. The ef-
size in geometric diameter (dp ; reported by AMP), vacuum aerody- fect of applying the AMS transmission to Vphys is also shown
namic diameter (dva ; AMS), and aerodynamic diameter (dta ; for the in Fig. 3a and b as the gray markers on the campaign level.
MOUDI impactor and URG cyclone; note that the MOUDI trans-
Clearly, at times the effect is major, and at other times mini-
missions at 6 and 12 km are accurate on the dp and dva axes but
slightly off on the sea level dta axis due to the change in slip correc-
mal, depending on the ambient size distribution. When AMS
tion) are shown as the three horizontal axes, all for dry particles. The transmission is not characterized, an alternative for volume
50 % large particle cutoff sizes for AMS, MOUDI, and URG are intercomparison is to truncate Vphys at a certain size (e.g.,
listed in Table S1 based on dta , dva , and dp . Because URG cyclone 1 µm). In this case, the intercomparison is not ideal (shown
is normally used to size-select ambient particles for ground studies, in Fig. S31 with slopes of 0.74 and 0.65 for ATom-1 and
the equivalent dry cut would be smaller than 1 µm, approximately ATom-2, respectively, with more scatter for ATom-1), high-
0.8 µm based on the aerosols sampled in this study (Sect. 3.5). lighting the importance of calibrating and applying the inlet
transmission. To examine if applying the AMS transmission
introduces a systematic bias, Fig. 4a–b was replotted and col-
micron dust volume is reasonable; only a few outliers have ored by the removed fraction of Vphys (in the Supplement in
noticeably higher contributions from dust (Fig. S28e–f). Be- Fig. S32). The binned data points at 20 % intervals show lit-
sides, as a sensitivity test, we estimate Vphys,AMS based on tle difference, suggesting that no significant bias is arising
broader bin widths to test the impact of AMP size resolu- for this reason for both ATom-1 and ATom-2. An exception
tion. We find that using 10 or 5 bins per decade has minor is the 80 %–100 % bin for ATom-2 due to some outliers with
effects compared to the AMP-reported 20 bins per decade high sea salt as shown in Fig. S28b and possibly the increased
https://doi.org/10.5194/amt-14-3631-2021 Atmos. Meas. Tech., 14, 3631–3655, 2021You can also read


