Preliminary abstract booklet for packaged talks - The International Association for Forensic Phonetics and Acoustics
←
→
Page content transcription
If your browser does not render page correctly, please read the page content below
29th Conference of
The International Association for Forensic Phonetics and
                        Acoustics
         22nd August – 25th August 2021, Marburg

             preliminary
          abstract booklet
         for packaged talks
IAFPA 2021
                                                            22nd August – 25th August 2021, Marburg
                                                                      – Final Program –

           Sunday , 22th August 2021
   18:00 Registration + Welcome
         Crash course Gathertown and Webex
   19:00 The Tonight Show starring Gea de Jong-Lendle hosting two mystery guests
Open End Gathertown remains open throughout the conference

           Monday , 23rd August 2021
   08:45 Crash course Webex
   09:00 Welcome        Chair                                                            Gea de Jong-Lendle
                        Director Research Centre Deutscher Sprachatlas , Philipps-       Prof Alfred Lameli
                        University Marburg
                        Senior Advisor for Serious Crime - Hessisches                    Kriminalhauptkommissar Klaus Lochhas
                        Landeskriminalamt
   09:30 Keynote 1      Michael Jessen                                                   Two issues on the combination between automatic and auditory-acoustic methods in
                                                                                         forensic voice comparison
   10:30 Talk 1         Peter French, Jessica Wormald, Katherine Earnshaw, Philip        An Empirical Basis for System Validation and Proficiency Testing in the UK
                        Harrison, Richard Rhodes and James Tompkinson
   10:55                BREAK

   11:30 Talk 2         Christin Kirchhuebel and Georgina Brown                          Competency Testing: Opportunities and Challenges
   11:55 Talk 3         Richard Rhodes                                                   Project proposal for IAFPA-led collaboration on method testing and validation
   12:20 Talk 4         Sula Ross, Georgina Brown and Christin Kirchhübel                Voicing Concerns: Data protection principles and forensic speech science

   12:45                LUNCH

   13:45                Poster session 1

   14:45                BREAK

   15:15 Talk 5         Anil Alexander, Finnian Kelly and Erica Gold                     A WYRED connection: x-vectors and forensic speech data
   15:40 Talk 6         Bruce Xiao Wang and Vincent Hughes                               System performance as a function of score skewness, calibration and sample size in forensic
                                                                                         voice comparison
   16:05 Talk 7         Zhenyu Wang and John H.L. Hansen                                 Impact of Naturalistic Field Acoustic Environments on Forensic Text-independent Speaker
                                                                                         Verification System

   16:30                BREAK

   16:50 Talk 8        Tomáš Nechanský, Tomáš Bořil, Alžběta Růžičková, Radek            The effect of language and temporal mismatch on LTF and ASR analyses
                       Skarnitzl and Vojtěch Skořepa
   17:15 Talk 9        Linda Gerlach, Tom Coy, Finnian Kelly, Kirsty McDougall and       How does the perceptual similarity of the relevant population to a questioned speaker affect
                       Anil Alexander                                                    the likelihood ratio?
   17:45 Zumba (15Min) Dr. Zumba                                                         Something for your mental and physical wellbeing: Get those old bones moving!

           Tuesday , 24th August 2021
   09:30 Talk 10        Conor Clements, Deborah Loakes and Helen Fraser                  Forensic audio in context: enhancement, suggestibility, and listener aptitude for identifying
                                                                                         speakers in indistinct audio
   09:55 Talk 11        Valeriia Perepelytsia, Thayabaran Kathiresan, Elisa Pellegrino   Does audio recording through video-conferencing tools hinder voice recognition
   10:20 Talk 12        and Volker
                        Camryn      Dellwo Philip Harrison and Amelia Gully
                                 Terblanche,                                             performance?ofAhumans
                                                                                         Performance      comparison   study onspoofed
                                                                                                                   in detecting differentspeech
                                                                                                                                          audio in
                                                                                                                                                channel recordings
                                                                                                                                                   degraded conditions

   10:45                BREAK

   11:15 Talk 13        Luke Carroll                                                     Bringing rhythm measures to spontaneous speech through frequently occurring speech units

   11:40 Talk 14        Kirsty McDougall, Alice Paver, Francis Nolan, Nikolas Pautz,     Phonetic correlates of listeners’ judgements of voice similarity within and across accents.
                        Harriet Smith and Philip Harrison
   12:05 Keynote 2      Phil Rose                                                        Applications of the likelihood ratio framework in forensic speech science

   12:55                LUNCH

   14:00                Poster session 2

   15:00                BREAK

   15:30 Talk 15        Linda Gerlach, Kirsty McDougall, Finnian Kelly and Anil          How do Automatic Speaker Recognition systems 'perceive' voice similarity? Further
                        Alexander                                                        exploration of the relationship between human and machine voice similarity ratings
   15:55 Talk 16        Willemijn Heeren and Lei He                                      Between-speaker variability in segmental F1 dynamics in spontaneous speech
   16:20                Annual General Meeting

   18:00                CONFERENCE DINNER

   19:30 Keynote 3      Yulia Oganian                                                    Encoding and decoding of speech sounds using direct neural recordings from human auditory

           Wednesday , 25th August 2021
   09:30 Talk 17        Helen Fraser                                                     Updating the Likelihood Ratio debate: Behind the scenes in three Australian trials
   10:00 Talk 18        Tina Cambier-Langeveld                                           Speaking of authorship ̶ can text analysis techniques be applied in forensic speaker
                                                                                         comparison casework?
   10:25 Talk 19        Vincent van Heuven and Sandra Ferrari Disner                     What’s in a name? On the phonetics of trademark infringement
   10:50 Talk 20        Honglin Cao and Xiaolin Zhang                                    A Survey on Forensic Voice Comparison in Mainland China

   11:25                BREAK

   11:40 Talk 21        Alice Paver, David Wright and Natalie Braber                     Accent judgements for social traits and criminal behaviours: ratings and implications
   12:05 Talk 22        Kirsty McDougall, Nikolas Pautz, Harriet Smith, Katrin Müller-   An investigation of the effects of voice sample duration and number of foils on voice parade
                        Johnson, Alice Paver and Francis Nolan                           performance.
   12:30 Talk 23        Paula Rinke, Mathias Scharinger, Kjartan Beier, Ramona Kaul,     The effect of Angela Merkel on right temporal voice processing – an EEG study
                        Tatjana Schmidt and Gea de Jong-Lendle

   13:00                CONFERENCE FAREWELL
Proposing Problem-Based Learning to teach
                            forensic speech science

                                      Georgina Brown

         Department of Linguistics and English Language, Lancaster University, UK
                        Soundscape Voice Evidence, Lancaster, UK

                               g.brown5@lancaster.ac.uk

The recent revision of the International Association for Forensic Phonetics and Acoustics
Code of Practice in September 2020 explicitly recognises the importance of practitioner
training. Clause 2.2 has now been included to insist that:

       Members must be suitably qualified and experienced to carry out the specific type of
       casework they are undertaking. This may be achieved through a combination of
       experience, education and method-specific training.
Before the September 2020 revisions, the qualifications and training of forensic speech
analysts were not mentioned in IAFPA’s Code of Practice. The introduction of this clause
indirectly draws attention to forensic speech science teaching within higher education. This
paper considers ways that could potentially advance forensic speech science teaching in order
to optimise this route of training.

In the last 10-15 years, Masters programmes and dedicated undergraduate modules have
emerged in the UK that teach forensic speech science. These programmes are expected to
educate students in the practice of carrying out forensic speech analysis and associated issues
attached to this work. To their credit, existing forensic speech science programmes do not
claim to train students to a level where they are in a position to carry out real-life forensic
casework. Despite this, it has become the case that multiple graduates from these programmes
go on to fill discipline-specific roles in security organisations or for private providers of
forensic speech analysis. It is therefore surely in the community’s interests to review
educational approaches in order to capitalise on existing training opportunities. This paper
specifically proposes to further explore the potential of a Problem-Based Learning (PBL)
approach to forensic speech science teaching.

PBL is a student-centred learning approach that relies on a greater degree of student
independence to solve ill-structured problems. PBL-based courses invite students to tackle
problems without necessarily first introducing them to relevant subject content through more
traditional teaching styles beforehand. The problems in PBL therefore form the core of this
learning method, rather than reinforcing or accompanying teaching and learning via more
traditional modes. PBL has shown to be beneficial to disciplines that directly lead on to
discipline-specific professional roles, and has even become the standardised teaching
approach in some of those areas (medicine being the flagship example). PBL is claimed to
bring about a deeper understanding of a topic, longer retention of information, and positive
lifelong learning habits in individuals (Hung et. al., 2008). Given its reported success in other
disciplines, the question arises as to whether PBL could bring similar benefits to prospective
forensic speech practitioners, and to the field as a whole.
The current paper aims to address two key objectives. First, it seeks to further justify
exploring PBL as an approach in forensic speech science programmes. It then moves on to
apply previous problem-solving models to assist with its implementation within the forensic
speech science context.

References
Dolmans, D. and Gijbels, D. (2013). Research on Problem-Based Learning: Future Challenges.
   Medical Education. 47. 214-218.

Hung, W., Jonassen, D. and Liu, R. (2008). Problem-Based Learning. In J.M. Spector., J.G. van
   Merriënboer., M.D. Merrill., and M. Driscoll (Eds.). Handbook of research on educational
   communications and technology (3rd edition., pp 485-506). Mahwah, NJ: Erlbaum.

Spoofed Samples: another thing to listen out for?
            Georgina Brown1,2, Lois Fairclough1 and Christin Kirchhübel2
        1
         Department of Linguistics and English Language, Lancaster University, UK
                       2
                         Soundscape Voice Evidence, Lancaster, UK

   {g.brown5|l.fairclough}@lancaster.ac.uk, ck@soundscapevoice.com

“Spoofing” has been raised as a very real risk in the context of automatic speaker verification
systems (Evans et. al., 2013). In spoofing attacks, speech samples are submitted to a speaker
verification system with the intention of “tricking” the system into falsely accepting the
sample as belonging to a specific speaker. Understandably, spoofing attacks are a growing
concern among certain sectors in particular (such as the financial sector), where voice, as a
“biometric”, is increasingly being used as a mechanism to access accounts. There are four
key spoofing methods: 1) impersonation; 2) replay; 3) speech synthesis; 4) voice conversion
(Wu et. al., 2015a). Impersonation is perhaps the most intuitive, where it involves one human
modifying their own voice to sound more like the voice of the “target” speaker. Replay refers
to replaying a previously captured recording of the “target” speaker producing the specified
utterance (or “passphrase”) to a system. Speech synthesis refers to the technologies used to
produce synthetic speech that sounds like a “target” sample, while voice conversion refers to
technologies used to modify a speech sample to sound more like someone or something else
(i.e. the “target”).

Efforts to identify solutions to combat spoofing attacks have commenced within the speech
technology community. The creation of the ASVSpoof Challenge (Wu et. al., 2015b) has
enabled the international research community to pre-emptively innovate and advance
countermeasures. The ASVSpoof challenges have become a regular event, taking place
every two years. For these challenges, a team of researchers compile a database of thousands
of short speech samples, based on read sentences. These large datasets allow other researchers
to participate in the challenge where they can test their speaker verification systems on these
speech samples (to determine how much of a threat specific spoofing techniques are), as well
as to test new methods that aim to detect or counteract spoofing attacks. Another property of
the ASVSpoof datasets is that the spoofed samples are produced by a wide range of spoofing
techniques. In the 2015 challenge, the datasets contained spoofed samples produced by 10
different speech synthesis and voice conversion techniques, while this number increased to 17
for the 2019 challenge. Given the speed at which speech technologies are developing, it is
reassuring to know that anti-spoofing research is now taking place in parallel.

While the central focus of anti-spoofing countermeasures is very much on automatic speaker
verification systems, the current work starts to contemplate the potential of spoofed speech
samples occurring in forensic casework. Forensic speech practitioners already have to
occasionally contend with some form of “spoofing” in the form of voice disguise, but it seems
sensible to extend our knowledge to account for more technologically-derived forms. Rather
than assuming that spoofed speech samples would be detectable to an expert forensic
phonetician, the authors of this work have chosen to test this assertion. Taking the datasets
used to develop and evaluate anti-spoofing technologies, the current paper reports on how one
experienced forensic phonetician performed in a simple test that asked for spoofing
evaluations of 300 speech samples (some were spoofed samples, some were genuine human
speech samples). Within this set of 300 speech samples, there are 150 samples from the
ASVSpoof 2015 Challenge (Wu et. al., 2015b), and 150 from ASVSpoof 2019 Challenge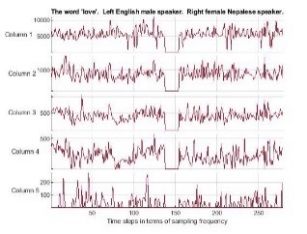
(Todisco et. al., 2019). This was in an effort to track any change in the quality (or risk) of
spoofing attacks over time. We also selected the spoofing techniques that were reported to be
particularly problematic for automatic technologies (Wu et. al., 2015b; Todisco et. al., 2019).
We included spoofed samples produced by the most challenging voice conversion technique
and the most challenging speech synthesis technique from each of the two ASVSpoof
Challenge datasets. Out of the selection of spoofing techniques that have been included in our
test set, the “most successful” one brought about Equal Error Rate of 57.73% from the
automatic speaker verification system used in Todisco et. al. (2019).

Not only do we report on the test results, but we also impart qualitative observations on
reflection of this test. We also propose it as a valuable training exercise for forensic speech
analysts, and offer the opportunity to others in the community to take the test.

References
Evans, N., Kinnunen, T. and Yamagishi, J. (2013). Spoofing and Countermeasures for Automatic
   Speaker Verification. Proceedings of Interspeech. Lyon, France. 925-929.

Todisco. M., Wang, X., Vestman, V., Sahidullah, M., Delgado, H., Nautsch, A., Yamagishi, J., Evans,
   N., Kinnunen, T. and Lee, K.A. (2019). ASVspoof 2019: Future Horizons in Spoofed and Fake
   Audio Detection. Proceedings of Interspeech. Graz, Austria. 1008-1012.

Wu, Zhizheng., Evans, N., Kinnunen, T., Yamagishi, J., Alegre, F. and Li, H. (2015a). Speech
   Communication. 66. 130-153.

Wu, Zhizhen, Kinnunen, T., Evans, N., Yamagishi, J., Hanilci, C., Sahidullah, M. and Sizov, A.
   (2015b). ASVspoof 2015: the First Automatic Speaker Verification Spoofing and Countermeasures
   Challenge. Proceedings of Interspeech. Dresden, Germany. 2037-2041.
Picking apart rhythm patterns in spontaneous speech using
                Recurrent Neural Networks
                         Luke Carroll1 and Georgina Brown1,2
   1Department   of Linguistics and English Language, Lancaster University, Lancaster, UK
                         2Soundscape Voice Evidence, Lancaster, UK

                     {l.a.carroll|g.brown5}@lancaster.ac.uk

Although it is suspected that the rhythm of speakers’ speech has something to offer forensic
speech analysis, it is not clear how it could be best integrated into these analyses. Previous
studies have looked into possible ways and variables to characterise individual speakers’
speech rhythm and their speaker discriminatory power. Leemann, Kolly and Dellwo (2014)
characterised speech rhythm using measures of relative syllable durations within utterances,
and He and Dellwo (2016) reported more promising speaker discrimination results by using
measures of relative intensity values of syllables within utterances. These initial studies
focussed on content-controlled read speech data, and it is an obvious next step to apply these
methods to spontaneous speech. The authors of the current work did exactly this and took 18
x 9-syllable utterances from 20 male speakers of the WYRED corpus (Gold et. al., 2018).
After transferring some of the rhythm measures from previous studies to spontaneous speech
data, it soon became apparent that the value of speech rhythm in speaker discrimination tasks
is somewhat limited. For each speaker, mean, peak and trough intensity measures, along with
duration measures, were taken for each of the 9-syllable utterances. A linear discriminant
analysis returned weak results with classification rates being just above chance level: mean =
7.2%; peak = 6.1%; trough = 7.5%; duration = 6.1%; chance level = 5%).

The reasons that these speech rhythm metrics do not transfer over well to the spontaneous
speech condition are perhaps obvious. They effectively involve making syllable-to-syllable
comparisons     across utterances (i.e. the first syllable’s relative duration measurement of
utterance X from speaker 1 is compared against the first syllable’s relative duration of
utterance X from speaker 2). While this is a good setup for read speech, it does not translate
so well to the spontaneous speech condition. The approach involves making comparisons
across syllables that are different with respect to their phonetic content, level of stress,
whole-utterance factors, etc.; all of which will contribute to the variables we are aiming to use
to capture speech rhythm. In essence, these rhythm measures are too sensitive to the variation
that content-mismatched (spontaneous) speech contains.

In an effort to gain more value from rhythm information in spontaneous speech, this study
explores another way of accessing this information: Recurrent Neural Networks (RNNs).
RNNs are advantageous when dealing with sequential (or time-dependent) data. It is proposed
here that we can use RNNs to start to better understand how speakers within a population can
vary in relation to aspects of their rhythm. We explore this by using the same dataset of
WYRED speakers and feeding the same measures of speech rhythm that were used in the
experiments described above into RNNs. In doing so, we can start to achieve two main
objectives:
    1) identify particularly “unusual” speakers within a speaker population with respect to
        their speech rhythm;
    2) move further towards a means of describing speakers’ unusual rhythm patterns.

To address 1), we use RNNs to see whether we can predict one sequence of values (e.g. an
utterance’s sequence of relative intensity values) from another sequence of values (e.g. that
same utterance’s sequence of relative syllable duration values). By training up a neural
network to make predictions based on these sequences, we can compare the “predicted”
sequence with the “true” sequence that we have measured for those utterances. This
comparison allows us to start to determine whether there are particularly “unpredictable
speakers”, as these speakers will yield the largest differences between their utterances’
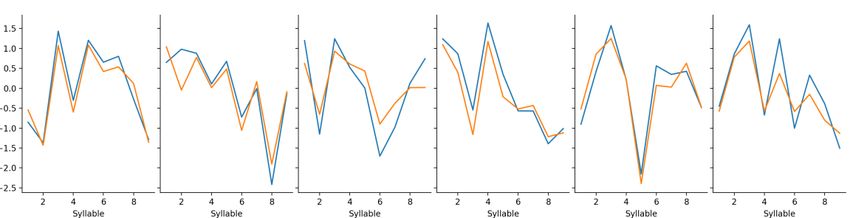
“predicted” sequences and “true” sequences. To illustrate, Figure 1 below displays a selection
of utterances from one of the more predictable speakers in this dataset, whereas Figure 2
shows a selection of “predicted” intensity sequences vs. “truth” intensity sequences for a
speaker that was ranked as particularly unpredictable.
Figure 1: “predicted” and “truth” intensity sequences for 6 utterances for a speaker that was ranked as being
particularly predictable by the neural network. (orange=predicted, blue=truth)
Figure 2: “predicted” and “truth” intensity sequences for 6 utterances for a speaker that was ranked as being
particularly unpredictable by the neural network. (orange=predicted, blue=truth)
To address objective 2), it is proposed here that these speaker rankings and accompanying
visualisations can assist us in better understanding unusual speech rhythm patterns. Figure 2
displays a speaker’s utterances containing a number of particularly dramatic drops in intensity
and qualitative perceptual judgement reinforces this. This work therefore also includes
discussion around how we can use Recurrent Neural Networks to assist us in finding a
reference point and terminology to describe non-neutral speech rhythm patterns.
References
Gold, E., Ross. S., and Earnshaw, K. (2018) The ‘West Yorkshire Regional English Database’:
Investigations into the generalizability of reference populations for forensic speaker comparison
casework. In Proceedings of Interspeech 2018: September 2-6 2018, Hyderabad (pp. 2748-2752).
He, L. and Dellwo, V. (2016). The role of syllable intensity in between-speaker rhythmic variability.
International Journal of Speech, Language and the Law, 23(2)., 243–273.
Leemann, A., Kolly, M.-J. and Dellwo, V. (2014). Speech-individuality in suprasegmental temporal
features: implications for forensic voice comparison. Forensic Science International 238: 59–67.
Otzi++: an integrated tool for forensics transcriptions
Sonia Cenceschi, Francesco Roberto Dani, Alessandro Trivilini
Digital forensic Service, Department of Innovative Technologies, University of Applied Sciences and Arts of
Southern Switzerland
{sonia.cenceschi|francesco.dani|alessandro.trivilini}@supsi.ch
Otzi++ is an accessible tool for forensic transcriptions, specifically designed for Law Enforcement Agencies
officers and professionals dealing with human voice recordings in preliminary investigations, and designed
primarily for the Italian Switzerland and Italian forensic contexts. It is an integrated and scalable tool
implemented in Python, gathering several speech processing functions indispensable for speeding up the
transcription process and creating a clear transcription. It allows the officer to easily write directly under the
audio exploiting tagging boxes (text cues), adding a line for each speaker present in the recording. Each speaker
can be renamed and each text-cue can be filled with the transcription, the translation, personal comments (e.g.
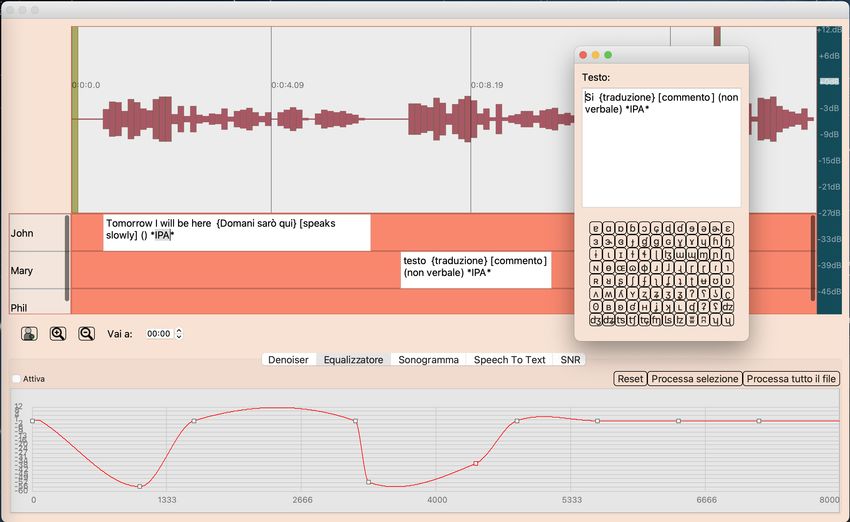
“overlapping voices”), and notes related to paralinguistic clues (e.g. emotions) as shown in Figure 1. Contents
are automatically exported in pdf format as shown in Fig. 2. An extended Otzi++ version (dedicated to
preliminary linguistic analysis) allows to export formants’ values of tagged vowels even for multiple speakers, in
csv and xlsx files already structured for statistics and VisibleVowels (Heeringa & Van de Velde, 2017).
Figure 1 An example from Otzi++ in equalization modality and open text-cue.
Figure 2 An example of the transcription in pdf format automatically generated by Otzi++ starting from the
project file developed in Figure 1.
The tool allows to insert IPA symbols, or automatically detect “omissis” (words or phrases deemed as
unnecessary for the purposes of the investigation). It also comprises a speech to text (STT) undergoing
improvement (Italian high quality audio only), SNR, gain, equalizer, denoiser, spectrogram visualization,
gender and noise detection, and a user manual with guidelines and best practices. Finally, Otzi++ allows to save
the project in its own format (*.Oz) and create a database (based on MySQL) to explore the data afterwards,
researching, for example, projects containing specific names, or related to a Judge, date, or number of
investigation process.
Timeline, pdf export process, spectrograms, and SNR, have been developed from scratch. The gender/noisedetection exploits the inaSpeechSegmenter open-source framework (Doukhan et al., 2018), the equalizer
exploits the Yodel package1, while denoiser and STT integrate Noisereduce2 and DeepSpeech (by Mozilla)3. We
are currently finalizing a first Otzi++ prototype based on the feedback by our Italian and Switzerland LEAs
partners. The next step will be the development of new features such as the discrimination of the number of
speakers, additional languages for the STT, and the import of proprietary audio formats.
Forensic transcriptions in Italian-speaking contexts
The Switzerland and Italian security field lacks of standardised methodologies and specialised professionals
(Cenceschi et al., 2019; Fraser, 2018). Moreover, the new Italian reform on the subject of interceptions (law
conversion of the decree n.161/2019) still ignores the scientific skills and knowledge needed to transcribe audio
content4. As a consequence, speech recordings often end up being misused as evidence or not used at all, and
often contain substantial errors (Fraser, 2003). These inefficiencies result in the delay of investigations and
judicial proceedings, the reduction of citizen safety, and skyrocketing private and government expenditures.
Otzi++ goes in the direction of a more aware transcription, which facilitates the dissemination of scientific
practices and psychoacoustic bases. Obviously, it does not replace the audio forensic expert, but it aims to
improve the current approach by raising awareness among judges and law enforcement agencies on the issue of
competences. Table 1 compares Otzi++ with some software solutions available and used on the Italian-related
market, highlighting the lack of accessible, low-cost, transcription-focused tools.
Table 1 Marketed audio forensic software.
Speaker Semi-automatic Phone calls Fitting on Used in
Name ASR Accessible
profiling transcriptions monitoring Italian context
OTZI++ x x Not yet! Yes
SIIP x x x No
IKAR Lab x x No
Voice x x x x No
Biometrics
Idem x x x No
Smart x x x No
VoiceGrid x Yes
MCR (& x x Yes
similar)
Acknowledgment
Otzi++ is founded by the Swiss National Science Foundation (SNFS) through the Bridge Proof of Concept
program (grant 40B1-0_191458/1) and is supported by InTheCyber SA.
References
Cenceschi, S., Trivilini, A., & Denicolà, S. (2019). The scientific disclosure of speech analysis in audio
forensics: remarks from a practical application. In XV AISV Conference.
Doukhan, D., Carrive, J., Vallet, F., Larcher, A., & Meignier, S. (2018). An open-source speaker
gender detection framework for monitoring gender equality. In 2018 IEEE International Conference
on Acoustics, Speech and Signal Processing (ICASSP) (pp. 5214-5218). IEEE.
Fraser, H. (2003). Issues in transcription: factors affecting the reliability of transcripts as evidence in
legal cases. Forensic Linguistics, 10, 203-226.
Fraser, H. (2018) Real forensic experts should pay more attention to the dangers posed by ‘ad hoc
experts’, Australian Journal for Forensic Sciences, 50.2, 125-128.
Heeringa, W., & Van de Velde, H. (2017, August). Visible Vowels: A Tool for the Visualization of Vowel
Variation. In INTERSPEECH (pp. 4034-4035).
Meluzzi, C., Cenceschi, S., & Trivillini, A. (2020). Data in Forensic Phonetics from theory to
practice. TEANGA, the Journal of the Irish Association for Applied Linguistics, 27, 65-78.
1
https://pypi.org/project/yodel/
2
https://pypi.org/project/noisereduce/
3
https://github.com/mozilla/DeepSpeech
4
Benevieri, J. (2020), La riforma sulle intercettazioni e il linguaggio in esilio:
https://giustiziaparole.com/2020/03/02/la-riforma-sulle-intercettazioni-e-il-linguaggio-in-esilio/.Within-speaker consistency of filled pauses over time in
the L1 and L2
Meike de Boer1, Hugo Quené2, and Willemijn Heeren1
1
Leiden University Centre for Linguistics, Leiden University, The Netherlands
{m.m.de.boer|w.f.l.heeren}@hum.leidenuniv.nl
2
Utrecht Institute of Linguistics OTS, Utrecht University, The Netherlands.
h.quene@uu.nl
Although the filled pauses uh and um have been shown repeatedly to be highly speaker-
specific (e.g. Hughes et al., 2016), research on their within-speaker consistency across non-
contemporaneous sessions seems limited. Therefore, this study investigates filled pause
realization of a group of speakers in their L1 Dutch and L2 English, at two moments in time.
The speakers were recorded at the start and end of their bachelors at an English-speaking
liberal arts and science college in The Netherlands (see Orr & Quené, 2017). Prior studies on
the same group of speakers showed convergence in the realization of [s] (Quené, Orr & Van
Leeuwen, 2017) and in speech rhythm (Quené & Orr, 2014) in the lingua franca English.
Against this background, we investigated whether a supposedly consistent feature such as
filled pauses may converge as well, or whether it remains stable.
Since the speakers are immersed in an English-speaking environment where
convergence seems to be taking place, we expect changes over time to be most likely in
English, the speakers’ L2. In addition, prior studies have shown that filled pause realizations
tend to be language-specific for multilingual individuals, especially for more advanced
speakers (e.g. De Boer & Heeren, 2020; Rose 2017). This would suggest a larger difference
between a speaker’s filled pauses in the L1 and L2 after three years, and a different realization
in the L2 across recordings.
Methods
The speaker set consists of 25 female students from University College Utrecht (UCU), The
Netherlands (see Orr & Quené, 2017). They all had Dutch as their L1 and were selected for
UCU based in part on their above-average L2 English proficiency. During the first recording,
made within one month after arrival at UCU, the mean age of the speakers was 18.4 years.
After nearly three years, at the end of their studies, the same students were recorded again.
The filled pauses uh and um were extracted from semi-spontaneous informal
monologues of two minutes per language (n = 1,656; see also table 1). Filled pauses were
hand-segmented in Praat (Boersma & Weenink, 2016) and measured on F1, F2, F3, and F0.
Bayesian linear mixed-effect models were built with the brms package in R (Bürkner, 2018; R
Core Team, 2020) to assess the fixed factors Language, Time, and their interaction.
Table 1. Overview of the number of uh (left) and um tokens (right) per condition.
Year 1 Year 3 Total Year 1 Year 3 Total
Dutch 320 260 580 Dutch 161 156 317
English 212 156 368 English 212 179 391
Total 532 416 948 Total 373 335 708
Results
Results showed that the F0, F2, and F3 of the speakers’ filled pauses did not seem to have
changed after three years of being immersed in an English-speaking environment, neither in
the L1 nor in the L2 (see Table 2). The F1 of English filled pauses, which was somewhat
higher than in Dutch during the first recording, shifted somewhat further away from the L1
realization over time. The Bayes factors of the fixed factors including Time were all in favorof the null hypothesis (i.e. 1000 >1000 >1000 0.046 >1000 >1000 >1000
Year 3 - - - - - - - -
0.193 0.022 0.015 0.024 0.036 0.029 0.017 0.030
LanguageEnglish - 0.2 (0.1) −0.1 (0.1) - - 0.2 (0.1) - -
0.148 0.326 0.200 0.012 0.031 2.999 0.028 0.081
Year 3:LangEng - 0.2 (0.1) - - - - - -
0.249 0.173 0.023 0.031 0.054 0.019 0.052 0.105
Conclusion
Apart from a very small language effect, spectral characteristics of filled pauses seem
remarkably stable across the speakers’ languages Dutch and English, and across time. The
absence of an effect of Time in the L1 confirms the idea that the within-speaker consistency
of filled pauses in L1 is high, even in non-contemporaneous sessions recorded almost three
years apart. Even in the L2, where these speakers have converged towards a shared English
accent on [s] and in rhythm (Quené & Orr, 2014; Quené, Orr & Van Leeuwen, 2017), filled
pauses remained fairly stable. These findings are promising for forensic speaker comparisons,
where non-contemporaneous recordings are inherent. A question that remains is how stable
filled pauses are across different speech styles.
References
Boersma, P., and Weenink, D. (2016). Praat: Doing phonetics by computer [computer program],
http://www.praat.org/.
Boer, M. M. de, and Heeren, W. F. (2020). Cross-linguistic filled pause realization: The acoustics of uh
and um in native Dutch and non-native English. J. Acoust. Soc. Am., 148, 3612-3622.
Bürkner, P. C. (2018). Advanced Bayesian Multilevel Modeling with the R Package brms. The R
Journal, 10, 395-411. doi:10.32614/RJ-2018-017
Hughes, V., Wood, S., and Foulkes, P. (2016). Strength of forensic voice comparison evidence from
the acoustics of filled pauses. Intern. J. Speech, Lang. and Law, 23, 99-132.
Orr, R., and Quené, H. (2017). D-LUCEA: Curation of the UCU Accent Project data, in J. Odijk and A.
van Hessen (Eds.) CLARIN in the Low Countries, Berkeley: Ubiquity Press, pp. 177–190.
Quené, H., and Orr, R. (2014). Long-term convergence of speech rhythm in L1 and L2 English. Social
and Ling. Speech Prosody, 7, 342-345.
Quené, H., Orr, R., and Leeuwen, D. van (2017). Phonetic similarity of /s/ in native and second
language: Individual differences in learning curves, J. Acoust. Soc. of Am., 142, EL519–EL524.
R Core Team (2020). R: A language and environment for statistical computing. R Foundation for
Statistical Computing, Vienna, Austria. https://www.R-project.org/.
Rose, R. L. (2017). A comparison of form and temporal characteristics of filled pauses in L1 Japanese
and L2 English, J. Phonetic Soc. Jpn., 21, 33–40.A new method of determining formants of female speakers
Grandon Goertz1 and Terese Anderson2 and
1,2University of New Mexico, Albuquerque, New Mexico
1
sordfish@unm.edu
Prefer a talk
Acoustic evaluations of the formants of higher pitched female and children voices are subject to
inconsistencies making the analyses of speech difficult. Our research was motivated by the observation
that formant values vary and change according to the selection of the frequency range and number of
formants. The problem of formant accuracy has been discussed by numerous authors including Burris
et al. (2013). In their analysis of four acoustic analysis software packages (AASPs). Burris et al. found
that “Results varied by vowel for women and children, with some serious errors. Bandwidth
measurements by AASPs were highly inaccurate as compared with manual measurements and published
data on formant bandwidths.” Formants are created as a physical property of sound and should not
change when the scale of examination changes.
Investigation
The algorithms that computer programs use to create formants were evaluated to determine the source
of formant variances. Fast Fourier Transforms (Monsen and Engebretson, 1983) are used for mapping
the speech sound into the numerical frequency space, but at the cost of the time dimension and presents
much of the data in imaginary numerical values. The numbers are binned and formants are estimated
based on the anticipated number of formants. Probabilistic routines and Linear Predictive Coding are
used to plot non-linear data onto the spectrogram. Changing the output parameters of frequency and
anticipated number of formants changes the formant values significantly and causes variation in plots
(see Figure 1). The assignment of bands for the pitch range is more suited to lower pitches of men, and
consequently more formant variance is seen for women’s speech.
Results
We used a frequency mapping program that employs the Chebyshev transform (Boyd 2001; Ernawan et
al. 2011; Gold and Morgan 2000; Trefethen 2000) and which allowed for all data points to be analyzed,
and the exact time to be plotted. In addition, the formant regions were clearly presented, and do not need
to be estimated. Formant bands do not move, and they do not cross each other.
Speech samples from female speakers (British English, Japanese, Hmong, Cantonese, American
English), were evaluated and in all cases, clear formant regions were seen. This can be seen in the
example of Figure 2 which shows formant banding at the frequency regions shown on the y-scale. In
these plots, the locations of the frequency bands are determined by the physical properties of the sound.
Using this new technology, we avoid the problems of the moving formant values in formant depictions.
The reliability of formants for female speakers is improved because the formant values are measured
and not estimated.Figure 1 Settings vary F2 (left) and F3 (right) values, Japanese female speaker, saying /mi/.
Figure 2 Left: formant band values for female speakers using a Chebyshev analysis. Right: a plot
using lines instead of dots. Male English speaker on left and a female Nepalese speaker on the right
half of the plot both saying ‘love’.
References
Boyd, John. (2001). Chebyshev and Fourier Spectral Methods. Mineola, NY: Dover Publications, Inc.
Burris, Carolyn, Houri K. Vorperian, Marios Fourakis, Ray D. Kent and Daniel M. Bolt. (2014). Qualitative and
descriptive comparison of four acoustic analysis systems: Vowel measurements. Journal of Speech,
Language and Hearing Research. 57:1.
Ernawan, Ferda, Nur Azman Abu, and Nanna Suryana. (2011) Spectrum Analysis of Speech Recognition Via
Discrete Tchebichef Transform. Proceedings of SPIE v. 8285. International Conference on Graphic and
Image Processing, Yi Xie, Yanjun Zheng (eds.)
Gold, Ben and Nelson Morgan. (2000). Signal Processing and Perception of Speech and Music. NY: John Wiley
& Sons.
Monsen, Randall and A. Maynard Engebretson. (1983). The Accuracy of Formant Frequency Measurements: A
comparison of Spectrographic Analysis and Linear Prediction. The Journal of Speech and Hearing
Research, 26 (March), 89-97.
Quantitative and Descriptive Comparison of Four Acoustic Analysis Systems: Vowel Measurements. Journal of
Speech, Language, and Hearing Research. 57: 1, pp. 26-45.
Trefethen, L. (2000). Spectral Methods in MATLAB, SIAM.Regional Variation in British English Voice Quality
Erica Gold1, Christin Kirchhübel2, Katherine Earnshaw1,3, and Sula Ross1,4
1
Linguistics and Modern Languages, University of Huddersfield, Huddersfield, UK
{e.gold|k.earnshaw|sula.ross2}@hud.ac.uk
2
Soundscape Voice Evidence, Lancaster, UK
ck@soundscapevoice.com
3
J P French Associates, York, UK
katherine.earnshaw@jpfrench.com
4
Department of Linguistics and English Language, Lancaster University, Lancaster, UK
s.ross4@lancaster.ac.uk
Voice quality (VQ) is a useful parameter for discriminating between speakers for the purposes
of forensic speaker comparison (FSC) casework (Gold and French 2011). This is because VQ
is generally considered to be speaker specific. There has been a growing body of VQ
literature within the forensic phonetics community; however, the focus of these studies so far
has been on methodological developments rather than on exploring variationist topics. When
surveying the few studies that have focussed on variation in British English VQ, there is
evidence to suggest that VQ is, in part, affected by social and regional background. This study
considers voice quality in two varieties of British English – Southern Standard British English
and West Yorkshire English – offering insights into VQ variation within and across regionally
homogenous groups of speakers.
Methodology
The data analysed comes from the studio quality version of Task 2 in both the West Yorkshire
Regional English Database (WYRED; Gold et al., 2018) and the Dynamic Variability in
Speech database (DyViS; Nolan et al., 2009). Task 2 consists of each participant speaking to a
fictional accomplice (one of the research assistants) about the mock police interview they had
just completed relating to a crime that they were alleged to be involved in. Our analyses are
based on 80 speakers in total: 60 speakers selected from WYRED (20 from Bradford, 20 from
Kirklees, and 20 from Wakefield) and 20 speakers selected from DyViS.
The voice quality analysis carried out in this study follows closely the methodology employed
by San Segundo et al. (2019). Specifically, this involved an auditory assessment of voice
quality using the Vocal Profile Analysis (VPA) scheme (Beck 2007). Although all voices
were initially rated by each of the four authors individually, the final VPA ratings are best
described as group ratings rather than individual ratings. Two calibration sessions were used
in arriving at the final VPA ratings. These sessions allowed the authors to check that there
was consistency in their understanding of the individual settings. It also allowed the authors to
calibrate their understanding of the scalar degrees. Results were examined in terms of a) the
proportion of speakers that had a given voice quality setting present taking into account the
scalar degrees (i.e. slight, marked, extreme), and b) the proportion of speakers that displayed a
given voice quality setting on a presence/absence basis without differentiating between the
scalar degrees.
Results
Our observations do not contradict the small subset of previous research which exploredregional and/or social variation in voice quality in British English insofar as ‘regionality’ may play a small role in a speaker’s voice quality profile. However, factors such as social standing and identity are also relevant. Even when considering homogeneous groups of speakers, it is not the case that there is a cohesive voice quality profile that can be attached to every speaker within the group. The reason for this is likely to be the degree of speaker-specificity inherent in voice quality. References Beck, J. (2007). Vocal profile analysis scheme: A user’s manual. Edinburgh: Queen Margaret University College – QMUC, Speech Science Research Centre. Gold, E. and French, P. (2011). International practices in forensic speaker comparison. International Journal of Speech, Language, and the Law, 18(2): 293-307. Gold, E., Ross, S., and Earnshaw, K. (2018). The ‘West Yorkshire Regional English Database’: investigations into the generalizability of reference populations for forensic speaker comparison casework. Proceedings of Interspeech. Hyderabad, India, 2748-2752. Nolan, F., McDougall, K., de Jong, G., and Hudson, T. (2009). The DyViS database: style-controlled recordings of 100 homogeneous speakers for forensic phonetic research. International Journal of Speech, Language, and the Law, 16(1): 31-57. San Segundo, E., Foulkes, P., French, P., Harrison, P., Hughes, V., and Kavanagh, C. (2019). The use of the Vocal Profile Analysis for speaker characterization: methodological proposals. Journal of the International Phonetic Association, 49(3): 353-380.
A transcription enhancement tool for speech research from
               automatic closed-caption data
                                      Simon Gonzalez
                              The Australian National University
                              simon.gonzalez@anu.edu.au

                   No preference, either a talk or a poster.

Acoustic research of spontaneous speech has experienced an accelerated growth. This growth
has also required tools that can cope with the amount of data needed to be processed and
prepared for analysis. Currently, force-alignment has breached the gap and has allowed
research to process massive amount of data for phonetic analysis. However, the transcription
stage of the data, from the audio files to the test, is still a stage where speech researchers
spend an important amount of time.

The development of closed-caption algorithms has offered a solution for the transcription
process to be sped up. This does not come without some hurdles and ethical aspects when
dealing with sensitive data. However, when a research data is used from publically available
data from the YouTube platform, the close-caption capability can be used for speech research.

YouTube closed captions can be enabled from the owners of the videos. These automatic
captions are generated by the implementation of machine learning algorithms. The results are
not perfect, and the accuracy is affected by speech discontinuities like mispronunciations,
accents, dialects, or background noise. The outputs are text overlays on the videos, but they
can be downloaded using specific algorithms (cf. Lay & Strike, 2020).

These captions are produced at specific intervals, regardless of the number of speakers. This
is, the closed captions of the speech of two speakers are not separated in the transcription. In
other words, the captions are linear in terms of time irrespective of the number of speakers.

Therefore, due to the limitations and challenges of the automatic closed-captions, here we
propose an app that facilitates the correction of automatic closed captions. By so doing, we
maximise the output from YouTube videos and create a workflow that bridges automatic texts
and the desired shape on the transcription.

General processing
The time-stamped output as a text file from YouTube is converted to a Praat (Boersma &
Weenink, 2021) TextGrid file. Since the data extracted were TV interviews, for each file there
were at least two speakers. For each TextGrid, the transcriptions are split into the number of
speakers in the original video.

This TextGrid file is then used to do the acoustic segmentation of the audio files. The final
pre-processing stage then combines the original audio file and the transcription file. This
output is then used in the app. The app was deployed in shiny R Studio (R Core Team, 2016).
Figure 1 Screenshot of the App with all its available fields and functionality. Since the app was created for Spanish speaking transcribers, the instructions are in Spanish. References Lay, M. and Strike, N. (2020). YouTube Closed Captions, GITHUB repository, https://github.com/mkly/youtube-closed-captions Boersma, P. & Weenink, D. (2021). Praat: doing phonetics by computer [Computer program]. Version 6.1.42, retrieved 15 April 2021 from http://www.praat.org/ R Core Team. (2016). R: A Language and Environment for Statistical Computing. Vienna, Austria. Retrieved from https://www.R-project.org/
Test speaker sample size: speaker modelling for acoustic-
            phonetic features in conversational speech
                                           Willemijn Heeren
             Leiden University Centre for Linguistics, Leiden University, The Netherlands
                                w.f.l.heeren@hum.leidenuniv.nl

Speech samples offered for forensic speaker comparisons may be short. A relevant question then is
whether the sample will hold a sufficient number of tokens of the acoustic-phonetic features of interest
so that the features’ strength of evidence may be estimated reliably. The current study contributes to
answering this question by investigating the effects of test speaker sample size on speaker modelling
and on LR system performance.

To calculate a feature’s strength of evidence, an algorithm is used that models within-speaker variance
using a normal distribution, whereas between-speaker variance is estimated using multivariate kernel
density (Aitken and Lucy, 2004). Also, in an LR system, a development set, a reference set and a test
set of speakers are used to first compute calibration parameters from the development and reference sets,
and then evaluate feature and system performance on the test set. The by-speaker sample sizes of these
different data sets affect system performance. Kinoshita & Ishihara (2012) investigated Japanese [e:],
represented as MFCCs, and reported sample size effects for both test and reference data, with samples
varying from 2 to 10 tokens per speaker. The effect seemed stronger in the test than the background set.
A later study using Monte Carlo simulations (Ishihara, 2013) reported that system validity improved
with sample size. Hughes (2014) investigated the number of tokens per reference speaker using between
2 and 10 (for /aɪ/) or 13 (for /uː/) tokens. Results showed that relatively stable system behavior was found
from 6 tokens on. The author furthermore remarks that: “…considerably more than 13 tokens may be
required to precisely model within-speaker variation, at least for these variables” (Hughes, 2014, p.
213). This remark is especially relevant for test speaker modelling.

In the current study, the earlier work on test speaker sample size was extended by including larger
numbers of naturally produced tokens, and by including various speech sounds’ acoustic-phonetic
features. The goal was to assess at which sample sizes (i.e. numbers of tokens included) test speaker
behavior is modelled reliably and LR system output is valid. It is expected that larger sample sizes are
needed in cases of more variability; this is predicted for segments that are more strongly affected by co-
articulation and for features that are less stable within a speech sound or across instances of a sound.

Method
Using spontaneous telephone conversations from the Spoken Dutch Corpus (Oostdijk, 2000), tokens of
[a:], [e:], [n] and [s] were manually segmented from 63 ([a:, e:]), 57 ([n]), or 55 ([s]) male adult speakers
of Standard Dutch (aged 18-50 years). Per speech sound and speaker, median numbers of 40-60 tokens
of each speech sound were available, with minimum numbers at 30-32. For each of the speech sounds,
and for multiple acoustic-phonetic features per sound, test speaker sample size was assessed in two ways.

First, the stabilization of each feature’s mean and standard deviation by sample size was examined. Up
to 10 tokens, sample sizes were increased by 2, and from 10 on in steps of 5 tokens. Tokens were always
sampled in sequence, thus simulating shorter versus longer recordings. Second, same-speaker and
different-speaker LRs (LRss, LRds) as well as LR system performance were computed as a function of
sample size. For the vowels, the available speakers were distributed over the development, reference and
test sets. For the consonants, LRs were determined using a leave-one-out method for score computation
and for calibration. A MATLAB implementation (Morrison, 2009) of the Aitken & Lucy (2004) algorithm
was used for the computation of calibrated LRs. Sample size was varied for the test set only, increasing
the number of tokens from 2 to 20, in steps of 2. If data allowed, multiple repetitions of the same token
set size were included. For within-speaker comparisons, first versus second halves of the speaker data
were used. System performance was evaluated the R package sretools (Van Leeuwen, 2008).
Example results
Various acoustic-phonetic features and feature combinations were assessed, in the above-mentioned
ways, from [a:, e:, n, s]. As an example, Figure 1 gives results for [a:]’s second formant (F2). Estimates
of the mean and standard deviation seem to stabilize from 10-20 tokens on. LLRss and LLRds show
increasing separation with sample size, with mean LLRds falling below zero from 10 test speaker tokens
on. Validity slowly improves with sample size for [a:]’s F2.
Figure 1 Left: Error bar plot showing stabilization of F2 mean and standard deviation by sample size
(bar shows ± 1 SD). The minimum and median numbers of tokens by speaker in the dataset are indicated.
Right: Line plot showing means of log-LRss, log-LRds, cllr, cllrmin and EER (as a proportion), by sample
size. Note that the vertical axis represents different measurement units that use a similar scale.
Acknowledgement: This work is being supported by an NWO VIDI grant (276-75-010).
References
Aitken, C. G. G. and D. Lucy. (2004) Evaluation of trace evidence in the form of multivariate data. Applied
Statistics, 53:4, 109–122.
Hughes, V. S. (2014) The definition of the relevant population and the collection of data for likelihood ratio-
based forensic voice comparison. University of York: PhD dissertation.
Ishihara, S. (2013) The Effect of the Within-speaker Sample Size on the Performance of Likelihood Ratio Based
Forensic Voice Comparison: Monte Carlo Simulations. In Proceedings of Australasian Language
Technology Association Workshop, 25–33.
Kinoshita, Y. and S. Ishihara. (2012) The effect of sample size on the performance of likelihood ratio based
forensic voice comparison. In Proceedings of the 14th Australasian International Conference on Speech
Science and Technology (Vol. 3, No. 6).
Morrison, G. S. (2009) “train_llr_fusion_robust.m”, https://geoffmorrison.net/#TrainFus (Last viewed 28-11-
2019).
Oostdijk, N. H. J. (2000) Het Corpus Gesproken Nederlands [The Spoken Dutch corpus]. Nederlandse
Taalkunde, 5, 280–284.
Van Leeuwen, D. A. (2008) SRE-tools, a software package for calculating performance metrics for NIST
speaker recognition evaluations. http://sretools.googlepages.com (Last viewed 2-3-2020).The Use of Nasals in Automatic Speaker Recognition
Elliot J. Holmes (ejh621@york.ac.uk)
Machine learning algorithms are regularly employed for the task of automatic speaker recognition.
They are undeniably powerful; a recent system developed by Mokgonyane et al. (2019) that employs
such algorithms holds a very high accuracy rate of 96.03%. Problematically, however, these
algorithms are uninterpretable: as Rudin (2019) writes, they are ‘black boxes’ that their creators
cannot understand and, when they fail, their errors are not identifiable. In light of this issue, there
has been a push to incorporate phonetic theory into automatic speaker recognition. Phonetics,
historically concerned with analysing the features of one’s voice, has been consulted to create new
approaches to automatic speaker recognition that can be incorporated alongside current machine
learning algorithm approaches with great success (Teixeira et al., 2013; Hughes et al., 2019). These
approaches, crucially, are interpretable.
To continue exploring new ways of incorporating phonetic theory to improve automatic speaker
recognition, Holmes (2021) developed a novel methodology that can identify what phonetic features
are best for recognising speakers in their production of specific phonemes. Such features and
phonemes can then be reliably incorporated into current automatic speaker recognition systems as
interpretable approaches that can complement current ‘black box’ approaches. Holmes’ (2021)
methodology first involves the selection of a database, which here will be Nolan et al.’s (2009) DyVis
database of 100 males aged between 18-25 who speak Southern Standard British English. The
speech data is then automatically segmented into phonemes using McAuliffe et al.’s (2017)
Montreal Forced Aligner, a reliable tool for phoneme segmentation (Bailey, 2016). Following this,
one then uses Praat to analyse selected phonetic features automatically on all target phonemes.
Finally, one uses Bayesian pairwise comparisons to compare every possible pair of speakers using
the measurements of these phonetic features that were taken from every target phoneme. These
tests identify which features and phonemes distinguish speakers most frequently with decisive
statistical evidence. To exemplify how this methodology is used, Holmes’ (2021) original study
employed this methodology on data from Nolan et al.’s (2009) DyVis database to find that Formants
3 and 4 were best for distinguishing one speaker from another in their productions of /a/.
Holmes (2021) investigated a vowel because they have historically been given the most coverage as
phonemes for speaker recognition (Paliwal, 1984). However, nasals have also proven useful in
speaker recognition, though they are far less frequently studied. Using 12th-order cepstral features,
Eatock and Mason (1994) found that English nasals outperformed vowels with an average Equal
Error Rate (EER) of 18.8% compared to the average EER of vowels which was 21.1%. Of these nasals,
/ŋ/ performed best with an EER of 19.7%. /n/ had an EER of 23% and /m/ had an EER of 23.2%. All of
these nasals out-performed /a/ in the study, which achieved a much higher EER of 29%. More
recently, Alsulaiman et al. (2017) looked at the effectiveness of Arabic phonemes in speaker
recognition. Using Multi-Directional Local Features with Moving Averages (MDLF-MAs), they found
that /n/ scored a high Recognition Rate (RR) of 88% whilst /m/ scored 82%. For comparison, /a/
scored an RR between them of 84%.
Previous research therefore indicates that nasals can outperform vowels; thus, the analysis of nasals
may provide a novel, phonetically-informed approach to automatic speaker recognition. The current
study tests this theory using Holmes’ (2021) methodology and Nolan et al.’s (2009) data so that
Holmes’ (2021) previous results for the vowel /a/ can be compared to new results for the nasals /ŋ/,/n/, and /m/. Results show that all nasals outperformed /a/ as they did in Eatock and Mason’s (1994) study: 1072 of the pairwise comparisons conducted between tokens of /ŋ/ provided decisive evidence for distinguishing speakers, 894 did for tokens of /n/, 596 did for tokens of /m/, but only 564 did for /a/. This differs from the rank order seen in Alsulaiman et al.’s (2017) Arabic study; thus, language-specific variation may be present as nasals appear to perform differently in Arabic and English. Overall, this study shows that nasals do have discriminatory power and that they could be incorporated into automatic speaker recognition methods as an interpretable, phonetically- informed approach to Automatic Speaker Recognition. More broadly, this study also demonstrates the usefulness of Holmes’ (2021) methodology for identifying interpretable phonetic approaches to incorporate into automatic speaker recognition as well as the broad usefulness of phonetic theory overall in automatic speaker recognition. Reference List Alsulaiman, M., Mahmood, A., and Muhammad, G. (2017). Speaker recognition base on Arabic phonemes. Speech Communication, 86(1). https://www.sciencedirect.com/science/. Eatock, J. P. and Mason J. S. (1994). A quantitative assessment of the relative speaker discriminating properties of phonemes. [Conference Paper]. Adelaide, Australia. https://ieeexplore.ieee.org/. Holmes, E. J. (2021, February 4-5). Using Phonetic Theory to Improve Automatic Speaker Recognition. [Conference Presentation]. AISV, Zurich. https://elliotjholmes.wordpress.com/. Hughes, V., Cardoso, A., Harrison, P., Foulkes, P., French, P., and Gully, A. J. (2019). Forensic voice comparison using long-term acoustic measures of voice quality. [Paper]. International Conference of Phonetic Sciences, Melbourne, Australia. https://vincehughes.files.wordpress.com/. MacKenzie, L. and Turton, D. (2020). Assessing the accuracy of existing forced alignment software on varieties of British English. Linguistics Vanguard, 6(1). https://www.degruyter.com/. McAuliffe, M., Socolof, M., Mihuc, S., Wagner, M., & Sonderegger, M. (2017). Montreal Forced Aligner (Version 0.9.0) [Computer Software]. Retrieved 7 December 2020 from http://montrealcorpustools.github.io/. Mokgonyane, T. B., Sefara, T. J., Modipa, T. I., Mogale, M. M., Manamela, M. J., and Manamela, P. J. (2019). Automatic Speaker Recognition System based on Machine Learning Algorithms. [Paper]. 2019 Southern African Universities Power Engineering Conference/Robotics and Mechatronics/Pattern Recognition Association of South Africa, Bloemfontein, South Africa. https://ieeexplore.ieee.org/. Nolan, F., McDougall, K., de Jong, G., and Hudson, T. (2009). The DyViS database: Style-controlled recordings of 100 homogeneous speakers for forensic phonetic research. Forensic Linguistics, 16(1). https://www.researchgate.net/. Paliwal, K. K. (1984). Effectiveness of different vowel sounds in automatic speaker identification. Journal of Phonetics, 12(1), 17-21. https://www.sciencedirect.com/. Rudin, C. (2019). Stop explaining black box machine learning models for high stakes decisions and use interpretable models instead. Nature machine intelligence, 1, 206-215. https://www.nature.com/. Teixeira, J. P., Oliveira, C., Lopes, C. (2013). Vocal Acoustic Analysis – Jitter, Shimmer, and HNR Parameters. Procedia Technology, 9(1), 1112-1122. https://www.sciencedirect.com/.
You can also read