Public policies for rural development - and combating poverty in rural areas - IFAD Strategy for Brazil 2016-2021 and Series of Studies on Rural ...
←
→
Page content transcription
If your browser does not render page correctly, please read the page content below
Public policies for rural development
and combating poverty in rural areas
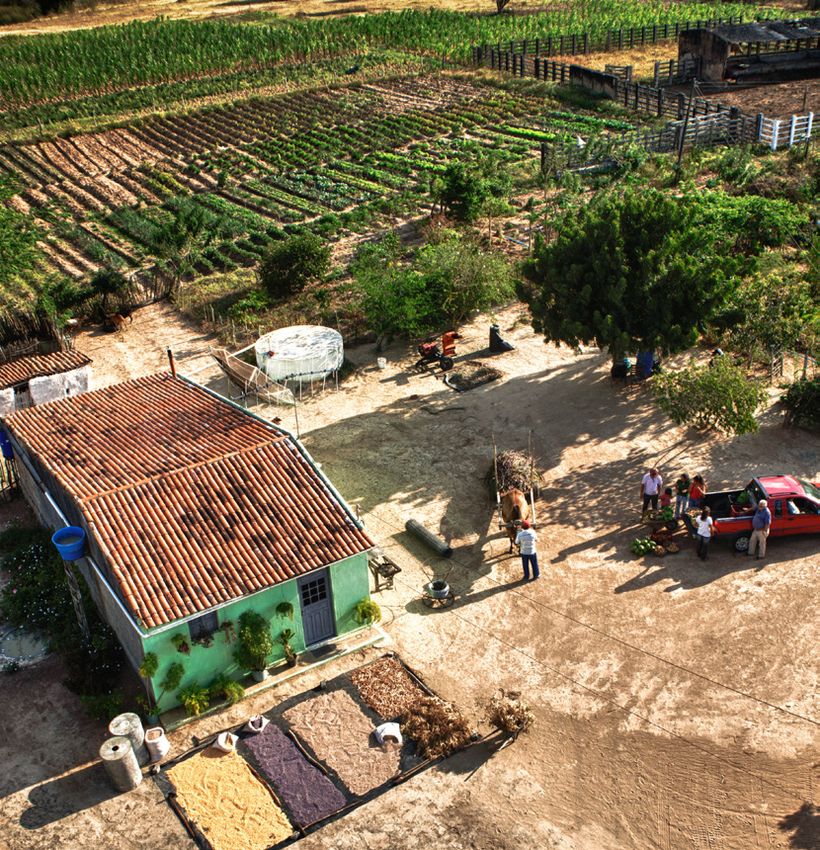
Photo: Flávio Costa / https://goo.gl/uk4xos
Investing in rural people
IFAD Strategy for Brazil 2016-2021 and Series of Studies on Rural Poverty
Public policies for rural development and combating poverty in rural areas
Fernando Gaiger Silveira; Pedro Arruda; Izabelle Vieira; Simone Battestin; Áquila Estevão Campos and Wesley Silva

This publication is a result of a partnership between the International Policy Centre for Inclusive Growth (IPC-IG),
the United Nations Development Programme (UNDP), the Institute for Applied Economic Research (Ipea)
and the International Fund for Agricultural Development (IFAD).

Copyright© 2016
International Policy Centre for Inclusive Growth
United Nations Development Programme

International Policy Centre for Inclusive Growth (IPC - IG)
United Nations Development Programme

SBS, Quadra 1, Bloco J, Ed. BNDES, 13º andar
70076-900 Brasília, DF - Brazil
Telephone: +55 61 21055000

ipc@ipc-undp.org          www.ipc-undp.org

The International Policy Centre for Inclusive Growth is jointly supported by the
United Nations Development Programme and the Government of Brazil.

Rights and Permissions

All rights reserved.

The text and data in this publication may be reproduced as long as the source is cited.
Reproductions for commercial purposes are forbidden.

The International Policy Centre for Inclusive Growth disseminates the findings of its work
in progress to encourage the exchange of ideas about development issues. The papers are
signed by the authors and should be cited accordingly. The findings, interpretations, and
conclusions that they express are those of the authors and not necessarily those of the
United Nations Development Programme or the Government of Brazil.

IPC-IG/UNDP Director: Niky Fabiancic                                        IFAD:
IPC-IG/UNDP Research Coordinators:                                          Leonardo Bichara Rocha, Country Programme
Diana Sawyer, Fábio Veras Soares,                                           Officer of the IFAD Brazil Country Office
Rafael Guerreiro Osorio (Ipea) and                                          Hardi Vieira, IFAD Programme Officer for Brazil
Luis Henrique Paiva.                                                        Octavio Damianiand Arilson Favareto, Consultants
                                                                            and Adenike Ajagunna, Administrative Assistant.
Ipea President: Jessé Souza
                                                                            SEMEAR:
International Fund for Agricultural Development (IFAD)                      Dirce Ostroski, Coordinator
Country Programme Manager in Brazil: Paolo Silveri                          Elisa Tavares, Administrative Support
PUBLIC POLICIES FOR RURAL DEVELOPMENT AND
                 COMBATING POVERTY IN RURAL AREAS

                Fernando Gaiger Silveira; 1 Pedro Arruda; 2 Izabelle Vieira; 3
              Simone Battestin3 Áquila Estevão Campos4 and Wesley Silva3

      1 INTRODUCTION
       “... the agrarian structure and production relations in the Brazilian rural areas are, in many
     instances, extremely complex. This is particularly the case in the Brazilian Northeast, where
    very particularized economic systems were gradually built over time that must be taken into
        consideration when developing the reforms required in the current economic and social
                                                                           situation of the country.”
                                                                                                         Caio Prado Jr. 5

Brazil has become a good example of public policies aimed at combating poverty and
fostering rural development, or, in other words, promoting family farming. The country has
even ‘exported’ some of its policies, notably the Programa Bolsa Família and the Programa de
Aquisição de Alimentos (PAA—Food Acquisition Programme). This paper aims to present an
evaluation of this set of policies, starting with their recent performance in terms of resources
and beneficiaries, going through an identification of coverage indicators, and, finally,
recovering studies and analyses that assess these policies. Specifically, for the monitoring
and evaluation of rural development policies, the main source of information for this work
were the chapters on the subject in the Institute of Applied Economic Research (Ipea)
Social Policy Bulletin.

1. Institute of Applied Economic Research and International Policy Centre for Inclusive Growth (Ipea/IPC-IG).
2. International Policy Centre for Inclusive Growth (IPC-IG).
3. Consultant.
4. Institute of Applied Economic Research scholarship holder (Ipea).
5 In his introduction to Manuel Correia de Andrade’s 1963 book entitled A terra e o homem no Nordeste: contribuição ao
estudo da questão agrária no Nordeste (Land and man in the Northeast: contribution to the study of the agrarian issue in
the Northeast).

This publication is a result of a partnership between the International Policy Centre for Inclusive Growth (IPC-IG),
the United Nations Development Programme (UNDP), the Institute for Applied Economic Research (Ipea) and the
International Fund for Agricultural Development (IFAD). It was also published by the IPC-IG as Working Paper
No. 142, May/2016.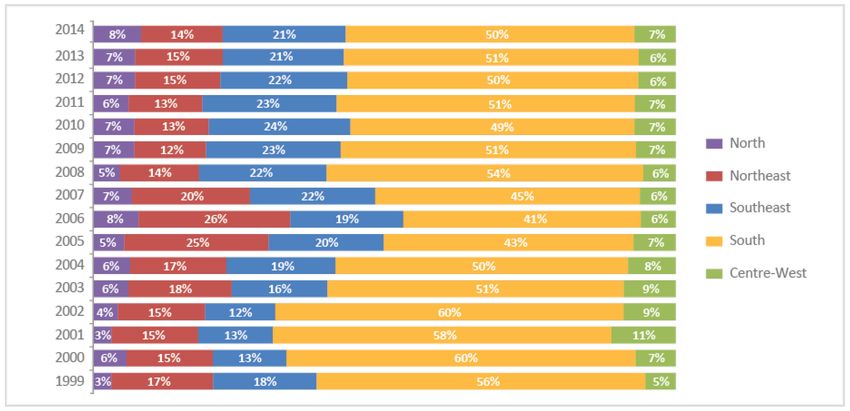
2                                International Policy Centre for Inclusive Growth

The main conclusions of that bulletin can be summarised, in broad terms, as follows: The
Agrarian Reform programme has been losing ground, especially its dispossession instrument;
the resources of the Programa Nacional de Fortalecimento da Agricultura Familiar (Pronaf) Crédito
modality are highly concentrated in the capitalised family farms of the South region of Brazil; the
PAA presents an interesting alternative to support smallholder farmers but cannot expand its
scale or generate more transformative structural results; and we are witnessing the historical
continuity of the criminalisation of rural social movements and of violence in rural areas.
     The narratives of the Brazilian success are based, on the one hand, on the performance
of such policies, especially when it is estimated from the volume of resources and beneficiaries
they encompass. On the other hand, these narratives are also based on the significant
improvements in poverty, income and inequality indicators in rural areas of Brazil, 6 not to
mention the abating of rural–urban migration. The prevalence of extreme poverty and poverty
in rural and/or agricultural populations (for example) drastically decreased, from 16 per cent
and 40 per cent in 2004 to 8 per cent and 19 per cent, respectively, in 2013. In the same period,
income from agricultural labour grew at a rate of 5.6 per cent per year in real terms, while the
rural population declined by only 3.1 per cent. As for agrarian and agricultural policies, the
total number of Pronaf contracts stands at almost 2 million, with invested resources in the
order of BRL24 billion, while the Agrarian Reform programme now totals nearly 1 million
families settled on approximately 90 million hectares of land.
     Figures 1 and 2 show poverty and extreme poverty levels between 2004 and 2013 by
type of household. As can be seen, the most significant decreases were seen in households
with members engaged in agriculture (the green lines in the figures). The decline was less
pronounced for poverty levels in the proportion of the population living in rural areas that
are not involved in agricultural activities, especially among those living in extreme poverty.
One notable observation is the stable level of extreme poverty among residents of pluriactive
agricultural households, among which poverty declined at a less pronounced pace.

 FIGURE 1                                                 FIGURE 2
 Percentage of poor population by                         Percentage of extremely poor population
 type of household, Brazil (2013)                         by type of household, Brazil (2013)

 Source: Soares et al. (2016).                            Source: Soares et al. (2016).
IFAD Strategy for Brazil 2016-2021 and Serie of Studies on Rural Poverty     3

     It is important to note the changes that took place between 2004 and 2013 in the
composition of the population by type of household (agricultural, pluriactive, non-agricultural
rural and non-agricultural urban). Figure 3 clearly shows that the decline in poverty in the rural
population took place in a context of a significant reduction of its importance as a subset of
the population. In absolute terms, the segment of the population living in households with
members engaged in agriculture declined by more than 8.5 million people. On the other hand,
there has been a very significant increase in the population living in rural households that are
not engaged in agriculture: that segment expanded by 3 million people—or an increase from
3.9 per cent to 5.0 per cent of the total population. 7 We stress that the annual growth rate of
this population segment is 4.2 per cent, much higher than that of other population groups.
The population of residents in pluriactive households also expanded, but much more subtly:
a 5 per cent increase—adding about 750,000 people—during the whole period.

FIGURE 3
Population distribution by household type, Brazil (2013)

Source: Soares et al. (2016).

     With regard to income, there was a substantial increase in income from agricultural
work (of the order of 50 per cent in real terms) between 2004 and 2013, and an even more
significant increase in income transfers—from rural social security and Bolsa Família. Rural
social security saw an increase of 29 per cent in the amount of benefits and of 64 per cent in
the minimum wage in real terms. As for Bolsa Família, 8 million more families benefited from
the programme over the period, leading to a 39 per cent increase (in real terms) in average
benefit pay-outs. 8
     With regard to demographics and the labour market, rural–urban migration continued to
occur, albeit much less intensely. On the other hand, there was also a significant reduction in
rates of both agricultural activity and occupation in rural areas. This decrease in the proportion
of the population engaged in agriculture was mostly among young people, affecting
employers, employees, self-employed workers and unpaid members, although it
has spared those engaged in production for self-consumption.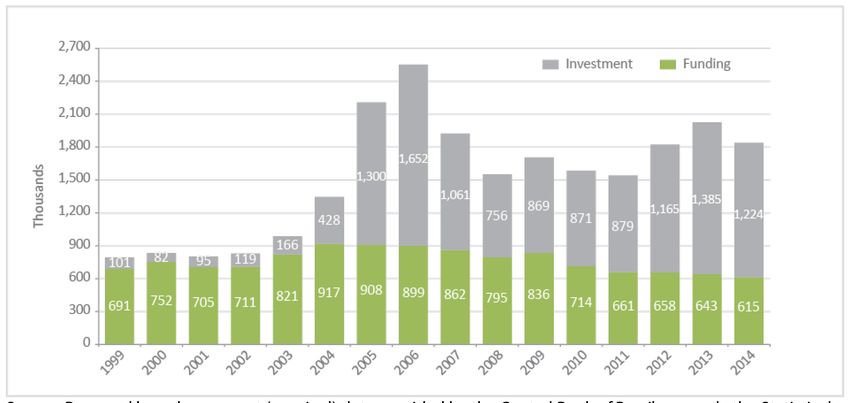
4                                  International Policy Centre for Inclusive Growth

TABLE 1
Rate of activity in the rural population, share of the population engaged
in agriculture, and income from agricultural work as a main occupation, Brazil (2013)
                           Rural                  Income from agricultural            Proportion of the population
      Year
                       activity rate             work as a main occupation               engaged in agriculture
      2004                66.2%                            576.66                                27.1%
      2005                66.9%                            592.19                                26.3%
      2006                65.2%                            621.76                                24.5%
      2007                63.6%                            662.41                                22.9%
      2008                62.3%                            687.60                                21.4%
      2009                61.7%                            687.13                                20.7%
      2011                58.3%                            777.48                                18.7%
      2012                57.3%                            838.46                                17.1%
      2013                56.8%                            888.51                                17.0%
Source: IBGE (2013).

     There are, however, four important changes: 1) a decrease in wage-earning agricultural
labour and self-employed work, due to the deepening impacts of the technological model;
2) the removal from activity of workers employed precariously: unpaid workers, young people
and women; 3) a significant expansion of formalisation among wage-earning employees,
with formalisation rates going from 33 per cent to 50 per cent; and 4) an increase in the
number of individuals engaged in production for self-consumption, especially in households
whose members engaged in agriculture do not receive monetary income. 9

FIGURE 4
Distribution of the population engaged in agriculture
by type of engagement, Brazil (2004/2007/2009/2012/2014)

Source: IBGE.
IFAD Strategy for Brazil 2016-2021 and Serie of Studies on Rural Poverty       5

      Figure 5 shows the changes in the distribution of rural youth either working or studying
between 2006 and 2013. The decrease in the rural youth population—from 6.5 million to
5.5 million—mostly affected those who only work and those who work and study. On the one
hand, this decrease can be seen as something positive, since the number of those who only
study actually increased, in a context of a decreasing population overall. On the other hand,
this can also be seen as a mere reflection of the lack of opportunities for young people in the
job market—a hypothesis reinforced by the fact that there was no decrease in the number
of rural youth who neither study nor work, the so-called ‘neither-nors’.

FIGURE 5
Distribution of rural youth (aged 15–24) engaged in work and/or study,
in absolute (thousands of individuals) and relative numbers, Brazil (2006/2009/2011/2013)

Source: IBGE (2013).

     To a large extent, the progress achieved in rural areas is due to the boom in Brazilian
agriculture and the expanded coverage of the social protection system in rural areas.
It was not, as, such, the result of major changes in ownership structure or in the degree of
heterogeneity of Brazilian agriculture. 10 What can be seen is that productive concentration
has in fact intensified under a highly concentrated agrarian structure, as did the precariousness
of access to other services and assets—education, technical assistance, technology, water—
for the poorest segments of the agricultural population.
     In the context described above, this discussion on policies conceived to foster rural
development or to promote and strengthen family farming focuses particularly on the
scope and relevance of these initiatives. In other words, this work seeks to assess the extent
to which said policies are able to benefit the programmes’ target audiences, and, when
they do, how effective and/or impactful their actions are. In this context, the Pronaf and the
Agrarian Reform emerge as objects of study of particular interest, due to both the volume
of resources they mobilise and the interpretation schism to which their analysis tends
to lead. On the one hand, there are analyses that support the unsustainability of family
farming, pointing to a two-pronged development scenario that suggests targeting this
audience only with social security/welfare policies, not rural development ones. On the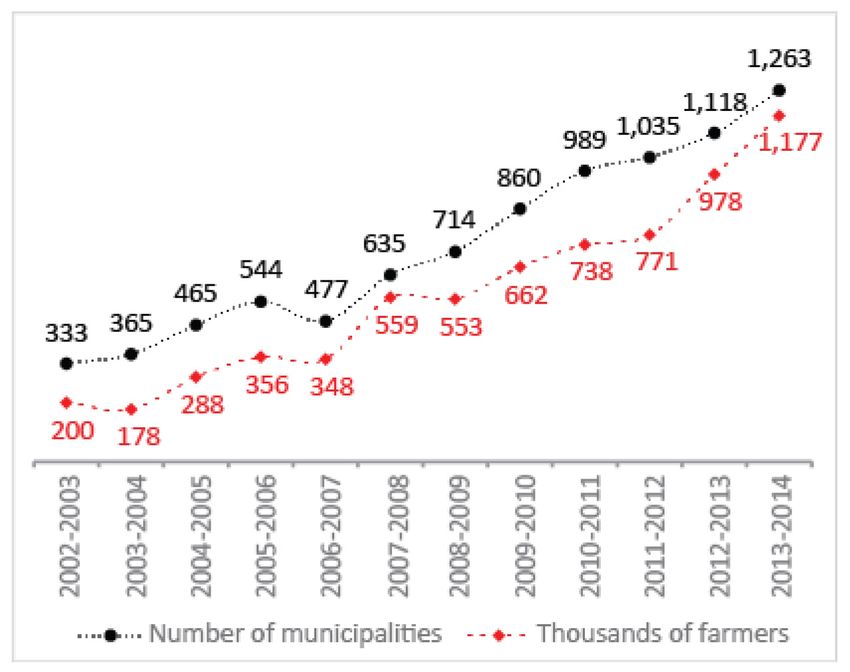
6                            International Policy Centre for Inclusive Growth

other end of the spectrum are those analyses that emphasise the historical resilience of
family farmers, and which, therefore, insist on the improvement of rural development
policies so that they can support this trajectory of resistance.
     From its inception, the Pronaf has historically concentrated investments/credit lines in
the South region of the country, a trend that has been worsening recently due to increases
in the average amounts of funding and investment contracts, which indicates that the
programme may suffer from a scope-of-coverage issue. 11 In terms of its impacts, this
concentration of resources in the South and Southeast is also accompanied by a bias that
favours commodity-based production models, with little capacity to absorb labour and
requiring a very high degree of specialisation and integration. 12 As such, this encourages an
agricultural model that is not inclusive, since it can hardly be accessed by the most vulnerable
farmers. Even in the Northeast, where rural microcredit loans (Pronaf B) are more frequent,
an economic bias remains: the poorest benefit the least among the poor (Ipea 2014). 13
     As a response to this scenario, a few analysts and the programme’s managers have
claimed that the Pronaf does not have as a target audience the half of the family farming
population that is productively marginalised and has no ability to pay, and thus there is no
reason to seek to strengthen the agricultural base of that segment, since said base is
dispensable and has reduced productivity. 14
      The question that remains, then, is: what policy should be developed or incremented to
serve these rural poor populations that the Pronaf does not reach and already have access
to land? It seems to be a consensus that the way forward is through education and technical
assistance, both majorly prevalent bottlenecks in public policy (particularly the latter). Under
this logic, the prospect of a two-pronged development policy suggests that, while human
capital gains do not mature further, the majority of these farmers, supposedly productively
unviable, should rather be targeted by welfare and social security policies. It is stated, then,
that no economic reason exists for the credit and marketing policies currently developed for
the smallholder segment.
      In the case of the Agrarian Reform and all the arguments employed in its defence
(namely “expanding the domestic market, increasing food production and foreign exchanges,
distributing income and, finally, assessing the social issue in the countryside, especially the
issue of rural poverty” (Buainain, Alves, Silveira, and Navarro 2013; Navarro and Campos 2014)),
important voices from national agricultural development studies consider that these have lost
their currency. Regarding the first two goals, conservative modernisation showed that there
were other paths which, regardless of changes in the structure of land ownership, would
cater to these roles of agriculture. As for the goals related to income distribution and poverty
reduction, it is considered that such an argument has lost relevance since “the dynamism of
agriculture is mainly a result of investments and technological intensification”, with the
importance “of land and labour as determining factors of total production values” having
decreased “from 18.1% to only 9.6% and from 31.3% to 22.3%” (respectively) between 1995-
1996 and 2006 (Buainain, Alves, Silveira, and Navarro 2013; Navarro and Campos 2014).
     This same type of argument also maintains that government policies to foster rural
development can be considered inept for not properly assessing the current framework
of national agricultural development, which has two faces: 1) a positive one, which is the
significant growth of agricultural and agro-industrial production; and 2) a negative one,
namely the selectivity of the process, which renders farmers increasingly unnecessary in this
IFAD Strategy for Brazil 2016-2021 and Serie of Studies on Rural Poverty           7

process. This analysis is largely based on how the value of agricultural production is
distributed throughout the country’s farms. According to the 2006 census, just under 30,000
establishments account for half of the country’s agricultural gross value added (GVA), while
the 3 million farms with gross income of no more than two minimum wages account for just
over 3 per cent of that amount (Navarro and Campos 2014). These same data also indicate
that half of these poor people are found in the northeast semi-arid region, and sustain the
conclusion that, given “the economic processes that have intensified in recent years [...]
the diagnosis” regarding the chances of poor people in the countryside remaining
as producers is bleak, predicting “a rapid emptying of the countryside”.
     In opposition to this argument for a two-pronged development policy that proclaims
the obsolescence of the Agrarian Reform, one wonders if this level of concentration was not
already present before. After all, it makes little sense to decree the demise of the small farmer
based on land concentration and production estimates not taken as part of a historical series,
which would in fact allow for an objective judgement of whether this context, supposedly
incompatible with family farming, is in fact a new development. It is noteworthy that the same
data analysis used to reveal the concentration of production based on the 2006 agricultural
census has not been made for the 1995/1996 and 1985 censuses.
     In fact, it is quite plausible that the alleged peculiarities which led to the study authors’
prediction of the imminent doom of small farmers are actually long-standing characteristics
of the Brazilian agricultural sector: a finding that this is actually the case would counteract the
most catastrophic forecasts of the historical resilience of small farmers in Brazil. Objectively,
there have been few changes in the country’s land ownership structure, with recent increases
in production largely attributable to better land use—the occupation of internal borders—and
increased labour productivity. According to Guanziroli et al. (2012), “the persistence of family
farming’s share of the country’s agricultural production (or the slight decrease thereof) in a
decade that saw strong expansion in the sector confirms the economic importance of this
segment, which, in addition to producing food for self-sustenance, managed to grow at
almost the same pace as the most prominent agricultural production chains of the Brazilian
countryside”. It also goes to show that “family farming shared, in some form, in the
agribusiness boom of the 2000s”. Additionally, Guanziroli et al. point out that small farms also
presented advances in the physical performance of soil and labour productivity. 15 Based on the
arguments brought by Guanziroli et al., then, the assumption that the agricultural boom has
not also extended to the poorest farmers and that, on the contrary, it has somehow decreed
the extinction of small farmers, seems absurd.
     It is not known, therefore, which data could support the claim that “having remained
more distant from efforts for the technological appropriation and production modernization
of their facilities, smaller farmers, when compared to more modernized ones, only confirm
their economic infeasibility” (Navarro and Campos 2014). How can one make such a claim
without presenting indicators that reflect this trend over time? The mere identification of
processes based on data obtained by a cross-section analysis, as is done by many of the critics
of family farming, does not seem to be enough for such a deterministic prognosis. Nor does it
seem correct to base one’s assessment of the potential of small farming solely on income as
determined via the agricultural census, which both disregards the so-called ‘imputed rent’
and more broadly dismisses the characteristic home–work configuration of small farming,
which has its own intangible gains.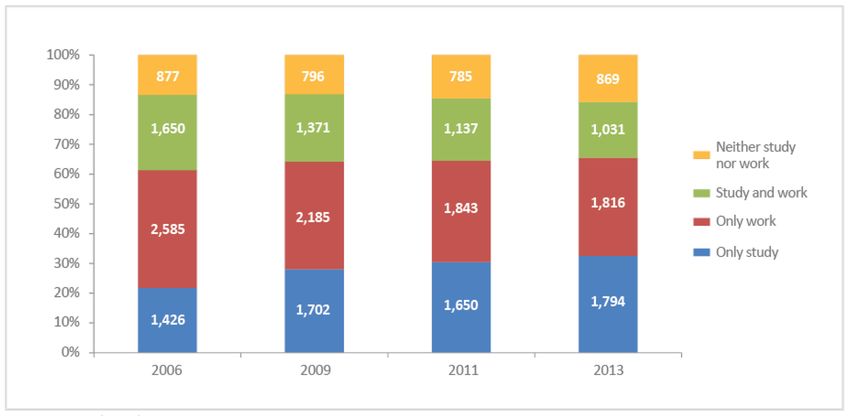
8                             International Policy Centre for Inclusive Growth

     An analysis of data from the Household Budget Survey by the Instituto Brasileiro de
Geografia e Estatística (IBGE) (2002/2003) reveals that about 40 per cent of the income earned
by these families comes from non-monetary sources: home ownership and own production.
While the agricultural census does capture data on production for self-consumption, its scope
does not include information on income derived from non-agricultural work, wage-earning
members of smallholder families and income transfers, which implies that such data are either
not collected or underestimated. As for the data collected by the National Household Sampling
Surveys (Pesquisa Nacional por Amostragem de Domicilio—PNAD), the numbers show a
significant increase in agricultural income, especially for wage-earning employees but also
for self-employed workers. 16
     Thus, what the data and the facts mentioned above reveal, in contrast with an alleged
impracticability of family farming, is the great resilience of this category, especially considering
that the size of its population has not decreased. Quite the contrary; it has been increasing.
It would be too tiring to mention the entire body of literature that has, for a long time,
announced the end of small farming in agriculture without ever having its prophecy fulfilled.
     In light of all of the above, then, it becomes clear that the two-pronged development
hypothesis is not only a case of misplaced fatalism but also a typical return to a dualistic view
of rural Brazil that ignores the intrinsic relationships between its different sectors and agents.
The small subsistence farming and commercial agriculture segments are interconnected,
a relationship that still maintains, to some extent, traits of the relationship between large and
small properties that marked the initial occupation of the country’s territory. It is estimated
that 10 per cent of the wage-earning labour in Brazilian agriculture lives in agricultural
households they own; it is also noteworthy that around a quarter of such labour comes
from urban households.
     Therefore, the thesis that there is no room or need for agrarian reform seems to have two
major weaknesses. The first is to treat as agrarian reform the settlement model now in practice
in Brazil, which does little more than settle families in new areas and (more recently) regularise
the areas they have long occupied. An agrarian reform of true structural importance for the
Brazilian countryside must go beyond the mere creation of settlements by colonisation and/or
regularisation. An agrarian reform of (re)structuring consequences must be fundamentally
based on land dispossession instruments focusing on areas of high land concentration, areas
with a significant number of small farms with poor access to land and working conditions
and/or areas in which there are violations of environmental laws and the social role of land.
Thus, the use of dispossession for the settlement of the landless, the regularisation of
smallholdings and the provision of land credit to increase the area of small farms would
reorganise the agricultural space, making distribution less concentrated and overcoming a
major obstacle to the development of small farms: inadequate and precarious access to land.
     The second big mistake of those who defend the obsolescence of agrarian reform
as a necessary item of Brazil’s rural development agenda has to do with their rushed and
imprudent dismissal of the importance of rural land ownership in the country’s current
production model. Some authors even argue that “access to land is... a policy [concern]
made absolutely innocuous in the current contextual framework” (Navarro and Campos 2014).
This is not what one observes when estimating earnings equations for agricultural work that
consider, in addition to classic variables, employment status (employer, self-employed and
employee), ownership and size of the establishment. Hoffmann (2011) estimated earnings
IFAD Strategy for Brazil 2016-2021 and Serie of Studies on Rural Poverty 9
equations using data from the 2009 PNAD, and concluded that “there is no doubt regarding
the major importance of the size of the land as a determining factor of the income earned
by individuals engaged in Brazilian agriculture, along with whether or not said individual is
the owner of the land”. Added to this is the fact that land concentration also determines the
degree of well-being or quality of life. Specifically, the application of regression models to
determine human development indexes and mortality rates indicates that the higher the
Gini index for land tenure distribution, the lower the Human Development Index (HDI),
and the higher the infant mortality.
Despite the misconceptions we see implicit in the two-pronged development hypothesis,
our analysis suggests that social policies with a rural focus tend to largely replicate its logic.
Impact assessments and analyses of the results of policies seem to point to a split in policies
directed to rural areas and to smallholder farming. On the one hand, welfare and social security
policies stand out in the poorest regions, particularly in the North and Northeast, which are
also the main target of agrarian reform efforts based on non-onerous land acquisition. On the
other hand, credit and trade-support policies concentrate efforts on the so-called ‘modernised
farms’—i.e. establishments that have the potential to grow on an agricultural basis.
On the one hand, one must recognise that productivity-focused programmes have not been
effective in their goals of maintaining employment in the field (since some 3.5 million jobs have
been eliminated in self-employed households) or creating opportunities for the poorest farmers
(given that poverty remained at the same levels in pluriactive households and that the size of this
group has actually increased in relation to other rural/agricultural population segments). On the
other hand, it is not known for certain to what extent these failures are incorrigible, or even to what
extent they are not the result of an implicit two-pronged development interpretation that skews
and limits such policies from design to operation.
In any case, what seems the most certain is the need to reverse this scenario by creating
opportunities in agriculture itself for marginalised smallholders. Considering that the alleged
impracticality of smallholder farming is due to limited and precarious assets—land, water,
education, technology, technical assistance and capital—it seems wiser to cover the lack
of public offerings in these areas than simply to abdicate the possibility of an inclusive
agricultural sector.
There is no doubt that great challenges remain for public policies focused on creating the
conditions and means so that small impoverished farmers—around 2.5 million people—can be
productively inserted and continue to be engaged in agricultural activity. 17 In any case, the
social and economic costs of continuing with the demographic bloodletting of rural areas are
very high. Therefore, although welfare and social security policies have managed to reduce
poverty to some extent (with the help of income from agricultural and non-agricultural work),
it remains imperatively valid that small farmers need to have their freedoms expanded so that
they can go beyond the ‘inevitability’ of urban migration and/or income protection policies.
2 SIZING AND REGIONAL DISTRIBUTION OF PROGRAMMES
Social security, welfare and other rural policies that promote smallholder farming have
strong institutional support and significant size, as shown by the number of beneficiaries—
families, people and contract farmers—and the amount of resources allocated to these
policies (see Table 2).10 International Policy Centre for Inclusive Growth
TABLE 2
Size of public policies for rural development and combating poverty, Brazil, North and Northeast
regions, as per most recent data for each programme. Number of benefits paid (thousands),
amounts paid (BRL millions)
Brazil Northeast North
Policies – Programmes Number of benefits Number of benefits Number of benefits
Amount Amount Amount
or contracts or contracts or contracts
Social Security (2012 – Dec 2012)
Retirement pensions and assistance 25,176 278,778 6,561 57,288 1,074 9,459
Rural retirements and other rural
8,482 60,945 4,112 28,707 712 4,831
pensions
BPC (2014 - Dec 2014) 4,130 35,141 1,500 12,741 414 3,520
Bolsa Família (2014 – June 2015)
Total 13,717 27,186 6,915 14,120 1,646 5,595
Rural 3,744 8,422 2,455 5,595 522 1,365
Pronaf (2014)
Funding 615 10,152 51 461 15,741 267
Investment 1,224 14,596 773 2,994 87,623 1,783
PAA (2013) 96 467 37 180
PNAE (2013) 3,693 1,138 253
Family farming 2,474 660 152
Harvest Insurance (2013/14) 909 773 868 738
Cisterns (2013) 77 74
Total 2003–2013 1,049 966
Green Grant (2014) 37 11 5 2 29 9
Closed-season assistance (2014) 861 2,355 437 1,195 293 802
December 2014 168
Subtotal (rural/agricultural + BPC) 97,840 39,194 8,587
Total 338,010 77,972 18,347
Source: INCRA Administrative records, MPS, MMA, MEC, Brazilian Transparency Portal.
Note: BPC = Benefício de Prestação Continuada.
The funds allocated to these policies in general—which include social security and labour
benefits (retirement and other pensions, assistance benefits and closed-season assistance), welfare
benefits (Benefício de Prestação Continuada, Bolsa Família, Bolsa Verde) and family farmer benefits
(Pronaf, Harvest Insurance, PAA, the National School Feeding Programme (Programa Nacional
de Alimentação Escolar—PNAE) and the 1 Million Cisterns Programme (Programa Um Milhão de
Cisternas—P1MC)—together amount to almost BRL350 billion annually. Of that amount, benefits
specifically targeting rural areas and populations connected to agricultural production
total BRL140 billion (40 per cent), a proportion that is closer to the social relevance of
family farmers and people living in rural areas than to their economic importance.
It is worth noting that this heading does not include information from the
Agrarian Reform programme and policies associated with it—namely the National Land
Credit Programme (Programa Nacional de Credito Fundiário—PNCF) and the National Agrarian
Reform Education Programme (Programa Nacional de Educação na Reforma Agrária—Pronera)—
because administrative records from those programmes do not allow for a distinction of which
share of those funds are actually benefits paid (development aid, credits, grants, subsidies) andIFAD Strategy for Brazil 2016-2021 and Serie of Studies on Rural Poverty 11
which is attributable to administrative and management costs of policies and to the National
Institute for Colonisation and Agrarian Reform (Instituto Nacional de Colonização e Reforma
Agrária—INCRA). The information available on those two programmes also does not allow one
to establish the regional distribution of spending by the policies. Also, the total amount would
be even higher if it included (in addition to the policies described above that are not covered)
the amounts spent on public health, education and infrastructure policies.
The amount of expenses included in Table 2, BRL338 billion, amounted to about 7 per
cent of gross domestic product (GDP) in 2012. Expenditures were concentrated in the North
and Northeast regions, where spending on these policies amounted to BRL18 and BRL78
billion, respectively, which in turn amounted to 7 per cent and 12 per cent, respectively, of the
GDP of these regions in 2012. Viewed as a share of the GDP of the rural/agricultural universe,
the resources spent (including policies) represent 31 per cent, 27 per cent and 82 per cent for
the whole country, North and Northeast, respectively.
Several of these data are remarkable for their magnitude. In the case of the Northeast
region, there are more than 4 million rural retirement and other pensions being paid, almost
2.5 million rural families receiving the Bolsa Família, 800,000 micro investment contracts
for poor family farmers, nearly 1 million farmers supported by the Garantia Safra (Harvest
Insurance) and 500,000 fisherfolk with guaranteed income during the closed season. For the
whole Northeast (not just the rural population), there are 6.5 million retirement/other pensions
and assistance, 7 million families receiving the Bolsa Família and 1.5 million beneficiaries of the
Benefício de Prestação Continuada. In the North, as in the Northeast, one observes a very
significant weight of some programmes when the size of the beneficiary population is
correlated with target or potential audience estimates.
Social security coverage is very widespread, both for the population as a whole and for
those living in rural areas or engaged in agricultural activities, reaching about 80 per cent in
the case of the elderly population and just over 90 per cent for the universe of households
containing elderly people. The Bolsa Família also presents very high coverage indicators,
both from the data collected in sample surveys (demographic census samples and PNADs) and
from a comparison of administrative records and estimates of the number of people living in
poverty. The degree of coverage of the Bolsa Família is higher in the North and Northeast and
in the rural and/or agricultural population. In the case of the Pronaf, proxy coverage indicators
(contracts per type/family farm) achieve good ratios (a half to two thirds) for the programme’s
funding contracts in the South and investment contracts in the Northeast, and, to a lesser
extent, also for investment contracts in the South. The Harvest Insurance benefit, together with
the Pronaf investment modality, covers nearly 1 million farmers in the Northeast, compared to
a universe of 1.6 million beneficiaries of the Pronaf B programme (rural microcredit).
2.1 AGRARIAN REFORM
Brazil’s Agrarian Reform programme covers about 90 million hectares in just under 10,000
projects, with nearly 1 million families settled. The magnitude of the policy becomes more
evident when one compares data on the structure of Brazil’s agricultural land ownership with
data on the number of families settled: Agrarian Reform is directly responsible for around a
fifth of the total number of farms and more than a quarter of the area occupied by farms in the
country. Specifically for family farming, Agrarian Reform is directly responsible for 23.7 per cent
of farms and 21.9 per cent of the area occupied by farms. A total 44 per cent of the projects,
40 per cent of households and 58 per cent of the total area covered by Agrarian Reform are12 International Policy Centre for Inclusive Growth
the result of activities from the last 12 years (2003–2014); the same percentages for the period
between 1995 and 2002 are 46 per cent, 43 per cent and 24 per cent, respectively (see Figure 6).
There are two key characteristics of the recent evolution of the Agrarian Reform: the
significant decrease in the number of families settled, with the consequent stabilisation of
beneficiary audiences, and the growth of the use of non-onerous means to obtain land for
settlements. Thus, if the number of beneficiary families and the acquisition of land through
dispossession have both decreased considerably in recent years, there is no doubt that
the main objective of the Agrarian Reform—i.e. changing the scenario of high land
concentration—is seriously compromised.
FIGURE 6
Proportion of total projects, families settled and total area covered
by agrarian reform by selected period, Brazil
Source: SIPRA/SDM/Relatório 0227, Date: 12 February 2015.
Of the 970,000 families settled from 1900 to 2014, 16.6 per cent were settled up to
1994, 42.4 per cent between 1995 and 2002, 37.9 per cent between 2003 and 2010 and
only 3.2 per cent in the last four years (Ipea 2013). These figures show that, even though the
struggle for land is an old issue, the Agrarian Reform’s most significant advances began in
the mid-1990s—that is, over the last 20 years. Such advances fall short of what is expected
in terms of numbers and context for the effectiveness of the Agrarian Reform, especially by
those who have fought for it, as highlighted during the systematic monitoring conducted
by the Directorate of Studies and Social Policy (DISOC) of the Ipea.
In short, 5,214 Agrarian Reform projects were created in Brazil between 1990 and 2002,
3,700 were created between 2003 and 2012, and the period 2011–2014 saw the least progress
in the number of families settled over the last two decades, with the lowest point during the
Collor administration (Ipea 2013).
Figures 7 and 8 present two important aspects that illustrate the main points outlined
above. Figure 7 illustrates the capacity of settlements, the area occupied by them and the
total number of families settled at the end of each year. Figure 8 shows the number of families
settled each year, and among those which were settled in projects created in that same year.IFAD Strategy for Brazil 2016-2021 and Serie of Studies on Rural Poverty 13
FIGURE 7 FIGURE 8
Area used by settlement projects, settlement Families settled per year and families
capacity and number of families settled settled in projects created in the same year,
by 31 December 2014 Brazil (2003–2014)
Source: SIPRA/SDM/Relatório_0227, Date: 12 February 2015. Source: SIPRA/SDM/Relatório_0227, Date: 12 February 2015.
Figure 7 showcases the significant growth of the Agrarian Reform’s ‘stock indicators’—
i.e. the area occupied by projects, settlement capacity and the number of families settled
between 2004 and 2008 (showing an increase of about 300,000 families settled). Since then,
the number of settled families increased more slowly, by only about 100,000. The area
occupied by settlements increased by about 35 million hectares, or 75 per cent.
After 2008, about 7 million hectares were allocated by the Agrarian Reform.
The ‘stock’ of settled families changes mainly by new families being settled, which is
largely made possible by the vacancy of lots due to ‘abandonment’ by former beneficiaries
for various reasons. Thus, a proportion of the increase in the stock of settled families does not
necessarily result from an expansion in the stock of land reserved for settlements. Many settled
families are accommodated in previously existing Agrarian Reform projects.
Despite the limited information available regarding the ‘flow’ of families within the
Agrarian Reform, it is known that in recent years about two thirds of settled families were
allocated to existing projects: this proportion also holds true for year-on-year analyses. It is also
known that around two thirds of the families settled between 2012 and 2014 were allocated
to projects created four years earlier. Still, the analysis by the Ipea is right to point out that
“the reasons for new occupants in old projects, however, need to be clarified: one must find
out if those are the result of abandonment, neglect, inheritance, expansion of the project's
perimeter, land parcelling etc. But the fact is that they have not produced consequential
effects on local or regional land concentration” (Ipea 2013).
Regarding the average size of the lots, the average size between 1995 and 2002 was
just over half of what it was for the set of settlements in other periods. It can be said that
this difference is a reflection of the fact that this particular period was marked by the rise of
dispossession as an effective instrument, with more projects using it in the country’s Centre-
South region. In subsequent periods, the average size of lots grew due to the concentration
of activities in the North and the predominance of non-onerous ways of obtaining land.14 International Policy Centre for Inclusive Growth
While the size of the Agrarian Reform should indicate deeper changes in the distribution of
land ownership, this is not what is observed when one reviews the results of the last agricultural
census (IBGE 2006). Indeed, the trend of the concentration of land seen at the end of the last
century (a result of the modernisation policy applied to rural and agricultural areas), called
conservative, remained undisturbed by the distributional effects of the Agrarian Reform. As for
the beginning of this century, what was observed was that the sheer volume of Agrarian Reform
projects created in a single decade, despite being almost equivalent to the number of all projects
created in the previous 100 years, has not actually been translating into land redistribution. Despite
the large, significant numbers, Brazil’s land ownership structure has not been affected; the number
of rural workers without land or with insufficient land is still quite high.
There is no doubt that the little impact the Agrarian Reform has had on the
concentration of land ownership in Brazil is a result of its preferential use of non-onerous
instruments for obtaining land.
TABLE 3
Mechanisms used to obtain land for rural settlement projects, Brazil (1900–2014)
Number Number Percentage Percentage
Form of Number of Area Percentage of Area
of families of settled of families of settled
acquisition projects (ha) projects (%)
(capacity) families (capacity) families
Onerous 6,133 25,546,067 629,194 537,013 66 29 54 55
Purchase and sale 527 1,591,819 53,777 46,923 6 2 5 5
Dispossession 5,606 23,954,248 575,417 490,090 61 27 49 51
Non-onerous* 2,804 59,544,588 471,432 370,233 30 67 40 38
Recognition 1,608 35,115,359 186,236 161,436 17 40 16 17
Discrimination 59 3,635,028 30,103 24,692 1 4 3 3
Collection 729 18,622,429 207,311 150,724 8 21 18 16
Other non-onerous
408 2,171,772 47,782 33,381 4 2 4 3
forms
Being obtained 318 3,225,862 72,691 62,380 3 4 6 6
Grand total 9,255 88,316,517 1,173,317 969,626 100 100 100 100
Source: SIPRA/SDM/Relatório_0227, Date: 12 February 2015.
Note: *Other non-onerous forms of obtaining land include: awarding; assignment; confiscation; donation;
incorporation; reversal of eminent domain; and transfer.
It is quite clear that dispossession was the most often used instrument to create
settlements between 1995 and 2002. It is equally clear, also, that this classical way of obtaining
land for agrarian reform has been losing ground every year, especially with regard to the size
of the area actually obtained. Between 2003 and 2006, recognition and discrimination, and
between 2007 and 2010, other non-onerous mechanisms were the prevalent mechanisms for
the settlement of families and for obtaining land. In the context of the negligible performance
of Agrarian Reform activities over the past four years, dispossession actually increased in
importance as a way of creating settlements.
Table 3 shows that, although only one third of the total settlement projects are in areas
obtained through non-onerous mechanisms, these projects account for about two thirds of the
total area allocated for Agrarian Reform projects. The distribution of families in relation to the
mechanism used to obtain land follows roughly the same trend as that of the number of projects.IFAD Strategy for Brazil 2016-2021 and Serie of Studies on Rural Poverty 15
To better illustrate how dispossession gradually lost relevance in the Agrarian Reform
programme, we refer to Figure 9. It shows the number of projects obtained by dispossession
as a proportion of the total number of projects, the stock of settled families and the total area
of settlements. The numbers demonstrate the importance of this mechanism in the second
half of the 1990s and the early 2000s. Between 1995 and 1998, dispossession was responsible
for three quarters of projects, 70 per cent of families settled and about two thirds of the
area obtained. Between 2007 and 2010, when a significant number of families was settled,
dispossession accounted for less than 10 per cent of the area obtained, about one third of
families settled and little over half of the projects: the numbers are only slightly higher than
those observed in the previous period, between 2003 and 2006.
FIGURE 9
Percentage of projects, settled families and settlement areas
obtained through land dispossession in Brazil (selected periods)
Source: SIPRA/SDM/Relatório 0227, Date: 12 February 2015.
Regarding regional distribution (see Table 4), the concentration seen in the North region
is a result of the increased use of non-onerous mechanisms for obtaining land; the region has
a large number of public or unoccupied lands. In specific numbers, three quarters of Agrarian
Reform areas and nearly half of the settled families are in the North. The wide variation
between the ways settlement policy is effected in different regions is revealed by the
remarkable difference between the average area of lots in the North (157.0 ha) and in the
Northeast (33.3 ha). As a result, the Northeast region, which has a third of all settled families
in the country, only holds 12 per cent of the total area for Agrarian Reform settlements.
The data show, therefore, that the parcelling of land in the Northeast has been intense,
exactly where dispossession was the predominant form of obtaining land (Ipea 2013).
The focus on settling families in the North region is seen in all political administrations
during the period considered (the Northeast did surpass the North in the number of families
settled during the Fernando Henrique Cardoso (FHC) administration, and, to a lesser extent,
over the last four years). While the Lula administration settled about 200,000 families in the North16 International Policy Centre for Inclusive Growth
region and 130,000 in the Northeast, the FHC government settled 125,000 families in the North
and 170,000 in the Northeast. The differences are more marked in the case of the Centre-West,
where the FHC administration settled 75,000 families, and the Lula administration settled 36,000.
TABLE 4
Distribution of the area occupied by ongoing agrarian reform projects, settled families
and average size of lots, by geographical region of the country, Brazil (2014)
Size Percentage area Percentage settled families Average size (ha)
North 76% 44% 157.0
Northeast 12% 33% 33.3
Southeast 2% 5% 33.3
South 1% 4% 22.6
Centre-West 9% 14% 58.4
Brazil 100% 100% 91.1
Source: SIPRA/SDM/Relatório 0227, Date: 12 February 2015.
Note: Average area = total area/number of settled families.
Of course, the significance of the North region is even greater in terms of the area
occupied by settlements. By that metric, all governments obtained the majority of land for
Agrarian Reform from the North, due to the natural conditions of the region (which require
larger areas). One noteworthy development is the large area occupied by settlements created
in the North during the first Lula administration—27 million hectares, or about 85 per cent of
the area obtained that year.
Table 5 shows information on six states chosen due to their importance for the Agrarian
Reform. The concentration of almost two thirds of settled families and 80 per cent of the total
area of projects in only six states (Pará, Maranhão, Mato Grosso, Amazonas, Rondônia and
Bahia) reveals, on the one hand, the concentration in areas that still have an agricultural
border, and, on the other, the regional inequality in their distribution, in addition to
the sparse and inconstant nature of settlement units created in different states.
The reports on the situation of settlement projects already established is also concerning
(see Table 6). Data as recent as June 2014 describing the current stage of ongoing Agrarian
Reform projects reveal that more than half of the projects (54 per cent) are still at the initial
stage (36 per cent with current status as ‘settlement created’, and 18 per cent with current
status as ‘being installed’). Of the remaining settlements, 28 per cent are in the ‘being
structured’ stage, 12 per cent are ‘in consolidation’, and only a staggering 6 per cent of all
settlements are considered ‘consolidated’ (Ipea 2015a). It follows, then, that 82 per cent of the
projects are still in the installation or structuring stages, with only a scant few having reached
the consolidation stage. 18
This shows that the overwhelming majority of projects still require attention and basic
investment, regardless of how long they have existed, since the productive structuring of
settlements is slow and demands social and productive investment in the families settled.
To a large extent, this stagnation can be attributed to the inability of the national agrarian
reform policy to ensure that settled families have access to other guarantees to which they are
entitled, such as access to initial investments and services, road construction, housing, accessIFAD Strategy for Brazil 2016-2021 and Serie of Studies on Rural Poverty 17
to development initiatives, credit, technical assistance, education and water supply services
and others. This pattern holds true for all of Brazil’s major geographical regions, with the
exception of the South, where the rate of projects in structuring/consolidation stages is almost
twice as high as that of the other major regions. In any case, it should be noted that the South
is one of the major regions with the least projects.
TABLE 5
Ongoing agrarian reform projects by major region and in selected states, Brazil (1990–2014)
Number of Percentage
Number of Average Percentage Percentage
Geographical level Area (ha) settled settled
projects area (ha) area projects
families families
Brazil 9,255 88,316,517 969,626 91.1 100 100 100
North 2,134 67,235,328 428,229 157.0 44 76 23
Northeast 4,260 10,763,479 323,531 33.3 33 12 46
Southeast 777 1,457,178 43,712 33.3 5 2 8
South 830 825,360 36,464 22.6 4 1 9
Centre-West 1,254 8,035,172 137,690 58.4 14 9 14
Number of Percentage
Number of Average Percentage Percentage
Selected states Area (ha) settled settled
projects area (ha) area projects
families families
Pará 1,120 23,149,606 244,778 94.6 25 26 12
Maranhão 1,013 4,716,566 130,847 36.0 13 5 11
Mato Grosso 546 6,083,618 83,475 72.9 9 7 6
Amazonas 144 27,381,804 56,179 487.4 6 31 2
Rondônia 674 2,009,945 46,908 42.8 5 2 7
Bahia 217 6,181,553 38,792 159.4 4 7 2
Total for the six states 3,714 69,523,093 600,979 115.7 62 79 40
Source: SIPRA/SDM/Relatório_0227, Date: 12 February 2015.
TABLE 6
Current stage of ongoing agrarian reform projects, Brazil (as of June 2014)
Projects Area Families settled
Stage
Number Percentage Ha Percentage Number Percentage
Grand total 9,255 100% 88,316,517 100% 969,626 100%
Created 3,418 37% 26,342,651 30% 358,648 37%
Being installed 1,639 18% 33,097,054 37% 166,764 17%
Being structured 2,584 28% 11,630,079 13% 225,616 23%
In consolidation 1,109 12% 8,593,793 10% 134,903 14%
Consolidated 505 5% 8,652,940 10% 83,695 9%
Source: SIPRA/SDM/Relatório_0227, Date: 12 February 2015.
2.2 NATIONAL LAND CREDIT PROGRAMME (PNCF)
According to 2013 data from the Ministry of Agrarian Development (Ministério do
Desenvolvimento Agrário—MDA), Brazil’s main land credit initiative, called the Programa
Célula da Terra (PCT—Land Bill Programme) at its inception, had the target of serving 15,000
families in four states of the Northeast region of the country and northern Minas Gerais over
three years. Between 1997 and 2001, the so-called PCT served 8,891 families in the five states
covered, while the Agrarian Reform policy benefited 107,255 families in the same period in the
same states. This shows both the embryonic nature of this initiative and its complementary18 International Policy Centre for Inclusive Growth
nature to the Agrarian Reform. It benefited the equivalent of 8 per cent of families settled by
the Agrarian Reform in these states and 2 per cent of the total number of families settled in
the country in the same period (392,262 families) (Gomes et al. 2015).
As a consequence of the PCT, in 1998 the Banco da Terra (BT—Land Bank) was created,
designed to perform a similar function across the entire national territory, serving 34,655
families in Brazil during its six years of operation between 1998 and 2003. The states with the
highest level of involvement were Rio Grande do Sul (10,241 contracts) and Santa Catarina
(4,688 contracts), which together accounted for approximately 40 per cent of all contracts
established by the Bank. When comparing the data from the Agrarian Reform policy promoted
by INCRA with data from the BT for the same period, it can be observed that, with the
exception of the two states above, Agrarian Reform was more active in all others, accounting
for about 86 per cent of access to land in the country, with 239,101 families settled (ibid.).
In 2003, the merging of regulations between the PCT and the BT resulted in the PCNF.
By 2013, the PNCF had already benefited 93,827 families. Between 2003 and 2013, the Ararian
Reform policy pursued by INCRA covered 689,423 families, which indicates that the PNCF
covered the equivalent of 14 per cent of total beneficiaries. As a summary, we show below the
sum of beneficiaries served by the Agrarian Reform and by the different agrarian credit policies
under way in the country from their inception until 2013, as identified by Gomes et al. (2015):
a) Agrarian Reform (INCRA activities): 1,288,444 families
b) Land credit beneficiaries (considering the three programmes): 136,873 families
c) (a) + (b); 1,425,317 families
d) Share of land credit in relation to item (c): 9.6 per cent.
Thus, land credit benefited less than 10 per cent of families covered by both policies
in the country. At the regional level, 44 per cent of all land credit offered over the period
was in the South region alone, particularly in the states of Rio Grande do Sul and Santa
Catarina, which had more families benefiting from land credit programmes than from the
Agrarian Reform policy carried out by INCRA. Interestingly, in the states/regions in which
dispossession is virtually the only option for obtaining land, the obstacles to its use—
lagging productivity levels and relatively high costs—have led to the use of land credit
to meet the demand for land.
It is worth noting that no reduction was seen in the inequality of land ownership in
Rio Grande do Sul or Santa Catarina between 1996 and 2006, which points to the low
impact of land credit on land concentration.
2.3 NATIONAL AGRARIAN REFORM EDUCATION PROGRAMME (PRONERA)
The Pronera has so far conducted 320 Educação de Jovens e Adultos (EJA—adult education
courses) at the primary, secondary and higher education levels, involving 82 educational
institutions, 38 stakeholder organisations and 244 partners, with the participation of 164,894
students. These actions, as defined by the report, “qualified the educational and vocational
training of workers, improving their lives, rewriting their territories and changing the Brazilian
countryside for the better” (Ipea 2015b).IFAD Strategy for Brazil 2016-2021 and Serie of Studies on Rural Poverty 19
The Pronera is a dynamic policy which involves a range of institutions and organisations
whose goal is to provide better living conditions in the field. A total of 320 courses were
promoted by the Pronera between 1998 and 2011, including the following categories:
EJA elementary (EJA literacy, EJA adult education and EJA final years); secondary education
(EJA secondary education [teaching credential/regular secondary education], EJA mixed
(regular–vocational) secondary education, integrated (regular–vocational) secondary
education, and secondary education plus post-secondary education; and higher
education (undergraduate modalities, with major and residence in agriculture).
The 320 courses offered, carried out through 82 educational institutions across the
country, were divided into 167 courses for elementary adult education, 99 for secondary
education and 54 for higher education. The courses were taught in 880 municipalities
in all Brazilian states, which confirmed the programme’s nationwide reach.
Ipea (2015b) presents the most important data on the programme, such as the
characteristics of students, the distribution of students by region and by modality, completion
rates and the characteristics of the educators and educational institutions. The most worrying
data, however, are the significant drop-out rates: 37 per cent of the 131,576 students who
entered the schools did not finish their courses—a figure which makes the scenario even more
challenging given how students are distributed throughout the different levels and modalities.
The vast majority of entrants to the programme (93.5 per cent) are going into primary
education (EJA elementary), especially into literacy and early years courses, which means
that demand is highest among those who have had no access to school or left school early
and have been unsuccessful in returning to it. In other words, if the demand for early education is
so great that demand for the next sequential levels is negligible, the high drop-out rate (and
thus low level of progress) in early years indicates that the scenario is unlikely to change.
Entrants to the secondary school programmes account for 4.5 per cent of the total,
with higher demand for the mixed regular–vocational and integrated regular–vocational
courses. Despite the low number of entrants to the higher education or graduate
programmes (2.0 per cent), a wide variety of undergraduate and graduate programmes
were on offer: 42 and 12, respectively.
The average age of entrants decreases considerably as the level of the courses increases.
Students at the elementary level have a mean age of 38.4 years, whereas entrants into high school
programmes average 22.2 years, and higher education students are an average of 29.9 years old.
Only in higher education does the age/schooling ratio become closer to that of the general
population, especially for post-graduate degree students (average of 27.4 years of age). It is evident
that demand is higher for the lower levels of education, sought by people who have never
attended school or have not attended in a long time, while those entering the secondary
and higher education programmes have profiles closer to those of the general population.
The regional distribution of courses and entrants roughly follows the regional composition
of the population of settled families. The courses developed in the Northeast and North region,
in which most families have been settled, offered 35 per cent and 29 per cent, respectively, of the
320 courses. Within those regions, the states of Pará (North), Bahia (Northeast) and Maranhão
(Northeast) represented almost a quarter of all courses offered in the country (33, 23 and 20,
respectively). After them, the next highest demand was seen in the South and Southeast regions,
with 54 and 42 courses, respectively, in particular in the states of Rio Grande do Sul (27 courses)You can also read