GLOBAL 250 GREENHOUSE GAS EMITTERS - A NEW BUSINESS LOGIC BY DAVID LUBIN, JOHN MOORHEAD AND TIM NIXON - BSD Consulting
←
→
Page content transcription
If your browser does not render page correctly, please read the page content below
A THOMSON REUTERS FINANCIAL & RISK WHITE PAPER

GLOBAL 250 GREENHOUSE GAS EMITTERS
A NEW BUSINESS LOGIC
BY DAVID LUBIN, JOHN MOORHEAD AND TIM NIXON

OCT 2017

A THOMSON REUTERS FINANCIAL & RISK WHITE PAPER

   CONTENTS
   Executive Summary.......................................................................................... 2          Looking at Utilities Through the Sustainability Premium Lens...................... 17
   Global Greenhouse Gas Emitters......................................................................3                  Early Indications of Econometric Relevance................................................... 19
   Leaders of the New Business Logic: Less Makes More ................................... 5                               The Key Role of Policy Makers and Cities....................................................... 20
   Forces Driving a Post-Carbon Economy........................................................... 5                      The 1 Gigaton Coalition................................................................................... 20
   Signals from the Global Marketplace: Is Conventional                                                                   Global Policy-Making Trend (Interview with the Norwegian
   Wisdom Wrong? Could It Be Upside Down?.................................................... 6                           Minister for the Climate and Environment, Vidar Helgesen)......................... 23
   The Sustainability Premium: A New Business Logic for Growth..................... 8                                     Conclusion: A Sustainability Premium for the Planet.................................... 25
   Maturity and Momentum Applied to Climate Impact Management............... 9                                            State of the Climate 2017 – Climate Change by the Numbers...................... 25
   Case Studies: Looking at Leadership............................................................... 9                   Appendix 1: Performance: The Global 250 and Our Planet........................... 26
    –Xcel Energy –Ingersoll Rand –Total Group
                                                                                                                          Appendix 2: Correlation Between Co2 Change Rate and
   Sector Leadership............................................................................................ 15       Financial Performance.................................................................................... 32
   A Look at Climate Impact and the Automakers in the G250.......................... 16                                   Appendix 3: Earth Observation Missions....................................................... 34

The authors would like to thank Chris Mangieri of Constellation Research and Technology for his vitally important contributions to the data and
analysis in this report. The authors would also like to thank and acknowledge the important contributions of the Constellation Research and
Technology team, including Yale University Professors Daniel Esty and Jay Emerson, as well as Cary Krosinsky for their work on the M2 Model
described in this report. Important financial data, context and analytics support was provided by Frank Schilder, Thomson Reuters Research &
Development, Adam Baron from Thomson Reuters Content Analytics, and Ian van der Vlugt from CDP. Finally, the authors would like to
acknowledge the important contributions of State Street Global Exchange, KPMG, Baker McKenzie, the European Space Agency, the Norwegian
Climate and Environment ministry, and Minnesota Public Radio.

EXECUTIVE SUMMARY
This Global 250 Report addresses the following key questions:                                                             value creation through effective execution of climate-impact-
                                                                                                                          management strategies. The report describes new methods for
Question: Who are the Global 250 (G250) companies?
                                                                                                                          assessing how companies that are transforming their products and
Response: The Global 250 (G250) consists of a diverse and                                                                 processes to meet the demands of a low-carbon economy. Three case
interconnected group of publicly traded businesses in the following                                                       examples, Xcel Energy, Ingersoll Rand and Total, all top-150 emitters,
sectors: oil, gas, utility, automotive, aircraft, manufacturing, steel,                                                   are presented along with a new model for gauging the positive impacts
mining and cement. They provide essential products and services to                                                        of their decarbonization strategies on business outcomes.
the global economy. They also represent approximately one-third of
global annual anthropogenic emissions, when including their value                                                         Question: Given the long-term transformation challenge confronting
chains. Without continual reductions in emissions from this group of                                                      these large emitters and the importance to investors, companies and
companies, effectively mitigating the long-term risks of climate                                                          policy makers in understanding company performance, how can we
change is not possible.                                                                                                   assess a company’s progress and define leadership?
                                                                                                                          Response: Progress can be assessed by looking at whether a specific
Question: Among this critical group, how are emissions trending
                                                                                                                          emitter is reducing aggregate emissions across all scopes in line with
over the past three years?
                                                                                                                          the latest scientific guidance, or roughly 3% per year through 2050.
Response: Overall, emission trends are flat (on average and adjusted                                                      The report also describes a new sector-specific analytic method for
for revenues) when they should have been going down by roughly 3%                                                         assessing the ”Maturity” level and ”Momentum” factor of decarbonization
per year to stay under 2 degrees C of global warming. Each year’s delay                                                   strategies for a sample of the G250 in the automotive and utility sectors.
in reduction necessitates a steeper reduction curve in the future, likely                                                 The sector analysis concludes by examining relationships between these
increasing the cost and complexity of the required transformations, and                                                   ratings and some key financial outcomes.
decreasing the probability of meeting targets required for limiting
disruptive climate events.                                                                                                Question: How are policy-, city- and investor-leadership evolving to
                                                                                                                          support the transition to a post-carbon economy?
Question: Is there new evidence that implementing decarbonization
                                                                                                                          Response: Engagement is the main theme. We are seeing increasing
strategies, especially for large carbon-intensive businesses like the
                                                                                                                          and direct engagement with carbon-intensive businesses from
G250, creates either a drag on financial performance or a premium?
                                                                                                                          investors and policy makers of all stripes. This engagement yields
Response: First, there is no evidence that executing decarbonization                                                      increasing advantages to businesses that are effectively decarbonizing.
strategies results in a financial penalty, including reduction in total
shareholder returns, reduction in profitability or employment, or other                                                   This report provides new analytics and insight on these critical issues as
common measures of value. Second, there is emerging evidence of                                                           business leaders, investors, policy makers and concerned stakeholders
companies driving business opportunity, competitive differentiation and                                                   navigate the risks and opportunities of climate change.

                                                                                                                      2
A THOMSON REUTERS FINANCIAL & RISK WHITE PAPER

GLOBAL 250 GREENHOUSE GAS EMITTERS                                                                        Figure 1:                  Global 250 Performance
The 250 companies1 referenced in this report, together with their
value chains, account for approximately one-third of global annual                                                    Global 250                         Performance
greenhouse gas (GHG) emissions.2 For a decade or more, the
                                                                                                           Number of companies with         30 (Science Based Targets Initiative)
management teams in these large organizations have recognized the
                                                                                                           Science-Based Targets
potential future constraints that climate change could pose on their
business operations and outlook. While many have deferred making a                                         Number of companies              Approximately one-third of the G250
strategic shift toward a low-carbon future, others have recognized a new                                   decarbonizing at 3%/year or      adjusted for revenue level changes and
business logic: a historic opportunity for innovation that drives durable                                  above                            potential production factors
growth and competitive advantage.                                                                          GHG Index/Revenues Index/   GHG Index (96), Revenues Index (90),
As the early movers see it, carbon-intensive firms – whether they are big                                  Decoupling Index/Employment Decoupling Index (98), Employment
                                                                                                           Index (2016-2014)*          Index (101)
energy producers, consumers or makers of energy-intensive products
who could ride the coming wave of technological and organizational                                         Sector rank by Absolute          Energy (47%), Utilities (15%), Materials
change – would be positioned to prosper in a carbon-constrained world.                                     Emissions**                      (14%), Transportation (10%), Capital
Companies and their customers would see increased eco-efficiencies and                                                                      Goods (8%)
reduced eco-risks. Firms unwilling or unable to adapt would ultimately                                     Decoupling Index Rank**          Utilities (112), Capital Goods (107),
fall behind as the new business logic of a post-carbon economy slowly                                                                       Transportation (103), Materials (96),
but surely redefines the terms of competition.                                                                                              Energy (77)
The question for most managers, investors and analysts has been                                            Country headquarters             United States of America (27.6%), Japan
one of timing. Not surprisingly, conventional wisdom suggests that                                         rank by Absolute Emissions**     (11.0%), China (7.5%), Germany (6.6%),
it is still too early – shareholders could pay a penalty resulting from                                                                     India (5.3%)
the significant investments required to transform core processes
                                                                                                          *Average
and product portfolios for low-carbon markets that have not yet fully
                                                                                                          **Top 5 sectors/countries only
materialized or technologies that are still rapidly evolving. While there
could be significant consequences for being late, those consequences
could be many years away.
However, given the decade or longer time frame required for most major
emitters to successfully migrate their operations to embrace this new
business logic, it is increasingly difficult to rationalize delay. This is true
even though, for many of these emitters change admittedly will require
significant disruption in current business models.
Companies such as Total, Ingersoll Rand, Toyota, Iberdrola and Xcel
Energy, among a small but increasing group of others, are executing
on strategies to diversify and decarbonize their business models in
heavily carbon-intensive sectors. Their plans, begun a decade or more
ago, have proven business results and provide a pathway to a profitable
low-carbon future that stretches to 2050 and beyond. Looking at
the G250 as a whole, evidence is accumulating of strategic advantages
among companies demonstrating readiness for leadership in the post-
carbon economy.

1
     homson Reuters and CDP have collaborated on this report to bring together the latest data
    T
    from companies that do report, and the latest estimates for those that do not or incompletely
    report. The finance sector was excluded as there are insufficiently complete estimates on their
    scope 3.
2
    	This is measured against total anthropogenic emissions, including land use of approximately
     52 Gigatons CO2e. This number includes direct, indirect and value-chain emissions (scopes 1,
     2 and 3) adjusted for double counting of 60%.

                                                                                                      3
A THOMSON REUTERS FINANCIAL & RISK WHITE PAPER

Companies in the Global 250 include the Top 15 (rank based on total emissions)
(Figure 2), which alone account for about 10% of global annual emissions.3

Figure 2:                                             Top 15 of the Global 250 (See Appendix 1 and its footnote for full list of Global 250.4, 33)

                                                                                                                                              Revenues             Decoupling   Employment
                                                                            GHG emissions Tons CO2e Scope 1+2+3               GHG Index        Index                 Index        Index
    Rank
    2015     Company Name                                                 2016                2015              2014                                      Baseline 2014 =100
    1        Coal India                                               2,076,244,220       2,014,314,687     1,869,412,290         111                118               107          93
    2        PJSC Gazprom                                              1,176,925,161      1,247,624,306     1,264,855,340         93                 116               124         103
    3        Exxon Mobil Corporation                                  1,098,498,615       1,096,498,615     1,145,083,349         96                 55                58           94
    4        Thyssenkrupp AG                                           953,797,000         954,185,140       955,185,140         100                 95                95          96
    5        China Petroleum & Chemical Corporation                    721,411,029         874,153,506      901,550,000           80                 68                85          126
    6        Rosneft OAO                                               853,709,607         835,868,134      829,849,040          103                 91                88          N/A
    7        Cummins Inc.                                             805,593,388          813,043,062       920,001,660          88                 91                104         101
    8        PETROCHINA Company Limited                                621,336,019         730,924,555      688,790,000           90                 71                 79          95
    9        Royal Dutch Shell                                         734,160,000         698,868,219       735,119,000         100                 55                56          98
    10       Rio Tinto                                                 670,621,000         669,751,731      652,023,000          103                 71                69          85
    11       China Shenhua Energy                                     664,949,000          643,832,223       733,109,000          91                 72                80          98
    12       Korea Electric Power Corp                                 456,346,512         634,243,789      666,588,494           68                 105               153         216
    13       Total                                                    469,545,000         581,900,000       598,400,000           78                 60                 77         102
    14       Petróleo Brasileiro SA – Petrobras                       468,402,442          547,476,491       618,399,435          76                 84                 111        85
    15       United Technologies Corporation                          403,968,529          530,627,775       530,803,247          76                 99                130         96

3
     his is measured against total anthropogenic emissions, including land use of approximately
    T
    52 Gigatons CO2e. This number includes direct, indirect and value-chain emissions (scopes 1,
    2 and 3) adjusted for double counting of 60%.
4
    	GHG Index above 100 indicates increasing emissions trend; Revenues Index above 100
      indicates increasing revenue trend; Decoupling Index above 100 indicates revenues increasing
      faster than emissions; Employment Index above 100 indicates increasing employment trend.

                                                                                                     4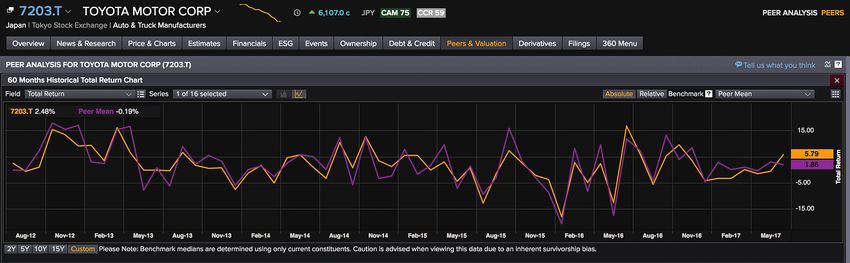
A THOMSON REUTERS FINANCIAL & RISK WHITE PAPER

LEADERS OF THE NEW BUSINESS LOGIC: LESS MAKES MORE

Becoming a leader on climate impact management requires                                                                                As was true in the past, disruptive forces on the competitive
solving two related challenges:                                                                                                        landscape – like quality, technology and globalization – over time
                                                                                                                                       become business requirements. Once relatively unique capabilities
Challenge 1: What must a leader do?
                                                                                                                                       become corporate ”must haves” they lose much of their power as
Borrowing from recent WRI and Thomson Reuters analysis, leaders
                                                                                                                                       differentiators.
must develop strategies to run their businesses in line with the latest
scientific guidance on climate change. That is, they must envision a                                                                   We are at the knee of a multi-year curve on managing climate impact.
future strategy for their firms that meets customer needs and share-                                                                   As Goldman Sachs states in their recent report,6 “Core to our thesis is
holder demands for continued growth and profitability, while at the                                                                    that the Low Carbon Economy is emerging through a series of rapid
same time reduces aggregate emissions across all scopes linearly at                                                                    technology shifts in select, carbon-intensive industries.” The potential
about 3% per year according to the latest scientific guidance. This first                                                              for successful execution of a robust climate impact strategy to drive
dimension of leadership on climate impact can be called “Science-Based                                                                 business value and competitive advantage is likely to be greatest
Climate Goals” or SCGs. One example of the kind of leadership is The                                                                   in the next decade, before operating in a new low-carbon business
Science-Based Target Initiative. More than 300 companies are using                                                                     environment becomes a ubiquitous requirement.
this coalition's methods to define and commit to achieving such targets.
                                                                                                                                       In Figure 3, the shaded area represents an increasing growth opportunity
Other companies have aggressive decarbonization strategies in line
                                                                                                                                       over the next decade for any company in the G250 to capture the
with IPCC guidance, although not part of the Coalition. In either case,
                                                                                                                                       potential benefits of the Sustainability Premium. It’s really a once-in-
leadership requires setting in motion the strategy and measuring the
                                                                                                                                       a-century opportunity at a time of dramatic technological, regulatory
progress for deep decarbonization.
                                                                                                                                       and planetary change.
Challenge 2: Execution … How can a leader do it?
Among the G250, leadership requires transforming a large                                                                               Figure 3:          Forces Driving Post-Carbon Economy
complex business whose carbon-heavy product and operating
models have evolved through decades of experience. Success-
                                                                                           HI
fully implementing SCGs requires developing new capabilities,
processes and products, and sustaining positive change across
longtime horizons, often across multiple C-suite changes. For
                                                                                     Intensity of Sustainability Premium Drivers

companies that sustain their commitment to innovation that
results in decarbonization – such as Philips in super-efficient                                                                              A Window of Opportunity
lighting or Boeing in commercial aircraft – valuable innovation                                                                            for a Sustainability Premium
and competitive differentiation can result.
                                                                                                                                                                                        Sustainability Drivers:
In past decades, many companies saw opportunities for                                                                                                                                   Extreme Climate Events
competitive advantage by adopting advances in quality,
                                                                                                                                                                                        Regulatory Change
technology and globalization strategies, to name a few. In                                                                                                                              Energy & Cost Advantages
many cases, firms translated effective execution of these
                                                                                                                                                                                        Increasing Consumer
innovations into market success, as Toyota demonstrated with                                                                                                                            Preference
their world-renowned quality method, the Toyota Way.5 Similarly,                                                                                                                        Early Adopters
decarbonization and, more broadly, sustainability strategy
have the potential to drive a “Sustainability Premium” (Lubin
and Esty, MIT Sloan Review, 2014). As defined by Lubin and
Esty, a Sustainability Premium is reflected in a measurable                                LO
and durable driver of enhanced business value from the
successful execution of a company’s integrated business and
sustainability strategy.                                                                                                                   2010                      2025                 2040

                                                                                                                                                                Approximate Timeline

5
     ttp://vedpuriswar.org/Book_Review/The%20Toyota%20Way.pdf
    h
6
    T
     he Low Carbon Economy, Technology in the Driver’s Seat. http://www.goldmansachs.
    com/our-thinking/pages/new-energy-landscape-folder/report-the-low-carbon-economy/
    report-2016.pdf

                                                                                                                                   5
A THOMSON REUTERS FINANCIAL & RISK WHITE PAPER

As analysts and observers of the critical transformation that                                                And returning to Goldman Sachs’ recent report on the emerging low-
businesses must undertake, our task is to provide signals to corporate                                       carbon economy, consider this summary of the scale of the impact:
leaders, investors and policy makers about the potential value of
                                                                                                                “More than meets the eye: One-fourth of equities could be
decarbonization strategies and the progress companies are making
                                                                                                                 affected by 2025.”
with execution. The place to begin is reviewing the conventional
wisdom that suggests a business cost for environmental performance,                                             “The technologies that we focus on directly transform only relatively
rather than potential positive synergies.                                                                        small sectors in our coverage; in terms of GICS industries, primarily
                                                                                                                 autos and electrical equipment (note that some solar companies
SIGNALS FROM THE GLOBAL MARKETPLACE:
                                                                                                                 are also classified as semiconductor firms or utilities). However,
IS CONVENTIONAL WISDOM WRONG? COULD IT BE UPSIDE DOWN?
                                                                                                                 extensive supply chains tie these industries to a much broader
Increasingly, investors7 see the value creation potential from companies                                         set of sectors, comprising roughly a quarter of our coverage. We
that are transparent on their emissions and offer product portfolios                                             believe investors should be as vigilant about the implications of
designed to compete in the emerging low-carbon economy.8 Investors                                               low-carbon technologies along these supply chains as they are in
themselves are also coming under increasing regulatory pressure to                                               the markets in which they take share.”10
disclose the carbon footprint of their own portfolios. It’s no accident that
                                                                                                             Adding to this investor view that climate change matters for a
one of the largest investors in the world is contributing to this report:
                                                                                                             significant portion of the global marketplace, and that it presents
State Street Global Exchange.9
                                                                                                             a transformative opportunity, a growing body of work from global
     Mark McDivitt, Managing Director, Head of ESG Solutions, State                                          consultancies like KPMG, PwC and Deloitte strongly suggests the
     Street Global Exchange, part of a firm with $28 trillion in assets                                      underlying business opportunity. Dennis Whalen, leader of KPMG’s
     under custody and administration and $2.5 trillion in assets under                                      Board Leadership Center, summarizes: “As we cross the threshold to a
     management, offers the following observations from an investor                                          lower-carbon world, there is a growing recognition of risks associated
     perspective on carbon-intensive business models:                                                        with long-term carbon-intensive business models. Early movers that
                                                                                                             invest now in staying competitive in a low-carbon future can gain
     • The Paris Agreement, unlike Copenhagen, Kyoto, and other
                                                                                                             significant advantages as they integrate lower-cost, lower-risk and
       COP gatherings, drove home the point that the private sector,
                                                                                                             more resilient business models.”
       partnered with individual Country Intended Nationally Determined
       Contributions (INDCs), will be the impetus needed to start to limit                                   And similarly, the conventional wisdom from the global legal
       overall global warming.                                                                               community is shifting towards increasing concern around the risks
                                                                                                             incurred by carbon-intensive business models. David Hackett,
     • There is increasing pressure coming from asset owners, which will
                                                                                                             partner at the global law firm Baker McKenzie, summarizes that
       require global carbon-intensive businesses to disclose their climate
                                                                                                             “Greater marketplace and legal scrutiny lies ahead for major emitters
       risk management plans. These asset owners, including State Street,
                                                                                                             of greenhouse gases, and as the ‘climate leaders’ accelerate their
       are pressing carbon-intensive businesses for transparency on their
                                                                                                             emission-reduction and innovation efforts, the others will find their
       climate risk plans.
                                                                                                             competitive positions increasingly untenable accompanied by the
     • The global investor community will not be limited to “playing                                        growing potential for expanded risk and liability. Charged with the
       defense” with negative screening and divestiture strategies designed                                  responsibility for assessing material risk, corporate boards of directors
       to limit exposure to carbon-intensive assets, particularly those not                                  will find this duty more and more significant in light of the emerging
       positioned to decarbonize in line with scientific and policy guidance.                                risks associated with climate change.”
       Right now, many leading owners, asset managers, endowments,
       insurance companies and hedge funds are “playing offense,”
       investing in innovative leaders in carbon-intensive business sectors
       that are delivering sustainable solutions and above-market returns.
     • The investor community knows that business operations are
       responsible for the vast majority of addressable GHG emissions,
       and it is these same business operators and their owners, among
       other stakeholders, who will experience results of climate change.
     • For global financial players of all stripes, it’s time to answer the
       question “Are you in the game integrating climate impacts into
       investment strategies or are you still on the bench?”

7
     lackRock switch helps pass ‘historic‘ climate measure at Occidental
    B                                                                                                          that perception. In particular, the value-seeking strand of sustainable investing has outperformed
     https://www.reuters.com/article/us-blackrock-occidental-climate/blackrock-switch-helps-                   for quite some time. Going back to the end of 2007, a robust analysis of all the world’s public-
     pass-historic-climate-measure-at-occidental-idUSKBN1882AA; Company climate risk                           facing socially responsible investment funds, then 850 in number, found that positively focused
     disclosure could become mandatory in a few years http://www.reuters.com/article/us-                       value-seeking funds outperformed negative screening funds, as well as mainstream benchmarks
     climatechange-risks-disclosure-idUSKBN18J1QB                                                              including the MSCI World over 1-, 3- and 5- years (Krosinsky/Robins, 2008).“
8
    Cary Krosinsky from the Yale Center for Business and the Environment comments: “Financial              9
                                                                                                                 State Street was founded in 1792 and is the second oldest financial institution in the U.S. It
     performance has been studied for some time as pertains to ESG, but the vast majority                       has approximately $28 trillion in assets under custody and administration and $2.5 trillion in
     of studies fail to take into account the nuances in the field as it is practiced, hence an                 assets under management.
     understandable mantra has emerged where many still assume that one leaves financial                    10
                                                                                                                http://www.goldmansachs.com/our-thinking/pages/new-energy-landscape-folder/report-
     returns on the table by accounting for any of ESG. Fortunately, the truth is very different from            the-low-carbon-economy/report-2016.pdf
                                                                                                        6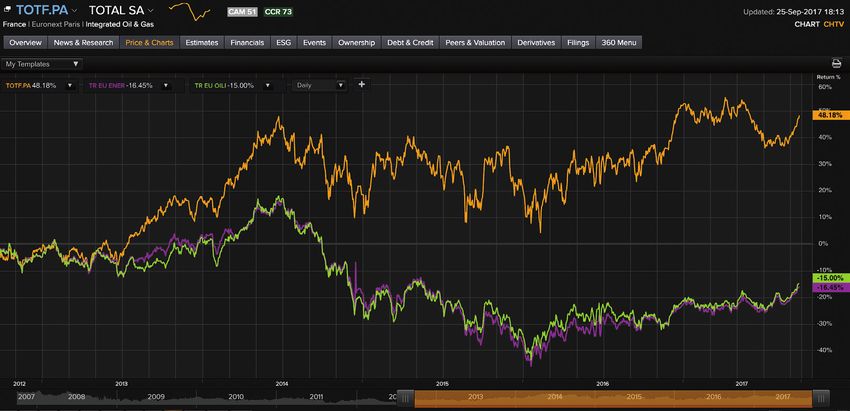
A THOMSON REUTERS FINANCIAL & RISK WHITE PAPER

And on the specific and crucial question of the role corporate                                           performance on a number of key indicators between companies in the
boards must play, we have guidance from Professors Bob Eccles                                            G250 that show leadership as measured by GHG reduction trends,
and Tim Youmans11 on the fiduciary duty owed by boards of directors                                      and those that do not show such evidence. If implementing business
to corporations, which includes considering the material regulatory                                      processes that result in meaningful GHG reductions does indeed
and legal risks as atmospheric concentrations of CO2 continue to rise.                                   create an earnings drag, declines in job growth or negative effects on
Indeed, they urge, “Boards of carbon-intensive emitters can provide                                      shareholder returns, it should be especially evident among the G250.
critical leadership on mitigating emerging regulatory, reputational and
                                                                                                         The results indicate no significant correlation between progress
operational risks.”12
                                                                                                         on reducing GHG emissions and the most common measures of
From a global policy perspective, we are seeing increasing engagement,                                   business performance, such as total shareholder return, P/E ratio,
incentives and opportunity. Norwegian Minister of Climate and the                                        and employment levels. However, as the scatterplots reveal, there are
Environment Vidar Helgesen remarks in the interview printed in full                                      a sizable number of firms that are successfully integrating positive
later in this report that:                                                                               performance on decarbonization with strong shareholder returns
                                                                                                         (see the green dots in Appendix 2).
      “The private sector plays a crucial role in developing zero- and low-
       emission technologies that we need to reach our climate targets.                                  In sum, this review of the conventional wisdom among the G250
       New and improved technologies for solar and wind electricity                                      suggests the need for further inquiry into what is enabling the
       generation, electric vehicles and industrial processes are examples                               success of these global giants as they invest in decarbonizing. Is there
       of areas where we have already seen the private sector make a huge                                a new business logic beginning to take hold even among the world’s
       impact. Changes in the market are happening faster than ever before,                              largest emitters? Is there a Sustainability Premium to be found among
       and the winners will be those capable of transforming to new, green                               firm’s marrying sector-leading returns with meaningful progress on
       solutions. Policy makers globally are increasingly engaging with                                  GHG reductions?13 Of course, it goes without saying that shareholders’
       the private sector to encourage and incentivise this transformation,                              returns are the result of many factors internal and external to the firms
       and those firms which hold on to legacy business models will find                                 in question. However, successful decarbonization may be a contributor
       themselves increasingly at a competitive disadvantage.”                                           to overall performance. To answer these questions, we will need new,
                                                                                                         more nuanced methods for understanding how sustainability strategy
The New Bottom Line
                                                                                                         contributes to performance. Let’s begin by examining several of the
Finally, as explained in detail in Appendix 2, a series of correlational                                 world’s largest GHG emitting firms that have succeeded in creating
analyses was undertaken to better understand the potential benefits                                      competitive differentiation with sustainability and better understand
or costs of leadership on GHG emissions. We compared the financial                                       how they are creating their Sustainability Premium.

11
     For more on the statement, see Eccles’ and Youmans’ survey of the fiduciary duty owed by          12
                                                                                                              https://blogs.thomsonreuters.com/sustainability/wp-content/uploads/sites/15/2017/06/Global-
     boards of directors to corporations, to shareholders and to other stakeholders: Materiality             100-Greenhouse-Gas-Performance-New-Pathways-for-Growth-and-Leadership-2017.pdf
     in Corporate Governance: The Statement of Significant Audiences and Materiality – Journal          13
                                                                                                             O
                                                                                                              f course, there are also the myriad and growing number of analyses demonstrating the
     of Applied Corporate Finance. Also: The Board That Embraced Stakeholders Beyond                         importance of ESG factors to effective risk management and long-term value creation
     Shareholders – MIT Sloan Management Review, Why Boards Must Look Beyond corporations,                   generally, and climate leadership specifically, e.g. Gunnar Friede, Timo Busch & Alexander
     which includes considering the material regulatory and legal risks as atmospheric                       Bassen (2015) ESG and financial performance: aggregated evidence from more than
     concentrations of CO2 continue to rise. Indeed, they urge, “Boards of carbon-intensive                  2,000 empirical studies, Journal of Sustainable Finance & Investment, 5:4, 210-233, DOI:
     emitters can provide critical leadership on mitigating emerging regulatory, reputational and            10.1080/20430795.2015.1118917
     operational risks.”

                                                                                                    7
A THOMSON REUTERS FINANCIAL & RISK WHITE PAPER

THE SUSTAINABILITY PREMIUM:
A NEW BUSINESS LOGIC FOR GROWTH

If, as has been argued herein by us and by others, decarbonization                                          carbon-intensive businesses as they address the challenges and
strategies are a fast-emerging driver of differentiation and competitive                                    opportunities of competing in a carbon-constrained future. Climbing
advantage, it should now be possible to identify companies among                                            the Climate Impact Management Maturity Curve may not be a
the G250 who have advanced such strategies and are now harvesting                                           strategic priority for all firms, especially those whose businesses
business opportunity from them. These leading firms, across multiple                                        have minimal climate impacts. But for the G250, climate impact
business sectors, have combined a far-reaching strategic vision with a                                      management is nothing less than a business imperative.
robust capacity to execute, producing the potential for a Sustainability
                                                                                                            Given the value of time and rate of improvement in assessing the
Premium.
                                                                                                            performance of firms on sustainability and climate impact, CRT
The concept of a Sustainability Premium was developed in earlier                                            adds the “Momentum“ factor to the analysis. For the work described
publications on corporate sustainability by David Lubin and Daniel                                          here, Momentum reflects the annualized rate of change (positive
Esty (The Sustainability Imperative, Harvard Business Review, May,                                          or negative) in CO2e emissions. Taken together, Maturity and
2010, and Bridging the Sustainability Gap, MIT Sloan Management                                             Momentum, (the M2 analytics), represent a new means of assessing
Review, 2014), and by Esty and Winston in their 2006 book, Green to                                         leadership on climate impact and a firm’s potential to develop a
Gold. These works describe how firms successfully build capabilities to                                     durable Sustainability Premium.
envision and execute sustainability strategies, and how such strategies
simultaneously can create shareholder and stakeholder value.14
Gauging the potential for delivering a Sustainability Premium
requires a different approach to assessment – one that is more
dynamic and strategy focused, indexing a growing capacity to
execute. This approach is equally useful to, for example, company
management and investors, each interested in assessing the firm’s
progress on turning climate challenges into opportunities for product
and process innovation that can drive growth and profitability.
New Metrics for a New Business Logic
The disciplines of business and operations management contain
a rich body of work that was first developed in the 1970s and 1980s
to assist firms in optimizing business value from their deployment
of information technology.15 This work describes how firms traverse a
“maturity curve“ as they expand specialized capabilities. Firms that
committed to progressing higher up the curve could, if successful, gain
significant business advantages. For example, among the airlines in
the 1980s, American Airlines stood above its peers on the information
technology maturity curve, as exemplified by the power of its Sabre
reservation system and its pioneering American Advantage frequent
flyer program to drive passenger miles and loyalty. Both showed
American Airline’s sophistication in using technology to change the
terms of competition. Over time, management experts used the
maturity curve approach to analyze other emerging sources of value,
including human-capital management, supply-chain management
and strategy management, to name a few.
Here, we report examples of new work developed by Constellation
Research and Technology (CRT), in partnership with Thomson
Reuters,16 applying maturity curve concepts to aspects of sustain-
ability management. In this case, assessing the progress of large,

14
     It is not surprising that these sorts of innovations are value drivers. Between 1982 and 2007,       15
                                                                                                                h
                                                                                                                 ttps://en.wikipedia.org/wiki/Maturity_model
     the proportion of enterprise value derived from intangible assets among SP500 more than
     doubled from 3x to 85%. Intangible assets are themselves the product of effective execution
                                                                                                           16
                                                                                                                Developed by Constellation Research and Technology, Inc. principals Professor Daniel Esty,
     of strategies – like sustainability strategies.                                                            Professor Jay Emerson and Dr. David Lubin, Thomson Reuters ESG innovation partners

                                                                                                       8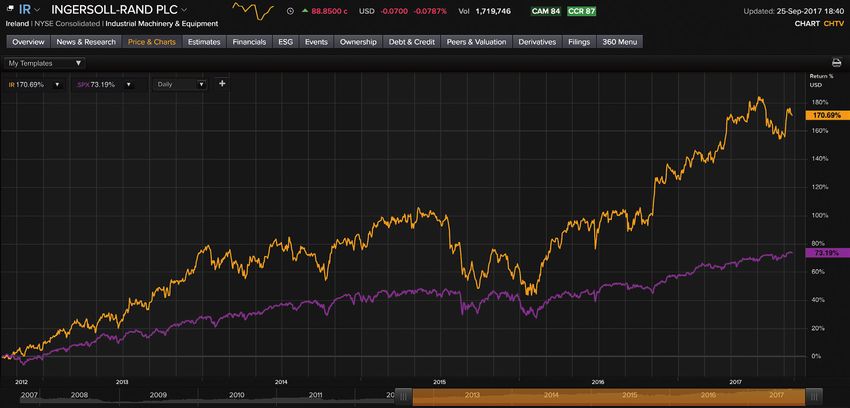
A THOMSON REUTERS FINANCIAL & RISK WHITE PAPER

       M2: Maturity and Momentum Applied to Climate Impact Management (A framework developed by Constellation Research
       and Technology in partnership with Thomson Reuters)
       Maturity level is a measurement of an organization’s capacity for innovation and continuous improvement of core business processes and
       disciplines. Here, increasing maturity reflects the capability to drive long-term deep decarbonization in processes, products and operations
       across all relevant scopes. The higher the level of maturity on climate impact management, the greater the likelihood of the organization
       gaining maximum advantage for itself and key stakeholders.
       The Climate Impact Management Maturity Curve follows from the more general sustainability maturity model. Companies can be classified
       as located at a point in time along a curve demarcated by five stages (and additional sub-stages) as summarized here:

       • S
          tage 0: Pre-engagement – The firm does not show consistent                                       avoid the most serious effects of climate disruption (e.g., in line with IEA
         evidence of engagement on climate impact or recognition of the                                     2-degree emissions guidance or Science Base Goals).
         relevance of climate issues to business operations.
                                                                                                            •
                                                                                                              Step 4: Competitive Differentiation and Cultural Advantage – The
       •
         Stage 1: Initial Engagement – The firm engages on the issue of                                       firm is successfully executing strategies that create competitive
         climate change with relevant policy, procedures and/or broad                                         differentiation and the potential for competitive advantage through low-
         statements of intent.                                                                                carbon innovations in products and/or processes that generate material
                                                                                                              improvements in cost structure, revenue growth and/or business model
       •
         Stage 2: Systematic Management – The firm undertakes systematic
                                                                                                              strength. The firm has built the capacity for continuous improvement of
         management of the issue of climate change by assessing and reporting
                                                                                                              the low-carbon value proposition over time, including across transitions
         facts relevant to its operations and impacts (e.g. GHG reporting, initial
                                                                                                              in management. Corporate culture drives progress.
         goal setting and assessment of its performance relative to peers and/or
         universal standards). Initial proof-of-concept demonstrations of change                            Momentum is a measure of the rate of change over time in a key performance
         pathways provide a business case for advancing up the curve.                                       indicator, normalized or indexed in such a way as to enable comparisons
                                                                                                            between firms on their likely near-to-intermediate future trajectory. The
       •
         Stage 3: Transforming the Core – The firm demonstrates meaningful
                                                                                                            Momentum analysis on Climate Impact Management relies primarily on
         progress and scalable plans for transforming key processes, products
                                                                                                            appropriately normalized multi-year trajectory of the most relevant GHG
         and/or systems needed to optimize on a low-carbon value proposition.
                                                                                                            emissions data for the company.
         Target setting expands in scope and time frame, ultimately consistent
         with the goal of reducing anthropogenic impacts quickly enough to

CASE STUDIES: LOOKING AT LEADERSHIP THROUGH THE M2 LENS: SEEING EVIDENCE OF A SUSTAINABILITY PREMIUM
The GHG-intensive industry leaders profiled below are among the                                             CEO, and the company issued its first Triple Bottom Line Report stating
most significant contributors17 to global emissions.18 In the following                                     that “comprehensive action is needed to address climate change today, in-
discussion, we provide a retrospective analysis describing the pathways                                     cluding greatly increasing our use of resources that produce lower or no CO2
these firms followed to their leadership positions, and growing                                             emissions, increasing our energy conservation opportunities for customers,
evidence of the sustainability premium in their results. They                                               and participating in research and development on carbon sequestration…
demonstrate that viable pathways exist, even in the most carbon-                                            regardless of regulation our company is implementing voluntary carbon
intensive sectors, for a world under 2 degrees C of warming.                                                management target ...” 19
Case Study: Xcel Energy (No. 169 in the Global 250)                                                         By 2005, Xcel’s deployment of renewables accounts for about 9% of
                                                                                                            their energy mix, and is seen as “a cost-effective hedge against more
Let’s begin by mapping Xcel Energy’s climb up the maturity curve in
                                                                                                            volatile fuel prices.” Xcel Energy has begun to focus on capturing
the carbon-intensive utility sector.
                                                                                                            efficiency gains for itself and its customers by rolling out energy-saving
Stage 1: Initial Engagement – Xcel acknowledges climate change as                                           programs that have the added benefit of enabling better demand
a strategic issue. In 2004, the company issued its first carbon manage-                                     management. The capacity and economics of renewable initiatives
ment plan. Then, in 2005, Richard Kelly was appointed chairman and                                          are being actively tested.

17
     Of the fossil fuels, Coal is responsible for the most (24.8%) of GHG emissions, followed by Oil       19
                                                                                                                 h
                                                                                                                  ttps://www.xcelenergxcel%20energy%20csr%202005/
      (20%) and Natural Gas (18.5%) for a total of 63.3% http://www.ecofys.com/files/files/world-                https://www.google.com/search?client=safari&rls=en&q=xcel+energy+2005+CSR+report&
      ghg-emission-flow-chart-2012_v9-c-asn-ecofys-2016_02.pdf                                                   ie=UTF-8&oe=UTF-8
18
      Carbon dioxide (CO2) accounts for 76% of GHG emissions (65% from fossil fuels and
      industrial processes, 11% from forestry and other land use) https://www.epa.gov/
      ghgemissions/global-greenhouse-gas-emissions-data

                                                                                                        9
A THOMSON REUTERS FINANCIAL & RISK WHITE PAPER
Stage 2: Systematic Management – In 2006, Xcel is systematically with a goal of 43% by 2020. Xcel introduced Renewable*Connect in
reporting GHG emissions and launching innovations that meet customer Minnesota and Colorado, a new way for consumers to set the dial
needs while simultaneously delivering benefits on the climate challenge. on purchasing renewable energy for homes or businesses all the way
Programs such as Xcel‘s Solar*Rewards® (to encourage solar usage), up to 100%.
and Xcel’s energy efficiency programs such as Home Smart are In 2017, Xcel‘s investor presentation22 opened with an assertion that
launched. its business strategy enables earnings growth without bill increases
Stage 3: Transforming the Core – By 2010, Xcel reported 10% GHG to its customers resulting from key factors including reduced fuel and
reductions from their 2005 baseline, and confidently set a 20% operating and maintenance costs from its renewables-heavy portfolio.
reduction target by 2020. Energy efficiency savings had grown to 987 Xcel positions its brand with investors, consumers and employees as
GWh of power, and the Solar*Rewards program enrolled more than the leading clean energy provider, with a goal to add another 4,000
7,300 customers.20 Xcel Energy became a founding member of the MW from wind and solar by 2021, pushing its CO2 reductions to 45%
Solar Technology Acceleration Center to build and share knowledge. below 2005 by that year.
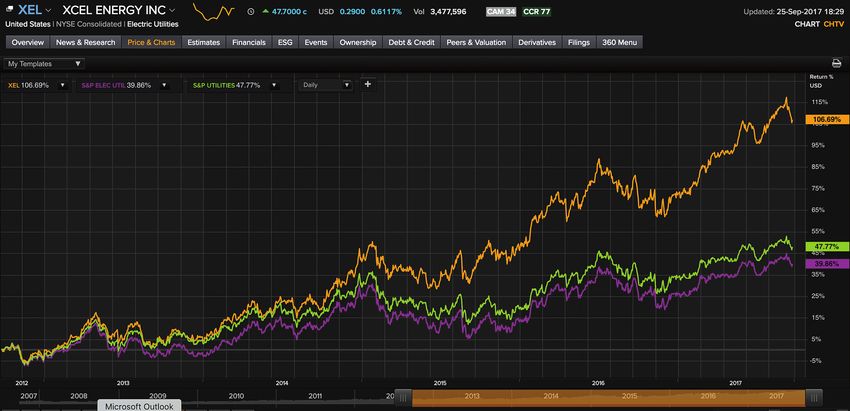
Xcel maintains its commitment to clean energy through a leadership Leadership Reflected in Market Outperformance and
transition in 2011 to its new CEO and Chairman, Ben Fowke. As vision Lower Cost of Capital
becomes reality, the growth rate of the new renewable and efficiency-
focused Xcel was replacing the old business model. Xcel has climbed the maturity curve and has produced total returns
that significantly outperform their peer groups23 (+106% vs. +47%)
Stage 4: New Business Model Creation and Differentiation – over the last five years (Figure 4). This outperformance occurred while
By 2015, Xcel Energy is recognized by the EPA as a climate leader.21 producing a GHG Momentum Score for the 2012-2015 period equating
Emissions have declined 24% from 2005 levels, well ahead of targets, to an annualized rate of decline in CO2e of 4.93% per year.
and the company produced 34% of its total energy from renewables
Figure 4:
Source: Thomson Reuters Eikon
20
https://www.xcelenergy.com/staticfiles/xe/Corporate/CRR2010/index.html2005
21
h
ttps://www.google.com/search?client=safari&rls=en&q=xcel+energy+corporate+social+re
sponsibility+2016&ie=UTF-8&oe=UTF-8
22
X
cel Energy Morgan Stanley Investor Presentation Mar. 2, 2017 Xcel Doc No. 1001220683
10A THOMSON REUTERS FINANCIAL & RISK WHITE PAPER
Xcel also demonstrates best-in-class ranking in terms of its credit-
worthiness vs. its peers, providing lower cost access to capital, a
crucial advantage in this sector 24 (Figure 5).
Figure 5:
Thomson Reuters StarMine® in Eikon
Case Study: Ingersoll Rand (No. 60 in the Global 250) of “green teams“ across the enterprise, discovering deep employee
engagement benefits from participation in the sustainability initiatives.
Ingersoll Rand (NYSE: IR), a leading industrial equipment maker of
Ingersoll Rand established its first set of company-wide sustainability
pumps, compressors, HVAC and refrigeration systems, ranks 60th
goals for energy and waste reductions by 2013.
on our list of major emitters. However, Ingersoll Rand is also a leader
on sustainability, accelerating its efforts in recent years through the Stage 3: Transforming the Core – In 2014, Ingersoll Rand conducted
development of specific goals, targets and strategies surrounding its first materiality assessment of climate and sustainability factors,
sustainability-advantaged product development and significantly integrating the results into their Enterprise Risk Management process in
enhanced operational efficiency. Here is an overview of how they 2015. From this work, an advanced set of sustainability goals was estab-
progressed up the curve. lished, running through 2020 to 2030 on expanded criteria surrounding
climate and environment, as well as related governance, customer, supply
Stage 1: Initial Engagement – Ingersoll Rand first generated a carbon
chain, employees and community considerations.
inventory in 2006, and issued its first sustainability report in 2007. In
2009, Mike Lamach was named CEO and chairman, and soon after These goals drove a $500 million investment in product innovation to
recognized the opportunity to integrate sustainability into the company’s reduce the greenhouse gas refrigerant footprint of its products by 50%.
core strategy and operations. Operational improvements from office buildings, manufacturing facilities
and their fleet would reduce GHG emissions by 35%, all contributing to
Stage 2: Systematic Management – By 2010, Ingersoll Rand had
the avoidance of 20 million metric tons of CO2 by 2020. The CEO and all
formed an External Advisory Council (EAC) on Sustainability and
senior managers’ compensation would be tied to achieving these goals.
expanded the sustainability organization, to drive greater transparency,
coordination across the business and target-setting. This included In 2015, Ingersoll Rand became the first industrial company to
enhanced value propositions regarding climate-related opportunities acknowledge climate risk in the 10-K filing, and confirm further plans
(e.g., product innovations, life-cycle assessments, end-of-life planning, to re-engineer products for a climate-constrained world.
etc.). By 2011 Ingersoll Rand was organizing and tracking the efforts
23
Xcel Energy Morgan Stanley Investor Presentation Mar. 2, 2017 Xcel Doc No. 1001220683
24
Predictive Analytics from Thomson Reuters StarMine Combined Credit Risk Model
11A THOMSON REUTERS FINANCIAL & RISK WHITE PAPER
Consistent with this plan, Ingersoll Rand introduced its EcoWise portfolio continued expansion of the EcoWise portfolio put Ingersoll Rand on track
in 2015. EcoWise is the Ingersoll Rand label for industry-leading products for its 2020 goals. A 29% verified reduction in GHG intensity from opera-
that meet customer needs while reducing climate and environmental tions has already been reported.
impacts at a significantly greater level than alternatives. The EcoWise
During the company’s Investor Analyst Day in 2017, sustainability strategy
portfolio includes products from Trane and Thermo King businesses that
was central to their value proposition, focusing on growth opportunities
use low global warming potential refrigerants and have higher efficiency
and enhanced productivity resulting from Ingersoll Rand’s climate
than comparable legacy products.
commitment and energy efficiency efforts.
In 2016, Ingersoll Rand sought and received validation from the Science
Leadership Reflected in Market Outperformance and
Based Targets Board that its programs and initiatives are consistent
Lower Cost of Capital
with Intergovernmental Panel on Climate Change (IPCC) guidance on
emission reduction. As Ingersoll Rand’s sustainability-driven strategy combines with
enhanced operating results, one can begin to see evidence of a Sustain-
Transitioning to Stage 4: Creating Competitive Advantage –
ability Premium. The new business logic of lower climate impacts and
Fast forward to 2017 – while Ingersoll Rand does not break out cross-
higher financial returns appears to be taking shape at Ingersoll Rand.
division sales from its EcoWise portfolio, our analysis suggests that
The company continues to financially outperform, beating the S&P 500
revenue growth from this line has significantly outpaced growth overall,
on total return over the past five years by fully 132% (+170% vs. 73%)
adding a very positive dimension to the future revenue growth outlook.
(Figure 6).
The company now features their sustainability strategy on their new
homepage, with the tag of “A World of Sustainable Progress.” Product
innovations have resulted in 6.7 million tons of avoided CO2e, and the
Figure 6:
Source: Thomson Reuters Eikon
It’s also demonstrating best-in-class credit worthiness vs. peers (Figure 7).
Figure 7:
Source: StarMine, Thomson Reuters Eikon
12A THOMSON REUTERS FINANCIAL & RISK WHITE PAPER
engineered to deliver climate-advantaged benefits. Given that approxi-
mately 85% of Total’s climate impacts come from product use, meaning-
ful change requires redesigning and transforming its product lines and
energy mix. The 2011 acquisition of a majority stake in SunPower, along
with additional acquisitions in clean energy solutions, including Aquion
Energy (storage technology), Saft (battery design), Stem (energy opti-
mization) and BHC Energy (operational energy efficiency) demonstrated
Total’s commitment to transforming the company’s business model
from a 20th century fossil fuel giant into a 21st century new energy
leader.
Transitioning to Stage 4: Creating Competitive Differentiation –
By 2014, under the leadership of Patrick Pouyanne, Total’s new chairman
and CEO, the company’s strategy to differentiate itself from other oil
majors is fully articulated. Going forward, Total would build its future
business on three strategic pillars:
1. Reducing the carbon intensity of its fossil fuel product mix
2. Investing judiciously in carbon capture, utilization and storage
technologies
Case Study: Total (No. 13 in the Global 250)
3. Expanding their business base in “renewables,“ which includes
Finally, let’s take a closer look at one firm’s journey up the curve,
production, storage and the distribution of clean energy and biofuels
operating in a very challenging business sector: fossil-fuel based
energy. France’s Total S.A. (Total)25 is the fourth largest publicly held The first major step was exiting the coal business in 2015. In 2016, Total’s
oil and gas company in the world and, as such, it is responsible for strategic direction advanced through the rollout of a new organizational
GHG emissions that place it 13th on our list of major emitters. Today, structure creating (among other things) greater focus on renewables
Total is widely recognized as a leader among fossil fuel majors for and low-carbon energy solutions. A newly formed Strategy & Climate
its vision of a new clean energy future and its progress on adapting division was formed to ensure that Total’s business trajectory is kept
a large, complex business for that future. Indeed, Total’s emissions tightly aligned with the IPCC’s 2-degree C scenario, as well as support
performance over the last three years shows reductions well ahead of meaningful public policy actions such as a price on carbon. As Pouyanne
IPCC guidance, with an approximately 20% aggregate decline in total stated in the 2016 announcement, “Our ambition is to create a new
GHG emissions across all scopes.26 business that will help make Total the responsible energy major.”
While it is possible to trace the roots of Total’s climate-related efforts Total’s commitment to low-carbon energy is among the most ambitious
back 20 years or more, our ‘maturity curve’ analysis begins with their of oil and gas majors. Like its peer group, Total faces additional strategic
initial recognition of the challenges that climate change poses for a decisions that will be critical for their ongoing financial success. Having
major energy company, and the need to address them. stated that it will not invest in new high-cost, high-carbon resource
development, expert analysis makes it clear that planned capital expen-
Stage 1: Initial Engagement – In 2006, Total was one of the first major
ditures for the energy majors, including Total, could breach the 2-degree
fossil fuel companies to publicly acknowledge the importance of climate
boundary. Total’s recent acquisition of Maersk Oil, though adding to
change as a global risk. Their initial efforts focused on reducing flaring
Total’s geographic balancing of production and potential for financially
gas in the production process. Significant efforts began on this important
beneficial operational synergies, also adds to a footprint that in the long
source of scope 1 emissions to prove that cost-effective approaches could
term must be reduced.
be broadly implemented for significant reductions.
If Total is to achieve its full Stage 4 potential, it will need to continue
Stage 2: Systematic Management – By 2008, Total began issuing
to demonstrate viable decarbonization pathways consistent with the
systematic reporting on key GHG and climate-related performance
2-degree boundary, and commensurate actual emissions reduction
metrics, including product use. Their efforts set them ahead of many oil
performance through to 2050.
majors, and included initial target setting for improvements in Total’s
operational footprint, driving the twin objectives of further reducing First, this will require sustained rapid growth of its EcoSolutions portfolio
waste and cost, as well as mitigating climate risk. revenues in comparison to the company overall, ultimately making it the
engine for Total’s future financial success.
Stage 3: Transforming the Core – In 2009, Total launched its
EcoSolutions portfolio aimed at offering customers the opportunity Second, investors, analysts and other key stakeholders will be looking for
to meet their energy needs, but doing so with products and services Total’s continued leadership among the oil majors as they address the
25
f the examples of emerging leadership in this report, Total represents an underlying thesis
O
that even the most carbon-intensive firms have the opportunity for transformative business
model change, although in cases like Total’s the challenges are much more significant than
other sectors where underlying asset valuation is not so directly impacted.
26
According to Total completed CDP Climate Change information request submissions
13A THOMSON REUTERS FINANCIAL & RISK WHITE PAPER
potential challenge of so-called “stranded assets.“ saw a 9.2% average annual rate of decline in GHG/BOE (greenhouse gas
emissions/barrel of oil equivalent), between 2013 and 2016, or a cumula-
Total is one of the few energy majors entering the top tier of the Maturity
tive decline of 27.5% from the baseline year of 2013.28 Both aggregate
Curve and, as such, the firm is well positioned to drive continued growth
emissions and the GHG intensity of their footprint are falling significantly.
and financial benefits from their climate impact management strategy.
Total Return and Cost of Capital for a Leader
Leadership Translates into Reduced GHG Impacts
Figures 8 and 9 provide evidence that Total’s strategy, along with it‘s
And the data shows leadership. Total has reduced emissions over the
ability to execute it, is already generating value for the firm.
last three years well ahead of IPCC guidance, with an approximate 20%
aggregate decline (or roughly 130 million tonnes) in total GHG emissions Total significantly outperforms its peers on total return during this period
across all scopes.27 And while emissions declined, Total’s carbon intensity of decarbonization (e.g., 5 year: +48% vs. -15%) (Figure 8).
Figure 8:
Source: Thomson Reuters Eikon
Thomson Reuters Eikon™ platform displays Total’s peer-leading credit renewable and low-carbon solutions, the increasing value of its
rating, represented by the blue dot in the peer-scatterplot (Figure 9). transformed green product portfolio is likely to significantly outpace
This is a significant advantage in the capital-intensive energy sector. As the potential declining value of its traditional high-carbon products.
Total continues to extend its climate impact leadership with more
Figure 9:
Source: StarMine, Thomson Reuters Eikon
27
ccording to Total completed CDP Climate Change information request submissions
A
28
http://www.annualreports.com/HostedData/AnnualReportArchive/t/NYSE_TOT_2015.pdf
14A THOMSON REUTERS FINANCIAL & RISK WHITE PAPER
SECTOR LEADERSHIP USING THE M2 LENS In tailoring the M2 Model for an analysis of the automakers global
Transitioning now from individual case studies to a sector-level performance, the five general maturity stages described earlier are
analysis using the CRT’s M2 lens to help analyze performance on adapted. Each stage has a number of separate sub-stages or steps
climate impact management, we will look at two key sectors for that enable more detailed analysis. Each of the automakers in the
climate: automotive and utilities. G250 has been analyzed to determine stage and sub-stage level.
The Auto Majors Seen Through the M2 Lens – A Key Sector for Summary Description of the Auto Sector Maturity Curve
Managing Climate Impact Stage 0: Pre-engagement – The company has not issued consistent
The major automakers have an important role to play in curbing policy statements or otherwise recognized the need to address
emissions, especially given current and forecasted growth in vehicle climate impacts from its fossil fuel-based products.
ownership and usage. Today the sector produces approximately 93.5 Stage 1: Initial Engagement – The company issues policy statements
million cars and other light-duty vehicles annually, responsible for recognizing the need for climate risk mitigation and enhanced
approximately 17% of annual anthropogenic GHG emissions.29 With resource efficiency, along with initial reporting of climate impact data.
rising incomes in the emerging economies, the total production is
Stage 2: Systematic Management and Goal Setting – The company
expected to grow significantly for the foreseeable future.
expands GHG reporting to include the most relevant scopes, with
verifications, with long-term targets for key portions of the most
Figure 10: G250 M2 Analysis: Automobile Sector material emissions scope.
Stage 3: Transforming the Core – The company establishes global
fleet-level targets for emissions reductions, and demonstrates
significant progress on transforming its (and its key suppliers‘)
manufacturing processes to reduce climate impacts from operations.
The company demonstrates significant progress bringing to market
a changing product portfolio, including a cross fleet range of high-
and ultra-high-efficiency vehicles.
Stage 4: Competitive Differentiation and Cultural Advantage –
The company’s aggregate average fleet emissions place it in the top
tier on fuel efficiency and emissions reductions in the sector. The
company publicly supports policy and regulatory action to reduce
emissions, and builds engagement on climate impact with employees,
customers and other key stakeholders. The company tests and develops
new products and business models that create the potential for break-
through solutions to reduce climate impacts for automobile use.
Momentum Scores are calculated only for companies with reported
and verified or confirmed scope 3 product use data for the relevant
time period (2012 to 2015), producing a normalized annual rate of
change classification based on data from CDP.
NOTE: 2016 scope 3 product use data became available as this report
went to press. This new data will show movement among the players.
Figure 10 will be updated and available online at:
www.constellationresearch.com and at sustainability.thomsonreuters.com
29
http://news.ihsmarkit.com/press-release /global-auto-sales-set-reach-935-million-2017-
risk-greater-ever-ihs-markit-says
15You can also read