WATER IN FIGURES - BENCHMARKING & STATISTICS Denmark - EurEau

Page created by Teresa Weber
 
CONTINUE READING
WATER IN FIGURES - BENCHMARKING & STATISTICS Denmark - EurEau
WATER IN FIGURES
2020

   BENCHMARKING & STATISTICS
                       Denmark
WATER IN FIGURES - BENCHMARKING & STATISTICS Denmark - EurEau
EDITORIAL
      XXX
                       TEXT: CARL-EMIL LARSEN/ PHOTO: DANVA

    The water sector
    as energy and
    climate neutral
    T
            he climate action plan for the water     water sector. The water companies are part of         by an average household for drinking water and
            sector emphasises the message that       the green transition through the innovation of        wastewater has remained very stable over the
            Danish water technology can help         resource efficient, digital and holistic solutions.   last 10 years. In 2019, an average family with
    find solutions to global climate challenges.     These focus on greater efficiencies, energy           average consumption paid € 757 for drinking
    The ambition of the political parties behind     optimisation, reduction of greenhouse gases           water and wastewater, representing a decrease
    the agreement is for the water companies in      and the production of green and sustainable           of 2% compared with 2018. Although the price
    Denmark to be energy and climate-neutral. The    energy. Equally, DANVA's members are seeking          of water rose on average by 2.6% to € 9.55/
    key figures for the water sector show that the   to become climate-neutral and thereby help            m3, this increase was offset by a drop in water
    water companies are already well on the way      meet the ambitious objectives set for Denmark.        consumption, which achieved its lowest level
    to achieving this.                                   The water companies are also ambitious            so far of 101 litres per person per day.
       The Danish Parliament has resolved that       concerning the requirements set by society for            DANVA's benchmarking shows that the
    Denmark should reduce its CO2 emissions          managing wastewater discharges. The summer            water companies act in an optimal manner and
    by 70 percent by the year 2030. The main         of 2020 has seen a debate on overflows and            exactly in line with the wishes of the politicians
    greenhouse gas emissions from the wastewa-       discharges and, although the sector is only           at Christiansborg. It therefore makes a lot of
    ter sector derive from nitrous oxide in the      responsible for 10 percent of the average nitro-      sense to lower the bureaucratic burden on the
    treatment process. Nitrous oxide is 298 times    gen outlet into aquatic environments (whereas         water sector, which devotes a lot of resources
    more harmful to the ozone layer than CO2.        agriculture is responsible for 60–70 percent), it     to unnecessary administration and documen-
       DANVA's members are already well ad-          is nevertheless critical that the situation meets     tation. If the tariffs are reasonable, the targets
    vanced in the process, and DANVA's new strat-    the requirements of a modern society. If better       met, and water customers satisfied, politicians
    egy for 2020–2024, adopted by the annual         treatment of wastewater is what is desired, the       should work to create a less zealous, resource
    general meeting in May, is a stepping stone on   politicians must make the necessary demands.          consuming bureaucratic system, which, after
    the way towards a climate and energy-neutral         Measured in fixed prices, the amount paid         all, only results in higher costs and higher
                                                                                                           water prices.
                                                                                                               The key figures also show that Danes have

      DANVA and DANVA Benchmarking                                                                         access to tap water practically 24 hours a day,
                                                                                                           365 days of the year. In 2019, average availa-
       DANVA, the Danish Water and Wastewater Association, is an industry organi-                          bility was in excess of 99.99 percent. Danes,
       sation for drinking water companies and wastewater companies in Denmark.                            on average, were without access to water for
       DANVA is a non-profit association, funded by its members and through income
                                                                                                           only 40 minutes out of the 525,600 minutes
       generating activities.
         DANVA has been offering benchmarking to its members for almost 20 years.                          of the year.
       Benchmarking is a tool to provide an overview of the company's performance                              Denmark has one of the lowest levels of wa-
       and to identify DANVA and DANVA Benchmarking areas where efficiency can be                          ter losses in the water destribution systems in
       improved. The reporting to DANVA Benchmarking and Statistics forms the basis                        the world and, apart from a slight increase in
       for the preparation of this publication. In total, 162 drinking water and waste-
                                                                                                           2018, due to the very dry summer, water loss is
       water companies have participated in the reporting to "Water in Figures 2020",
       with data from 2019. The participating drinking water companies collectively                        again right down. In 2019, it was down to 7.29%.
       supply water to around 60% of the Danish population. Collectively, the partici-                         Water companies are among society's most
       pating wastewater companies handle and treat water from around 80% of the                           important actors and, with their targeted, effi-
       Danish population.                                                                                  cient management, fully meet the expectations
                                                                                                           of customers, authorities and regulators.

2    WATER IN FIGURES 2020
WATER IN FIGURES - BENCHMARKING & STATISTICS Denmark - EurEau
WATER PRICE
How much does
                                                       Half a litre of drinking
                                                        water from the tap

                                                    0.48
                                                          costs less than
water cost?                                                                             Why are there
"How much does water cost?" and "Why does                                               differences in the
                                                                                        water price?
water cost what it does?". These are two good
questions which DANVA is often asked and
                                                            cent
they are not that easy to answer. The price
                                                                                        How much does water cost?
of water is not the same throughout the country. On the one hand, there are
                                                                                        The price of water depends on which wa-
structural differences, such as geological conditions, different customer bases         ter company you use. There are more than
and large differences in investment needs, and on the other hand, the compo-            2,500 water utilities and 98 wastewater
sition of the price may vary from company to company.                                   utilities in Denmark. Contact your local water
   Legislation states that the companies are permitted to charge a fixed annual         company to get your water prices.
                                                                                        The water price consists of a total of five
administrational fee and must charge a variable fee per m3 of water consump-
                                                                                        elements:
tion. The pricing scheme therefore has a major bearing on the cost of one m3            • Fixed charge for drinking water (if any)
of water consumed. Some companies charge a fixed annual base charge on                  • Cubic metre price for drinking water
water and/or wastewater, while others only charge for the amount of water               • Fixed charge for wastewater (if any)
consumed, and this results in considerable variation when the price for one             • Cubic metre price for wastewater
                                                                                        • VAT and other fees
m3 of water consumed is calculated. The fixed, annual base contribution is
paid per household (and not for example per person). A set consumption                  Why does the price of water vary?
amount must therefore be assumed in order to be able to state the cost of one           There is quite a gap between the lowest and
m3 of water consumed. This is why we calculate that average price, is which             highest prices among the water companies.
an average household would pay based on average consumption. In this way,               In general, the difference in total prices can
                                                                                        be attributed to several factors:
we can compare the price across companies regardless of the pricing scheme
                                                                                        • It can be relatively less expensive to supply
each company uses.                                                                         water to water consuming industries than
   The average price for water in Denmark in 2019 was € 9.55 per m3, based                 small customers, such as holiday homes.
on an average household size of 2.15 people with an average household water             • Geological conditions can make it more
consumption of 101 litres per person per day. For a single person, the average             expensive to collect water from below the
                                                                                           ground.
price of one cubic meter of water is slightly higher, namely € 10.67 per m3 at a
                                                                                        • In some places, groundwater pollution
consumption of 50 m3, since the fixed charge increases the average price more              and scarcity of water resources may mean
at low consumption. The average price per m3 for a family with three children              investing in new groundwater abstraction
is somewhat lower, namely € 8.52 per m3, based on an annual consumption                    areas for water extraction.
of 170 m3. The average water price has increased by 2.68% compared with the             • Some drinking water companies spend
                                                                                           more than others on groundwater protec-
previous year's price of € 9.30/m3. The increase for the year was attributed to
                                                                                           tion. Other companies are "born lucky”, as
a number of issues, including the decrease in water consumption, which, due                their water abstraction areas are already in
to the fixed charge, results in an average increase in the m3 price.                       protected nature areas.
   The price of drinking water covers the cost of groundwater protection, ab-           • The treatment requirements for wastewater
straction, processing and distribution of drinking water from the waterworks               depend, in particular, on the natural setting
                                                                                           of the point of discharge for the treated wa-
to customers. The cost of wastewater covers the operation and maintenance,
                                                                                           ter. Requirements are often higher for dis-
renovation and extension of the sewer network, climate protection, operation               charge to vulnerable recipients in freshwater
and maintenance of treatment plants, as well as checks to ensure compliance                areas than for discharge into the sea.
with discharge requirements before being discharged to the recipient.                   • Decentralised wastewater treatment in
                                                                                           smaller plants is usually more expensive
                                                                                           than central wastewater treatment at
AVERAGE PRICE OF WATER BASED ON CONSUMPTION, 2019                                          larger ones.
€/M
€/m³
     3
                                                                                        • Environmental conditions requiring addi-
                                                                                           tional measures.
 Single-person
 households               10.67                                                         • There is a significant difference in the level
                                                                                           of investment from company to company.
 (50 m³/yr)               €/m³
                                                                                           Currently, many companies are investing
                                                                                           in new climate change adaptation meas-
 Avg. Family
 (2,15 persons)                    9.55                                                    ures in order to respond to the increase in
 (79.29 m³/yr)                     €/m³                                                    rain volumes.
                                                                                        • The older a plant is, the more mainte-
                                                                                           nance it requires.
 Family with 3 children
 (170 m3/yr)
                                                                        8.52             • Differences in the level of service are de-
                                                                        €/m³               termined by the municipalities and/or the
                                                                                           companies themselves.
Simple average, based on 212 drinking water companies and 98 wastewater compa-
nies. The price includes VAT and fees. The average water price for 2020, based on the
same water consumption as in 2019, is expected to be € 9.71/m3 for an average family.                       WATER IN FIGURES 2020          3
WATER IN FIGURES - BENCHMARKING & STATISTICS Denmark - EurEau
Selected rules, national plans and re-

                                                                                                                                                 101
       WATER CONSUMPTION
                                                                                                                                                                                                                                 forms that have had an impact on the
                                                                                                                                                                                                                                 price and water consumption of a family:
                                                                                                                                                                                                                                 •	1987: Action Plan for the Aquatic En-
                                                                                                                                                                                                                                     vironment I – the plan was intended
                                                                                                                                                                                                                                     to protect the aquatic environment,
                                                                                                                                    litres is the average amount                                                                     both groundwater and surface water.
                                                                                                                                        of water a person uses                                                                       The Action Plan for the Aquatic En-
                                                                                                                                                                                                                                     vironment gave rise to the need for
                                                                                                                                       per day in a household.                                                                       major construction and upgrading of
                                                                                                                                                                                                                                     wastewater treatment plants.
                                                                                                                                                                                                                                 • 	1993: Tax on tap water (DKK 5/m3)

    Water consumption reaches a
                                                                                                                                                                                                                                     as well as a penalty tax for drink-
                                                                                                                                                                                                                                     ing water companies with a water
                                                                                                                                                                                                                                     loss of over 10% – Act No. 492 of

    new record low                                                                                                                                                                                                                   30/06/1993 (Danish Ministry of Taxa-
                                                                                                                                                                                                                                     tion).
                                                                                                                                                                                                                                 •	1996: Tax for wastewater – Act No.
    In a household, one person uses on average                                                                together serve 3.301 million inhabitants.                                                                              490 of 12/06/1996 (Danish Ministry of
                                                                                                                                                                                                                                     Taxation).
    101 litres per day, which is a new record                                                                 The graph presents some of the laws and
                                                                                                                                                                                                                                 •	1996: Requirements for installation of
    low. Since the introduction of Action Plan                                                                regulations which are believed to have influ-                                                                          water meters – Executive Order No.
    for the Aquatic Environment I in 1987, av-                                                                enced the decrease in water consumption                                                                                525 of 14/06/1996 (Danish Ministry of
                                                                                                                                                                                                                                     Climate, Energy and Utilities).
    erage water consumption in households                                                                     and price trends. At first glance, it appears
                                                                                                                                                                                                                                 •	1998: Action Plan for the Aquatic En-
    has been constantly decreasing, though                                                                    that Action Plan for the Aquatic Environ-                                                                              vironment II – the plan was mainly in-
    with small variations. The record tempera­                                                                ment I in particular, with increased envi-                                                                             tended to reduce nitrogen emissions.
                                                                                                                                                                                                                                 •	2004: Action Plan for the Aquatic
    tures of summer 2018 resulted in a slight                                                                 ronmental awareness among consumers
                                                                                                                                                                                                                                     Environment III – further reduction of
    increase in water consumption, but in 2019                                                                combined with an increase in the waste-                                                                                nitrogen and phosphorus emissions.
    it decreased again to its lowest level yet.                                                               water tariff, marked the beginning of the                                                                          •	2007: Municipal reform – reduced the
                                                                                                                                                                                                                                     number of municipalities from 271 to
        Total water consumption in 2019 meas-                                                                 decrease in water consumption in 1987.
                                                                                                                                                                                                                                     98, resulting in the merger of many
    ured in households, holiday homes, busi-                                                                  The introduction of a drinking water tax on                                                                            water utilities.
    nesses, institutions and through water                                                                    piped water meant that in the period from                                                                          •	2009: The Danish Water Sector Re-
                                                                                                                                                                                                                                     form Act – the separation of munici-
    losses was on average 59.85 m3 per person                                                                 1994 to 1998 one krone was added to the
                                                                                                                                                                                                                                     pal water and wastewater supply ac-
    per year. Households accounted for 66%                                                                    tariff each year. During the same period,                                                                              tivities into municipally owned public
    of the total volume of water sold. An indi-                                                               domestic water consumption decreased by                                                                                limited companies (water companies)
                                                                                                                                                                                                                                     and the introduction of price caps
    vidual uses an average of 36.88 m3 per year,                                                              10.5%. Water consumption in households
                                                                                                                                                                                                                                     and efficiency requirements – Act No.
    corresponding to 101 litres per day. The                                                                  decreased by 41% over the 31 years since                                                                               469 of 12/06/2009 (Danish Ministry of
    calculation is based on statistics supplied                                                               the implementation of Action Plan for the                                                                              Climate, Energy and Utilities).
                                                                                                                                                                                                                                 •	2011: Introduction of drinking water
    by 64 drinking water companies, which                                                                     Aquatic Environment I.
                                                                                                                                                                                                                                     charge of 8,97 cent per m3 – Act No.
                                                                                                                                                                                                                                     1384 of 28/12/2011 (Danish Ministry
                                                                                                                                                                                                                                     of Taxation).
    CONSUMPTION OF DRINKING WATER, 1976 - 2019
    M /PERSON/YEAR
      3
    m³/person/year
                                                                                                                                                                                                                                                                                                                         140
                                                                     Action Plan for the                        Charge on                 Charge on Environmental                                  Environmental                              Water
                                                                   Aquatic Environment                         piped water                 emitted plan for water II                              plan for water III                        sector act
                                                                                                                                            waste                                                                                                                                                                        120
                                                                                                                                          water from
                                                                                                                                          purification Requirement                                                      Municipal                                 Contribution to
                                                                                                                                            plants       for water                                                       reform                                   the protection                                         100
                                                                                                                                                          meters                                                                                                 of drinking water

                                                                                                                                                                                                                                                                                                                         80

                                                                                                                                                                                                                                                                                                                         60

                                                                                                                                                                                                                                                                                                                         40

                                                                                                                                                                                                                                                                                                                         20

                                                                                                                                                                                                                                                                                                                         0
    1976
           1977
                  1978
                         1979
                                1980
                                       1981
                                              1982
                                                     1983
                                                            1984
                                                                   1985
                                                                          1986
                                                                                 1987
                                                                                        1988
                                                                                               1989
                                                                                                      1990
                                                                                                             1991
                                                                                                                    1992
                                                                                                                           1993
                                                                                                                                   1994
                                                                                                                                          1995
                                                                                                                                                 1996
                                                                                                                                                        1997
                                                                                                                                                               1998
                                                                                                                                                                      1999
                                                                                                                                                                             2000
                                                                                                                                                                                    2001
                                                                                                                                                                                           2002
                                                                                                                                                                                                  2003
                                                                                                                                                                                                         2004
                                                                                                                                                                                                                2005
                                                                                                                                                                                                                       2006
                                                                                                                                                                                                                              2007
                                                                                                                                                                                                                                     2008
                                                                                                                                                                                                                                            2009
                                                                                                                                                                                                                                                   2010
                                                                                                                                                                                                                                                          2011
                                                                                                                                                                                                                                                                 2012
                                                                                                                                                                                                                                                                        2013
                                                                                                                                                                                                                                                                               2014
                                                                                                                                                                                                                                                                                      2015
                                                                                                                                                                                                                                                                                             2016
                                                                                                                                                                                                                                                                                                    2017
                                                                                                                                                                                                                                                                                                           2018
                                                                                                                                                                                                                                                                                                                  2019

           Households                         Holiday homes                       Business (industry)                             Institutions                 Waterloss (NRW)

    Since 2014, a new category of "holiday homes" has been introduced, which is included among the figures for households.
    1976–1998: Special project: Modelling of water demand in Denmark by Nana Sofie Aarøe – data from 14–30 companies.
    1999–2019: Data from DANVA's calculations for "Water in Figures" – data from 33–116 companies.

4    WATER IN FIGURES 2020
WATER IN FIGURES - BENCHMARKING & STATISTICS Denmark - EurEau
WATER PRICE

Composition of the                                                                   SHARE OF WATER PRICES BY
water price                                                                          CATEGORY, 2019

The average water price can be divided into the drinking water company's

                                                                                      Amount for drinking water:
                                                                                                                    0.85            VAT (drinking water)
share and the wastewater company's share, plus VAT and other taxes. The
other taxes are a tax on piped water and the wastewater tax.                                                        0.64            Taxes (drinking water)

                                                                                             3.22 €/m³
   Out of the total water price of € 9.55/m3, the drinking water company
accounts for 18.0%, wastewater accounts for 52.1%, while 29.9% goes to the
                                                                                                                    1.72            Share for the drinkingwater company
State in the form of VAT and other taxes. The price breakdown including
taxes is as follows:
   The work carried out by the drinking water companies comprises ground-
water protection, abstraction of water from abstraction areas, processing                                           1.27            VAT (wastewater)
and delivery of drinking water, and monitoring of water quality. The share
                                                                                                                    0.09            Taxes (wastewater)
of drinking water corresponds to 33.7% of the total average water price,

                                                                                      Amount for wastewater:
amounting to € 3.22, of which € 1.58 is VAT and other taxes. 32% of the
income the drinking water companies derive from the sale of water comes

                                                                                          6.33 €/m³
from the fixed charge and 68% from variable consumption. 92% of water
companies apply a fixed charge.
    The work carried out by the wastewater companies comprises the oper-                                            4.97            Share for the wastewater company

ation of sewers, rain and stormwater management, operation of treatment
plants and discharge to the recipient. The share of wastewater corresponds
to 66.3% of the total average water price, amounting to € 6.33, of which €
1.35 is VAT and other taxes. The income of wastewater companies comes
from the sewage disposal charge, which is split into 12% from the fixed                                                             Avg. Price for water 9.55 €/m3
charge and 88% from the variable charge. 63% of wastewater companies
apply a fixed charge.

What does your water cost?
On DANVA's website, you will find an               Sector Reform Act. The map shows the m3
interactive map "Vandpriser på dan-                prices for drinking water and wastewater
markskort" ("Water prices on a map                 and the cost for households with average
of Denmark"), which shows the water                consumptions of 50 m3, approximately
price for the 200 largest water compa-             83 m3 and 170 m3. The map is available at:
nies and about 100 wastewater compa-               www.danva.dk/vandprispaadanmarkskort
nies regulated by the the Danish Water

Discount for large consumers
Based on an economic growth plan adopted           • 	Level 2 provides a discount on the regular                  wastewater companies that have a greater
in April 2013, a political decision was made           tariff for water consumption between                        proportion of large water consuming com-
to introduce a wastewater discount scheme              500 and 20,000 m3, corresponding to                         panies. They have had to give discounts to a
for industries with a large water consump-             20% of Level 1.                                             large part of their consumers. The political
tion. The discount scheme, termed the              • 	Level 3 provides a further discount on                      decision assumed that the discount would
"Three-Step Tariffs Model" (an incremental             water consumption over 20,000 m3 of                         be covered by greater efficiencies, but ex-
model), was phased in from 2014 to 2018                water, corresponding to 60% of Level 1.                     perience indicates that residents paid for
and is based on 3 incremental levels.                                                                              some of the discount, as the tariffs for Level
• 	Level 1 is the wastewater companies' regu­     The Three-Step Tariffs Model has affected                       1 have risen more than the average for the
    lar tariffs for the removal and treatment of   the wastewater companies in varying ways.                       companies' many industrial customers.
    wastewater from households and industries.     It has been particularly important for those

                                                                                                                                    WATER IN FIGURES 2020            5
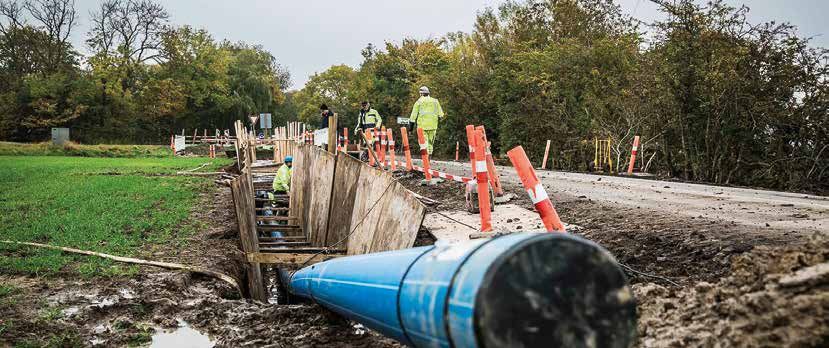
WATER IN FIGURES - BENCHMARKING & STATISTICS Denmark - EurEau
WATER PRICE
                          PHOTO: COLOURBOX.DK / GESTUR LEÓ GÍSLASON

    Household expenditure on water has fallen
    For an average Danish family of 2.15 people,   AVERAGE HOUSEHOLD EXPENSES FOR WATER, 2007 - 2019
    with an average water consumption of 101
                                                   €/M(2019
                                                   €/m3 (2019
                                                          3
                                                                PRICE)
                                                            price)
    litres per person per day, corresponding
    to consumption of 79.29 m3 in a year, the       800

    household's expenditure on drinking water       700
    and wastewater in 2019 was € 757. This is
    the price for being supplied with fresh,        600

    clean, inspected drinking water and for         500
    removing the wastewater that is properly
    treated before being discharged into the        400

    natural environment. This represents a          300
    slight decrease of 2% compared with 2018,
    but in general the expenditure of an average    200

    family household on water and wastewa-
                                                    100
    ter has been at a very stable level for many
                                                      0
    years now.                                                2007   2008 2009    2010   2011   2012   2013     2014   2015   2016   2017   2018   2019

                                                              Drinkingwater      Wastewater     VAT and taxes

    Proportion of                                  The estimate is for an average family of 2.15 people with an average consumption per person of

    income                                         36.88 m3/year.

    The United Nations Development Pro-
    gramme (UNDP) recommends that a
    maximum figure of 3% of gross house-
    hold income may be used for clean
    drinking water, and, for drinking water
    and wastewater together, the maximum
    should be 5%.
       According to Statistics Denmark
    (FU09), in 2018 the average gross income
    of a Danish household was € 85,555.
    The disposable income of an average
    family was € 59,520 and their annual
    expenditure was € 43,070. According to
    Statistics Denmark, such a family spends
    € 632 on water and wastewater, which
    equates to 0.74% of their gross income.
       Of the expenditure of the Statistics
    Denmark average family, an amount of
    € 43,070 (1.47%) is spent on water and
    wastewater. By comparison, the family
    spends 2.36% on electricity, 3.77% on
    district heating, 1.75% on petrol, 1.65%
    on telephones and internet, 3.77% on
    clothes, and 4.73% on insurance.

6    WATER IN FIGURES 2020
WATER IN FIGURES - BENCHMARKING & STATISTICS Denmark - EurEau
DANVA
                                           TEXT: LARS THERKILDSEN AND ANGO WINTHER / PHOTO: CARSTEN ANDERSEN AND AARHUS MUNICIPALITY

We have                                                                                                     DANVA Vision

A DREAM!
                                                                                                            Clean water for sustainable
                                                                                                            cities and societies
                                                                                                            2024 Objectives
                                                                                                            DANVA will work to ensure that the
                                                                                                            water sector can lead the way to-
                                                                                                            wards green transition and create a
                                                       of natural resources, produce 50 percent
                                                                                                            healthy and sustainable society.
                                                       of the world's waste and 60 –80 percent of              DANVA will make Denmark a pi-
                                                       greenhouse gas emissions.                            oneering country for sustainable
                                                          It’s quite obvious that we need to change         water, wastewater and climate
                                                       something. We need to change our depend-             solutions. Biodiversity, resource-effi-
                                                                                                            ciency and integrated administration
                                                       ence on fossil fuels. We need to do away with a
                                                                                                            of the entire water cycle is priori-
                                                       linear economic model in favour of a circular        tised.
LARS THERKILDSEN,          ANGO WINTHER, DEPUTY        one and reuse raw materials, so that we do not          The water sector is to inspire and
CHAIRMAN OF DANVA          CHAIRMAN OF DANVA           accumulate waste and we avoid competing              motivate others to act – locally, na-
                                                                                                            tionally and globally.

D
                                                       for the same scarce natural resources. And,
                                                                                                               DANVA will support innovation and
           ANVA now has a new strategy with an         of course we need to reduce our emissions of
                                                                                                            technological development in the
           adapted mission and new vision. The         greenhouse gases, so that we do not damage           water sector and facilitate coopera-
           title is "Clean water for sustainable       our global and local climate further.                tion and knowledge exchange both
cities and society".                                      The water companies must be part of de-           nationally and internationally.
    A vision is a goal which is so far into the        livering the green transition through innova-           DANVA will work to establish the
                                                                                                            framework conditions needed to
future that it is hardly visible at present. It is a   tion of resource-efficient, digital and holistic
                                                                                                            realise our vision: “Clean water for
dream of a better future. And DANVA's dream is         solutions within the overall water cycle. New        sustainable cities and societies”.
"Clean water for sustainable cities and society".      solutions need to be part of developing smart,          DANVA will support the water sec-
    It is a beautiful dream. But, also a chal-         attractive and (not least) sustainable cities        tor’s focus on efficient operations, for
lenging one of its kind.                               and societies. These will focus on greater           the benefit of citizens, society, the
                                                                                                            climate and nature.
    Water (and here we are obviously talking           efficiencies, energy-optimisation, reduction
about both drinking water and wastewater)              of greenhouse gas emissions and the produc-          The DANVA mission:
is currently polluted by many different ac-            tion of green and sustainable energy, and            • To unite all actors in the water
tivities and with xenobiotic substances – far          the water companies must become energy                 cycle towards cooperation on sus-
too many to name. Despite this, in 2020 the            and climate-neutral and take responsibility            tainable solutions.
                                                                                                            • To strengthen all who ensure con-
water companies are delivering clean water to          for contributing to the ambitious climate
                                                                                                              sumer trust in water, efficient oper-
customers in Danish homes and to recipients            objectives set for Denmark.                            ations and high security of supply
in the Danish environment. The companies                  Dreams are a reflection of reality and yet        • To tell everybody about the value
do so thanks to modern technologies, skilled           "Clean water for sustainable cities and soci-          and impact of Danish water solu-
staff and good management, and they do so              ety" is still a vision.                                tions that help sustain life and
                                                                                                              health.
at a reasonable price. We intend to continue              A vision that must be realised through
                                                                                                                      www.danva.dk/strategi2024
with this, as dreams are a reflection of reality.      forward-looking and coherent regulation.
    But if we are to dream, let us dream of a          In the light of ambitious climate objectives,
situation where sustainable cities and society         increasing demand for sustainable solutions
(which, by the way, also comprises the water           and the need for a green transition, regula-
companies) do not pollute water resources              tion needs to ensure that efficient water com-
and the aquatic environment at all, or if they         panies can deliver on a number of bottom
do, then only minimally so.                            lines. Regulation must ensure that the water          For now, it is just a dream, but over the
    The United Nations predicts that by 2050           companies are efficient and at the same time       next four years we at DANVA will work to
two thirds of the world's population will be           create scope for value-creating solutions in       turn this vision into reality, and we are also
living in urban areas. Already today, cities           relation to day-to-day operations, long-term       looking forward to working together with
account for 75 percent of the consumption              construction funding and innovative edge.          our partners over the next four years.

                                                                                                                           WATER IN FIGURES 2020           7
WATER IN FIGURES - BENCHMARKING & STATISTICS Denmark - EurEau
THE WATER SECTOR
                                   GRAPHIC: DANVA

                                                                                                      Climate adaption               Wastewater basin
                                                         Consumers                                                                     (often underground)
                                                                                                     e.g. detention basin
             Water abstraction    Waterwork                                                                                                                              Discharged to
                                                                                                                                                                        the environment
                                                                                                                              Pumping station
        Afforestation                                                                                                        Overflow                                Treatments
                                                                                                                                                                        plant

                                                                                                                            Gabion

                                                          Dis                                                                                  Ra
                                                                tri                                                                                 i nw
                                                                      bu                                                                                   ate
                                                                           tio                                                                                   r
                                                                                 nsm
                                                                                       ain
                                                                                             s

                                                                 S ewe r
                                                                                 system
                                                                                                 s

                Groundwater

    The Danish water sector
    All drinking water in Denmark comes exclu-         treatment plants had a total load of 7.7 mil-                          panies handling more than 200,000 m3 of
    sively from groundwater. The Danish drink-         lion PE and a total capacity of 11.7 million                           water annually, sets requirements on the es-
    ing water sector is highly decentralised and       PE. As much as 94% of wastewater treatment                             tablishment of an economic framework for
    consists of approximately 2,600 public water-      was at tertiary treatment plants, which is the                         each company. At the same time, the Act sets
    works. There are approximately 87 municipally      most advanced type of wastewater treatment                             out a general efficiency requirement and, if
    owned drinking water companies, comprising         plant (MBND and MBNDK). Altogether, they                               appropriate, an additional individual efficiency
    in total of approximately 340 waterworks. The      discharged approximately 614 million m3 of                             requirement for companies handling over
    remainder are private, either as individual        treated wastewater, with DANVA members                                 800,000 m3 of water.
    facilities or combined together into smaller       accounting for 80% of the total volume. The                               The Danish Water Sector Reform Act covers
    utilities with several works. They are usually     treated water volume is highly dependent                               about 225 drinking water companies, which
    owned by consumers. In addition, there are ap-     on annual rainfall, and the discharged water                           collectively sold about 267 million m3 of water
    proximately 50,000 small plants, primarily in      volume in 2018 was affected by the very dry                            in 2019. These companies had a turnover of
    the category "local water supply for single-fam-   summer of that year 2).                                                approximately € 634 million, operating costs
    ily households". In 2018, the total pumped                                                                                of € 191 million, and invested € 266 million
    water volume for public waterworks was 377         Regulation of the water sector                                         in 2019.
    million m3, with DANVA members accounting          The Danish water sector is based on the so-                               The Danish Water Sector Reform Act also
    for approximately 60% of the water volume 1).      called "break even" principle. This means that                         covers approximately 109 wastewater com-
        Wastewater treatment takes place primarily     a company's expenditure and income must bal-                           panies, which collectively treated about 277
    at approximately 110 municipally owned waste-      ance, measured over a number of years. Water                           million m3 of water sold from their catchment
    water companies. There are also discharges         companies are financed exclusively through                             areas in 2019. The companies had a turnover
    from 311,000 residential premises in the cate­     tariffs, and all activities, capital investments and                   of about € 1.22 billion, invested € 846 million,
    gory "scattered building development". These       operating costs are paid by their consumers.                           and had operating costs of € 410 million.
    are permanent residences in open countryside,          Since 2011, the revenues of the water sec-
    allotments and holiday homes.                      tor have been regulated by the Danish Water
        In Denmark, 746 wastewater treatment           Sector Reform Act with a view to promoting
    plants over 30 PE were registered in 2018,         its efficiency.
                                                                                                                              Sources: 1) Groundwater Monitoring 1989–2018,
    which represents a decrease of 27 treatment            The Danish Water Sector Reform Act, which                          GEUS, 2) Point Sources 2018, Ministry of Environ-
    plants compared with the previous year. The        covers all drinking water and wastewater com-                          ment and Food of Denmark.

8    WATER IN FIGURES 2020
WATER IN FIGURES - BENCHMARKING & STATISTICS Denmark - EurEau
THE WATER SECTOR

DEBT ON LOANS TO WATERCOMPANIES
BILLIONS €
Billions €
4,0                                                                                                          The outstanding debt on loans to the water sector
                                                                                                             based on the companies' annual accounts. The
3,5
                                                                                                             data derives from the financial statement balance
3,0                                                                                                          sheets of all municipally owned water companies,
                                                                                                             plus Trefor Vand A/S, Verdo Vand A/S, Rønne Vand
2,5
                                                                                                             A/S and Videbæk Vand A/S. (177 CVR numbers).
2,0                                                                                                          It has not been possible to obtain details of loans
                                                                                                             other than those issued by KommuneKredit for the
1,5
                                                                                                             period from 2010 to 2013. The water companies'
1,0                                                                                                          total debt includes a smaller proportion of short-
                                                                                                             term debt, such as trade creditors, payables to
0,5                                                                                                          group enterprises, mortgages and several smaller
0,0                                                                                                          items.
        2010      2011     2012     2013        2014      2015      2016      2017      2018      2019

               Debt on loans to Kommunekredit          Remaining debt according financial accounting

                              Debt in the water sector
                              New investments in drinking and wastewater companies                       Denmark are extremely good at maintaining compared
                              are much more likely to be financed through loans than was                 with other countries, where prices are often subsidised.
                              previously the case. This is a consequence of regulation of
                              the water sector, where politicians and authorities prefer                 Lifetimes in the regulation are far removed
                              investments by the companies in new plants, pipes, climate                 from reality
                              measures and other assets which in the main are based on                   Water company revenues are regulated via the Danish
                              loans, in order to keep the drinking water and wastewater                  Water Sector Reform Act. Under this regulation, water
                              tariffs down. It is also evident from the graph above that                 companies are obliged to charge for pipes based on a
                              the debt of water companies with KommuneKredit, other                      technically feasible pipe service life of 75 years. In other
                              mortgage finance institutions and banks has been steadily                  words, the regulation assumes that pipes wear out at a
                              increasing since 2010. Borrowing from KommuneKredit                        slow rate and that the water companies will not therefore
                              in particular has been on the increase.                                    need to charge very much each year to cover the costs of
                                                                                                         same. The problem with this is that the actual service life
                              Prices in line with costs                                                  is considerably shorter. DANVA's analyses show that the
                              Water companies may only charge what it costs to deliver                   service lifetime of drinking water pipes is 66 years, and
                              water to their customers. Given that investment in indivi­                 for wastewater pipes, 46 years. The reason for the shorter
                              dual water companies varies from year to year, loan finance                service life may be poor quality of the old pipes, but it
                              is an important tool for ensuring a stable price for custom-               is often due to the fact that the surroundings are under
                              ers. Because plants in the water sector last for a good many               continual change, so that pipes are not in the ground for
                              years, it is important that the bill is split appropriately                their entire technical service life. For instance, the sewer
                              between the generations. This happens automatically if                     network is currently seeing major reallocation due to
                              customers pay for the annual costs incurred in deliver-                    increasing levels of rainfall. The use of a too long service
                              ing water to them and removing wastewater from their                       lifetime in connection with the charging of tariffs is prob-
                              premises. These are, in other words, the annual operating                  lematic, as current customers are not thereby paying for
                              costs, wear and tear at the plants and finance costs. This                 the full costs of wear and tear at the plants.
                              is termed cost-oriented pricing, and is something we in

                                                                                                                                       WATER IN FIGURES 2020            9
WATER IN FIGURES - BENCHMARKING & STATISTICS Denmark - EurEau
THE WATER SECTOR
                                          PHOTO: KLAR FORSYNING

     Economic trends
     The following economic development
     graphs include all drinking water and
     wastewater companies regulated under
     the Danish Water Sector Reform Act having
     a billed water volume greater than 800,000
     m3.
        Danish water and wastewater companies
     are by their nature monopolies which are
     regulated in order to imitate competitive
     conditions. All water and wastewater com-
     panies covered by the Danish Water Sector
     Reform Act are subject to a "break even"
     principle and are regulated based on their
     revenues, i.e. how much they may charge
     their consumers.
        If expenditure exceeds revenue in certain
     periods, loans may be taken out for plants
     and, for municipal companies, for opera-
     tional purposes but only to a very limited
     extent. This is because municipal com-                         Companies that bill more than 800,000           exceed its effective cost levels. In the bench-
     panies are subject to a limited "overdraft                  m3 a year are also subject to TOTEX bench-         marking model, the companies' actual costs
     rule". The Danish water sector therefore                    marking. The benchmarking compares the             (FATO; operating, plant and financial ex-
     has a significantly greater need for working                companies' cost-effectiveness, and this can        penses) are compared with their TOTEX
     capital than sectors which are not subject                  result in an individual efficiency require-        net volume targets (OPEX and CAPEX net
     to the overdraft rule.                                      ment if the company's general revenues             volume targets).

     AFFECTED COST,                                                                                             AFFECTED COST,
     DRINKING WATER                                                                                             WASTEWATER
     Billions €                                                                                                 Billions €
     300                                                         Total actual costs (FATO) are the costs on     1,200
                                                                 which the companies are benchmarked in
     250                                                         the Danish Water Regulatory Authority's        1,000
                                                                 TOTEX benchmarking.
     200
                                                                                                                 800
                                                                 Depreciation is not included in the 2018 and
      150                                                        2019 graphs for drinking water, nor in the      600
                                                                 2019 graph for wastewater, as these figures
      100                                                        had not been published at the time this
                                                                                                                 400
                                                                 publication was being prepared.
      50
                                                                                                                 200
       0
            2011 2012 2013 2014 2015 2016 2017 2018 2019
                                                                                                                    0
             Actual operating cost                                                                                      2011 2012 2013 2014 2015 2016 2017 2018 2019
             Financial cost          Depreciation (regulatory)                                                           Actual operating cost
                                                                                                                         Financial cost          Depreciation (regulatory)

10    WATER IN FIGURES 2020
THE WATER SECTOR

ACTUAL OPERATING COST                                                                                               ACTUAL OPERATING COST
DRINKING WATER                                                                                                      WASTEWATER
Billions €                                                                                                          Billions €
180                                                               The actual operating costs are the part           500

160
                                                                  of the operating costs used in the overall
                                                                  financial benchmarking of the Danish Water        400
140                                                               Regulatory Authority.
120                                                               Actual operating costs are calculated as
100
                                                                  operating costs from the audited financial        300
                                                                  statements excluding depreciation, less
 80                                                               debtor losses, non-controllable costs, ad-        200
 60                                                               justment of provisions included in operating
                                                                  costs, and operating costs from associated
 40
                                                                  activities and the emptying scheme, which is      100
 20                                                               included in the general accounts. The defini-
   0                                                              tion of actual operating costs was revised in        0
       2011 2012 2013 2014 2015 2016 2017 2018 2019                                                                            2011 2012 2013 2014 2015 2016 2017 2018 2019
                                                                  2016, so that it is not completely compara-
                                                                  ble with previous years.

INVESTMENTS DRINKING WATER                                                                                          INVESTMENTS WASTEWATER**
Billions €                                                        Investments are an expression of the ex-          Billions €
300                                                               penditure borne by the companies during           1,000

                                                                  the year. This explains the relatively large       900
250                                                               fluctuations over the years, while deprecia-       800
                                                                  tion has significantly smaller fluctuations, as    700
200
                                                                  investments must be depreciated for up to
                                                                                                                     600
                                                                  75 years.
150                                                                                                                  500
                                                                  *Investments for 2020 and 2021 are budget-
                                                                  ed investments reported to DANVA.                  400
100                                                               **Wastewater companies have not been               300
                                                                  benchmarked by the regulator for the cur-          200
 50                                                               rent year (data year 2019). There is therefore      100
                                                                  no overall calculation of investments for
  0                                                                                                                     0
       2011 2012 2013 2014 2015 2016 2017 2018 2019 2020* 2021*   wastewater companies in 2019. Investments                    2011 2012 2013 2014 2015 2016 2017 2018 2019 2020* 2021*
                                                                  for wastewater companies in the graph for
                                                                  2019 have therefore been extrapolated for
                                                                  the 8 wastewater companies that do not
                                                                  report to "Water in Figures".

INCOME* DRINKING WATER                                                                                              INCOME* WASTEWATER
Billions €                                                                                                          Billions €
600                                                                                                                 1,400
                                                                  The incomes shown in the graphs consist of:
                                                                  •Income from principal activities in the ab-      1,200
500
                                                                  straction, processing, transport and delivery
                                                                  of water                                          1,000
400
                                                                  • Transport, processing and removal of
                                                                     wastewater                                      800
300                                                               • Other income from principal activities
                                                                                                                      600
                                                                  • Financial income
200
                                                                  • Profit from affiliated companies                  400
                                                                  •P  rofit from activities with statutory re-
 100                                                                 quirements for independent accounting            200
                                                                     included in the principal activities.
   0                                                                                                                       0
       2011 2012 2013 2014 2015 2016 2017 2018 2019                                                                             2011 2012 2013 2014 2015 2016 2017 2018 2019

Data for the above tables cover all water and wastewater companies with a billed water volume exceeding 800,000 m3. This means it only applies to
those companies that are covered by the TOTEX benchmarking of the Utility Secretariat. These involve 74 drinking water companies and 103 wastewa-
ter companies. The bars in the graphs are presented at current prices, whereas the curves are at fixed prices.
*The Utility Secretariat changed the definition of income in 2017. Prior to 2017, total income from primary activities was calculated in such a way that
connection charges and other items were netted. Since 2017, the definition of income has been changed from "Total income from primary activities"
to "Actual income". One of the major changes is the recognition of connection charges, which is assumed to be one of the reasons for the significant
increase in income from 2016 to 2017.

                                                                                                                                                   WATER IN FIGURES 2020                  11
THE WATER SECTOR             TEXT: JENS PLESNER, DANVA / PHOTO: COLOURBOX.DK

     NEW REGULATIONS
     for managing water from
     cloudbursts
     Two steps forward – and two steps back for climate adaptation!

 I
        t is an important task for water companies    pay municiplaities to construct cloudburst     pay at least 25% of the part of the costs that
        and municipalities to be being able to man-   roads, water courses and recreational areas    relate to discharge of stormwater.
        age the large volumes of water that comes     to stor rainwater temporarily.                    This has led to a sizeable drop in invest-
     with cloudbursts. The huge cloudburst over          An evaluation conducted by the Danish       ment in cloudburst roads, watercourses etc.
     Denmark's capital district in the summer of      Environmental Protection Agency in 2017        in towns and cities to deal with water from
     2011 resulted in damage costing around €         showed that such solutions at ground level     cloudbursts, although the construction of
     803 million in total.                            amounted to, on average, 25% of the invest-    such facilities, as documented, is often much
        Following this, the Danish Parliament         ment costs that would be necessary for con-    cheaper than providing sewer systems. In
     passed legislation in 2013 that provided         structing sewers underground to manage         addition, climate change continues apace,
     new and additional possibilities for water       equivalent volumes of rainwater.               with the result that it is ever more urgent to
     companies and the municipalities to manage                                                      deal with cloudbursts in our towns and cities.
     the volumes of water associated with cloud-      New regulations expected at the                   The new regulations will allow water com-
     bursts, followed by provisions for associated    beginning of 2021                              panies to once again be able to finance 100%
     financing.                                       Due to problems with current regulations,      of the costs relating to rainwater handling
        With the new legislation in 2013 it became    new regulations have now been proposed,        investments in watercourses and cloudburst
     possible for water companies to pay mu-          which are scheduled to come into force         roads in urban areas, as was the case prior to
     nicipalities and private entities to establish   on 1 January 2021. One of the problems is      2016. The regulations also indicate that mu-
     other types of installations for handoling       that since 2016 water companies cannot         nicipalities or water companies conduct so-
     rainwater on the surface, compared to the        pay more than 75% of the investment costs      cioeconomic analysis, to ensure that climate
     traditional discharge to underground sew-        involved in discharging rainwater to surface   adaptation is undertaken to an appropriate
     ers. For examble, water companies could          solutions. The municipalities must therefore   level in socioeconomic terms.

12    WATER IN FIGURES 2020
THE WATER SECTOR

  The new regulations contain a number of        in the case of an extension/reallocation of         adaptation by transferring money from
good suggestions and will be capable of pro-     the sewer system and in the case of invest-         other important tasks, such as treatment of
moting climate adaptation. Unfortunately,        ments in solutions on the surface, e.g. in a        wastewater from households and businesses.
however, there are also some elements that       cloudburst road.
may stand in its way.                                One of the problems is that the costs the       More bureaucracy
                                                 water companies incur in establishing the cli-      In addition to the poorly designed efficiency
Savings on the water price are prioritised       mate adaptation facilities will not be covered.     requirements, the new regulations pave the
over damage caused by cloudbursts                If a company is to implement a project that         way for extensive annual reporting and docu­
Because they are by nature monopolies, the       costs € 13.4 million, it has to collect the money   mentation requirements to the state finan-
water companies are subject to financial regu­   from its consumers over the subsequent 25           cial regulator in respect of the individual
lation by a state regulator, the purpose being   years. However, because an efficiency require-      water company's climate adaptation projects.
to make the companies ever more efficient.       ment is imposed on the company each year,           Such requirements do nothing to promote
   The new regulations also envisage impos-      this has the consequence that over those 25         climate adaptation by the water companies.
ing efficiency requirements on climate adap-     years it is only entitled to collect € 11 million      With this combination of efficiency re-
tation projects on the surface. Up until now     from its consumers, even though the actual          quirements and documentation require-
they have not been subject to efficiency re-     cost is € 13.4 million. The water company thus      ments, the draft new regulations prioritise
quirements. The way in which the efficiency      sustains a loss of € 2.4 million on this one pro-   short-sighted savings on water prices over
requirements are imposed on the companies        ject alone. This is not a sustainable solution.     the huge costs in terms of damage resulting
will mean that instead of promoting climate          The result will be that the water compa-        from cloudbursts in conjunction with in-
adaptation, they will be a constraint. This is   nies hold back their investment in climate          adequate climate adaptation. This does not
true in relation to climate adaptation both      adaptation and will have to finance climate         benefit the public!

                                                                                                                      WATER IN FIGURES 2020          13
THE WATER SECTOR
                                   TEXT: ANNELINE HØJRUP, JOURNALIST / PHOTO: KELD NAVNTOFT

     An energy and
     climate neutral
     WATER SECTOR
     The Climate Action Plan stipulates that the Danish water sector is to lead the way in becoming en-
     ergy and climate-neutral. To ensure this, a Danish Paris model is being introduced where the com-
     panies announce their ambitions of their own accord. Minister of the Environment Lea Wermelin
     (The Social Democratic Party) expects great things.

 I
        t was a historic moment when in 2015 the      high ambitions deserves the highest praise. So,         "I have often been on promotion tours
        UN's 195 member states signed the Paris       we have simply taken your word for it”, says        with Danish water technology and Danish
        Agreement, thereby undertaking to limit       Minister of the Environment Lea Wermelin.           companies, and I know that we can make a big
     emissions of greenhouse gases and counter            She also expects the ambitious objective to     impression on the world at large by showing
     global warming. Under the agreement, each        benefit more than just the climate.                 the way here at home. The water sector can be
     country made a legal commitment to submit-           "At a global level, the Danish water sector     the next wind turbine story. At the same time,
     ting a plan for how it would work to reduce      is already known across the world for ener-         I am well aware that not all companies will ne­
     carbon emissions.                                gy-efficient solutions. If the rest of the world    cessarily become energy and climate-neutral
        The Paris Agreement has now left its mark     acts like Denmark, we will save a huge amount       straight away, but that is all the more reason
     on the Danish "Climate Action Plan for a green   of CO2 on a global scale. Not to mention all        to learn from each other and share beneficial
     waste sector". To ensure that the water sector   the green workplaces in Denmark that come           experience."
                                                      with it – as well as the opportunity to reduce
                                                      water shortages globally, and thereby extend        Template and guidance on the way
                                                      a helping hand to achieving global targets”,        In terms of how the companies are to calculate
                                                      says Lea Wermelin.                                  and report their action, the Minister for the
                                                                                                          Environment promises to make tools available.
                                                      Denmark is to show the way                              "Of course, it is important that it should
                                                      The Paris model means that the water com-           be both simple and uniform. For this reason,
                                                      panies themselves must contribute with              a template and guidance designed to help are
                                                      their own ambitions in the field of energy          on their way”, says Wermelin, who does not
                                                      and climate.                                        however expect that the Paris model ought
                                                         "We will get an overview of how the sector       to be made legally binding (unlike the Paris
                                                      as a whole can be expected to be on target,         Agreement).
     takes the international lead in becoming en-     and that will hopefully also result in a ‘race to        "Fortunately, when dealing with Danish
     ergy and climate-neutral, a Paris model for      the top’. I believe in the model, as we can see     water companies there is no need for the same
     water is set to be introduced.                   that those water companies that have focused        legal instruments as when countries that drag
         "In Denmark, the water sector – just like    on energy and climate targets have achieved         their feet are to be measured against climate
     all other sectors – will help us meet our cli-   singular results. Even now, many wastewater         ambitions. We opt for a voluntary approach,
     mate target of 70 percent in 2030. As part of    companies are producing more energy than            and the fact that the proposal comes from the
     the climate partnership for waste, water and     they use, and this resonates at an international    sector itself does of course give reasonable
     the circular economy, the water sector has       level”, says the Minister of the Environment,       grounds to believe that we too will hit the
     proposed a target of becoming energy and cli-    making no secret of the fact that politicians       target”, she said.
     mate-neutral. And the fact that you have such    have high expectations of the water companies.

14    WATER IN FIGURES 2020
FIGURE: DANVA
                                                                             THE WATER SECTOR

                                                     Calculation of
              DRINKING WATER
              – OVERALL LEVEL                        energy
PURCHASED      INTERNAL ELECTRICITY    ELECTRICITY
                                                     consumption
ELECTRICITY                            SOLD          For many years, the focus of Danish drinking
                                                     water and wastewater companies has very much
                                                     been on reducing their energy consumption.
PURCHASED                              HEAT/         Based on several workshops and meetings,
               INTERNAL HEAT/ENERGY
HEAT/ENERGY                            ENERGY SOLD   DANVA has prepared, in collaboration with
                                                     the Danish Environmental Protection Agency, a
                                                     common energy calculation method that allows
                                                     energy consumption and energy production to
                                                     be compared uniformly for the companies at
                                                     a general level.
                                                         The calculation method is included in the
                                                     mandatory performance benchmarking be-
              WASTEWATER – TRANSPORT                 ing undertaken by the Danish Environmental
              – OVERALL LEVEL                        Protection Agency and to which all drinking
                                                     water and wastewater companies covered by
PURCHASED                              ELECTRICITY   the Danish Water Sector Reform Act are re-
                INTERNAL ELECTRICITY
ELECTRICITY                            SOLD          quired to report.
                                                         The calculation method calculates net and
                                                     gross energy consumption based on water sold
PURCHASED                              HEAT/         in the distribution network and the catchment
               INTERNAL HEAT/ENERGY
HEAT/ENERGY                            ENERGY SOLD   areas of the sewer networks and treatment
                                                     plants. It is an indication of how much energy
                                                     is used when a resident purchases 1 m3 of water.
                                                         The calculation method is based on three
                                                     main streams: Energy in (purchased), self-pro-
                                                     duced energy used internally, and energy out
                                                     (sold), plus, for treatment plants, external
                                                     bio­mass in and external heat production. The
              WASTEWATER – TREATMENT                 designation "energy" covers both electricity,
              – OVERALL LEVEL                        heat and other energy. All forms of energy are
                                                     converted to kWh.
PURCHASED                              ELECTRICITY       The calculation method allows overall key fig-
                INTERNAL ELECTRICITY
ELECTRICITY                            SOLD          ures to be produced for the individual company:
                                                     •	Net energy consumption: The difference be-
                                                        tween energy purchased and energy sold,
PURCHASED      INTERNAL HEAT/ENERGY    HEAT/            kWh/m3
HEAT/ENERGY                            ENERGY SOLD   •	Gross energy consumption: The sum of en-
                                                        ergy purchased and self-produced energy
                                                        used internally, kWh/m3
EXTERNAL                               EXTERNAL      •	Net self-supply ratio: Percentage of energy
BIOMASS                                HEAT             sold in relation to energy purchased, %
                                                     •	Total self-supply ratio: Percentage of energy
                                                        sold and self-produced energy used inter-
                                                        nally in relation to purchased energy and
                                                        self-produced energy used internally, %.

                                                                          WATER IN FIGURES 2020           15
BENCHMARKING DRINKING WATER

     DRINKING WATER COMPANIES in DANVA
     Benchmarking and Statistics
     In 2020, 75 drinking water companies reported data to DANVA                selected associated activities. Since 2016, in connection with the
     Benchmarking and Statistics. The figures shown apply to 2019.              implementation of the TOTEX regulation, there has been a change
     Together, the companies have more than 1,885 water abstraction             in the calculation of actual operating costs, which now includes
     wells, comprising 170 source sites, 255 waterworks and 31,739 km           operating costs for environmental and service objectives, part of
     of supply pipes. The participating companies abstracted about 218          the previous 1:1 costs and any selected related activities.
     million m3 of drinking water and supplied 3.40 million people.                 From 2010, since the implementation of the price cap regulation
     The total investments and costs excluding taxes amounted to                under the Danish Water Sector Reform Act, the companies only
     approximately € 208 million and the actual operating costs were            received efficiency requirements for the actual operating costs, so
     just over € 143 million. (see the participants' basic data and overall     that they would aim to continuously minimise their operating costs.
     key figures at the end of this publication).                               Following the switch to the TOTEX regulation, where the efficiency
                                                                                requirement includes both operating costs and investments, there
     The drinking water companies' actual operating costs                       is not the same focus on significantly reducing operating costs. It
     remained stable                                                            is always a balancing act between whether the companies should
     Actual operating costs of drinking water companies (FADO) nei-             maintain their current equipment or invest in new equipment.
     ther increased nor fell compared with 2018. Actual operating
     costs for 2018 are € 0.63 per m3 of drinking water sold. Actual            Total investments increased again
     operating costs are governed by the Danish Water Sector Reform             The statement of drinking water companies' investments im-
     Act's requirements for efficiency improvements, and they form the          plemented in 2019 show that after one year in 2018, where they
     basis for comparing the companies' efficiency. Actual operating            held back on investments, the appetite to invest on the part of
     costs exclude VAT and other taxes, non-controllable costs and any          the companies has once again increased. In 2019, investments

     OPERATING COSTS, 2010 - 2019
     €/  M3 SOLD WATER (2019 PRICES)
      €/m3 sold water (2019 prices)
     1,0
     0,8
             0.75        0.73
     0,6                             0.69        0.67                   0.64                                   0.63    0.63
                                                             0.63                   0.60         0.61
     0,4
     0,2
     0,0
             2010        2011        2012        2013       2014        2015        2016*       2017*          2018*   2019*

     2010–2019: Actual operating costs (57–75 companies) *: New calculation of actual operating costs (FADO)

     INVESTMENTS, 2010 - 2019
     €/€/m3
         M3sold
             SOLD      WATER (2019 PRICES)
                water (2019 prices)
     1,2
                                                                                                                                            1.22
     1,0                                                                                                                         1.12
                                                                         1.01
     0,8                                                     0.89                                0.91                  0.91
                                                 0.78                                0.84
     0,6                 0.73        0.75                                                                      0.73
     0,4      0.59
     0,2
     0,0
              2010        2011        2012       2013        2014        2015        2016        2017           2018    2019     2020       2021

     2010–2019: Implemented investments and renovations (54–75 companies)
     2020–2021: Planned investments and renovations (66 companies)

16    WATER IN FIGURES 2020
BENCHMARKING DRINKING WATER

                                                                ACTUAL OPERATING COSTS, 2019

                                                                                                                      % imported water
                                                                                         0             20              40          60          80           100
                                                                       Sjælsø Vand                      (P)
accounted for € 0.91/m3, and there is a broad agreement                       Billund
                                                                             Thisted
that investments will increase substantially in the next two                  Tårnby
                                                                      Fredensborg
years, reaching an increase of 33% in 2021 compared with                         Ishøj
                                                                        Kalundborg
the level of investment in 2019.                                         Mariagerfj.
                                                                         Ringk.-Skj.
                                                                          Hørsholm
The breakdown of expenditure and investments                          Lemvig Vand
                                                                  HOFOR Vallensbk
In 2019, drinking water companies spent 32% of their actual                     Skive
                                                                       Fors Holbæk
operating costs on drinking water production (boreholes,          HOFOR Hvidovre
                                                                           Ringsted
source sites and waterworks), 33% on water distribution,                   Midtfyns
                                                                HOFOR København
10% on customer service and 25% on general administration.                  Horsens
                                                                    HOFOR Herlev
There is a tendency for the proportion spent on general                       Arwos
                                                                      DINForsyning
administration to increase, given that it was 22% in 2018.                        VCS
                                                                     Lyngby-Taarb
   Investments are broken down as follows: 64% is invested in               Ballerup
                                                                           Gladsaxe
the distribution network and 33% is invested in drilling and           Sønderborg
                                                                               Morsø
waterworks. The remaining 3% is invested in other things.              Brønderslev
                                                                           Glostrup
   For several years in a row, investments in drilling and                 Gentofte
waterworks have been at a historically high level of more                 Grindsted
                                                                            Herning
than 30%, which may be due to several factors: Newly built         HOFOR Dragør
                                                                             Viborg
waterworks, increased pressure on water resources due to             Vestforsyning
                                                                               Struer
the discovery of undesirable substances, which have led to                   Tønder
                                                                  HOFOR Albertsld
the need for new source sites, the review of existing source         Frederiksberg
                                                                           NFS A/S
sites and increased groundwater protection in the form of,                  Hjørring
                                                                       Aarhus Vand
e.g., drilling protection zones and afforestation.               TREFOR Vand A/S
                                                                                Køge
                                                                  HOFOR Rødovre
                                                                          Silkeborg
                                                                      Fors Roskilde
                                                                                 Ikast
                                                                            Aalborg
                                                                           Næstved

   Large variations
                                                                               Verdo
                                                                          Rudersdal
                                                                     Frederikshavn
                                                                       Slagelse-Kor

   in actual operating
                                                                             Lolland
                                                                             Egedal
                                                                                 Sorø

   costs
                                                                        Svendborg
                                                                          Odder VV
                                                                      Frederiksund
                                                                             Assens
                                                                              Provas
   The average actual operating costs for the pro-                    Skanderborg
                                                                               Hurup
   duction and distribution of 1 m3 of water sold is €            HOFOR Brøndby
                                                                     V.Himmerland
   0.63, but, as can be seen from the graph, there is a                  Langeland
   very significant spread between the lowest and the                   Kerteminde
                                                                                  FFV
   highest of the operating expenses. The reason for                       Halsnæs
   this is the difference in framework conditions under                          Give
                                                                          Bornholm
   which the companies operate. These include geo-                        Fors Lejre
                                                                         Odsherred
   logical conditions, access to groundwater, the ex-              Simple average
   tent of groundwater protection and the necessary             Weighted average
   processing steps before the water is pumped into                                  0.0               0.3             0.6         0.9         1.2          1.5
   the mains network, all of which affects production                                                                 €/m3 water sold
   costs. For distribution, factors such as population                                       Production                            * Companies that have not
   density, the size of the mains network and its prox-                                      Distribution                            been able to split their
   imity to customers, its condition and age have an                                                                                 operating cost between the
                                                                                             Customer management
                                                                                                                                     four processes are shown
   impact on costs.                                                                          General administration                  with a combined operating
                                                                                             Cumulative*                             cost.
                                                                                             Share of importet water                 (P): Production company

                                                                                                                               WATER IN FIGURES 2020              17
BENCHMARKING DRINKING WATER                                                                                          YOU CAN READ MORE ABOUT THE
                                                                                                                            ENERGY CALCULATION METHOD
                                                                                                                            ON PAGE 15.

     The drinking water companies'
     net- and gross energy   NET- AND GROSS ENERGY FOR
     The aim is for the Danish water sector to be energy-neutral or, even               WATERCOMPANIES, 2019
     better, energy-positive, which means that the water sector delivers                       Morsø
     more energy to its environment than it purchases.                                           Ishøj
                                                                                  HOFOR Vallensbk
        Currently the drinking water companies use a lot of power for                     Hørsholm
                                                                                  HOFOR Hvidovre
     pumping water from boreholes and through waterworks, as well as for            HOFOR Herlev
                                                                                  HOFOR Rødovre
     pumping it into the mains network and water towers. In addition, in          HOFOR Albertsld
                                                                                              Tårnby
     certain cases, there are additional pressure amplifiers located around          Frederiksberg
                                                                                          Fors Lejre
     the mains network.                                                              Lyngby-Taarb
                                                                                           Gladsaxe
        The water companies' options for producing energy from normal              HOFOR Dragør
     water production are limited, but solar power can be produced. In          HOFOR København
                                                                                                  VCS
     certain cases, power from turbines and drinking water can be used in                   Ballerup
                                                                                          Grindsted
     the production of heat for internal heating, selling to district heating         Fredensborg
                                                                                  HOFOR Brøndby
     operators or to private large-scale heat consumers.                               Sjælsø Vand
                                                                                               Verdo
                                                                                           Ringsted
                                                                                              Billund
     Energy consumption in the drinking water companies                                Fors Holbæk
     There is a big difference in how much electricity and energy is con-            Vestforsyning
                                                                                             Thisted
     sumed by the Danish drinking water companies in supplying 1 m3 of                    Silkeborg
                                                                                      DINForsyning
     clean water to customers. The average weighted gross energy con-                   Kerteminde
                                                                                            Herning
     sumption (electricity and heat) for drinking water is 0.44 kWh/m3 sold              Ringk.-Skj.
                                                                                        Svendborg
     and the weighted net energy consumption is 0.43 kWh/m3 sold. For                        Lolland
                                                                                             Tønder
     most drinking water companies, gross and net energy consumption             TREFOR Vand A/S
                                                                                                Køge
     is similar, since only a small proportion of the companies produce                Sønderborg
     energy, most often in the form of solar cells. The exception is Morsø                       Give
                                                                                          Odder VV
     Vand A/S, which has heat production based on a heat pump connected                     Aalborg
                                                                                       Slagelse-Kor
     to one of the company's water towers, thereby producing more energy              Fors Roskilde
                                                                                        Kalundborg
     than is consumed in connection with drinking water production.                        Glostrup
                                                                                                Skive
         Electricity consumption (purchased electricity) averages 0.41 kWh/                Næstved
                                                                                           Halsnæs
     m3 sold, and the companies themselves produce and sell electricity               Frederiksund
     equivalent to about 0.45% of what they consume.                                       Gentofte
                                                                                             Viborg
                                                                                                 Sorø
                                                                                                 Ikast
     The road to energy-positive drinking water companies                              Aarhus Vand
                                                                                           Midtfyns
     There is still a long way to go before the drinking water companies are          Lemvig Vand
                                                                                            Horsens
     energy-positive. Below is a summary of energy purchases and production                    Hurup
                                                                                                  FFV
     for the 75 drinking water companies that participate in DANVA's reports:                Egedal
                                                                                       Brønderslev
                   Purchased  Self-produced energy            Sold energy                  NFS A/S
                                                                                              Provas
                   energy kWh used internally kWh             kWh                         Bornholm
                                                                                               Struer
     Electricity     95,975,125                  1,446,999         427,206               Mariagerfj.
                                                                                          Rudersdal
     Heat             3,696,041                     18,767         720,000               Langeland
                                                                                      Skanderborg
     Total           99,671,166                  1,465,766       1,147,206                    Arwos
                                                                                            Hjørring
                                                                                             Assens
       The net self-supply ratio, which is defined as the percentage of              Frederikshavn
                                                                                     V.Himmerland
     energy sold in relation to energy purchased, is 1.2%.                               Odsherred
       The total self-supply ratio, which is defined as the percentage of          Simple average
                                                                                Weighted average
     energy sold plus self-produced energy used internally in relation to                            -0.6     -0.4   -0.2    0.0      0.2    0.4       0.6   0.8   1.0   1.2
     purchased energy plus self-produced energy used internally, is 2.6%.                                                          kWh/m3 sold water
       The companies will be energy-positive once they exceed 100%.                                         Net energy
                                                                                                            Gross energy

18    WATER IN FIGURES 2020
You can also read