Catalyse business agility through climate change management - CDP Italy 100 Climate Change report 2012 on behalf of 655 investors with assets of ...
←
→
Page content transcription
If your browser does not render page correctly, please read the page content below

Catalyse business agility
through climate change
management

CDP Italy 100 Climate Change report 2012
on behalf of 655 investors
with assets of uS$ 78 trillion

Report writer   Scoring partner

                                           1
CDP Investor Members 2012
                                            Aegon                           Previdência S/A
                                            AKBANK T.A.Ş.                   Morgan Stanley
        CDP works with investors            Allianz Global Investors        National Australia Bank
        globally to advance the             Aviva Investors                 NEI Investments
        investment opportunities            AXA Group                       Neuberger Berman
        and reduce the risks                Bank of America Merrill Lynch   Newton Investment
        posed by climate change
                                            Bendigo and Adelaide Bank       Management Ltd
        by asking almost 6,000
        of the world’s largest              Blackrock                       Nordea Investment
        companies to report on              BP Investment Management        Management
        their climate strategies,           California Public Employees     Norges Bank Investment
        GHG emissions and                   Retirement System - CalPERS     Management
        energy use in the                   California State Teachers       PFA Pension
        standardized Investor               Retirement Fund - CalSTRS       Robeco
        CDP format. To learn                Calvert Asset Management        Rockefeller & Co.
        more about CDP’s                    Company                         SAM Group
        member offering and
        becoming a member,                  Catholic Super                  Sampension KP Livsforsikring
        please contact us or visit          CCLA                            A/S
        the CDP Investor Member             Daiwa Asset Management Co.      Schroders
        section at                          Ltd.                            Scottish Widows Investment
        https://www.cdproject.              Generation Investment           Partnership
        net/investormembers                 Management                      SEB
                                            HSBC Holdings                   Sompo Japan Insurance Inc
                                            KLP                             Standard Chartered
                                            Legg Mason                      TD Asset Management Inc.
                                            London Pension Fund             and TDAM USA Inc.
                                            Authority                       The RBS Group
                                            Mongeral Aegon Seguros e        The Wellcome Trust

    A     CDP InvESTor SIgnaTorIES & aSSETS                                 B     2012 SIgnaTory InvESTor
          (uS$ TrILLIon) agaInST TIME                                             brEakDoWn

    •     Investor CDP Signatories                                          259   Asset Managers
    •     Investor CDP Signatories Assets                                   •     Asset Owners
                                                                            •     Banks
                                                                            •     Insurance
                                                                            •     Other

2
CDP Signatory Investor 2012
                                                         Banco Bradesco S/A                                       Caixa de Previdência dos Funcionários do Banco do
                                                         Banco Comercial Português S.A.                           Nordeste do Brasil (CAPEF)
                                                         Banco de Credito del Peru BCP                            Caixa Econômica Federal
    655 financial institutions with                      Banco de Galicia y Buenos Aires S.A.                     Caixa Geral de Depositos
    assets of uS$78 trillion were                        Banco do Brasil S/A                                      CaixaBank, S.A
    signatories to the CDP 2012                          Banco Espírito Santo, SA                                 California Public Employees’ Retirement System
    information request dated                            Banco Nacional de Desenvolvimento Econômico e Social     California State Teachers’ Retirement System
    february 1st, 2012                                   - BNDES                                                  California State Treasurer
                                                         Banco Popular Español                                    Calvert Investment Management, Inc
                                                         Banco Sabadell, S.A.                                     Canada Pension Plan Investment Board
                                                         Banco Santander                                          Canadian Friends Service Committee (Quakers)
Aberdeen Asset Managers                                  Banesprev – Fundo Banespa de Seguridade Social           Canadian Imperial Bank of Commerce (CIBC)
Aberdeen Immobilien KAG mbH                              Banesto                                                  Canadian Labour Congress Staff Pension Fund
ABRAPP - Associação Brasileira das Entidades Fechadas    Bank Handlowy w Warszawie S.A.                           CAPESESP
de Previdência Complementar                              Bank of America Merrill Lynch                            Capital Innovations, LLC
Achmea NV                                                Bank of Montreal                                         CARE Super
Active Earth Investment Management                       Bank Vontobel                                            Carmignac Gestion
Acuity Investment Management                             Bankhaus Schelhammer & Schattera                         Catherine Donnelly Foundation
Addenda Capital Inc.                                     Kapitalanlagegesellschaft m.b.H.                         Catholic Super
Advanced Investment Partners                             BANKIA S.A.                                              CBF Church of England Funds
AEGON N.V.                                               BANKINTER                                                CBRE
AEGON-INDUSTRIAL Fund Management Co., Ltd                BankInvest                                               Cbus Superannuation Fund
AFP Integra                                              Banque Degroof                                           CCLA Investment Management Ltd
AIG Asset Management                                     Banque Libano-Francaise                                  Celeste Funds Management Limited
AK Asset Management Inc.                                 Barclays                                                 Central Finance Board of the Methodist Church
AKBANK T.A.Ş.                                            Basellandschaftliche Kantonalbank                        Ceres
Alberta Investment Management Corporation (AIMCo)        BASF Sociedade de Previdência Complementar               CERES-Fundação de Seguridade Social
Alberta Teachers Retirement Fund                         Basler Kantonalbank                                      Change Investment Management
Alcyone Finance                                          Bâtirente                                                Christian Brothers Investment Services
AllenbridgeEpic Investment Advisers Limited              Baumann and Partners S.A.                                Christian Super
Allianz Elementar Versicherungs-AG                       Bayern LB                                                Christopher Reynolds Foundation
Allianz Global Investors Kapitalanlagegesellschaft mbH   BayernInvest Kapitalanlagegesellschaft mbH               Church Commissioners for England
Allianz Group                                            BBC Pension Trust Ltd                                    Church of England Pensions Board
Altira Group                                             BBVA                                                     CI Mutual Funds’ Signature Global Advisors
Amalgamated Bank                                         Bedfordshire Pension Fund                                City Developments Limited
AMP Capital Investors                                    Beetle Capital                                           Clean Yield Asset Management
AmpegaGerling Investment GmbH                            BEFIMMO SCA                                              ClearBridge Advisors
Amundi AM                                                Bendigo & Adelaide Bank Limited                          Climate Change Capital Group Ltd
ANBIMA – Associação Brasileira das Entidades dos         Bentall Kennedy                                          CM-CIC Asset Management
Mercados Financeiro e de Capitais                        Berenberg Bank                                           Colonial First State Global Asset Management
Antera Gestão de Recursos S.A.                           Berti Investments                                        Comerica Incorporated
APG                                                      BioFinance Administração de Recursos de Terceiros Ltda   COMGEST
AQEX LLC                                                 BlackRock                                                Commerzbank AG
Aquila Capital                                           Blom Bank SAL                                            CommInsure
Arisaig Partners Asia Pte Ltd                            Blumenthal Foundation                                    Commonwealth Bank Australia
Arma Portföy Yönetimi A.Ş.                               BNP Paribas Investment Partners                          Commonwealth Superannuation Corporation
ASM Administradora de Recursos S.A.                      BNY Mellon                                               Compton Foundation
ASN Bank                                                 BNY Mellon Service Kapitalanlage Gesellschaft            Concordia Versicherungsgruppe
Assicurazioni Generali Spa                               Boston Common Asset Management, LLC                      Connecticut Retirement Plans and Trust Funds
ATI Asset Management                                     BP Investment Management Limited                         Co-operative Financial Services (CFS)
ATP Group                                                Brasilprev Seguros e Previdência S/A.                    Credit Suisse
Australia and New Zealand Banking Group Limited          British Airways Pension Investment Management Limited    Daegu Bank
Australian Ethical Investment                            British Columbia Investment Management Corporation       Daesung Capital Management
AustralianSuper                                          (bcIMC)                                                  Daiwa Asset Management Co. Ltd.
Avaron Asset Management AS                               BT Investment Management                                 Daiwa Securities Group Inc.
Aviva Investors                                          Busan Bank                                               Dalton Nicol Reid
Aviva plc                                                CAAT Pension Plan                                        de Pury Pictet Turrettini & Cie S.A.
AXA Group                                                Cadiz Holdings Limited                                   DekaBank Deutsche Girozentrale
Baillie Gifford & Co.                                    Caisse de dépôt et placement du Québec                   Delta Lloyd Asset Management
BaltCap                                                  Caisse des Dépôts                                        Deutsche Asset Management Investmentgesellschaft mbH
BANCA CÍVICA S.A.                                        Caixa Beneficente dos Empregados da Companhia            Deutsche Bank AG
Banca Monte dei Paschi di Siena Group                    Siderurgica Nacional - CBS                               Development Bank of Japan Inc.

                                                                                                                                                                         3
Development Bank of the Philippines (DBP)                Fundação AMPLA de Seguridade Social - Brasiletros          Henderson Global Investors
    Dexia Asset Management                                   Fundação Atlântico de Seguridade Social                    Hermes Fund Managers
    Dexus Property Group                                     Fundação Attilio Francisco Xavier Fontana                  HESTA Super
    DnB ASA                                                  Fundação Banrisul de Seguridade Social                     HIP Investor
    Domini Social Investments LLC                            Fundação BRDE de Previdência Complementar - ISBRE          Holden & Partners
    Dongbu Insurance                                         Fundação Chesf de Assistência e Seguridade Social –        HSBC Global Asset Management (Deutschland) GmbH
    DWS Investment GmbH                                      Fachesf                                                    HSBC Holdings plc
    Earth Capital Partners LLP                               Fundação Corsan - dos Funcionários da Companhia            HSBC INKA Internationale Kapitalanlagegesellschaft mbH
    East Sussex Pension Fund                                 Riograndense de Saneamento                                 HUMANIS
    Ecclesiastical Investment Management                     Fundação de Assistência e Previdência Social do BNDES      Hyundai Marine & Fire Insurance. Co., Ltd.
    Ecofi Investissements - Groupe Credit Cooperatif         - FAPES                                                    Hyundai Securities Co., Ltd.
    Edward W. Hazen Foundation                               FUNDAÇÃO ELETROBRÁS DE SEGURIDADE SOCIAL -                 IBK Securities
    EEA Group Ltd                                            ELETROS                                                    IDBI Bank Ltd
    Elan Capital Partners                                    Fundação Forluminas de Seguridade Social - FORLUZ          Illinois State Board of Investment
    Element Investment Managers                              Fundação Itaipu BR - de Previdência e Assistência Social   Ilmarinen Mutual Pension Insurance Company
    ELETRA - Fundação Celg de Seguros e Previdência          FUNDAÇÃO ITAUBANCO                                         Impax Asset Management
    Environment Agency Active Pension fund                   Fundação Itaúsa Industrial                                 IndusInd Bank Limited
    Epworth Investment Management                            Fundação Promon de Previdência Social                      Industrial Alliance Insurance and Financial Services Inc.
    Equilibrium Capital Group                                Fundação Rede Ferroviária de Seguridade Social - Refer     Industrial Bank (A)
    equinet Bank AG                                          FUNDAÇÃO SANEPAR DE PREVIDÊNCIA E ASSISTÊNCIA              Industrial Bank of Korea
    Erik Penser Fondkommission                               SOCIAL - FUSAN                                             Industrial Development Corporation
    Erste Asset Management                                   Fundação Sistel de Seguridade Social (Sistel)              Industry Funds Management
    Erste Group Bank                                         Fundação Vale do Rio Doce de Seguridade Social - VALIA     Infrastructure Development Finance Company
    Essex Investment Management Company, LLC                 FUNDIÁGUA - FUNDAÇÃO DE PREVIDENCIA                        ING Group N.V.
    ESSSuper                                                 COMPLEMENTAR DA CAESB                                      Insight Investment Management (Global) Ltd
    Ethos Foundation                                         Futuregrowth Asset Management                              Instituto de Seguridade Social dos Correios e Telégrafos-
    Etica Sgr                                                Garanti Bank                                               Postalis
    Eureka Funds Management                                  GEAP Fundação de Seguridade Social                         Instituto Infraero de Seguridade Social - INFRAPREV
    Eurizon Capital SGR                                      Generali Deutschland Holding AG                            Instituto Sebrae De Seguridade Social - SEBRAEPREV
    Evangelical Lutheran Church in Canada Pension Plan for   Generation Investment Management                           Insurance Australia Group
    Clergy and Lay Workers                                   Genus Capital Management                                   IntReal KAG
    Evangelical Lutheran Foundation of Eastern Canada        Gjensidige Forsikring ASA                                  Investec Asset Management
    Evli Bank Plc                                            Global Forestry Capital SARL                               Investing for Good CIC Ltd
    F&C Investments                                          GLS Gemeinschaftsbank eG                                   Irish Life Investment Managers
    FACEB – FUNDAÇÃO DE PREVIDÊNCIA DOS                      Goldman Sachs Group Inc.                                   Itau Asset Management
    EMPREGADOS DA CEB                                        GOOD GROWTH INSTITUT für globale                           Itaú Unibanco Holding S A
    FAELCE – Fundacao Coelce de Seguridade Social            Vermögensentwicklung mbH                                   Janus Capital Group Inc.
    FAPERS- Fundação Assistencial e Previdenciária da        Governance for Owners                                      Jarislowsky Fraser Limited
    Extensão Rural do Rio Grande do Sul                      Government Employees Pension Fund (“GEPF”), Republic       JOHNSON & JOHNSON SOCIEDADE PREVIDENCIARIA
    FASERN - Fundação COSERN de Previdência                  of South Africa                                            JPMorgan Chase & Co.
    Complementar                                             GPT Group                                                  Jubitz Family Foundation
    Fédéris Gestion d’Actifs                                 Graubündner Kantonalbank                                   Jupiter Asset Management
    FIDURA Capital Consult GmbH                              Greater Manchester Pension Fund                            Kaiser Ritter Partner (Schweiz) AG
    FIM Asset Management Ltd                                 Green Cay Asset Management                                 KB Kookmin Bank
    FIM Services                                             Green Century Capital Management                           KBC Asset Management NV
    FIPECq - Fundação de Previdência Complementar dos        GROUPAMA EMEKLILIK A.Ş.                                    KBC Group
    Empregados e Servidores da FINEP, do IPEA, do CNPq       GROUPAMA SIGORTA A.Ş.                                      KCPS Private Wealth Management
    FIRA. - Banco de Mexico                                  Groupe Crédit Coopératif                                   KDB Asset Management Co., Ltd.
    First Affirmative Financial Network, LLC                 Groupe Investissement Responsable Inc.                     KDB Daewoo Securities
    First Swedish National Pension Fund (AP1)                GROUPE OFI AM                                              KEPLER-FONDS Kapitalanlagegesellschaft m. b. H.
    Firstrand Group Limited                                  Grupo Financiero Banorte SAB de CV                         Keva
    Five Oceans Asset Management                             Grupo Santander Brasil                                     KfW Bankengruppe
    Florida State Board of Administration (SBA)              Gruppo Bancario Credito Valtellinese                       Killik & Co LLP
    Folketrygdfondet                                         Guardians of New Zealand Superannuation                    Kiwi Income Property Trust
    Folksam                                                  Hanwha Asset Management Company                            Kleinwort Benson Investors
    Fondaction CSN                                           Harbour Asset Management                                   KlimaINVEST
    Fondation de Luxembourg                                  Harrington Investments, Inc                                KLP
    Forma Futura Invest AG                                   Hauck & Aufhäuser Asset Management GmbH                    Korea Investment Management Co., Ltd.
    Fourth Swedish National Pension Fund, (AP4)              Hazel Capital LLP                                          Korea Technology Finance Corporation (KOTEC)
    FRANKFURT-TRUST Investment-Gesellschaft mbH              HDFC Bank Ltd                                              KPA Pension
    Fukoku Capital Management Inc                            Healthcare of Ontario Pension Plan (HOOPP)                 Kyrkans pensionskassa
    FUNCEF - Fundação dos Economiários Federais              Helaba Invest Kapitalanlagegesellschaft mbH                La Banque Postale Asset Management

4
La Financiere Responsable                                 Mutual Insurance Company Pension-Fennia                      Pensionsmyndigheten
Lampe Asset Management GmbH                               Nanuk Asset Management                                       Perpetual Investments
Landsorganisationen i Sverige                             Natcan Investment Management                                 PETROS - The Fundação Petrobras de Seguridade Social
LBBW - Landesbank Baden-Württemberg                       Nathan Cummings Foundation, The                              PFA Pension
LBBW Asset Management Investmentgesellschaft mbH          National Australia Bank                                      PGGM Vermogensbeheer
LD Lønmodtagernes Dyrtidsfond                             National Bank of Canada                                      Phillips, Hager & North Investment Management Ltd.
Legal & General Investment Management                     NATIONAL BANK OF GREECE S.A.                                 PhiTrust Active Investors
Legg Mason Global Asset Management                        National Grid Electricity Group of the Electricity Supply    Pictet Asset Management SA
LGT Capital Management Ltd.                               Pension Scheme                                               Pioneer Investments
LIG Insurance Co., Ltd                                    National Grid UK Pension Scheme                              PIRAEUS BANK
Light Green Advisors, LLC                                 National Pensions Reserve Fund of Ireland                    PKA
Living Planet Fund Management Company S.A.                National Union of Public and General Employees (NUPGE)       Pluris Sustainable Investments SA
Lloyds Banking Group                                      NATIXIS                                                      PNC Financial Services Group, Inc.
Local Authority Pension Fund Forum                        Nedbank Limited                                              Pohjola Asset Management Ltd
Local Government Super                                    Needmor Fund                                                 Polden-Puckham Charitable Foundation
Local Super                                               NEI Investments                                              Portfolio 21 Investments
Logos portföy Yönetimi A.Ş.                               Nelson Capital Management, LLC                               Porto Seguro S.A.
London Pensions Fund Authority                            Neuberger Berman                                             Power Finance Corporation Limited
Lothian Pension Fund                                      New Alternatives Fund Inc.                                   PREVHAB PREVIDÊNCIA COMPLEMENTAR
LUCRF Super                                               New Amsterdam Partners LLC                                   PREVI Caixa de Previdência dos Funcionários do Banco
Lupus alpha Asset Management GmbH                         New Mexico State Treasurer                                   do Brasil
Macquarie Group Limited                                   New York City Employees Retirement System                    PREVIG Sociedade de Previdência Complementar
MagNet Magyar Közösségi Bank Zrt.                         New York City Teachers Retirement System                     ProLogis
MainFirst Bank AG                                         New York State Common Retirement Fund (NYSCRF)               Provinzial Rheinland Holding
MAMA Sustainable Incubation AG                            Newton Investment Management Limited                         Prudential Investment Management
Man                                                       NGS Super                                                    Prudential Plc
MAPFRE                                                    NH-CA Asset Management                                       Psagot Investment House Ltd
Maple-Brown Abbott                                        Nikko Asset Management Co., Ltd.                             PSP Investments
Marc J. Lane Investment Management, Inc.                  Nipponkoa Insurance Company, Ltd                             Q Capital Partners
Maryland State Treasurer                                  Nissay Asset Management Corporation                          QBE Insurance Group
Matrix Asset Management                                   NORD/LB Kapitalanlagegesellschaft AG                         Rabobank
MATRIX GROUP LTD                                          Nordea Investment Management                                 Raiffeisen Fund Management Hungary Ltd.
McLean Budden                                             Norfolk Pension Fund                                         Raiffeisen Kapitalanlage-Gesellschaft m.b.H.
MEAG MUNICH ERGO AssetManagement GmbH                     Norges Bank Investment Management                            Raiffeisen Schweiz Genossenschaft
Meeschaert Gestion Privée                                 North Carolina Retirement System                             Rathbones / Rathbone Greenbank Investments
Meiji Yasuda Life Insurance Company                       Northern Ireland Local Government Officers’ Superannuation   RCM (Allianz Global Investors)
Mendesprev Sociedade Previdenciária                       Committee (NILGOSC)                                          Real Grandeza Fundação de Previdência e Assistência
Merck Family Fund                                         NORTHERN STAR GROUP                                          Social
Mercy Investment Services, Inc.                           Northern Trust                                               Rei Super
Mergence Investment Managers                              Northward Capital Pty Ltd                                    Reliance Capital Ltd
Meritas Mutual Funds                                      Nykredit                                                     Resolution
MetallRente GmbH                                          Oddo & Cie                                                   Resona Bank, Limited
Metrus – Instituto de Seguridade Social                   OECO Capital Lebensversicherung AG                           Reynders McVeigh Capital Management
Metzler Asset Management Gmbh                             ÖKOWORLD                                                     RLAM
MFS Investment Management                                 Old Mutual plc                                               Robeco
Midas International Asset Management                      OMERS Administration Corporation                             Robert & Patricia Switzer Foundation
Miller/Howard Investments                                 Ontario Teachers’ Pension Plan                               Rockefeller Financial (trade name used by Rockefeller &
Mirae Asset Global Investments Co. Ltd.                   OP Fund Management Company Ltd                               Co., Inc.)
Mirae Asset Securities                                    Oppenheim & Co. Limited                                      Rose Foundation for Communities and the Environment
Mirvac Group Ltd                                          Oppenheim Fonds Trust GmbH                                   Rothschild
Missionary Oblates of Mary Immaculate                     Opplysningsvesenets fond (The Norwegian Church               Royal Bank of Canada
Mistra, Foundation for Strategic Environmental Research   Endowment)                                                   Royal Bank of Scotland Group
Mitsubishi UFJ Financial Group                            OPTrust                                                      RPMI Railpen Investments
Mitsui Sumitomo Insurance Co.,Ltd                         Oregon State Treasurer                                       RREEF Investment GmbH
Mizuho Financial Group, Inc.                              Orion Energy Systems                                         Russell Investments
Mn Services                                               Osmosis Investment Management                                SAM Group
Momentum Manager of Managers (Pty) Limited                Parnassus Investments                                        SAMPENSION KP LIVSFORSIKRING A/S
Monega Kapitalanlagegesellschaft mbH                      Pax World Funds                                              SAMSUNG FIRE & MARINE INSURANCE
Mongeral Aegon Seguros e Previdência S/A                  Pensioenfonds Vervoer                                        Samsung Securities
Morgan Stanley                                            Pension Denmark                                              Sanlam Life Insurance Ltd
Mountain Cleantech AG                                     Pension Fund for Danish Lawyers and Economists               Santa Fé Portfolios Ltda
MTAA Superannuation Fund                                  Pension Protection Fund                                      Santam

                                                                                                                                                                                 5
Sarasin & Cie AG                                       Tempis Asset Management Co. Ltd                        VietNam Holding Ltd.
    SAS Trustee Corporation                                Terra Forvaltning AS                                   Voigt & Coll. GmbH
    Sauren Finanzdienstleistungen GmbH & Co. KG            TerraVerde Capital Management LLC                      VOLKSBANK INVESTMENTS
    Schroders                                              TfL Pension Fund                                       Waikato Community Trust Inc
    Scotiabank                                             The ASB Community Trust                                Walden Asset Management, a division of Boston Trust &
    Scottish Widows Investment Partnership                 The Brainerd Foundation                                Investment Management Company
    SEB                                                    The Bullitt Foundation                                 WARBURG - HENDERSON Kapitalanlagegesellschaft für
    SEB Asset Management AG                                The Central Church Fund of Finland                     Immobilien mbH
    Second Swedish National Pension Fund (AP2)             The Children’s Investment Fund Management (UK) LLP     WARBURG INVEST KAPITALANLAGEGESELLSCHAFT
    Seligson & Co Fund Management Plc                      The Collins Foundation                                 MBH
    Sentinel Investments                                   The Co-operative Asset Management                      Water Asset Management, LLC
    SERPROS - Fundo Multipatrocinado                       The Co-operators Group Ltd                             Wells Fargo & Company
    Service Employees International Union Pension Fund     The Daly Foundation                                    West Yorkshire Pension Fund
    Seventh Swedish National Pension Fund (AP7)            The Environmental Investment Partnership LLP           WestLB Mellon Asset Management (WMAM)
    Shinhan Bank                                           The Hartford Financial Services Group, Inc.            Westpac Banking Corporation
    Shinhan BNP Paribas Investment Trust Management Co.,   The Joseph Rowntree Charitable Trust                   WHEB Asset Management
    Ltd                                                    The Korea Teachers Pension (KTP)                       White Owl Capital AG
    Shinkin Asset Management Co., Ltd                      The Pension Plan For Employees of the Public Service   Winslow Management, A Brown Advisory Investment Group
    Siemens Kapitalanlagegesellschaft mbH                  Alliance of Canada                                     Woori Bank
    Signet Capital Management Ltd                          The Pinch Group                                        Woori Investment & Securities Co., Ltd.
    Smith Pierce, LLC                                      The Presbyterian Church in Canada                      YES BANK Limited
    SNS Asset Management                                   The Russell Family Foundation                          York University Pension Fund
    Social(k)                                              The Sandy River Charitable Foundation                  Youville Provident Fund Inc.
    Sociedade de Previdencia Complementar da Dataprev -    The Shiga Bank, Ltd.                                   Zegora Investment Management
    Prevdata                                               The Sisters of St. Ann                                 Zevin Asset Management
    Socrates Fund Management                               The United Church of Canada - General Council          Zurich Cantonal Bank
    Solaris Investment Management Limited                  The University of Edinburgh Endowment Fund
    Sompo Japan Insurance Inc.                             The Wellcome Trust
    Sopher Investment Management                           Third Swedish National Pension Fund (AP3)
    SouthPeak Investment Management                        Threadneedle Asset Management
    SPF Beheer bv                                          TOBAM
    Sprucegrove Investment Management Ltd                  Tokio Marine Holdings, Inc
    Standard Bank Group                                    Toronto Atmospheric Fund
    Standard Chartered                                     Trillium Asset Management Corporation
    Standard Chartered Korea Limited                       Triodos Investment Management
    Standard Life Investments                              Tri-State Coalition for Responsible Investment
    State Bank of India                                    Tryg
    State Street Corporation                               UBS
    StatewideSuper                                         Unibail-Rodamco
    StoreBrand ASA                                         UniCredit SpA
    Strathclyde Pension Fund                               Union Asset Management Holding AG
    Stratus Group                                          Union Investment Privatfonds GmbH
    Sumitomo Mitsui Financial Group                        Unione di Banche Italiane S.c.p.a.
    Sumitomo Mitsui Trust Holdings, Inc.                   Unionen
    Sun Life Financial Inc.                                Unipension
    Superfund Asset Management GmbH                        UNISON staff pension scheme
    SUSI Partners AG                                       UniSuper
    Sustainable Capital                                    Unitarian Universalist Association
    Sustainable Development Capital                        United Methodist Church General Board of Pension and
    Svenska Kyrkan, Church of Sweden                       Health Benefits
    Swedbank AB                                            United Nations Foundation
    Swift Foundation                                       Unity Trust Bank
    Swiss Re                                               Universities Superannuation Scheme (USS)
    Swisscanto Asset Management AG                         Vancity Group of Companies
    Syntrus Achmea Asset Management                        VCH Vermögensverwaltung AG
    T. Rowe Price                                          Ventas, Inc.
    T. SINAI KALKINMA BANKASI A.Ş.                         Veris Wealth Partners
    Tata Capital Limited                                   Veritas Investment Trust GmbH
    TD Asset Management Inc. and TDAM USA Inc.             Vermont State Treasurer
    Teachers Insurance and Annuity Association – College   Vexiom Capital, L.P.
    Retirement Equities Fund                               VicSuper
    Telluride Association                                  Victorian Funds Management Corporation

6
7
Contents

                                                       “It is crystal clear: There is never a
                                                       way back into the past – whether it
                                                       has proven a good or a bad time. We
                                                       all have to adapt to the developments
                                                       that have taken place so far – and to
                                                       those that lie ahead. This is just the
                                                       application of the most successful
                                                       strategy for the past billion years:
                                                       evolution.”

                                                       Andreas Knörzer
                                                       Bank Sarasin

    CDP CEo foreword                                                                9
    guest foreword                                                                  10
    accenture foreword                                                              11
    Executive summary                                                               12
    key themes and highlights                                                       14
    Investor perspective                                                            20
    2012 Leaders                                                                    21
    a dialogue with the Italian Environment Minister                                24
    key statistics                                                                  26
    an insight into ghg emissions verification                                      30
    Sector analysis                                                                 32
    appendix                                                                        36

8
CDP CEo foreword

                                                                                                    “CDP has pioneered
                                                                                                    the only global
                                                                                                    system that collects
                                                                                                    information about
                                                                                                    corporate behaviour
                                                                                                    on climate change
                                                                                                    and water scarcity, on
                                                                                                    behalf of market forces,
                                                                                                    including shareholders
                                                                                                    and purchasing
                                                                                                    corporations.”

The pressure is growing for companies to build long-term      and water scarcity, on behalf of market forces, including
resilience in their business. The unprecedented debt          shareholders and purchasing corporations. CDP works to
crisis that has hit many parts of the world has sparked       accelerate action on climate change through disclosure
a growing understanding that short-termism can bring          and more recently through its Carbon Action program. In
an established economic system to breaking point. As          2012, on behalf of its Carbon Action signatory investors
some national economies have been brought to their            CDP engaged 205 companies in the Global 500 to request
knees in recent months, we are reminded that nature’s         they set an emissions reduction target; 61 of these
system is under threat through the depletion of the world’s   companies have now done so. CDP continues to evolve
finite natural resources and the rise of greenhouse gas       and respond to market needs. This year we announced
emissions. Business and economies globally have already       that the Global Canopy Programme’s Forest Footprint
been impacted by the increased frequency and severity of      Disclosure Project will merge with CDP over the next
extreme weather events, which scientists are increasingly     two years. Bringing forests, which are critically linked to
linking to climate change1. Bad harvests due to unusual       both climate and water security, into the CDP system will
weather have this year rocked the agricultural industry,      enable companies and investors to rely on one source of
with the price of grain, corn and soya beans reaching         primary data for this set of interrelated issues.
an all-time high. Last year, flash floods that ravaged        Accounting for and valuing the world’s natural capital is
Italy’s Cinque Terre and parts of Tuscany alone caused        fundamental to building economic stability and prosperity.
economic losses of about US$545 million.2                     Companies that work to decouple greenhouse gas
It is vital that we internalise the costs of future           emissions from financial returns have the potential for both
environmental damage into today’s decisions by putting        short and long-term cost savings, sustainable revenue
an effective price on carbon. Whilst regulation is slow, a    generation and a more resilient future.
growing number of jurisdictions have introduced carbon
pricing with carbon taxes or cap-and-trade schemes.
The most established remains the EU Emissions Trading
Scheme but moves have also been made in Australia,
California, China and South Korea among others.               Paul Simpson
Enabling better decisions by providing investors,             CEO Carbon Disclosure Project
companies and governments with high quality information
on how companies are managing their response to
                                                              1. The State of the Climate in 2011 report, led by the National Oceanographic and Atmospheric
climate change and mitigating the risks from natural          Administration (NOAA) in the US and published as part of the Bulletin of the American Meteoro-
resource constraints has never been more important.           logical Society (BAMS)
                                                              2. The international disaster database referring to the flash floods in Cinque Terre, Liguria and
CDP has pioneered the only global system that collects        Tuscany on 26 October 2011

information about corporate behaviour on climate change

                                                                                                                                                                9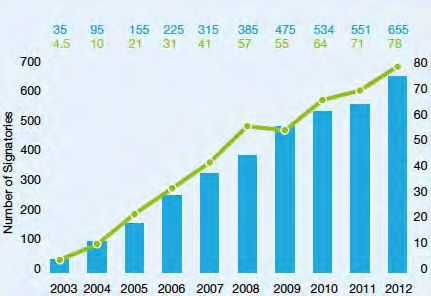
guest foreword

                                                                                               “We need to promote
                                                                                               competitiveness,
                                                                                               prosperity and quality of
                                                                                               life within the limits of our
                                                                                               planet”

Copyright EU

         As the world struggles to exit from the financial and            Our most important resource is our natural capital and
         economic turmoil, we must look ahead and focus not only          the benefits that we draw from nature year after year.
         on jobs and growth, but also on the type of growth we            If we erode that capital for short-term gains, we are
         want. We can no longer continue to ignore the severity           simply gambling with our future. There will be no growth
         of debt in our natural capital. Environmental degradation        in the future if it is not sustainable, if it is not resource
         is becoming more and more evident everywhere. The                efficient. This is already necessary for our generation, but
         state of our oceans, soils, forests and biodiversity, and        indispensable for the next.
         the impacts of climate change are just some of the
         signs that we are beginning to see. This will have severe
         consequences not only on health and the environment but
         also on the economy.
                                                                          Dr. Janez Potočnik
         If we do not want resource scarcities and pressures to be        European Commissioner for the Environment
         a major constraint on growth in the near future, we need
         to promote competitiveness, prosperity and quality of life
         within the limits of our planet. This is why the European
         Commission places resource efficiency at the centre of its
         agenda for economic transformation. The objective is to
         achieve environmentally compatible growth, decoupling
         resource use from economic growth and reducing
         greenhouse gas emissions.

         The important impact of better resource efficiency on
         climate change is too often underestimated. This is why
         I welcome CDP’s vision to widen its scope to include
         natural capital and resources. It reflects an important
         change in the approach of corporations. Companies need
         stronger, more long-term price signals to produce returns
         on investment, and it is for public authorities to provide the
         right signals, incentives, direction and most importantly
         leadership. We need to move from a short-term to a
         more long-term vision that will help us see that there is
         a clear link between resource efficiency and increased
         profitability, and improve on both.
    10
accenture foreword
“The Earth overshoot Day
in 2012 was reached on
august 22nd. Ten years
ago it was on october
3rd and 20 years ago on
october 21st. The index,
gives the approximate
date on which the planet’s
ability to replenish
resource consumption
for the respective year
has been surpassed.
given current trends in
consumption, one thing
is clear: Earth overshoot
Day arrives earlier each
year. It means that every
year we start consuming
the Earth’s natural
reserves sooner.”
The Earth Overshoot Day in 2012 was reached on August Russian economist, Nikolaj Kondrat’ev, who lived in the
22nd. Ten years ago it was on October 3rd and 20 years first half of the XX century, describes the economic cycles
ago on October 21st. The index, developed by The Global as sinusoidal waves alternating ascending and descending
Footprint Network, gives the approximate date on which phases, with long-run waves of innovation that can be
the planet’s ability to replenish resource consumption for observed since the industrial revolution. One of the
the respective year has been surpassed. Given current notable things about these waves of innovation is that they
trends in consumption, one thing is clear: Earth Overshoot created wealth and social progress in the places where
Day arrives earlier each year. It means that every year we they started. According to several economists, the current
start consuming the Earth’s natural reserves sooner. period would be preliminary to the 6th wave and this time
A few months ago, on the occasion of the 40th anniversary the driver of innovation would be sustainability – leading
of the publication of The Limits to Growth commissioned to investments in renewable energies, smart grids, green
by The Club of Rome, one of the authors, Jorgen Randers, chemistry and green nanotechnology, among others.
made an attempt to forecast how things will change until We sincerely wish to see this wave taking shape and
2052. The results, that consider expected increase in approaching us very soon. For the reasons above, but also
efficiency utilization of resources, are quite impressive: because companies need to understand, measure and
population growth peaking at 8.1 billion, food supply monitor their carbon footprint to address their strategies,
insufficient to entirely avoid starvation, CO2 concentrations we think that this CDP report is an additional help for
growing close to passing the danger threshold of +2 °C Italian listed companies to understand that GHG emissions
by 2050, the United States and the other OECD countries and climate change mitigation actions are not just CSR
experiencing stagnation. This model might prove, of topics but are part of the competitive arena where they
course, to be wrong in its estimations, but we pointed it can play a new role for growth and profitability. That’s why
out as a tribute to the Club of Rome, which in a certain we hope that Italian Authorities, as recently done by UK
way represents the cradle of the sustainability think tank. ones (where reporting will be mandatory from April 2013),
Looking beyond that single model, many scientists and will mandate all listed companies to disclose their carbon
international organisations agree on similar estimations. emissions.
The inevitable resulting reflection is that changes faced by
our overall economic and industrial system are structurally
deep and complex and cannot be overcome merely
with a tip-of-the-iceberg solution. So, what if we started
considering the economic downturn as an opportunity?
The opportunity for innovating companies and rethinking Danilo Troncarelli
technologies, the opportunity of developing new skills and Sustainability Lead
building modern infrastructures.An interesting theory of a Italy, Central & Eastern Europe, Russia, Middle East
11Executive summary
The Carbon Disclosure Project (CDP) is an independent There is a visible increase, compared to last year, in
not-for-profit organization working to drive greenhouse the level of importance given by companies to climate
gas emissions reduction and sustainable water use by change, as can be seen in the increase of board or other
business and cities. CDP requests climate change data on senior management accountable for climate change
behalf of 655 institutional investors to be used by financial (95% compared to 61% in 2011). Additionally, 70% (30)
decision makers in their investment, lending and insurance of responding companies declare that climate change
analysis. has been integrated into their overall business strategy
and a large number of companies (72%, equal to 31 of
This year we experienced a significant 30% increase in respondents) have begun communicating their focus on
the number of respondents in Italy, receiving 46 responses these aspects in voluntary reports, showing their interest
compared to last year’s 35. (Fig. 1) Out of these, 43 in public disclosure of their activities.
were unique responses whereas Banca Generali, Credito
Artigiano and Enel Green Power referred to their parent Companies’ engagement in carbon management is high
company’s response. These three responses are included and growing, the Italian panel of responding companies
to provide full picture of response rate, while the remaining has increased and reported emissions3 have changed
analysis in this report is based on the lower total of 43 accordingly; from 2009 to 2011 Scope 1 emissions
which excludes these 3 companies. The respondents increased from almost to 249 to 269 million metric tons
belong to nine different sectors: Consumer Discretionary CO2e, reported Scope 2 emissions rose from about 9
(Arnoldo Mondadori Editore, Brembo, Fiat, Gruppo to 20 million metric tons CO2e. In 2011, 22 companies
Editoriale L’Espresso, Geox, Landi Renzo, Lottomatica, identified Scope 3 emissions, while in 2012 the number
Marr, Pirelli, YOOX); Energy (Eni, Saipem); Financials grew to 30 companies. Looking only at companies that
(Assicurazioni Generali, Banca Monte dei Paschi di also reported their emissions last year, total Scope 1
Siena, Banco Popolare Società Cooperativa, Credito emissions decreased from 258 million metric tons CO2e
Valtellinese, Exor, Immobiliare Grande Distribuzione, to about 244 million metric tons CO2e; the change
Intesa Sanpaolo, Mediobanca, UBI Banca, UniCredit, represents a 5% reduction on a year-to-year basis. It
Unipol); Health Care (Diasorin); Industrials (Ansaldo STS, must be said, anyway, that of the 13.6 million metric tons
Astaldi, Atlantia, Danieli & C Officine Meccaniche, Fiat CO2e reduction, only half of it can be related to emission
Industrial, Finmeccanica); Information Technology (ST reduction activities whilst the remaining is, as declared by
Microelectronics), Materials (Buzzi Unicem, Cementir, companies, due to reduced production.
Italcementi); Telecommunication Services (Telecom),
Utilities (a2a, Acea, Edison, Enel, Hera, Iren, Snam Rete With regards to emission data provided, the numbers
Gas, Terna). show how organizations are starting to understand the
1 Number of responding companies 2010 - 3 Top disclosure and performance
2012 scorers
46
CDLI
CPLI
35
Company name Sector
21
a2a Utilities √
Buzzi Unicem Materials √
2012 2011 2010 ENEL Utilities √
Eni Energy √ √
Fiat Consumer Discretionary √ √
Fiat Industrial Industrials √
2 Disclosure scoring 2011 - 2012
Intesa Sanpaolo Financials √ √
Italcementi Materials √
Average disclosure score in 2011 63 Pirelli Consumer Discretionary √
6 ST Microelectronics Information Technology √
Delta improvement for 2011 panel
Average disclosure score in 2012 for 2011 panel 69
Delta drop by new companies 7
Average disclosure score for 2012 panel 62
12importance of verifying their data: 63% of respondents On the other hand, the average score of companies this
obtained independent verification or assurance of their year included in the Carbon Disclosure Leadership Index
emissions in 2012, and 46% gained full points for (CDLI) is 90, showing that there has again been a great
verification of emissions (or a percentage of emissions) improvement from the previous year’s average score of
of at least one of the scopes. The number of Italian 84. This striking difference between the leaders and the
respondents providing verification statements approved whole sample is mainly due to different levels of maturity
by CDP almost doubled from 2011 to 2012 (from 12 in on the subject of carbon management not only among
2011 to 21 in 2012), with 100% of responding companies new respondents but also from companies that have been
in the Utility and Materials sectors getting full scores on disclosing to CDP for some time now but that may not
both disclosure and performance for at least one of the have yet achieved the quality on emissions disclosure
scopes. required. Conversely, top ten companies making up this
year’s CDLI have improved their scores by 7% and now
Although 81% of responding companies declare to be cover seven out of the nine responding sectors (Health
engaged in emission reduction initiatives, only 58% have Care and Telecom are not represented), two more than
actually set targets of, either or both, absolute or intensity in 2011. Buzzi Unicem achieved the striking result of
nature. The majority of those which have set at least one entering, in their first year of disclosure, into the CDLI.
target seem to be ahead of or in line with them. However, In addition, comparing the disclosure scores from those
only 60% (15 out of 25) of the companies with reduction companies that responded to CDP in 2011 and did so
targets declare their emissions was exclusively due to the again in 2012, we see an increase in their average score
implementation of relevant activities. In addition, long-term from 63 to 69. (Fig. 2) This is an important sign which
planning of activities does not seem to be on the agenda makes us believe that climate change disclosure and
of executives, since 90% of the reported targets have a performance will improve among all companies in the near
timeline until 2015 and just a small minority of companies future.
sets targets towards the year 2020.
With regards performance scores, three Italian companies
The global economic downturn has inevitably been a (ENI, Fiat and Intesa Sanpaolo) were assigned the perfor-
significant reason for the reduction of emissions by Italian mance band A, becoming part of the CPLI; Intesa and Eni
companies, as many of them explain their emission are included in the Global 500 CPLI as well. (Fig. 3)
reductions with a decrease in output. But this means that
an increase in production is likely to result in an equivalent Although the importance Italian companies are giving to
increase in GHG emissions. Looking closer at the absolute climate change is growing, it seems as if respondents are
amount of emissions that companies plan to reduce, engaging in climate change management without yet a
most of it is related to current or planned activities by one full understanding on the business case and innovation
company only, namely Enel, and is related to avoided opportunities behind it. Indeed, we see that companies
emissions due to the installation of renewable energy have targets but these are mostly short-term, investment
facilities. reduction initiatives are in place but not identified on the
basis of a sound financial analysis, companies extensively
Climate change plays a significant role in both the risks identify risks and opportunities but again do not assess
and opportunities perceived by respondents. Companies the financial implications on their business operations.
have identified about 280 risks and 180 opportunities This leaves us questioning whether disclosers are really
drivers. The Utility sector identifies more risks than on track and have a viable approach towards successful
opportunities (65 risks against 37 opportunities), whilst climate change management. Despite the improvement
companies from the Financial sector are those with the in the response rate of the Italy 100 sample, companies
highest balance (66 risks against 52 opportunities). 26% still need to define an integrated approach to climate
of the identified risks and 28% of the opportunities are change necessary for the creation of a sustainable
expected to materialize within a year’s time, however the business model and the establishment of best practice
assessment of the potential financial implications that standards towards an economic recovery under a low
risks and opportunities can have on business operations is carbon scenario. Especially during these times of crisis,
proving not to be a common practice among responding it is advisable to engage in activities with a satisfactory
companies. return on investment and that can generate long-term
value for the company. Therefore our advice is to shift the
We have seen a slight decrease in the average disclosure corporate mind-set towards the three pillars of sustainable
score of Italian responding companies from 63 points in development (economic, social and environmental) and
2011 to 62 points this year. Though very small, this allocate resources more efficiently to prepare for long-
decrease is due to some of the new respondents that have term competitiveness.
recently started engaging in carbon management
and have, therefore, still a limited quality of disclosure.
(Fig. 2)
3. Reported emissions are related to Italian companies’ operations worldwide
13key themes and
highlights
beatrice Lamonica, accenture Sustainability Services
“We reaffirm that climate change is
one of the greatest challenges of our
Carbon Management: has measurement and reporting time, and we express profound alarm
been translated into action? that emissions of greenhouse gases
continue to rise globally.”
How are Italian companies moving in this context? Are
emissions continuing to rise? Does climate change
represent an opportunity for Italian companies? How are
The Future we want, United Nations
investments being addressed? We think these questions (June 2012)
are the most relevant and we highly appreciate the
opportunity of having insights from the most important number of companies disclosing their emissions.
Italian companies, thus allowing us to draw a picture. Having a glance at sectors, Utilities and Materials have
the largest share of Scope 1 emissions, while Materials
Companies’ engagement and attention to carbon and Consumer Discretionary have the highest Scope
management is high and growing: the percentage of Italian 2 emissions. (Fig. 5) These results are not surprising
companies responding to CDP’s investors request has considering that: the Utilities sector is made up of
increased again this year by 30% to 464 companies from 35 eight companies and that electricity is still mainly
in 2011. Reported emissions from Italian companies globally produced through a thermal production process, while
have changed accordingly; from 2009 to 2011 Scope 1 companies representing the Materials sector are cement
emissions increased from almost to 249 to 269 million manufacturing companies whose production process6
metric tons CO2e, while reported Scope 2 emission rose is characterized by high GHG emissions and that the
from about 9 to 20 million metric tons CO2e. The number Consumer Discretionary sector comprises 10 companies,
of companies providing details on Scope 3 emissions has 4 of which are industrials7 and, therefore, have significant
grown from 22 to 30 this year, reaching total of 332 million electricity consumption. Emissions reported by Italian
metric tons CO2e in reported Scope 3 emissions. (Fig. 4) companies also include their operations abroad, on the
other hand, some foreign companies have operations and,
With regards to Scope 1 emissions, the net increase of 11 therefore, emissions in Italy.
million metric tons CO2e can be explained with the first-
time disclosure of emissions by Buzzi Unicem, with more The total quantity of Scope 1 emissions occurred in Italy
than 21 million metric tons CO2e and Enel’s increase of 7 (both by Italian and foreign companies) by respondents
million metric tons CO2e due to a an increase in electricity to CDP is equal to approximately 139 million metric tons
generation and a change in the fuel mix used. Scope 2 CO2e; the total Italian emissions as reported by Ispra is
emissions have doubled, mainly due to an increasing
4 SCoPE 1, 2 anD 3 EMISSIonS aT a gLanCE5 5 SCoPE 1 anD 2 EMISSIonS by SECTor
• 2012 • UTIL • TCOM
• 2011 • MAT • FIN
• 2010 • EGY • IND
• CD • IT
350 332 Scope 1
300 269 258 249 1,6 9,8 1,3 3,8 1 0,90,9 0,9
million tCo2e
million tCo2e
250
200 Scope 2
150 154,2 59,3 52,4
100
20
50 11 9
100%
10%
20%
30%
40%
50%
60%
70%
80%
90%
0%
0 Scope 1 Scope 2 Scope 3
14equal to 4378 million metric tons CO2e, which implies 58% (25) of respondents declare to have an emission
that companies reporting through CDP (both in Italy and reduction target. They represent an increase of just
abroad) represent a significant 28% of the country’s GHG 3 companies compared to last year’s results despite
emissions. (Fig. 6) having an increase of 30% (11) in the total number of
disclosers. (Fig. 7) This indicates that new respondents
Companies are engaged in carbon management, but are, on average, less mature from a carbon management
how are emissions changing? Looking only at those perspective. This means that for the companies the
companies (29) that reported their emissions last year potential for improvement is very high. Using this potential
too, total Scope 1 emissions decreased from 258 million will ultimately be dependent on the company’s ability to
metric tons CO2e to about 244 million metric tons CO2e; leverage on the opportunities that carbon management
the change represents a 5% reduction on a year-to-year offers and which may add substantial business value.
basis. Even if the percentage is relevant9, it must be said While the percentage of CDLI companies that set an
that of the 13.6 million metric tons of CO2e reduction, only emission reduction target is 100%, it reduces to 45% for
half of it can be related to emission reduction activities non CDLI companies.
whilst the remaining is, as declared by companies, due
4. 46 companies responded to CDP of which 3 referred to a parent or holding company’s
to reduced production. As a consequence, under a future response. This percentage, as well as those provided in figure KS1, KS3 and KS4 incorporate
economic recovery scenario, the prospect of reducing these responses to provide full picture of response rate (with the final figure taken on 30th June
2012), however, the remaining analysis in this report is based on the lower total of 43 which
companies’ emissions will become ever more difficult to excludes these 3 companies
achieve than it has been until now. It is therefore important 5. There has been a change in the way in which Scope 1 and 2 emissions reported under CCRF
are calculated although this is not expected to cause a major change in reported emissions. In
that governments do not to step back on their declared 2011 the Scope 1 and 2 figure was taken as Parent and subsidiaries under control of the parent,
intentions to fight climate change- as recently proved by whereas in 2012 joint ventures are also included. Years refer to the reporting year, not to the year
in which emissions occurred. Scope 3 data has only been included for 2012 due to changes in
the Italian Minister of Environment, Corrado Clini, who Scope 3 occurring between the 2011 and 2012 reporting cycles as a result of the publication of
the Greenhouse Gas Protocol Scope 3 Standard
reiterated his objective to reduce Italy’s GHG emissions by
6. Emissions due to fuel combustion and to clinker production (limestone decarbonation: CaCO3
25% by 2020 compared to 1990. becoming CaO and CO2)
7. Brembo, Fiat, Landi Renzo, Pirelli
Evidence so far has shown that companies are committed 8. Ispra National Inventory Report 2012, includes Industrial and Energy; Agriculture and Waste
to measure and report, which is certainly a significant sign are not included
of the importance given to carbon management, however 9. For industrialized countries the IPCC stated that to prevent dangerous climate countries need
to reduce emissions by 20% compared to 1990; the resulting percentage of reduction needs to
attention needs also to be given to how much of this be around 4% per annum on a compound basis between now and 2050
effort is actually translating into the setting of targets by 10. Companies may report multiple emission reductions targets; companies are only counted
companies and their medium-long-term commitment to once in the statistics presented above and on figure 5,with exceptions of the statistics on
absolute and intensity targets where companies that have both types of targets will be counted
reduce their GHG emissions. once in each type
6 ExTra bounDary SCoPE 1 rEPorTED 7 nuMbEr of rESPonDEnTS WITh an
EMISSIon of ITaLIan anD forEIgn EMISSIon rEDuCTIon TargET10
CoMPanIES
• NO
• YES
50
33 MtCo2e 40
18
30
11
163 MtCo2e ~60%
of reported scope I 20 5
25 22
emissions
10 16
0 2012 2011 2010
15Most targets (40%) are set both as absolute and intensity change related targets is 23 out of 43 (compared to only
terms; the most challenging are those set by Eni (80% 16 in 2011). Setting incentives is a strategy that has
emissions reduction from flaring, accounting for 56% of currently been put into practice by companies mainly in
Scope 1 emissions, from 2007 to 2015) and Hera (20% the Utility, Consumer Discretionary and Industrial sectors.
Scope 1 and 40% Scope 2 reduction from 2009 to 2014). In most cases companies that set incentives are the same
Corporate reduction targets disclosed to CDP are not that set reduction targets.
nearly this radical: only five companies (Atlantia, Edison,
Enel, UniCredit and STMicroelectronics) in fact, set a long- There are two main trends that can be clearly identified
term target towards 2020. In addition 90% of reported from the analysis of the information reported. The first is
targets will be achieved by 2015, of which 40% already that setting targets is becoming common practice: 58% of
by the end of 2012. Whilst the large majority of targets set responding companies have a reduction target. Secondly,
by Italian companies only consider the next three years, Italian companies are being very conservative in setting
the European Union is looking at 2050, hypothesizing a targets as shown by their short-termism (90% of reported
CO2 reduction target of 80% compared to 1990 levels11. targets will be achieved by 2015) and by the fact that
Companies’ short –term vision and the EU’s long-term many companies will have already met their objective even
vision will eventually have to be aligned to really drive an before reaching the target year.
impact on emissions.
Although cautious about long-term commitments, Italian
Utilities are the most proactive in setting emission companies are very active in identifying and implementing
reduction targets, with 7 companies out of the total 8 emissions reduction initiatives: a great majority (81%) of
responding; only Iren in fact has not set targets while companies declares to have active emission reduction
the other 7 companies set targets on Scope 1 emissions initiatives and 77% (33 companies) have reported more
(Acea, Edison, Enel, Hera, Terna and Snam), Scope 2 than 180 emissions reduction initiatives, from which
(Acea and Hera) and Scope 3 (a2a). Most companies in energy efficiency measures and low carbon energy
the Industrial sector (4 out of 6: Ansaldo STS, Atlantia, together contribute more than 60% to the total number of
Fiat Industrials and Finmeccanica) have also set targets. initiatives. (Fig. 9)
Overall, the majority of these companies declared to be in
line with or ahead of meeting the target. (Fig. 8) Nevertheless, as in last year’s report, once again we see
that the number of responding companies with reported
The number of companies that provide incentives for emission reduction initiatives in place is higher than
the management of climate change issues continues to the number of companies with an emission reduction
increase on a yearly basis. In 2012, the companies that target. It thus seems that Italian responding companies,
declared to provide incentives for the attainment of climate before committing formally to tangible targets, prefer to
8 TargET anD InCEnTIvE by SECTor12 9 rEDuCTIon InITIaTIvES
• Responding companies 16 180
• Companies with target 9 5%
• Ahead of or met target 18 9%
• Companies that provide incentives 23 10%
38 13%
11
FIN 6
5 21%
2 100%
CD 3
10 76
2
5
2
number of companies
EGY 1
42%
1
HC
6
IND 4
2
4
efficiency
Energy
Low carbon
Transportation
reduction
Process emission
change
Behavioral
Other
Total
1
IT
1
3
MAT 2
2
TCOM 1
8
UTIL 7
4
7
16implement emission reduction activities without setting a an annual monetary saving of approx. €630 million for a
reduction goal beforehand. total investment of €3,600 million. These numbers are very
significant, considering that resulting emission reductions
Energy efficiency initiatives are certainly considered as the will be equivalent to a 17% decrease in emissions of the
most interesting ones, in particular by those companies energy sector in Italy13. 62 million metric tons CO2e out
that have a dedicated budget for these initiatives. of the 72 million metric tons CO2e are related to Enel’s
Disposing of a dedicated budget is also the most common initiatives and, in particular, to low carbon installations that
method to drive investments into carbon reductions, allowed the company to generate about 83 billion kWh
followed by compliance with regulation. (Fig. 10) from renewable sources in 2011, avoiding over 57 million
It is quite surprising to observe that companies do not metric tons CO2e.
commonly use the lower return on investment analysis or
marginal abatement cost (MAC) curve to select initiatives Looking at the payback period of the initiatives
to be realized. This is interesting because these two (information available for 122 out of 180 reported), for half
methods would ensure that economic analysis of the of them it is shorter than 3 years, corroborating the fact
investment is integrated into decision making processes; that emission reductions can provide cost reductions and
the MAC method in particular is based on the analysis significant financial returns also in the short-term. (Fig. 12)
of the marginal abatement cost of reducing one ton of
CO2 and, therefore, is very useful to compare different Though the current information on the payback periods
initiatives. does not allow us to identify those initiatives that prove to
be the most efficient, we have studied those initiatives for
The two most common methods used, dedicated budget which companies provided information also on
for energy efficiency and compliance with regulation, avoided emissions, to understand which are the most
suggest that companies are not commonly using cost-effective and with the highest potential in terms of
comparative financial methods to drive investments. emission savings.
Actually, even after having implemented the reduction
activities companies are not keen to analyse them on a Energy efficiency-related initiatives indicate to have the
quantitative basis as proved by percentages of initiatives highest average avoided emissions and lowest payback
for which financial analysis information is provided. (Fig.11) periods. In fact, out of the 79 initiatives for which a
For those companies that provided information on their 11. A Roadmap for moving to a competitive low carbon economy in 2050, COM (2011) 112
reduction activities, which are the expected results from 12. Key for sector abbreviations: FIN= Financials; CD= Consumer Discretionary; EGY= Energy;
HC= Health Care; IND= Industrials; IT= Information Technology; MAT= Materials; TCOM= Tele-
the overall initiatives reported by Italian companies? A communications Services; UTIL= Utilities
stunning estimate of 72 million metric tons CO2e savings, 13. Ispra: energy sector emissions in 2010 equal to 415,73 MtCO2
10 METhoDS uSED To DrIvE InvESTMEnTS 11 InforMaTIon ProvIDED on rEDuCTIon
InITIaTIvES
Compliance with regulation
• Provided
Other 25 Budget for energy efficiency • Not Provided
20
Partnering with
Budget for low
governments on 15 carbon product
techn. development
R&D
10 100
5 80 44% 44% 35% 33%
Marginal Budget for
abatement other reduction
cost curve 0 activities 60
40 65% 67%
Lower ROI Employee
specification engagement
56% 56%
20
Internal finance Financial 0
Saving
Annual Monetary
Investments
Period
Payback
CO2 Saving
Estimated
mechanisms optimization
Internal incentives Internal price of carbon
17You can also read