AGRICULTURE: FACTS & TRENDS - South Africa
←
→
Page content transcription
If your browser does not render page correctly, please read the page content below
AGRICULTURE: FACTS & TRENDS
    South Africa

1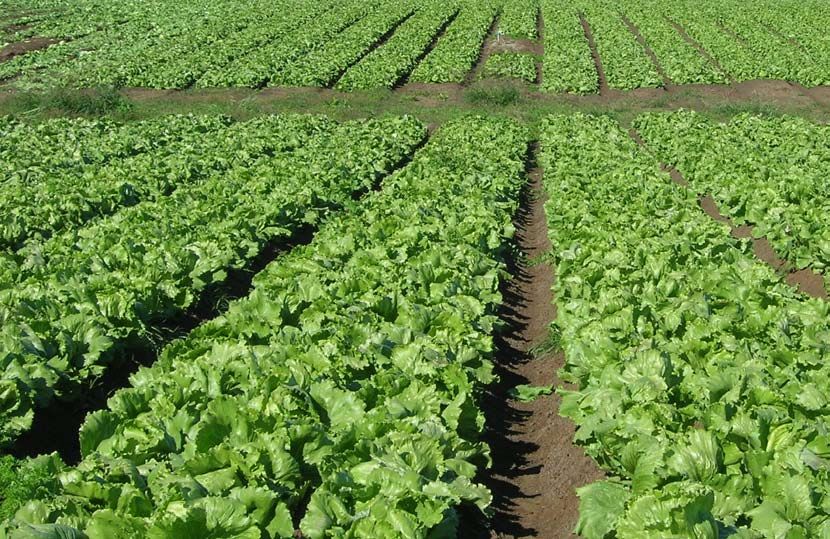
FOREWORD
This report provides a snapshot of the overwhelming evidence
Agriculture has done more to reshape
that we need better environmental practices if we want to ensure
ongoing productive agricultural systems and food security in
South Africa. It also serves to underpin WWF’s drive to promote
the protection of natural ecosystems, which produce the critical the natural world than anything else
goods and services that underpin agricultural practices in the
country. We have not attempted to specify every issue, but rather
we humans do, both its landscapes and
aimed to provide a broad view of the negative impacts of agri its fauna and flora. Our eating also
cultural development that is focused on maximum productivity
by exploiting natural resources while disregarding the complex constitutes a relationship with dozens
hidden costs – financial and otherwise – of food production.
It also highlights some of the best-practice solutions we need to
of other species - plants, animals and
follow if we want to meet our growing demand for food and fibre fungi - with which we have co-evolved
to the point where our fates are deeply
– one of the key challenges of the 21st century.
The information has been compiled from diverse and reliable
sources to construct a vivid picture of the state of our agricul intertwined.
tural resources. It is intended to stimulate debate and catalyse Michael Pollan, The Omnivore’s Dilemma
collaboration throughout the agricultural value chain.
Dr Morné du Plessis, CEO WWF-SA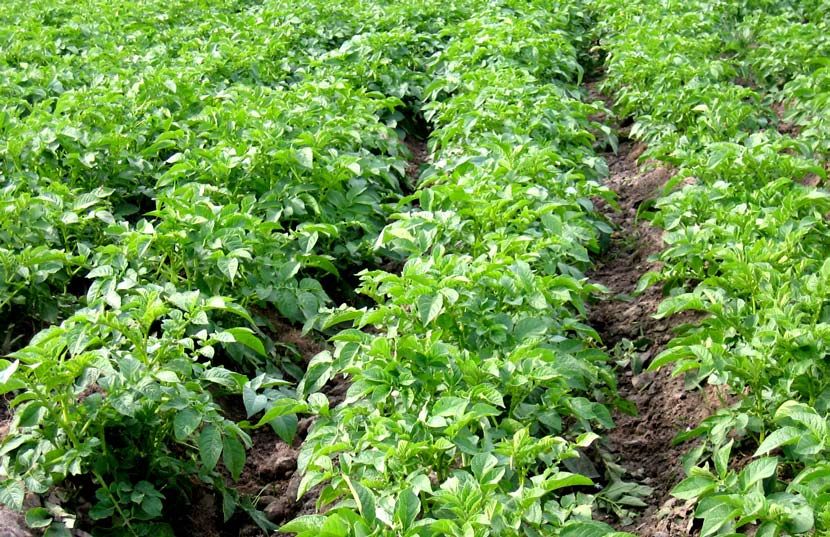
CONTENTS
The Context O2    Land & Soil 06   Water 10 Biodiversity & Ecosystems 14
Economics 18     Social Considerations 22   Conclusion: Living Farms of the Future 24
References 26 Appendix 27
Agriculture is the foundation of developing economies. As one of these economies, South Africa needs
to ensure a healthy agricultural industry that contributes to the country’s gross domestic product (GDP),
food security, social welfare, job creation and ecotourism, while adding value to raw materials. But the
health of the agricultural sector depends on the sustainability of farming methods. Farming practices
must therefore not only protect the long-term productivity of the land, but must also ensure profitable
yields and the well-being of farmers and farm workers.
THE CONTEXT
South Africa’s agricultural regions
South Africa is a rich and diverse country. It has a vibrant cultural
diversity and a spectacular range of vegetation types, biodiversity,
climates and soil types. The country can be divided into distinct
farming regions, and farming activities range from intensive crop
production in winter rainfall and high summer rainfall areas, to
cattle ranching in the bushveld and sheep farming in the more
arid regions.
Climate-soil combinations leave only 12% of the country suitable
for the production of rain-fed crops. With only 3% considered truly
fertile land, South Africa falls short of other countries, such as In
dia, where arable land covers 53% of the country. Most of South
Africa’s land surface (69%) is suitable for grazing, and livestock Agricultural regions of South Africa
farming is by far the largest agricultural sector in the country. Source: FAO Corporate Document Repository
Sustainable farming is about meeting the needs of South Africans today and in the future. The recent global
rise in food prices and repeated reports about social unrest in a large number of countries reveal the strategic
and basic importance of the agricultural sector for social and economic stability.
2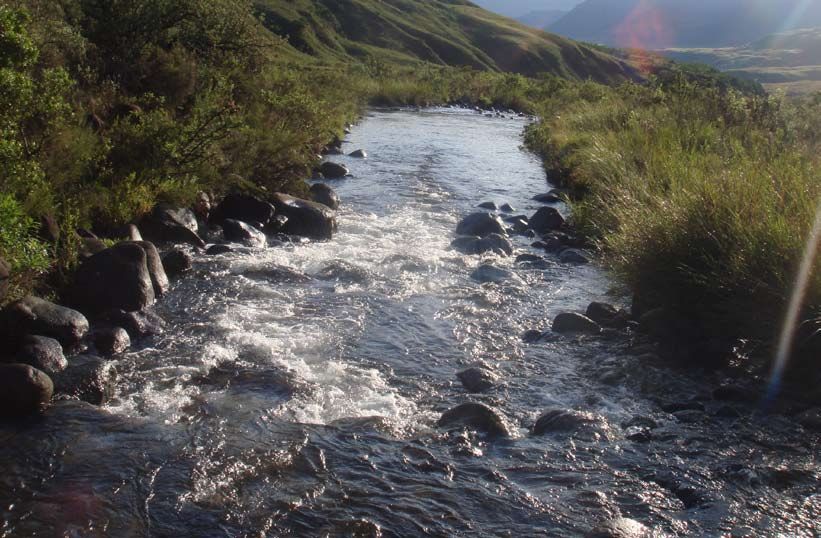
Increasing need and changing food consumption
South Africa’s population is growing at almost 2% per year. The by 30% between 2001 and 2004. This has allowed a shift from
population of 49 million in 2009 is expected to grow to 82 mill staple grain crops to a more diverse diet. South Africans have
ion by the year 2035. Food production or imports must more than shown a decrease in the consumption of the staples maize and
double to feed the expanding population, and production needs to bread, and have massively increased their annual consumption
increase using the same or fewer natural resources. In addition, the of chicken from 6 kg to 27 kg per person. Per capita egg con
demand for certain food types will shift as more people become sumption has also doubled. Interestingly, the per capita consump
wealthier. tion of fruit and vegetables has remained constant, while beef,
mutton, pork and milk consumption has declined (Agricultural Stat
South Africans have already shown interesting changes in food istics, 2008).
consumption since the 1970s. Thanks to increased wealth and
post-apartheid reforms, the country’s middle class has increased
Production vs Demand
Maize and wheat: The shift to the consumption of chicken and
eggs is a less efficient use of South Africa’s maize than direct human South African maize
16 000 40
consumption. About half of South Africa’s maize is used for animal
14 000 35
feed, and about 70% of the feed is used for poultry. Nevertheless,
12 000 30
the conversion of maize to chicken is more efficient than the conver
sion of maize to feedlot beef (exclusively range-fed beef has no 10 000 25
impact on South Africa’s maize supplies). 8 000 20
6 000 15
While annual national maize production in South Africa fluctuates 4 000 10
widely according to rainfall, average production has remained con 2 000 5
stant over time. This is a concern, as consumption has increased with 0
2000
2003
2006
1988
1985
1982
1970
1979
1997
1973
1991
1994
the growing population and maize production may soon not meet
1976
local demand, affecting both local and regional supply. Like maize,
Production (1 000 t) Consumption (1 000 t) Area planted (1 000 ha)
wheat production also fluctuates and again average production has
remained constant while consumption has increased dramatically
over time. In recent years, wheat imports have increased massively Source data: Agricultural Statistics, 2008
to meet local demand.
South African maize South African wheat
Red
16 000meat, chicken and dairy: South African red meat pro 4 000
duction
14 000 has kept up with consumption, although there has been 3 500
some
12 000
export of higher-grade meat and import of lower grades. 3 000
Local poultry production has increased significantly over the last 20 2 500
10 000
years, but has not been able to meet the massive increase in local
8 000 2 000
demand for white meat, and chicken is now one of South Africa’s
6 000 1 500
largest agricultural imports. South African milk production has been
4 000 1 000
relatively constant, although imports of dairy products have exceed
2 000
ed exports since 2000. 500
0 0
2000
2003
2006
1988
1985
1982
1970
1979
1997
1973
1991
1994
1976
2000
2003
2006
1988
1985
1982
1970
1979
1997
1973
1991
1994
1976
Deciduous fruit and citrus: South Africa is well known for the
high Production
quality of(1 its
000deciduous
t) fruit and
Consumption citrus,
(1 000 t) over
Area half of (1which
planted 000 ha)is Production (1 000 t) Consumption (1 000 t) Area planted (1 000 ha)
exported. The volume of these agricultural exports has increased
dramatically over the past 20 years, generating foreign exchange Source data: Agricultural Statistics, 2008
and profits for local farmers.
3
Water availability is the single most important factor that limits agricultural production in South Africa.
Furthermore, the situation is likely to become dire due to rapidly increasing demand from other sectors of the
economy and climate change.
Shifting trend towards intensified
If we can reduce food loss and wastage, we won’t need to pro-
agriculture duce so much more. A lot of food is lost between the farmers’
Declining farming profitability and water scarcity (drought, declin
field and the dinner table – in food storage, transport, food
ing rainfall or over-demand for water) has left South Africa with less
processing, retail … and in our kitchens.
than two-thirds of the number of farms it had in the early 1990s. In
many instances the lost farms have been changed to other land
uses, or consolidated into larger farming units to achieve effective
economies of scale. Although the area under maize, wheat and Input costs required for intensive farming are increasing. These costs
dairy (5% of the national herd) has decreased significantly over are also subject to changes in the oil price, the price of raw ma
the last 20 years (Agricultural Statistics, 2008), production remains terials and exchange rate fluctuations, leaving the farmer with little
relatively constant, indicating an increasing trend in intensified pro control over his/her affairs.
duction.
The cumulative impact of these factors degrades farmlands
The remaining farms have generally increased their irrigation, fuel, and their vital catchment areas. As a result, the long-term pro
fertiliser, mechanisation and genetically modified seed inputs. In ductivity declines and these areas become more vulnerable
many cases, advisory services provided by fertiliser companies to climate change. Intensified agriculture often also means in
and agribusinesses have entered the vacuum of the underresourced creased mechanisation, which in turn means fewer jobs on
government extension service. These corporate companies provide farms. This affects the country’s social well-being. The move to
their own extension staff and build relationships with farmers, which wards genetically modified (GM) crops that depend on herbi
can create a dependence on the products they promote and sell. cides and fertilisers make farmers increasingly reliant on profit-
orientated companies. Use of genetically modified crops and
Poorly managed intensive farming has many negative impacts on certain pesticides, herbicides and fertilisers may also isolate South
the natural environment, on people’s well-being and on a farmer’s Africa from lucrative export markets. Relying on single-variety crops
ability to adapt to change. A dependence and overuse of synthetic is also risky. If these crops fail to perform, it will have a significant
fertilisers, pesticides and herbicides reduces long-term soil fertility, impact on national production.
causes soil erosion, pollutes water supplies, poisons fragile ecosys
tems, exposes farmers and farm workers to toxins, and contributes
to climate change through greenhouse gas emissions.
Consumers throw away more than a third of the
food they have paid for and taken home.
(Lundqvist et al., 2008)
In 2007, fertiliser imported from
China and used on Eastern Cape
pineapple farms was found to con-
tain toxic levels of cadmium, arsenic
and lead, and resulted in an export An exciting new trend
ban by the EU. As a result, pineapple The organic (chemical free) industry is the fastest-growing industry segment world-
farmers lost a fortune and important wide. World organic food sales jumped from $23 billion in 2002 to $52 billion in
EU markets were jeopardised. 2008 (Datamonitor, 2009).
4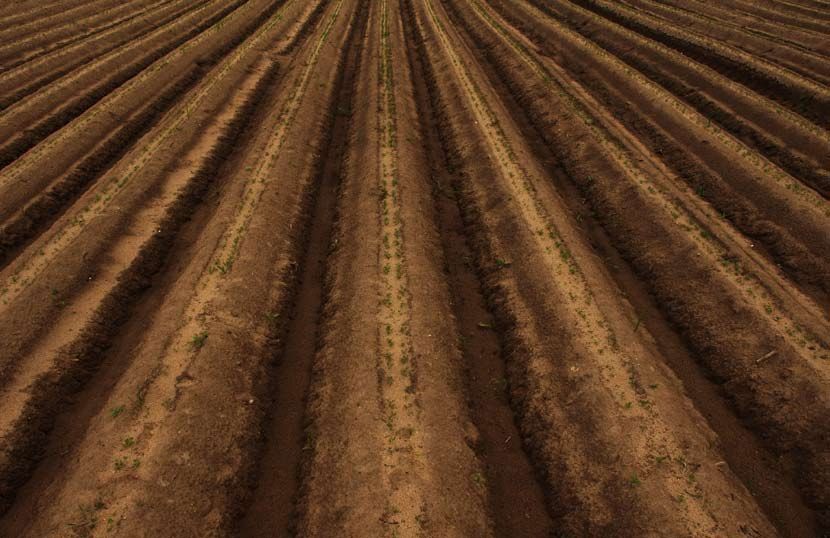
It’s tough out there
Being a conventional farmer in South Africa is one of the
toughest jobs around.
Here are some of the challenges faced daily:
Rising input costs and dependence on external factors that the farmer cannot
control, such as the oil price and the exchange rate
Finite natural resources (looming water scarcity, increasing loss of soil)
Lack of subsidies and extension support, for established commercial farmers
and for emerging/developing black farmers
Very little market predictability, and non-tariff trade barriers in importing
countries
Increasing competition from cheap, subsidised imports
Exposure to toxic chemicals
High murder rate and increasing tenure insecurity
Predicted negative long-term changes in the climate
Decline in the health and functioning of our supporting and underpinning
natural systems.
An emerging trend – sustaining living farms
South Africa requires a more sustainable approach, or the welfare The benefits of sustainable farming should be:
of our nation – both current and future generations – is at risk. Mis DD Reduced or predictable input costs
managed agricultural industrialisation and intensification could com DD Stabilised yields
promise food safety and increase unemployment and environmental DD Reduced environmental pollution
degradation. DD Reduced exposure to toxins
DD Increased water use efficiency
In contrast, sustainable agricultural practices aim to: DD Living soils – increased soil fertility and/or nutrient-holding
DD Change the way land and water resources are capacity
managed, so that their long-term productivity is optimised and DD Reduced soil erosion
sustained DD Carbon sequestration (mitigating climate change)
DD Contribute to the economic and social well-being of all DD Enhanced, robust natural systems protecting biodiversity and
DD Ensure a safe and high-quality supply of agricultural ecosystem services.
products
DD Safeguard the livelihood and well-being of farmers, farm South Africa has a history of change, and is a country that adapts
workers and their families well to social and political changes. Once again we need to draw
DD Maintain healthy, functioning agricultural ecosystems rich in on our common strengths and our commitment to mobilise our re
biodiversity sources and change for the better. We need to realise that all South
DD Mitigate and adapt to climate change. Africans are affected by the health of our agricultural sector. Sus
tainable solutions will require collaboration between government,
industry, producers and the scientific and conservation community.
‘The whole of creation depends upon the soil, which is the ultimate foundation of our existence.’
Friederich A Fallow
5
South Africa has limited fertile land and the majority of crop farmers need to increase the fertility of
their soils to achieve good crop yields. Farmers in the fertile areas also need to maintain the fertility
of their soils, as frequent cropping depletes the soil of nutrients. How farmers improve or maintain soil
fertility is central to the sustainability of their operation.
LAND & SOIL Legend
High and moderate
Low and marginal
Setting the scene
Not suited for cultivation Changing land
management practices
Since ancient times, organic fertilisers (manure, urea, plant matter,
bones, shells, lime) have been used to improve soil. Synthetic fertil
isers emerged in the 17th century and the industry burgeoned after
the First World War, when facilities that had produced ammonia and
nitrates for explosives were converted to produce nitrogen fertilisers.
The development of the South African fertiliser industry dovetailed
with the country’s mining industry, which necessitated the production
of explosives in South Africa.
Land capability including climate restrictions Correctly applied, fertilisers have a positive impact on soil fertility
Source: Institute for Soil, Climate and Water, Agricultural Research Council
and plant growth, and were one of the main drivers behind the 20th
century’s Green Revolution. By increasing the production potential
While a third of South Africa receives sufficient rain for of land, fertilisers also protect the natural environment from agricul
crop production, only a third of this area (approximately tural expansion. Yet, if overused, both organic and synthetic fertilisers
12% of the country) has fertile soil. Most of this is marginal cause major damage to the environment. Both run off into rivers and
for crop production and less than 3% of South Africa is con- pollute groundwater, and when applied in single large doses, their
sidered as high-potential land (high and moderate areas nitrogen is released into the atmosphere as nitrous oxide – a green
on map). house gas 300 times more potent than carbon dioxide.
6
Poorly applied, synthetic fertilisers also reduce soil fertil
ity – the opposite effect to what they are intended to achieve
(Mulvaney et al., 2009). Exclusive use of synthetic fertil-
isers leads to a decline in soil organic matter and soil life. Even
Salty soils
Irrigation, which is used to expand crop production
tually the soil becomes devoid of life, and only provides physical
beyond South Africa’s rain-fed areas, can reduce soil
support to the plant. At this stage the farmer is completely reli
fertility by building up salts in the soil (salinisation). An
ant on fertiliser and may increase inputs to compensate for the
estimated 260 000 ha of irrigated land in South Africa
reduced soil fertility. If continued, this practice leads to acidic
is affected by salinisation. About 15 000 ha of this is ser
and salty soil with, in some cases, high levels of toxic metals and
ious enough to limit the choice of crops to salt-tolerant
radioactive elements.
species only and would require costly rehabilitation. The
main cause of salinisation is irrigation in arid areas where
More than 5 million hectares (more than double the size of
evaporation rates are high and rainfall is too low to leach
Kruger National Park) of cultivated land have already been ser
salts from the soil. Irrigation with salty water dramatically
iously acidified in South Africa (SA Yearbook, 2008/9). This
worsens the problem, for example in coastal areas where
degraded soil is prone to erosion, and the subsurface soil layers
the overexploitation of groundwater lowers the water
that remain are significantly less fertile and less absorbent.
table, causing the intrusion of marine water.
Ploughing the land
Crops can be grown for several years Ploughing (otherwise known as tillage) is one of the oldest methods of preparing the soil
without ploughing. This practice, called for planting and controlling weeds, but is also one of the most abused methods. The mould
minimum or no-till farming, ensures that the board plough originated in Europe to turn over, dry out and warm up frigid, water-logged
soil is less prone to erosion and effectively European soil in spring. In the South African context, the use of this imported practice results
retains its organic matter, water and nu in ploughing dry, sun-baked soil and makes little sense.
trients. Reduced ploughing also reduces
fuel costs on the farm. Between plantings, Poorly managed, tillage can have a detrimental effect on the soil. It can cause a compac
the soil should be planted with cover crops tion layer (a plough pan) below the plough level, which can lead to decreased water infil
to reduce soil surface temperatures, pro- tration and erosion of the topsoil. The increased use of heavy machinery has also caused
tect it from wind and rain erosion, increase compaction layers on top of many soils, making these areas prone to erosion. Excessive
soil organic matter and maintain healthy ploughing stimulates the breakdown of organic matter in the soil. This not only diminishes this
populations of soil microbes. Legumes are precious soil resource, but also releases carbon dioxide into the atmosphere, contributing
beneficial as they increase soil nitrogen. to climate change.
A characteristic of most South African soils is that they are extremely vulnerable to degradation and have
low recovery potential. Thus even small mistakes in land management can be devastating, with little
chance of recovery. It is estimated that 25% of South Africa’s soils are highly susceptible to wind erosion.
These include the sandy soils of the North West and the Free State - the areas that produce 75% of the
country’s maize.
Commercial and sustainable
ZZ2, a commercial farming company based in Limpopo and a world leader in tomato production, has introduced the concept of
Natuurboerdery (Nature Farming) to their operations. Since 2002 the ZZ2 farming enterprise has implemented a programme for
the gradual conversion of all its farming activities from a predominantly conventional chemical to a more ecologically balanced
nature farming approach. They aim to achieve long-term improvement and stabilisation of the soil and optimum sustainable yields
through the use of compost and manures, compost tea, Effective Micro-organisms (EM), bioproducts, minimum tillage, cover crops
and crop rotation.
7
Livestock
Most of South Africa’s land surface (69%) is suitable for
grazing, and livestock farming is by far the largest agricultural sector
in the country. The South African national cattle herd has increased Overstocking
by about 6 million head since the 1970s and now stands at near Most of South Africa’s grazing land is stocked beyond its
14 million (Palmer & Ainslie, 2006). This increase has almost met the long-term carrying capacity. Overstocking is most evident
increased demand from South Africa’s growing population. Interest in the communal rangelands of Limpopo, KwaZulu-Natal
ingly though, per capita consumption of beef has declined since and the Eastern Cape, which support more than half of
the 1970s. The consumption of chicken is on the increase in South South Africa’s cattle. Overstocking can cause trampling
Africa and exceeds the total consumption of red meat; a trend that and crusting of the soil and denude the veld of vegeta
is likely to continue. tion. This leads to reduced productivity, reduced soil fertility
and erosion. As much as 91% of South Africa is defined as
The carrying capacity (i.e. potential stocking rate) of land in South arid or semi-arid, and it is in these areas that land degrad
Africa increases eastwards, in accordance with increased rainfall. ation (compounded by climate change) can lead to
Cattle are concentrated in the eastern, wetter regions of the country, desertification and the irreversible loss of productive land
as well as in the North West Province and the Northern Cape, (Gbetibouo & Ringler, 2009).
while sheep are largely farmed in the drier western and central
areas of the country. The total area of grazing land has declined
over time owing to expanding human settlements and activities (such
as crop farming, forestry and mining). This decline is most notable
in Gauteng and the Western Cape with their high rates of urban
isation, but communal districts in Limpopo, KwaZulu-Natal and the
Eastern Cape have also lost grazing lands.
SA beef
Combined degradation index
30 Insignificant
Light
Moderate
25 Severe
20 Degradation in South Africa
Source: State of the Environment, National Department of Environmental Affairs
15
10
5
Improved pastures
Some commercial farmers increase the carrying capacity of
0 their land by adding fertilisers, planting additional palatable
2000
2003
2006
1988
1985
1982
1970
1979
1997
1973
1991
1994
1976
species (called ‘reinforcement’) and/or planting pastures. All
Cattle herd
these techniques require the application of fertilisers, which are
SA beef production
(million) (x100 000) tons
costly and can pollute the environment.
Total SA consumption Per capita SA Poorly managed, fertilisation can also change the species
(x100 000) tons consumption (kg/year)
composition and decrease the basal grass cover. This reduces
Source data: Agricultural Statistics, 2008
productivity and increases water run-off and erosion. Veld re
inforcement and pasture cultivation both require irrigation in
most areas, which is limited by water availability and may
lead to soil salinisation. In general, fertilising and irrigating
non-arable land is costly and not a viable option for most farm
ers. ‘Improved’ pastures appear to have a significant negative
impact on sensitive grassland bird and insect species because
they alter not only the structure of the habitats, but also nutrient
regimes and animal populations.
8Good practice
Soil fertility
DD Analyse both soil and crop samples to determine the exact source (for example compost, manure and plant matter –
amount and type of fertiliser required, and aim to fill nutrient especially from legumes).
gaps rather than simply increasing total N and P. DD Use crop rotation and inter-cropping to increase soil organic
DD Use precision agriculture to calculate the fertilisation regime matter and nutrients. Where possible, rotate between grains
based on a realistic estimate of potential yield. and nitrogen-binding legume crops.
DD Time and target fertiliser application to coincide with DD Maintain a permanent soil cover – use either cover crops or
maximum plant uptake periods and apply fertiliser in regular mulch.
smaller doses rather than few large doses. DD Avoid excessive irrigation and ensure good water
DD Store synthetic fertilisers on an impermeable floor. Avoid quality.
interim storage in open fields, as this poses a high DD Reduce the use of pesticides and herbicides that cause a
pollution risk. decline in soil micro-organisms.
DD Fertiliser spreading machines should never be washed in riv
ers, lakes or near drinking water wells and springs.
DD Where possible, use organic fertilisers that contain a carbon
Soil structure Livestock
DD Practice crop-appropriate minimum tillage. DD Ensure stocking rates are within the land’s carrying
DD If tillage is required, till at the correct speed and only when capacity, based on the commercial stocking rates for a given
the soil has the correct moisture content. area and the present veld condition.
DD If possible, avoid crops that require soil disturbance to DD Monitor and manage veld condition for optimal
harvest. productivity with minimal environmental damage.
DD Prevent soil compaction by limiting heavy machinery, espe DD Maintain or improve veld condition and the health of the soil
cially in wet conditions. Where traffic is by ensuring appropriate rest periods after relevant grazing
necessary, use radial-ply tyres with low tyre pressures to and/or fire events.
minimise soil compaction. DD Prevent overgrazing, trampling and soil erosion.
DD Rehabilitate degraded veld.
DD Ensure that veld improvement techniques are well understood
and well managed to avoid environmental damage and a
long-term decrease in productivity.
What does healthy soil look like?
The health of an agricultural ecosystem depends largely on the way the land is used,
the quality of the soil and the input and output of nutrients. To a farmer, healthy soil
is rich in organic matter, has the right balance of plant nutrients, the right pH and a
diversity of beneficial soil micro-organisms, and is well aerated and moist. Organic
matter in the soil retains water and nutrients for slow release to plants and provides
good soil structure for root penetration. The small and microscopic soil animals and
fungi hold the soil together (preventing erosion), aerate the soil, provide sustained
breakdown and release of plant nutrients from organic matter, and – importantly
– control soil-borne diseases. As the use of synthetic fertilisers is not allowed in or-
ganic production, organic farmers focus their efforts on building a healthy soil that
feeds crops and keeps them healthy.
The topsoil, the fertile source of our food, can be conserved and improved through
on-farm nutrient cycling. Farm resources such as manure and plant residues can be
used optimally while cutting down on input costs from non-renewable inputs (pesti-
cides and fertilisers) that damage human health and the environment.
9It takes an enormous amount of water to produce our food and, if today’s food production, consump-
tion and environmental trends continue, we face a looming crisis. The challenges become even greater
when we include emerging issues such as climate change and its implications for water availability
and scarcity, the demand for biofuels, and competition for water from growing industries and domestic
demand. Farming practices need to promote more sustainable water use if agriculture is to survive and
flourish into the 21st century.
WATER Setting the scene
Water deficit
Southern Africa is the second region in the world to be con Mean annual rainfall 1970—2006
fronted by a debilitating water deficit (the first was the Middle 1 400
East and North Africa) (Turton, 2000). Within the region, South 1 200
Africa stands out as one of the most water-scarce countries. The
1000
country is also characterised by extremely variable rainfall, both
geographically and over time. In the 12% of the country that is 800
suitable for the production of rain-fed crops, productivity tracks 600
rainfall, making farming a challenging business. Climate change
400
predictions are that rainfall will be more infrequent but more
intense. This will shrink the country’s arable land and increase 200
agricultural unpredictability. Farmers will find it increasingly dif 0
2000
2003
2006
1988
1985
1982
1970
1979
1997
1973
1991
1994
1976
ficult to increase productivity to meet the growing demand for
food. This highlights the need for sound cropping and rangeland
Western Cape Eastern Cape Northern Cape KwaZulu-Natal
production practices to retain soil integrity despite these predict
ed intense rainfall events. Mean annual rainfall across four South African provinces
Source: SA Weather Service
‘We need a Blue Revolution in agriculture that focuses on increasing productivity per unit of water
- more crop per drop.’ Kofi Annan, UN Secretary General
10Irrigation
Irrigation is an age-old method of increasing agricultural productivity. It expands the South Africa has no surplus water
arable area, improves yield and increases cropping frequency (sometimes enabling and all future development will be
two or even three crops a year). In South Africa only 1,5% of the land is under irriga constrained by this fact. Farmers will
tion, producing 30% of the country’s crops (South African Yearbook, 2008/9). At first have to double their use of water by
glance, expanding irrigation seems the obvious means of increasing productivity, but all 2050 if they are to meet growing food
of South Africa’s irrigable land (estimated at 1,2% of the country) is already cultivated, demands using current farming prac-
with irrigation now rapidly expanding into unsuitable areas and negatively impacting tices. To avoid a crisis, water supply
the environment. needs to be enhanced and water use
efficiency increased.
Of particular concern is that irrigation is already by far the biggest water use in South
Africa. Year 2000 data showed irrigation extracting 63% of the country’s available sur
face water (Water Accounts for South Africa, 2000). With 98% of the available water
resources allocated, there is little room for increased extraction, particularly as other
sectors compete for the surplus (which is itself dependent on rainfall). South Africa has
few exploitable aquifers and extracts groundwater for only 13% of its supply. There is
some room for increased groundwater extraction in the south-east of the country, but in
other areas groundwater is already overexploited, with water tables falling at an alarm
ing rate (South African Yearbook, 2008/9).
Drought in Eden
Recent droughts in the Southern and
Eastern Cape have highlighted just how
vulnerable South African farmers are
Surface water withdrawal in 2000 (Total = 12,5km3) to reduced rainfall. Livestock farmers in
these regions have had to truck in water
2% 2%
3%
3%
and feed, drill boreholes and sell off
irrigation
cattle to survive the drought. In Novem-
13% urban domestic ber 2009 the Eden District in the South-
ern Cape was declared a Disaster Area
commercial and drought relief was granted to the
mining
region’s livestock farmers in the form of
feed vouchers. No relief was provided
14%
livestock to ostrich or crop farmers. AgriSA has
63%
2000
2003
2006
predicted that countless farmers are
electricity
facing insolvency in 2010 because of the
KwaZulu-Natal
rural domestic drought. This may be a taste of things to
come as water demand begins to exceed
Source data: Water Accounts for South Africa, 2000 supply across South Africa in the context
of a changing climate.
Land management impacts
Water quality: Land management on farms has a major im being of people and the environment. Often less than 0,1% of
pact on water availability and quality. Soil from eroded areas, for crop-sprayed pesticide reaches the target pest – the rest enters
example, flows into rivers, changing their flow and reducing the the environment (Pimental & Levitan, 1986). A 2004 water qual
storage capacity of dams. This results in the need for expensive ity study of the Lourens River in the Western Cape detected high
water treatment/filtration systems before water can be used by pesticide levels downstream of the farming area (Dabrowski et al.,
industrial and domestic users. Poorly applied fertilisers run off into 2002). Levels of contamination were extremely high, exceeding
rivers, polluting water sources and causing algal blooms. These both the national water quality standards and those established
blooms deplete the water’s dissolved oxygen and produce toxins, by the US Environmental Protection Agency (EPA). One of the
killing aquatic life. pesticide chemicals found in the water was endosulfan, a highly
toxic bio-accumulating neurotoxin and endocrine disruptor that is
Pesticides from poorly managed farms are also a major source of banned in more than 50 countries (National Resources Defence
water pollution, with devastating effects on the health and well- Council, 2008).
11Water availability: Invasive alien vegetation has a major im Wetlands – free benefits from nature: Natural eco
pact on water – using more than twice the water of indigenous systems in South Africa’s catchments provide essential water
vegetation in some areas. Invasive alien vegetation is estimated to services. Wetlands, for example, purify water, moderate
consume about 3 billion litres of water a year in South Africa. This water flow and provide flood protection by capturing and
is the equivalent of 26 large dams or 7% of total supply (Le Maitre slowing the water flow. They also slowly release the water
et al., 2000; Dye & Jarmain, 2004). into the groundwater, providing resilience in times of drought.
Restoration and protection of these natural ecosystems is
Clearing alien vegetation is a cost-effective way of increasing essential to increase water quality and quantity on the farm. The
water supply on the farm. The CSIR measured changes in stream National Water Act (No. 36 of 1998) recognises the essential
flow in three Western Cape water catchments cleared of alien benefits provided by natural ecosystems and has ascribed equal
vegetation. In the dry summer months, stream flows increased by status to the requirements of aquatic ecosystems and humans.
an impressive 9, 10 and 12 m3 a day per hectare cleared (Prinsloo
& Scott, 1999).
A river runs through it
The first Biodiversity and Wine Initiative (BWI) Champion, Vergelegen Wine Estate in the Western Cape, has cleared 1 200 ha
of dense alien vegetation on their farm to date and in the process restored vast tracts of wetland areas, where streams now flow
throughout the dry summer. On another BWI estate, Boschendal near Franschhoek, alien clearing activities resulted in sustained
flow of three streams previously not known to exist, and the farm weir overflowed for the first time in the farm manager’s 25-year
experience. During the intense and unseasonal rainfall events of October 2009, when 60 mm fell within an hour, these restored
wetland systems fulfilled their role of capturing and attenuating water. While other estates suffered massive wash-aways, these
wetlands demonstrated the free benefits of wetlands by capturing the excess run-off and preventing large-scale erosion and
destruction in the vineyards.
Exporting our water
Good practice
Virtual Water is a recent concept that Increasing supply
encourages a country to view its agri- DD Remove invasive alien plants and replace with indigenous vegetation.
cultural crops in terms of the amount DD Restore and protect wetlands (remove alien plants, control burning and
of water required to produce those grazing, do not cultivate).
crops, with a view to implementing DD Leave at least a 30–40 m natural vegetation buffer zone between cultivated land
trading policies that promote the sav- and a river, and a 25–70 m buffer around a wetland.
ing of scarce water resources. For
example, it takes up to 1 000 litres Reducing demand
of water to produce 1 kg of maize DD Build up soil organic matter to reduce evaporative water loss and maximise the soil’s
in South Africa (Dabrowski et al., water-holding capacity.
2009). This is the Virtual Water value DD Use more efficient irrigation systems, such as drip irrigation.
of maize, and the amount of water DD Ensure efficient irrigation techniques that take into account soil type, crop type, soil
South Africa exports with every ton water status and weather conditions.
of maize. A water-scarce country like DD Maintain irrigation systems regularly.
South Africa needs to look at import- DD Where necessary, register water use with the Department of Water Affairs.
ing its water-intensive products (like DD Record actual water use to compare against registered use.
oranges, beef and sugar cane), and DD Implement water-harvesting and water-recycling techniques where possible.
focus on growing crops that use water DD Use drought-resistant crop and livestock varieties.
efficiently.
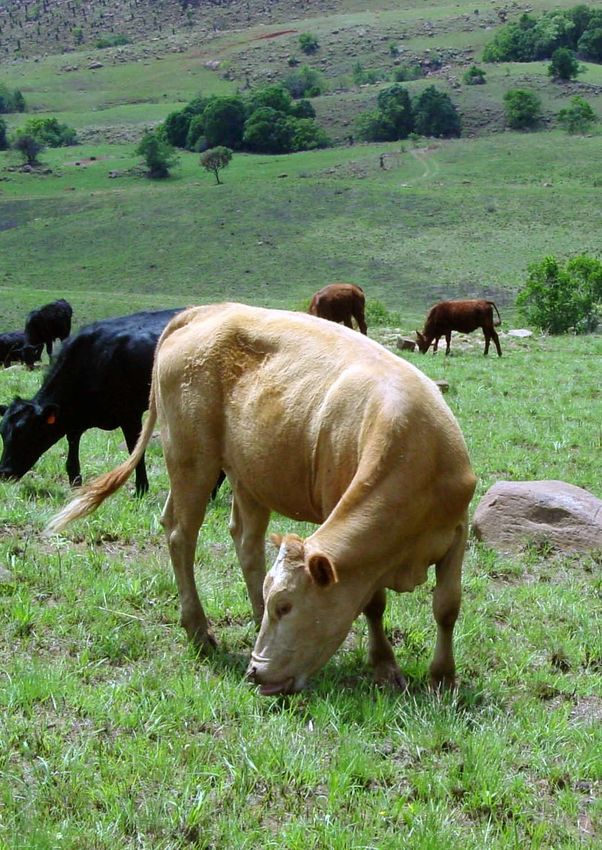
12How now brown cow?
Originally cows grazed on grasslands that were not suitable for crops, converting inedible grass into high-value protein. Today
this simple truth has been forgotten and 75% of South Africa’s cattle spend a third of their lives in feedlots, fed by grains grown
on the country’s scarce arable land. Not only does this practice produce meat with an unhealthy fatty acid profile, it is also a
major water issue. Compared to naturally fed beef, it takes about 65 times the quantity of surface water to produce feedlot-
finished beef in South Africa if the feed crops are irrigated – 860 litres for every 500 g grain-fed steak (see data in Appendix).
A sustainable solution is to reduce our daily consumption of red meat and to source natural, range-fed meat.
13Thousands of South Africa’s species and a third of the country’s ecosystems are under threat, together
with the critical free services they provide to farmers. Without action, this will accelerate and massively
impact on agricultural productivity in future.
BIODIVERSITY &
ECOSYSTEMS % of species threatened in SA
Setting the scene
25.0 Agricultural ecosystems
Ecosystems provide essential agricultural services, such as the
20.0 increased provision and purification of water; protection against
natural hazards; pollination and grazing; increased soil fertility, and
15.0 regulation of the world’s climate. Over the past 50 years, human
activity has altered ecosystems faster and more extensively than
10.0 ever before. Land transformation has left 34% of South Africa’s
ecosystems threatened. Of these, 21 ecosystems (5%) are critically
5.0
endangered.
0.0
Ecosystems, natural and agricultural, are made up of numerous
Birds Mammals Amphibians Reptiles Plants Butterflies
species that contribute to their proper functioning. Human activities
Taxonomic group cause habitat loss and fragmentation, resulting in the loss of species
and ultimately in the decline of ecosystem functions. Almost a third
Source data: Endangered Wildlife Trust, 2004; IUCN Red List, 2010; Raimondo et al., 2009.
of the Earth’s plants and animals have been lost since 1970 and
current extinction rates are approximately 100 times higher than the
natural rate indicated by the fossil record.
14Pesticides, herbicides and GMOs
Poor farm management further reduces species diversity and
The Little Karoo and its dwindling ecosystem functioning. The use of pesticides, for example, can
ecosystem services
have a devastating effect on biodiversity. It is estimated that less
than 0,1% of sprayed pesticide reaches the target pest; the rest
A recent study by Reyers et al. (2009) shows that ecosystem ser ends up in the environment and may persist for many generations
vices in the semi-arid Little Karoo are in decline. It is one of the most (Pimental & Levitan, 1986). Pesticides are known to kill amphi
degraded areas in the Western Cape, with 52% of the area de pods and other species that are important in the food chain for
graded through overgrazing. Of particular concern is that there has fish and higher animals such as birds of prey (and humans). The
been an 18% decline in water-flow regulation and a 44% decline impact of pesticides on beneficial species can have a negative
in erosion control – ecosystem services that underpin the region’s effect on farm productivity. For example, it was estimated in 1991
agricultural economy. that honey bee poisonings and reduced pollination due to pesti
cides cost the US $150 million annually (Pimentel et al., 1991).
These ecosystem declines raise concerns about the region’s long-
term productivity and its resilience to floods, droughts or market Many pest predators are also susceptible to pesticides and de
shifts. Creating a sustainable Little Karoo will require improvements velop resistance far more slowly than do pests. Thus, spraying for
in the health of its ecosystems. This, in turn, will require large-scale one pest can result in outbreaks of other pests as natural preda
conservation and restoration activities targeted at areas of import tor populations are devastated. This is called a secondary pest
ance to water flow and erosion control. But due to the slow rate of outbreak. Twenty-four of the 25 pests causing at least $1 million
recovery in arid and semi-arid ecosystems this will take time. worth of crop damage in California in 1970 were secondary
pests, and this situation remains largely unchanged (Cooper,
1991).
Pesticide problems
In the 1980s, rice fields in Indonesia were plagued with pesticide-
Despite an increase in the use and strength of pesticides since
1950, the percentage of crops lost to pests has stayed roughly
resistant brown plant hoppers. Frequent applications of broad-spec the same. This is because pests have a short generation time,
trum pesticides had devastated the hoppers’ natural predators and coupled with an incredible ability to mutate, allowing new gen
over 2 million hectares of rice were lost. Resistant rice strains were erations of pesticide-resistant pests. Stronger and more frequent
introduced allowing yields to temporarily recover, but the hoppers applications of pesticides are then required to suppress the pest
were soon back and, by 1985, 70% of Java’s rice was threatened population. This cycle is often called the pesticide treadmill, as
with destruction. After much research it was found that the hopper growers spray as fast as they can and still lose ground.
was a pest because of, not in spite of, pesticide applications. A
national integrated pest management programme was established Emerging farmers in South Africa are being encouraged to en
to move farmers toward the protection of the hoppers’ natural gage in high-input agricultural production in order to obtain com
enemies. Pesticide subsidies were removed and 57 of the most mercial status. Since existing practices in commercial agriculture
widely used pesticides banned. Pesticide use dropped by 90%, rely heavily on pesticides, emerging farmers are pressured to
farm profitability climbed, and production increased. The Food and adopt or increase their use of pesticides (Rother et al., 2008).
Agriculture Organization (FAO), one of the agencies responsible Many of the pesticides registered for use in South Africa have
for the Green Revolution package, summarised it well: ‘pesticides been banned in many other countries due to their toxic effects on
were always bundled together with other inputs, but conclusive humans and wildlife. The well-being of farmers, workers and the
studies showing their contributions to production were not made’ environment is at risk.
(Cooper, 1991).
‘Pesticides were always bundled together with other inputs, but conclusive studies showing their
contributions to production were not made.’ Food and Agriculture Organization (FAO)
15The use of herbicides can also lead to a
decline in species, particularly amphib
ians and soil micro-organisms. The advent Managing the potential of GMO
of genetically modified herbicide-resistant Genetically modified crops (GMO) have been shown to increase both yield and
crops has exacerbated the problem crop quality, but can potentially pose a threat to the environment. The genetically
by allowing farmers to spray indiscrim engineered material can be transferred to other related crops and wild plants. Once
inately. Monsanto’s Roundup herbicide, released, it is impossible to clean up any unforeseen consequences. The crops them
sprayed on millions of acres of crops selves may also escape from the agricultural environment to become superweeds.
and weeds across the US, has been Creeping bentgrass, which was genetically engineered in the US to resist the herbi
found to be extremely toxic to amphibians. cide Roundup on golf courses, is now growing in the wild, posing a huge threat. This
A recent study revealed that applying is the first example of agricultural biotechnology escaping from the farm environment.
the recommended manufacturer’s dose of In 2003, the International Centre for Technology Assessment filed a lawsuit seeking to
Roundup unexpectedly caused an up to halt development of genetically engineered bentgrass.
Modif ied maize
71% decline in tadpoles (Relyea, 2005).
The march of South Africa is the only country in the world to allow genetic modification of its staple
crop, maize. The country has also commercialised GM cotton and soya beans, and
monoculture field trials are being conducted for sugar cane. In 2008, white GM maize totalled
The use of limited monoculture species has 1,04 million ha, an increase of 48% over 2007, representing a market share of 62%.
led to a loss in the diversity of agricultural
species. Over the last 50 years, 75% of However, traders say that South Africa’s GM status has made it more difficult to shift its
global agricultural crops have been lost. maize surplus (which is partly a result of better yields under GM). The EU, for example,
About 20% of the world’s breeds of cattle, currently does not accept GM products.
goats, pigs, horses and poultry are also
currently at risk of extinction, which means
their features (such as resistance to disease Three varieties of Monsanto’s genetically modified maize failed to produce crops
or adaptation to climatic extremes) will be during the 2008–09 growing season, leaving up to 200 000 hectares of fields
lost forever. Indigenous African food crops, barren of cobs and causing crop losses across several provinces in South Africa.
such as millet and sorghum, have lost their Affected farmers were compensated.
status. Concerted efforts need to be made
to ensure that these hardy crops are not lost
to agriculture forever. A fatal element in the
runaway loss of our genetic wealth is the fact that it is not evident to the public when one looks at the bread shelves or the meat counter. And
the disappearance of domestic varieties of fruit and vegetables is hidden behind exotic imports.
With every species and gene lost, we are limiting our options for future success, particularly in adapting to climate change. The wild relatives
of crops (species that are genetically related to those in cultivation) and their genes are used to boost the nutritional value, disease resistance
and productivity of our food crops. This genetic diversity is at risk in the wild. More than one in 20 of Poaceae species (related to crops such as
wheat, maize, barley and millet) are threatened with extinction. In 2007 the wild apricot Armeniaca vulgaris, the origin of all cultivated apricots,
was classified as Endangered on the IUCN Red List.
Turning disservices into opportunities
Honey badgers are renowned destroyers of beehives and have typically been
exterminated for their activities. In 2002, beekeeping organisations, conser-
vation agencies and NGOs, together with retailers and the public, worked
together to develop and promote badger-friendly honey production methods.
By developing cheap and effective protection measures, educating and incen-
tivising the public, and creating a ‘Badger-friendly’ labelling system for honey,
this conflict has been turned into a notable gain for all.
16Good practice
DD Identify natural ecosystems on the farm and draw up a management plan for their protection. This should
include activities such as invasive alien plant control, reconnecting natural systems by establishing corridors
and riparian/wetland buffer zones, erosion control, judicious water use, pollution control, hunting and
poaching control, species checklists, etc.
DD Where applicable, enter into a biodiversity stewardship agreement with the local conservation agency.
DD Use a combination of predator-friendly methods of predator control for livestock farming, such as Anatolian
guard dogs, herders, livestock protection collars, fencing, kraaling, noises and smells.
DD Rehabilitate and maintain water sources and wetlands.
DD Ensure sustainable extraction rates and monitoring systems when harvesting indigenous species.
DD Develop new crops from indigenous crops for niche markets and promote the use and
improvement of indigenous animal species.
DD Minimise the use of herbicides; use mulch instead.
DD Minimise the use of pesticides and rather encourage plant health (through healthy soil and
suitable crop varieties) and populations of pest predators (for example by leaving corridors of natural veg
etation throughout the farm).
DD Prevent pesticide, herbicide and fertiliser run-off into the environment.
DD Apply the precautionary principle to the use of genetically modified crops, i.e. carefully research all the
available information.
17South African agriculture has undergone significant structural changes over the past 15 years. This has
caused a shift to large-scale intensive farming, as well as a shift from low-value, high-volume products
intended for domestic consumption, such as wheat and milk, to high-value products intended for export,
such as deciduous fruit, citrus and game. The impact of these policy changes on food prices, food avail-
ability and on South Africa’s environment remains to be seen.
ECONOMICS Setting the scene
Dual agricultural economy
South Africa has a dual agricultural economy, with both well- Closing agricultural marketing boards, phasing out certain import
developed commercial farming and smaller-scale communal farm and export controls and introducing certain import tariffs all convert
ing (located in the former homeland areas). Agriculture contributes ed a stagnant and state-controlled sector into a vibrant market econ
a relatively small share of the total GDP, but is important in providing omy. Dismantling state support to farmers combined with low import
employment and earning foreign exchange. The commercial agri tariffs did, however, leave many South African farmers unable to
cultural sector has grown by approximately 14% per year since compete in certain areas, such as wheat and milk, against farmers
1970, while the total economy has grown by 14,5% over the same from developed countries who receive generous state subsidies and
period, resulting in a decline of agriculture’s share of the GDP to dump their products in South Africa. On the other hand, government-
2,5% in 2008. However, there are strong backward and forward led initiatives to increase irrigated farmland has enabled other farm
linkages into the economy, so that the sector is estimated to actually ers to successfully grow high-value export crops such as deciduous
contribute about 14% of the GDP. fruit, grapes and citrus. The volume of agricultural exports increased
dramatically, and the rand value of exports increased from 5% of
Over the last 15 years, South Africa has undergone immense social agricultural production in 1988 to 51% in 2008 (SA Yearbook
and economic changes, with fundamental structural reforms result 2008/9). The net result has been a decrease in the area under
ing in an open, market-oriented economy. Some of these changes production for staple low-value crops such as wheat and maize,
were intended, while others are the result of the country’s integration and a dramatic increase in the export of high-value crops.
into the global economy following the end of apartheid-era sanc
tions. The changes in policy were intended to remove the socialist The Western Cape is the only province whose citrus exports
control of agriculture prevalent under the Nationalist Government, are allowed into the US due to appropriate sanitary standards,
improve the lot of farm labourers, and redress land inequalities. and has become the largest exporter of fresh oranges to the
US (almost 50% of US imports).
18SA exports by volume: wheat and maize SA exports by volume: fruit
1400 400
1200 350
1000 300
250
800
200
600
150
400
100
200 50
0 0
1970
1973
1976
1979
1982
1985
1988
1991
1994
1997
2000
2003
2006
1975
1977
1979
1981
1983
1985
1987
1989
1991
1993
1995
1997
1999
2001
2003
2005
wheat x 1 000 t maize x 10 000 t oranges x 10 000 t avos x 1 000 t plums x1 000 t
peaches x100 t pears x1 000 t grapes x 1 000 t
Source data: Agricultural Statistics, 2008
Smaller farmers in South Africa cannot compete successfully with subsidised produce from
overseas that is dumped in South Africa at below production cost. For example, between
2006 and 2008 there was a 263% increase in imported wheat, and South Africa is set to
import 1,6 million tons of wheat in the 2010–11 year. Local wheat plantings have fallen to South Africa is game
less than a third of the annual area sown in the 1970s and 1980s and production cannot Game ranching is the fastest-growing
meet local consumption. Farmers are requesting subsidies and asking for increased import branch of agriculture in South Africa,
tariffs, which will increase the cost of staples such as bread. with the majority of game ranches found
in Limpopo, the Northern Cape and the
In 2008, South Africa’s shift from low-value basic food crops to high-value export crops Eastern Cape. The total area covered
made the country a net importer of food in terms of volume for the first time. While this may by these privately owned ranches now
be regarded as a negative by those who believe that national food security requires national exceeds that of all national parks and
production to meet demand, it is clearly a positive in terms of generating foreign exchange provincial nature reserves put together.
and profits for local farmers. Impact on the natural environment is mixed. Increased water In terms of game ranching, game is con-
usage for irrigation in certain areas as well as increased carbon outputs through import and sidered to be an agricultural product as
export transport are both negative, particularly in the face of climate change. But at the defined in the Marketing of Agricultural
same time the large-scale conversion of wheat monocultures, which require large quantities Products Act of 1996.
of pesticides and fertiliser, and dairy pastures to fallow land, game farms and smaller higher-
value crops represents a net benefit to the environment.
Land reform
An important share of public financial resources has been devoted to land reform and agri
cultural support programmes for disadvantaged farming communities. New programmes
were introduced in 2005 to support the development of market-oriented family farms emer
ging from the land reform process, mainly through investment grants and provision of micro-
credit and retail financial services in rural areas. The Land Reform Programme has doubtless
reduced social tensions in certain areas and has redressed previous wrongs, but progress
has been slow and projects have shown a 90% failure rate, reducing agricultural output in
certain areas. Uncertainty around land tenure has also proved to be a disincentive for white
farmers to farm responsibly (MEGA Report, 2009). A key challenge is to develop a sound
understanding of the sociology of emerging agriculture to determine how to better support
sustainable land reform initiatives.
19Increasing input costs
Intensive farming practices are dependent on water, fuel, feed,
synthetic fertilisers, pesticides, herbicides and, increasingly, on
genetically modified (GM) seeds. Currently, farm feeds are the
biggest expenditure item, followed by fuel and fertilisers. Retail
Not so sweet
Small sugar cane growers are finding it increasingly difficult to farm
prices of these commodities are linked to the oil price and to
profitably due to rising input costs and a lack of rainfall, resulting
the rand/dollar exchange rate, both of which are out of the
in many abandoning cane production. According to the SA Cane
farmer’s control. A move towards farm-produced organic fer-
Growers’ Association, cane production from small-scale growers
tilisers and improved soil fertility would reduce input costs and
has more than halved in the Umfolozi and Pongola regions over
the vulnerability of farmers to international price fluctuations.
the past eight years. World sugar prices on the other hand have
surged to a 28-year high, but small farmers are not seeing the
Increased fuel prices impact on the running of farm machinery as
benefits. The decline in volumes from small farmers is a vicious
well as the transport of agricultural produce. In 1985, 80% of grain
cycle as contractors who haul cane to mills increase their prices
produce was transported by rail. Now, due to inadequate rail ser
due to the lower volume of cane. Fertiliser prices are also higher
vices, only 30% is hauled by rail. The bulk is transported by road
for smaller farmers buying in small quantities. The cost of transport
and transport is therefore strongly linked to the fuel price. The price
for a small grower buying a few bags could be R10 extra a bag,
of electricity is also rising and in October 2009, AgriSA released
but for a big farmer placing a large order the transport cost might
figures suggesting that Eskom’s proposed electricity price hike will
only be an extra R1 a bag. The cost of transporting the fertiliser
cost agriculture R600 million.
could even exceed the base cost of the fertiliser.
Global demand for fertiliser in 2008 outstripped supply. This, to
In a bid to revitalise the sector, the sugar industry launched the
gether with the high price of raw materials used in fertiliser pro
R22-million-a-year Supplementary Payment Fund in 2006, which
duction, the rising oil price and increased shipping costs, created
helps bolster the revenue stream for small growers. This initiative
unheard of international prices for fertilisers. A weakened rand
encourages growers to restructure their farming initiatives to benefit
against the US dollar further drove up the prices of imported fertil
from economies of scale through consolidated farming projects.
isers such as potassium and nitrogen. Local fertiliser production is
also subject to international fluctuations and is under the control of a
few large corporate companies. In 2009, Sasol was fined R250 mil
lion for collusion in the fertiliser industry and came under attack from
trade unions and farmers’ representative bodies for its impact on
Peak Phosphorus
Phosphate fertiliser is essential to intensive agriculture. The product
food prices.
is synthesised from mined rock phosphate, a non-renewable re
source that takes 10–15 million years to form. Recent evidence
suggests that global supplies of rock phosphate are dwindling
Only the biggest survive and are likely to be depleted within the century (Rosmarin, 2004).
There is no substitute for phosphate in agriculture. Experts disagree
The Census of Commercial Agriculture 2008 reflects a 31%
on how much phosphate is left and how quickly it will be exhaust
decline in the number of farmers since 1993, resulting in the
ed, but argue that a shortage is coming and that it will leave the
industry being left with fewer than 40 000 farms. The maize,
world’s future food supply hanging in the balance.
wheat and dairy sectors have been the hardest hit. Although
the number of units has dropped during this time, gross farm in-
Phosphate reserves are geographically concentrated, and are
come (GFI) has increased by more than 300%. With expenses
largely under the control of Morocco (45%), China (21%), the US
growing by a relatively low 285%, net farm income (NFI) grew
(7%) and South Africa (5%) (Jasinski, 2006). Europe and India
by a staggering 410% over this period. Because of this growth,
are totally dependent on imports. China, who ranks first in the con
the net farm income per farm unit has increased significantly to
sumption of chemical fertilisers, recently imposed a 135% export
five times more than what it was in 1993. This was mainly due
tariff on rock phosphate to secure domestic supply, which has
to economies of scale that kicked in as the units became fewer
halted most exports. South Africa, on the other hand, exports most
but bigger.
of its supply. Phospate mining in the country is wholly controlled
by Foskor, a subsidiary of the Industrial Development Corporation
Many of the smaller and more marginal farmers on the other
(IDC), which is expanding production to increase output by 14%
hand went out of business as their input costs grew faster than
by 2011. Coromandel International, one of India’s leading fertil
their revenues. These farmers were also often reliant on subsi-
iser companies, has a large stake in Foskor and takes the lion’s
dies and soft funding from institutions such as the Land Bank,
share of Foskor’s phosphate exports.
and faced a situation where government support was phased
out at the same time as the markets opened to allow competi-
tion from cheap imports.
20You can also read