GRAINS RESEARCH UPDATE - DRIVING PROFIT THROUGH RESEARCH NORTH STAR NEW SOUTH WALES JULY 2020 - GRDC
←
→
Page content transcription
If your browser does not render page correctly, please read the page content below
NORTH STAR
                                   NEW SOUTH WALES
                                   JULY 2020

GRAINS RESEARCH
UPDATE
DRIVING PROFIT THROUGH RESEARCH

                     grdc.com.au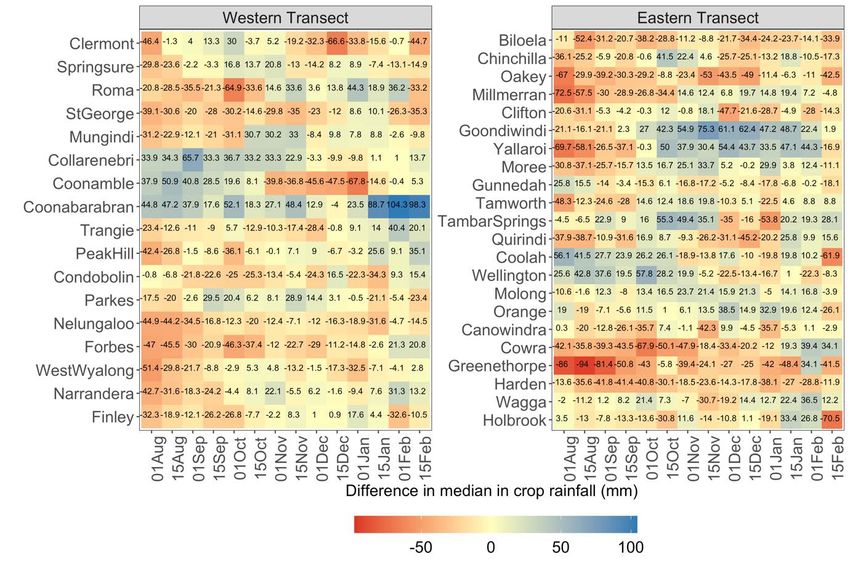
GRDC 2020 Grains Research Update Welcome
If you are reading this, then chances are you have taken time out from an extraordinarily tough season in our
very sunburnt country to hear the latest grains research, development and extension (RD&E) information.

Welcome.

We at the GRDC understand how very challenging the current situation is for growers, advisers,
agronomists, researchers and those associated with the grains industry across New South Wales and
Queensland.

Drought takes an enormous toll financially, emotionally and physically on those working and living through it
daily. We trust that these GRDC Grains Research Updates will offer you new research information to help
guide your on-farm decisions this season and to be best placed to take advantage of future seasons. We
also hope the Updates provide a chance to connect with your peers and temporarily escape work pressures.

We would like to take this opportunity to thank our many research partners, who, like growers and advisers,
have gone over and above in recent years to keep trials alive in rain-deprived environments.

Challenging seasons reinforce the importance of rigorous, innovative research that delivers genuine gains
on-farm. For more than a quarter of a century the GRDC has been driving grains research capability and
capacity with the understanding that high quality, effective RD&E is vital to the continued viability of the
industry.

Sharing the results from this research is a key role of the annual Updates, which are the premier event on
the northern grains industry calendar and bring together some of Australia’s leading grains research
scientists and expert consultants.

To ensure this research answers the most pressing profitability and productivity questions from the paddock,
it is critical the GRDC is engaged with and listening to growers, agronomists and advisers.

For the past four years we have been doing that from regional offices across the country. Through the
northern region offices in Wagga Wagga and Toowoomba and a team of staff committed to connecting with
industry, we are now more closely linked to industry than ever.

Today, GRDC staff and GRDC Northern Panel members are at this Update to listen and engage with you.
This is a vital forum for learning, sharing ideas and networking, all of which are critical to effect successful
change and progress on-farm.

Regards,
Gillian Meppem
Senior Regional Manager North

P PO Box 5367 Kingston, ACT 2604 Australia                                                                    Page 1
T +61 2 6166 4500   F +61 2 6166 4599    E grdc@grdc.com.au

GRAINS RESEARCH & DEVELOPMENT CORPORATION ABN 55 611 223 291
Contents

Australia’s grains industry in 2030 – key challenges and opportunities............................................................ 4
  Professor Ross Kingwell

How has Yallaroi’s climate changed and what impact has it had on sorghum productivity ............................ 10
  Jeremy Whish and Elizabeth Meier

The impact of harvest management in chickpeas – desiccation and front of header losses ........................... 18
  Richard Daniel, Linda Bailey, Denielle Kilby, Branko Duric, Richard Black and Lawrie Price

Commercial harvest loss assessments in chickpeas........................................................................................ 25
  Ed Offner, Jess Mickelborough and Edward Britten

Stubble Olympics: the cereal pathogen 10cm sprint – growth patterns of fungi causing crown rot, common
root rot and yellow leaf spot in post-harvest cereal stubble .......................................................................... 32
   Toni Petronaitis, Clayton Forknall, Steven Simpfendorfer and David Backhouse

Cereal disease management in 2020 – from famine to moving feast! ............................................................ 39
  Steven Simpfendorfer

Three-dimensional measurement of soil water and subsoil constraints using electromagnetic induction ..... 44
  Brendan Griffiths, Andrew Smart, Sally Poole and Nick Barton

Summer crops: relative water use efficiencies and legacy impacts in farming systems .................................. 46
  Lindsay Bell, Brook Anderson, Darren Aisthorpe, Andrew Verrell, Jon Baird, Andrew Erbacher, Jayne Gentry
  and David Lawrence

Improving yield reliability of grain sorghum in north-west NSW .................................................................... 52
  Loretta Serafin

                                  Compiled by Independent Consultants Australia Network (ICAN) Pty Ltd.
                                                      PO Box 718, Hornsby NSW 1630
                            Ph: (02) 9482 4930, Fx: (02) 9482 4931, E-mail: northernupdates@icanrural.com.au
                           Follow us on twitter @GRDCNorth or Facebook: http://www.facebook.com/icanrural
DISCLAIMER
This publication has been prepared by the Grains Research and Development Corporation, on the basis of information available at the
time of publication without any independent verification. Neither the Corporation and its editors nor any contributor to this publication
represent that the contents of this publication are accurate or complete; nor do we accept any omissions in the contents, however they
may arise. Readers who act on the information in this publication do so at their risk. The Corporation and contributors may identify
products by proprietary or trade names to help readers identify any products of any manufacturer referred to. Other products may
perform as well or better than those specifically referred to.
CAUTION: RESEARCH ON UNREGISTERED PESTICIDE USE
Any research with unregistered pesticides or unregistered products reported in this document does not constitute a recommendation for
that particular use by the authors, the authors’ organisations or the management committee. All pesticide applications must be in accord
with the currently registered label for that particular pesticide, crop, pest, use pattern and region.

   Varieties displaying this symbol beside them are protected under the Plant Breeders Rights Act 1994.
® Registered trademark

                                          2020 NORTH STAR GRDC GRAINS RESEARCH UPDATE

                                                                     3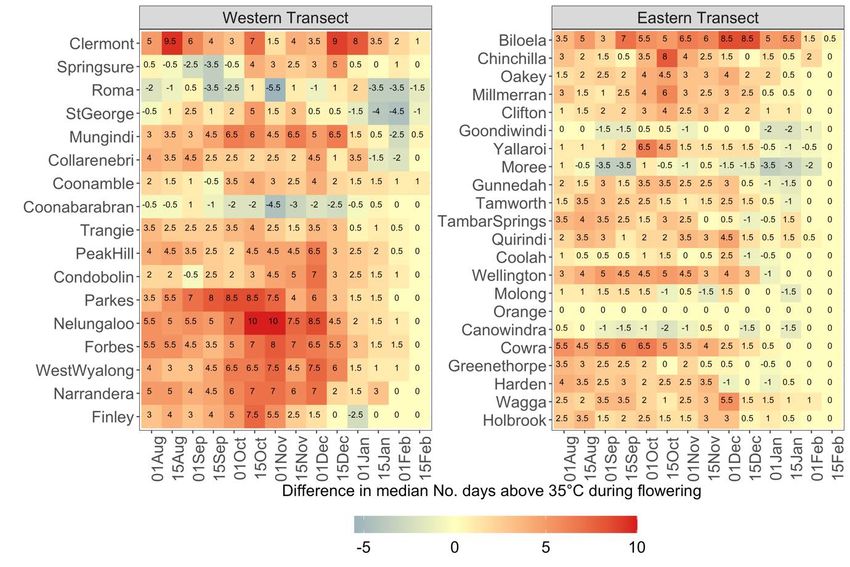
Australia’s grains industry in 2030 – key challenges and opportunities
              Professor Ross Kingwell, Australian Export Grain Innovation Centre

Keywords
Grains industry, grain markets, competition

Take home message
•   The grains industry in eastern Australia will experience further structural change towards 2030
    as east coast demand for feed grain grows
•   Farmers in eastern Australia are likely to increase their commercial dependence on grain
    storage, feed grain production and domestic marketing
•   Improved harvest technology and transport logistics will enhance farmers’ capitalising on market
    opportunities
•   Australia’s population and income growth, although slower than might have been anticipated in
    a pre-COVID world, will help underpin feed grain demand in Australia, as will the gradual re-build
    of cattle and sheep populations
•   Towards 2030 the grains industry faces a carbon challenge.

Background
Although the business of grain-farming will largely stay the same towards 2030, some things are
changing to challenge grain-farming and deliver further market opportunities. The sources of change
and challenge include:
(i) Technological change
The ability in real-time to affordably track grain quality at harvest will improve, enabling farmers to
more cost-effectively segregate grain at harvest and better match end-user preferences. Improved
logistics and multi-mode hubs will facilitate greater use of containerisation. Lower cost grain storage
combined with low interest rate will allow more grain to be stored, and stored for longer.
(ii) New crops and changing crop mixes
The wheat-sheep belt, the mainstay of Australian agriculture, will more flexibly switch its land use to
favour greater crop diversity. Canola, chickpeas, lentils and lupins, once little known crops, will
remain as important crop options in different regions. The swing into reliance on crop revenues is
evidenced by Australia’s sheep population now being as small as it was almost 120 years ago and in
the early 1900s Australia only produced 1.5mmt of wheat from 2.5mha whereas this year Australia is
on track to produce over 27mmt of wheat from 13mha. Moreover, 17.8mmt of other grains is also
likely to be produced this year.
(iii) Altered soil management
Traditionally fields were ploughed repeatedly to combat weeds and form a friable seed bed.
However, the advent of conservation agriculture now sees crops established in single pass
operations, with minimal soil disturbance, increased reliance on herbicides and weed seed
management at harvest. Soil amelioration is increasingly commonplace.
(iv) A changing climate
Grain production in Australia is based on rain-fed farming systems. Hence, temporal and spatial
changes in rainfall and temperatures are crucially affecting national crop production. Extreme heat
during grain filling is an increasing problem in some regions with farmers observing occasional ‘heat
frosts’ that worsen grain yield and quality.
                               2020 NORTH STAR GRDC GRAINS RESEARCH UPDATE

                                                   4
(v) An altered role of government
Traditionally, government played a major role in Australia’s grain industry. Rail systems were owned
and operated by State governments. Statutory grain marketing was ubiquitous. Research and
advisory services were funded and supplied principally by State governments, with the
Commonwealth government playing an important collaborative role in research funding. Provision
of new plant varieties was almost solely the province of State government agencies, universities and
the CSIRO. Governments were important employers in many rural towns. Yet now, the march of
privatisation, the lesser relative economic contribution of agriculture and the emergence of other
claims on the public purse (natural disaster relief, COVID relief, health and social welfare) have
altered the role of government in the farm sector. Increasingly grain farmers pay fully or in large part
for advice, grain marketing, research services and grain transport.
Privatisation has not only affected government services. Even farmers’ ownership of the key services
of grain handling and storage has passed into private ownership (GrainCorp, Viterra).
(vi) Maturing low-cost overseas competitors
Over the last few decades, a seismic shift in grain export prowess and rankings has occurred. In
previous decades North America, Europe and Australia were main grain exporters. However, first
South America (i.e. Brazil and Argentina) and then the Black Sea region (Russia, Ukraine and
Kazakhstan) have greatly increased their grain production and grain exports. Russia has replaced the
USA as the world’s main exporter of wheat. Argentina and Brazil are main export suppliers of feed
grains (soybean and corn).
(vii) Altered populations, incomes and power
As people become richer their indirect per capita consumption of feed grains increases as they
consume more meat, aquaculture and livestock products (dairy, eggs). South Asia, sub-Saharan
Africa and the MENA (Middle East & North Africa) are increasingly dominant contributors to the
world’s population. Although China’s population growth is slowing, nonetheless its per capita
income growth continues almost unabated helping it to flex its political muscle which has affected
Australia’s barley industry.
(viii) An increasing emphasis on the sustainability credentials of grain production
The costliness of grain and its quality matter to most consumers, especially overseas customers. Yet
within agriculture and the urban consumers and voters that influence Australian agriculture, the
sustainability credentials of farm production also increasingly matter. For example, major
agricultural organisations like the MLA and NFF have signalled the need for Australian agricultural
industries to plan to be carbon-neutral.
All these changes, in combination, are affecting the current and future potential of grain production
in Australia.

Australia’s grain industry towards 2030
•   Towards 2030, feed grain demand and supply will increase in prominence in Australia, especially
    in eastern Australia
•   In a COVID-affected Australia, the national population is likely to increase by around 16 per cent
    by 2030. This means about 4.1 million additional people in Australia
•   Little increase in the area sown to winter and summer crops in Australia has occurred since the
    mid-2000s and further increases are unlikely towards 2030
•   Despite plant breeding, agronomic and technology improvements, the average rate of crop yield
    improvement has been only 0.6 per cent per annum since the late 1980s. There is spatial
    variation in yield improvement trends and yield volatility has worsened in eastern Australia

                               2020 NORTH STAR GRDC GRAINS RESEARCH UPDATE

                                                   5
•   Climate change and seasonal variation are limiting yield growth in many grain-growing regions
•   The mix of crops grown across Australia is fairly stable with a slight increase in the relative
    importance of canola over the last decade. In eastern Australia, coarse grains and pulses feature
    more in the mix of crops
•   The pattern of meat consumption among Australians is changing, with a growing dominance of
    chicken and pork consumption at the expense of beef and lamb
•   Increasingly, the main meats consumed by Australians are from grain-fed animals
•   By 2030 in Australia:
        (i) Feed grain demand will increase by around 2.3 mmt
        (ii) An additional 0.6 mmt of grain will be required for flour and malt production
        (iii) An additional 5.6 mmt of grain will likely be produced
        (iv) The additional surplus of grain available for export could be around 2.7 mmt
        (v) Most of the additional grain produced in eastern Australia will need to flow to the east
        coast domestic market to satisfy its growth in feed and food demand
        (vi) The main sources of additional exportable surpluses of grain will be WA and SA; and
        bumper years in eastern Australia
        (vii) The grain quality profile of Australia’s main export crop, wheat, is likely to alter, as WA’s
        and SA’s share of national wheat exports increases
        (viii) Grain farmers’ increased use of liming and urea to boost grain production is increasing
        emissions from grain production and will increase the cost of ensuring the carbon-neutrality
        of Australian grain production.
A key implication of above projections is that towards 2030, with grain production being climate-
constrained, Australia’s domestic requirements for grain will become increasingly important in
eastern Australia where most of the population increase and greater demand for feed grains,
flour, oil for human consumption and malt will occur. By contrast, most of the exportable surpluses
of grain will increasingly come from the less populous states of WA and SA.
The task of finding export markets for the additional ~2.7 mmt of export grain available by 2030 may
not be overly challenging, given the projected increase in grain imports envisaged for many of
Australia’s current overseas grain customers. Nonetheless, it needs to be noted that this task of
selling more Australian grain will occur against the backdrop of burgeoning exports from low-cost
international competitors who may not have the same commitment to carbon-neutrality.
Assuming crop production in Australia towards 2030 remains seasonally volatile (whilst the stable
east coast domestic demand for grain increases in relative importance), then grain farmers and grain
users in eastern Australia are likely to react by:
        (i) Investing in more grain storage; especially whilst interest rates are low, making the cost of
        carrying grain affordable
        (ii) Focusing more on domestic market opportunities
        (iii) Focusing more on feed grain production
        (iv) Looking more closely at grain supply security when investing in export-focussed grain
        processing/animal protein industries – with access to export parity grain rather than
        exposure to import parity

                                2020 NORTH STAR GRDC GRAINS RESEARCH UPDATE

                                                    6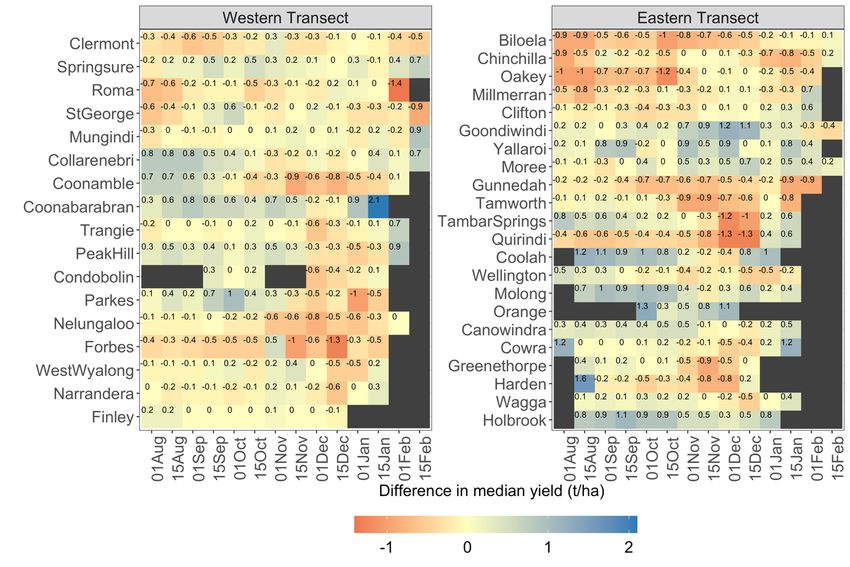
(v) Committing to further enhancement of the sustainability of grain production (e.g.
        reduced net emissions of greenhouse gases) whenever price premiums, regulation or market
        access opportunities reward those commitments
        (vi) Supporting varietal development, crop research and grain organisation innovation that
        delivers benefits throughout the grains industry, but especially to grain producers.

Implications for Vic and NSW Grain Producers
Although the increased demand for feed grains in eastern Australia may encourage its grain
producers to alter their crop mix towards more feed grain production, it is unlikely that most
farmers will additionally allocate more land to cropping rather than sheep production. Despite the
sizeable reduction in the national sheep population since the early 1990s, most NSW and Vic farmers
have maintained their investment in sheep since the early 2010s (Figure 1), despite the period of
serious drought in 2018 and 2019.

                  Figure 1. Sheep population in Australia, NSW and Vic since 1990
In order to retain sheep numbers, either pasture areas need to be allocated for sheep production or
affordable feed grains always need to be readily available. Given the strong upward movement in
sheep meat and wool prices up until the impact of COVID-19, on a gross margins basis, farmers have
been less likely to switch land and other resources away from sheep production. Moreover, as the
domestic and overseas demand for sheep meat continues to increase, then retention of sheep in
farming systems is increasingly likely. In addition, retaining sheep provides a means to add value to
feed or downgraded grain produced on a farm. Currently, sheep enterprises form a profitable, risk-
diversifying role for many farm businesses. As a result, crop production growth over the next decade
is more likely to be based largely on yield increases rather than crop area increases. Accordingly,
crop breeding and crop agronomy will play crucial roles in ensuring gains in crop production in NSW
and Vic.
In coming decades, the traditional flow of grain from Vic and NSW farms down to ports for overseas
export could be a less dominant feature of their crop production, as east coast demand for grain
increases in relative importance; and especially in years of low production in eastern Australia.

                               2020 NORTH STAR GRDC GRAINS RESEARCH UPDATE

                                                  7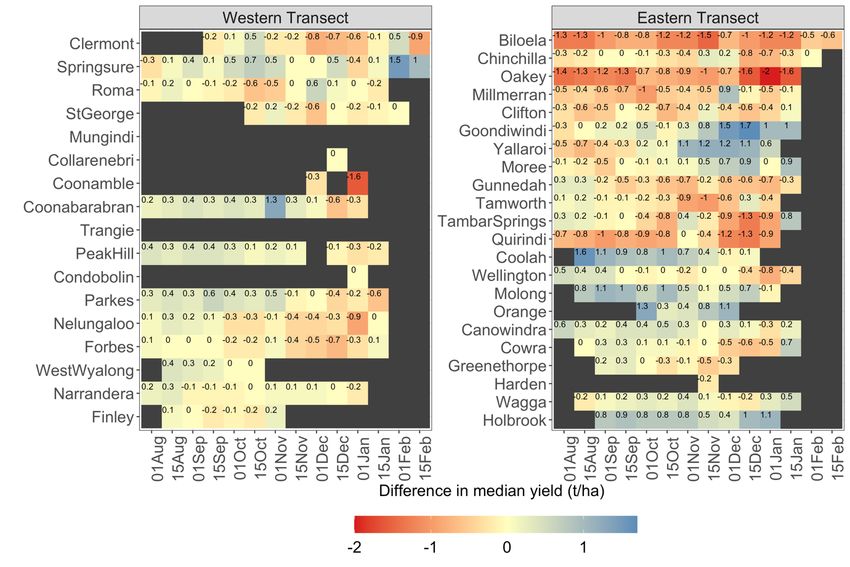
Interstate grain flows from SA or WA (see (Figure 2) could feature when prolonged drought in NSW
and Vic leads to depletion of their grain storages such as occurred in 2018/19

           Figure 2. Coastal shipping flows from or into each State in 2017/18 and 2018/19
                              Source: Based on data in an appendix in ACCC (2019)

In 2018/19 some regions in SA were also affected by drought. The SA grain harvest was only around
5.6 mmt, of which the main grain handler and exporter, Glencore, only exported around 2.6 mmt,
indicating that around 3 mmt was either stored, used locally or exported to eastern Australia. Hence,
due to SA’s small domestic market, even in low production years, SA is able to capitalise on
favourable market opportunities in eastern Australia.
In years when SA or WA escape drought, yet eastern states are drought-affected, then sizeable
interstate grain flows from these states are likely (see Figure 2). Freight differentials in coming
decades could be further affected by construction of the inland rail in eastern Australia, due for
completion in 2025. If the inland rail is sufficiently cost-effective, then interstate grain flows from SA
could be much enhanced in some years. In addition, construction of additional grain port
infrastructure in SA will facilitate coastal trade. In eastern Australia, south to north flows of grain by
rail, road and ship are likely to become increasingly important towards 2030 as a product of climate
volatility and continuing growth in the demand for grain in eastern Australia.
The constant challenge of a warming, drying climate is likely to limit winter crop yield growth in all
winter crop regions of Australia and will increase the dependence of extensive livestock production
(sheep, cattle, dairy) on supplementary grain feeding. Simultaneously, further population growth,
especially in Qld, NSW and Vic, will increase the national market demand for grains, especially feed
grains. The corollary is that growth in grain production in Australia is likely to be modest and the
tendency will be for a growing proportion of grain to flow to domestic markets, especially in eastern
Australia. Exports of grain from NSW and Vic are likely to be constrained by the growth in the
Australian domestic market in eastern Australia and the constraints of climate trends on crop yields.
In a low interest rate environment, storage of grain becomes more affordable as a strategy to lessen
price volatility and improve the affordability of grains. Hence, grain storage is likely to become part
of major grain users’ and producers’ risk management strategies.
In coming decades, export grain supply chains in Vic and NSW will be affected by the combination of
limited growth in crop production and an increased role of grain storage to improve the reliability of
supply to domestic markets. Low interest rates make affordable the cost of carrying grain across
seasons. In eastern Australia easily stored feed grains like lupins and barley, if high-yielding varieties

                                2020 NORTH STAR GRDC GRAINS RESEARCH UPDATE

                                                      8
become available, could feature more in farmers’ crop portfolios. Farmers are likely to enlarge their
focus on feed grain production and any feed grain value-adding opportunities.
Farmers are likely to have increasing choices over where and when they sell grain, due to the lower
cost of storing grain (i.e. a low interest rate environment), and the emergence of a range of domestic
market opportunities.

Conclusion
Modest growth in Australian grain production is expected towards 2030. By contrast, Australia’s
population is projected to increase by around 16 per cent by 2030. This means about 4.1 million
additional people, mostly residing in eastern Australia. Despite this projected increase in population
and the associated demand for feed and human consumption grains, little increase in the area sown
to crops in Australia is envisaged.
The corollary is that, especially during periods of drought in eastern Australia, domestic market
opportunities in eastern Australia will drive grain flows, support grain storage and increasingly affect
the viability of the ownership and operation of export grain supply chain infrastructure, especially in
eastern Australia. Grain storage will increasingly form part of many businesses’ risk management
strategies. Establishing and maintaining low-cost interstate supply chains will be an increasing
complementary strategic need, already being supported by the inland rail project.
How grain is produced (i.e. its sustainability credentials) will be increasingly important, especially to
domestic users and consumers.

Contact details
Professor Ross Kingwell
AEGIC
3 Baron-Hay Court, South Perth, WA 6151
Phone: 08 6168 9920
Email: ross.kingwell@aegic.org,au

                                2020 NORTH STAR GRDC GRAINS RESEARCH UPDATE

                                                    9
How has Yallaroi’s climate changed and what impact has it had on sorghum
                                   productivity
                            Jeremy Whish and Elizabeth Meier, CSIRO

Key words
climate, historic climate, changing yield potential, sorghum

GRDC code
CSP1806-01

Take home messages
•    Increasing temperatures and reduced rainfall have lowered the yield potential of sorghum in
     many areas
•    Avoiding high temperatures at flowering and using a conservative sowing trigger (>100mm PAW)
     can reduce the impact of a changing climate
•    There is still room to reduce the yield gap with targeted sowing dates, nitrogen rates and soil
     water triggers despite a changing climate reducing sorghum yield potential.

Introduction
Australia’s climate is warming, including an increase in average temperature, increase in number of
days exceeding 35°C and a decrease in rainfall (CSIRO and BOM, 2015).
But what is happening at Yallaroi? How will this affect the crops I grow? What can I do to manage
this change?
These are some of the questions we have tried to address.
Over the last few years, several suggestions have been made to GRDC that have warranted our
examination of sorghum production in response to changing climates. The key concern was that a
changing climate had reduced the yield potential of central Queensland crops and would cause the
key sorghum production areas to move south to cooler and less variable climates. In this paper we
review local annual and growing season climates, sorghum production and compare these results to
other sorghum production areas to see how or if things have changed.

Methods
Current climate was compared with historical climate using a climate normal approach to compare
overlapping 30-year time periods. This is recognised as the most statistically sound method to
determine if a change in climate has occurred (Arguez and Vose, 2011), and is recommended by the
World Meteorological Organisation’s standard for placing current climate conditions in a historical
perspective. A simulation analysis of sorghum production in response to a range of initial soil water
and sowing dates was then conducted using APSIM (Holzworth,2014) to identify whether changing
these management practices could mitigate the effect of any changes in climate.

                               2020 NORTH STAR GRDC GRAINS RESEARCH UPDATE

                                                  10
How is the Yallaroi environment changing?
Rainfall
Figure 1. Sum of rainfall for each 30-year climate normal period on an annual (A) and cropping
season (B) basis at Yallaroi. The results show a reduction in variability and slight lowering of the
average rainfall over time. The decline has occurred in both summer and winter rainfall.
Temperature
Figure 2. Sum of daily average temperature on an annual (A) and cropping season basis at Yallaroi.
Average temperature showed a continual increase in heat to the most recent climate normal (1988-
2017). The change in accumulation of heat was similar in both summer and winter growing seasons.
2020 NORTH STAR GRDC GRAINS RESEARCH UPDATE
11Extreme
Figure 3. Number of days of extreme temperatures (above 35°C) summed on an annual (A) and
growing season (B) basis. The days above 35°C follow a similar pattern to the heat sum on an annual
basis increasing to the most recent normal (1988-2017). Extreme temperatures occurred in the
summer only.
How will these changes in climate affect sorghum?
Higher temperatures increase the rate of crop development and the amount of water transpired by
the crop. If rainfall remains stable or decreases then this will increase the chance of moisture stress
occurring in the crop. However, if the growing period of the crop can be matched to the timing of
rainfall then it may be possible to maintain or increase crop grain yield despite an annual reduction
in rainfall.
To identify whether the yield potential of sorghum crops had changed over the last 60 years a series
of simulations were undertaken. The 60-year period from 1958-2017 was used for this analysis and
sub-divided into two climate normals – 1958-1987 and 1988-2017 - that could be compared.
Water stored within the soil helps to buffer crops from variability in the climate. In order to
understand the effect on yield of changes in the climate, the median yield from a crop sown into a
full profile of water was compared across the 60-year period. This approach was expected to
demonstrate the least difference between the two climate normal periods, because each site by
sowing date combination had optimal soil water at sowing. The study was completed for a selection
of locations (‘transects’) in both the eastern and western parts of the GRDC northern growing region
(Figure 4).
Sorghum crop yields sown on a full profile of soil water
For northern sites of the western transect (from Mungindi north) there was little change in yield
except for a reduction in yield of around 0.5 t/ha at the extremes of early sowing and late sowing
(Figure 4). For the northern sites of the eastern transect there was a clear reduction in yield for sites
north of Goondiwindi, especially for sowing dates before November. For the eastern transect there
were distinct groupings of change in yield: improved yield between Goondiwindi and Moree for
crops sown between November and January and decline in yield on the Liverpool Plains that
worsened with later sowings and culminated around a mid-December plant.
2020 NORTH STAR GRDC GRAINS RESEARCH UPDATE
12Figure 4. Difference in median yield of sorghum crops between climate normals 1958-1987 and
1988-2017 when sown into a full profile of water, for different sowing dates for locations divided
into western and eastern transects. Red shading in cells indicates a decrease in yield, blue indicates
an increase, and yellow indicates sowing dates where there was minimal to no difference in crop
yield. Only median yields from sowing dates that had fewer than 50% failed crops are included
(other location-sowing date combinations were considered unsuitable for crop production and are
coloured black). Values within each cell are the difference in yield between the climate
normals (t/ha).
What has been the effect of changing climate on yield when there isn’t a full profile of soil water
at sowing?
The objective of simulating sorghum crop yields in response to a full profile of water in the previous
step, was to understand whether the most recent 30-year climate normal period was different to the
previous 30-year normal in terms of its effect on crop yield. However, it can be inefficient to wait for
a soil profile to fill because producing adequate crops regularly, can more be financially rewarding
than waiting for ideal conditions (such as a full soil water profile) to occur. In this section we present
results for crops sown into a profile with an initial amount of 100mm of available soil water. This
amount is towards the lower end of soil water that would be present when a decision to sow occurs
(the general sowing rule for western sites (west of the Newell highway) is commonly, 150mm of
plant available water). In the eastern sites with higher rainfall 100 mm is more common. The use of
100mm for both transects is a compromise.
There was an increase in crop failures (cells shaded black) between crops sown on a full profile of
soil water (Figure 4) and those sown into a profile containing 100mm (Figure 5). This difference in
initial soil water also explains the use of wide row configuration and 150mm soil water trigger that is
used by many grain growers along the western transect. However, despite these differences in yield
arising from differences in initial soil water. The general patterns of changes in yield and optimal
sowing dates between climate normals were the same. There were minimal differences in yield
2020 NORTH STAR GRDC GRAINS RESEARCH UPDATE
13between climate normals for the north-western sites, but a decrease in yield potential for the
eastern sites. The November to mid-January sowing dates between Goondiwindi and Moree
continued to demonstrate an increase in yield for the more recent normal, while later sowing in the
Liverpool Plains continued to demonstrate a yield reduction.
Figure 5. Difference in median yield of sorghum crops between climate normals 1958-1987 and
1988-2017 when sown into a profile of 100mm of water, for different sowing dates for locations
divided into western and eastern transects. Red shading indicates a decrease in yield, blue shading
indicates an increase in yield, and yellow shading indicates sowing dates for each location with
minimal to no difference in yield. Only median yields from sowing dates that had fewer than 50%
failed crops are included (other location-sowing date combinations were considered unsuitable for
crop production and are coloured black). The values within each cell specifies the magnitude of the
difference in yield between the climate normal periods (t/ha).
Why are yields changing?
Rainfall
The availability of water to the crop is the key determinant of yield in Australia. The value of stored
soil water is its ability to buffer the demands of the plant in between rainfall events and ensure
optimal plant growth. The timing and size of rainfall events are critical to maintaining this buffer as is
the specific soil type. In general, the quantity of in-crop rainfall decreased or remained neutral
across locations in both eastern and western transects, although there was an increase in in-crop
rainfall at a few locations (e.g. Coonabarabran, Goondiwindi and Yallaroi for some times of sowing).
These locations are those that showed an increase in water limited yield potential (Figures 4 and 7),
and highlight that this increase in rainfall pattern has directly resulted in increased yield.
Yallaroi being one of these sites has seen an increase in rainfall for crops sown in late October to
mid- November over the last 30 years despite a slight decline in summer rainfall overall.
2020 NORTH STAR GRDC GRAINS RESEARCH UPDATE
14Figure 6. Difference in median in-crop rainfall for the 14 different sowing dates between the two
climate periods 1958-1987 and 1988-2017, for locations in western and eastern transects. Red
shading indicates a decrease in in-crop rainfall, blue shading indicates an increase in rainfall, and
yellow indicates sowing dates with minimal to no difference in rainfall between normals. The values
within each cell are the difference in median in in-crop rainfall (mm).
Extreme temperatures
High temperatures around flowering can significantly reduce sorghum grain yield (Lobell et al., 2015;
Singh et al., 2017; 2016). The difference in the number of days with temperatures in excess of 35°C
increased between the past 30-year climate normal period (1958-1987) and the more recent 30-year
normal (1988-2017). The increase in days with extreme temperatures was greater for the western
transect, especially for crops sown between October and November. For the eastern transect there
was a general increase in the number of days with extreme temperatures for all sowing dates before
December. However, a few specific sites experienced a reduction in extreme temperatures; these
sites and sowing dates correspond with those that experienced an increase in rainfall and
consequently an increase in median yield potential (Figure 7).
2020 NORTH STAR GRDC GRAINS RESEARCH UPDATE
15Figure 7. Difference in the median number of days above 35°C during flowering for the 14 different
sowing dates between the two time periods of 1958-1987 and 1988-2017, for western and eastern
transects within the northern grain zone of eastern Australia. Red indicates an increase in rainfall
while blue indicates a decrease, yellow highlights those sowing dates with minimal to no difference.
The values within each cell are the difference in median number of days above 35°C during
flowering.
So, what does it mean and what can I do?
The climate of Australia’s sorghum production area has changed, with increases in the average daily
temperature, an increase in the number of days with extreme temperatures during flowering, and a
decrease in in-crop rainfall for many locations. These changes have resulted in an overall reduction
in crop yield potential. However, despite this decrease the yield potential has not been reduced to a
point where it is no longer economical to grow sorghum. Good agronomy and the use of high soil
water triggers at sowing will help maintain profitable returns under changing climates. For sites that
had an increase in yield for some sowing dates, this could be traced to increased rainfall and a
decrease in extreme temperatures during flowering. However, these increases were relative only to
the areas historic production and not an increase above traditionally high yield regions. Thus,
despite a decrease in the yield potential over the study period for many areas, this decrease has not
caused a noticeable shift in sorghum production areas, and so NSW is not the new central
Queensland for sorghum production.
References
Arguez, A., Vose, R.S. (2011) The Definition of the Standard WMO Climate Normal: The Key to
Deriving Alternative Climate Normals. Bull. Amer. Meteor. Soc. 92, 699–704.
doi:10.1175/2010BAMS2955.1
CSIRO and Bureau of Meteorology (2015) Climate Change in Australia Information for Australia’s
Natural Resource Management Regions: Technical Report, CSIRO and Bureau of Meteorology,
2020 NORTH STAR GRDC GRAINS RESEARCH UPDATE
16Australia.
https://www.climatechangeinaustralia.gov.au/media/ccia/2.1.6/cms_page_media/168/CCIA_2015_
NRM_TechnicalReport_WEB.pdf
Holzworth, D.P., Huth, N.I., deVoil, P.G., Zurcher, E.J., Herrmann, N.I., McLean, G., Chenu, K., van
Oosterom, E.J., Snow, V.O., Murphy, C., Moore, A.D., Brown, H.E., Whish, J.P.M., Verrall, S., Fainges,
J., Bell, L., Peake, A.S., Poulton, P.L., Hochman, Z., Thorburn, P.J., Gaydon, D.S., Dalgliesh, N.,
Rodriguez, D., Cox, H., Chapman, S., Doherty, A., Teixeira, E., Sharp, J., Cichota, R., Vogeler, I., Li, F.Y.,
Wang, E., Hammer, G.L., Robertson, M.J., Dimes, J.P., Whitbread, A.M., Hunt, J., van Rees, H.,
McClelland, T., Carberry, P.S., Hargreaves, J.N.G., MacLeod, N.D., McDonald, C.K., Harsdorf, J.,
Wedgwood, S., Keating, B.A., (2014). APSIM – Evolution towards a new generation of agricultural
systems simulation. Environmental Modelling & Software 62, 327–350.
doi:10.1016/j.envsoft.2014.07.009
Lobell, D.B., Hammer, G.L., Chenu, K., Zheng, B., McLean, G., Chapman, S. (2015) The shifting
influence of drought and heat stress for crops in northeast Australia. Glob Change Biol 21, 4115–
4127. doi:10.1111/gcb.13022
Singh, V., Nguyen, C.T., McLean, G., Chapman, S., Zheng, B., van Oosterom, E.J., Hammer, G.L. (2017)
Quantifying high temperature risks and their potential effects on sorghum production in Australia.
Field Crops Research 211, 77–88. doi:10.1016/j.fcr.2017.06.012
Singh, V., Nguyen, C.T., Yang, Z., Chapman, S., van Oosterom, E.J., Hammer, G.L. (2016) Genotypic
differences in effects of short episodes of high-temperature stress during reproductive development
in sorghum. Crop Sci 56, 1561–1572. doi:10.2135/cropsci2015.09.0545
Whish, J.P.M., Butler, G., Castor, M., Cawthray, S., Broad, I., Carberry, P.S., Hammer, G.L., McLean,
G., Routley, R., Yeates, S.J. (2005) Modelling the effects of row configuration on sorghum yield
reliability in north-eastern Australia. Aust. J. Agric. Res. 56, 11–23. doi:10.1071/AR04128
Acknowledgements
This work was completed as part of the GRDC summer cropping project (CSP1806), a collaboration
between CSIRO and GRDC.
Contact details
Jeremy Whish
CSIRO Agriculture and Food
306 Carmody Rd St Lucia Qld 4067
Ph: 07 4571 3215
Email: Jeremy.Whish@csiro.au
2020 NORTH STAR GRDC GRAINS RESEARCH UPDATE
17The impact of harvest management in chickpeas – desiccation and front of
header losses
Richard Daniel, Linda Bailey, Denielle Kilby, Branko Duric, Richard Black and Lawrie Price.
Northern Grower Alliance
Key words
chickpea desiccation, harvest losses
GRDC code
NGA00004: GRDC Grower Solutions for northern NSW and southern Qld
Take home messages
• Generally minor impact from desiccant treatments or application timing on yield or grain quality
• Decisions on harvest management choice should be determined by cost, attitude to Ally® plant
back restrictions, weed spectrum present at harvest and speed of desiccation required
• Delayed harvest at low % grain moisture caused more damaged and split grain than desiccant
treatment or timing
• Ideally target desiccation at ~85-90% pod maturity and schedule harvest 7 days later to reduce
grain quality issues
• Large levels of pod and grain losses were measured at the front of the header in four commercial
evaluations (~100-200 kg/ha)
• Losses reduced by ~50-90 kg/ha when harvested with air assist or when brushes were attached
to the reel
• Impact from the harvest modifications would have improved returns by $34-67/ha
• In the trials conducted in 2018 and 2019, this represented an additional 5-18% yield.
Background
Northern Grower Alliance have been researching two important aspects of chickpea harvest
management during the period 2017-2019.
The first has been to evaluate the impact of desiccant choice and timing on yield and grain quality.
The second has focussed on the magnitude of header losses and the impact on yield and economics
from changes in harvest approach.
Desiccation evaluation 2017-2019
The area of focus has evolved over the three seasons:
2017 – 5 trials evaluating current and new desiccation tools to assist in refining management
programs. Treatments included glyphosate alone, glyphosate + Ally (metsulfuron-methyl),
glyphosate + Sharpen® (saflufenacil), Reglone® (diquat), Gramoxone® (paraquat) (refer to label and
follow use pattern for chickpeas) and Gramoxone + Sharpen.
2018 - 4 trials continuing the original activity. An additional 3 trials focussed on impact of desiccation
timing (application ~3, 2 and 1 week prior to ‘planned’ commercial harvest). In all three timing trials,
treatments were also harvested after a 14-day delay. Treatments repeated from 2017.
2019 - 3 trials primarily focussed on the impact of desiccation timing (application at ~70%, 80% and
90% pods at physiological maturity). Harvest was conducted for all timings ~7 days after application.
Similar treatments to 2017 and 2018 but replaced Reglone with glyphosate + Ally + Sharpen.
2020 NORTH STAR GRDC GRAINS RESEARCH UPDATE
18Pod maturity was assessed at each application on a minimum of 10 main branches. Pods were
considered mature when a ‘yellow beak’ was starting to extend on the enclosed grains. This stage
often corresponded with a purplish tinge appearing on the pod coat.
Key points - desiccation evaluation 2017-2019
Leaf discolouration and leaf drop (visual ratings)
• Treatments increased % leaf discolouration and % leaf drop compared to the untreated but
without consistent differences between treatments across sites
• Improvements in % leaf discolouration and % leaf drop compared to the untreated were
greatest in 2017 (where high levels of October rainfall encouraged crop regrowth) and
generally lowest in 2019 at sites that matured very rapidly under high moisture stress.
Stem dry down (physical rating)
• A ‘twist test’ was conducted to assess the % of plants where all stems snapped at harvest.
This was done to provide an indication of stem ropiness or harvest readiness
• The most consistent treatments in 2017 and 2018 were the mixture of glyphosate + Ally or
Gramoxone 250 + Sharpen. In 2019 there was no significant difference, in any trial, between
any treatment and the untreated
• There was a positive dose response to glyphosate in 2017 and 2018 with increased stem
snapping from the 1.8 L/ha rate (540 g ai/L formulation).
Figure 1. Stem twist test results 10-17 days after application, as an indication of stem dry down.
(Mean of 5 trials 2017)
NIS = non-ionic surfactant
2020 NORTH STAR GRDC GRAINS RESEARCH UPDATE
19Figure 2. Stem twist test results 7-15 days after application, as indication of stem dry down.
(Mean of 4 trials 2018)
NIS = non-ionic surfactant
Figure 3. Stem twist test results 6-10 days after application, as indication of stem dry down.
(Mean of 3 trials 2019)
Yield
• In 14 of the 15 trials, there was no significant difference in yield between any treatment and
the untreated
• In 2018, there was a significant reduction in yield from Gramoxone 250 at one site where the
application was ~4 weeks prior to expected commercial harvest and then harvest was
delayed by another 2 weeks. Crop stage at application was only 59% of pods at physiological
maturity.
Grain quality (NIR and sievematic)
• Impact on grain quality was generally minor
2020 NORTH STAR GRDC GRAINS RESEARCH UPDATE
20• Test weight was significantly reduced in 2 trials in 2018 by Gramoxone 250 or Reglone when
application occurred ~4 weeks prior to expected harvest. Crop stage at application was ~50-
60% of pods at physiological maturity
• There was no significant impact on screenings from any desiccant treatment in 2018 (using a
4mm slotted screen as an indication of defective grain)
• Impact on grain moisture at harvest was minor with no significant difference between
desiccant treatments and the Untreated in 12 of 15 trials. All treatments reduced grain
moisture by ~1% in a 2017 trial where regrowth was evident and Gramoxone 250
significantly reduced harvest moisture at 2 of the 3 sites in 2019.
Grain grading (visual rating)
• Visual grain assessment on all trials from 2019 showed no significant impact from desiccant
treatment or timing on the % green or yellow grain compared to untreated grain harvested
at the same time
• In one trial, application of glyphosate alone at 70% of pods at physiological maturity reduced
the percentage of mature grain by ~2% and increased the percentage damaged grain by a
similar amount. There was no significant impact when glyphosate was applied at 90% pod
maturity.
Germination
• Germination tests were conducted on seed samples from application timing trials in 2018
and 2019. Effects were generally minor
• Significant reductions in germination were observed from glyphosate + Ally applied at 58%
pod maturity in 1 trial in 2018 and glyphosate + Sharpen + Ally applied at 66% pod maturity
in 2019. In both cases, application of the same treatment at later crop stages had no effect
• Reduced germination was observed from all treatments at one site in 2019 when applied at
90% pod maturity where a rain event of ~18mm occurred between application and harvest.
There was no consistent impact from treatments on germination from applications at the
same site at 70 and 80% pod maturity.
NB The use of desiccants is not recommended when the grain is to be used for seed.
Overall
Differences between desiccant treatments and timing of application were less obvious than
originally expected.
• The addition of Ally to glyphosate will generally improve stem dry down compared to other
treatments, whilst higher label rates of glyphosate will improve the speed of discolouration
and stem dry down.
• Impacts on yield and grain quality were relatively minor, even when application occurred up
to 2 or 3 weeks earlier than currently scheduled.
However, in 5 of the 6 trials where harvest timing was also compared, it was clear that the earlier
harvest of chickpeas had significantly lower levels of damaged grain. This effect was irrespective of
whether the plots had been desiccated or untreated. Although differences in header setup can’t be
eliminated, it is likely that the lower levels of damaged or split grain is at least partly due to the
higher levels of grain moisture at harvest. NB even the early application treatments had grain
moisture lower than 10%, when tested within 24 hours of harvest, in 5 of the 6 trials.
Rather than suggesting that the industry desiccate chickpeas at an earlier maturity stage, this data
should provide good confidence that desiccation at 85-90% pod maturity is highly unlikely to have
any negative impact on yield or grain quality. When combined with harvest scheduled ~7 days after
2020 NORTH STAR GRDC GRAINS RESEARCH UPDATE
21application, this should allow harvest at slightly higher grain moisture and significantly reduce the
amount of damaged or split grain in samples.
Commercial harvest losses 2018-2019
Commercial observations have frequently indicated high levels of harvest grain and pod loss in
chickpeas, particularly in crops with reduced biomass that ‘feed’ poorly into the header. This grain
loss is different to grain that passes through the header (processing loss) or grain left on plants
(harvest height loss). Front of header grain loss is made up of pods and grain that are knocked off by
the reel, cut off by the knife but fall outside the header front or thrown out from the header by the
drum or belt.
In 2018, data was generated at a site near Gurley where PBA Seamer was harvested with a header
fitted with an air front. Replicated strips were established where the only difference was whether
the air front was turned on or off during harvest.
Counts were taken of pods or grain on the ground together with the number of grains/pod and grain
weight. In 2018, sampling zones were assessed across the harvested width with no pods or grain
apparent on the ground prior to harvest. Results in Table 1 are for the pod and grain losses away
from the header trail. These are the harvest losses that occurred at the front of the header but
exclude any pods that were unharvested but still attached to plants.
Figure 4. Brushes attached to the header reel Bellata 2019
In 2019 three sites were evaluated with sampling away from the header trail to identify the pods or
grain losses at the front of the header. Again there was no indication of pod or grain loss prior to
harvest. Two of the sites had air assist fitted to the header that could be simply turned on or off. The
third site evaluated lengths of brushes attached to the reel (Figure 1).
2020 NORTH STAR GRDC GRAINS RESEARCH UPDATE
22Table 1. Impact on chickpea yield losses from air assist or reel brushes
Yield losses on ground Reduced grain
Location Variety and
Header set-up losses kg/ha
and year yield Pods/m2 Grain/m2 Total kg/ha
and ($/ha)
Gurley PBA Seamer Air assist OFF 55 a 10 164 a
89 kg/ha
2018 ~0.62 t/ha Air assist ON 22 b 8 76 b ($67/ha)
Wee Waa PBA Monarch Air assist OFF 33 a 5 115 a
45 kg/ha
2019 ~1.0 t/ha Air assist ON 21 b 3 70 b ($34/ha)
Bongeen PBA HatTrick Air assist OFF 38 a 1 123 a
80 kg/ha
2019 ~0.45 t/ha Air assist ON 14 b 0 43 b ($60/ha)
PBA HatTrick Reel brushes OFF 62 a 11 217 a
Bellata
63 kg/ha
2019 ~0.40 t/ha Reel brushes ON 43 b 9 154 b ($47/ha)
Letters of significance show significant differences within each site (2 sample T test, p=0.05)
Economic impact calculated on a $750/t grain price
All results in Table 1 are for sampling away from the header trail. This shows the yield losses occurring at the header front.
Assessment of grains/pod and grain weight was conducted to calculate total grain loss.
Key points – commercial harvest losses 2018-2019
• The majority of grain losses were as whole pods rather than individual grains
• At all four sites between ~100 and 200 kg/ha of grain was lost at the front of the header
using a conventional setup
• Use of air assist or brushes attached to the reel significantly reduced the losses of whole
pods and the total grain loss, at all sites
• There was no significant difference in losses of individual grains
• The mean reduction in grain loss was 70 kg/ha (range 45 to 89 kg/ha)
• The mean reduction in grain loss was $52/ha (range $34 to $67/ha)
• The reduction in losses would have been equivalent to an extra 5-18% crop yield.
Overall
All four trials highlighted the amount of chickpea grain and income that can be lost at the front of
the header at harvest. The impact of air assist or even the simple approach of attaching brushes to
the reel provided benefits of ~$50/ha. However some caution is needed as both 2018 and 2019 were
low yielding seasons with yields varying between 0.4 and 1.0 t/ha. The benefits of simple header
adaptations may be more substantial in lower yielding years or where crop biomass or planting
configuration is likely to result in poor levels of ‘feeding in’ of harvested material.
Further evaluation is warranted under more normal conditions to provide growers with realistic
indications of the benefits of changes in chickpea harvest management.
Acknowledgements
The research undertaken as part of this project is made possible by the significant contributions of
growers through both trial cooperation and the support of the GRDC, the author would like to thank
them for their continued support.
2020 NORTH STAR GRDC GRAINS RESEARCH UPDATE
23NGA would particularly like to acknowledge the assistance from a large number of trial co-operators
during this series of trials: Wade Bidstrup, Graham Butler, Jack Williamson, Sam Chaffey, Glen
Kendall, Mark Cotter, Drew Penberthy, Nigel Melbourne, Ash Butler and Ross Durham.
Contact details
Richard Daniel
Northern Grower Alliance
Ph: 07 4639 5344
richard.daniel@nga.org.au
Varieties displaying this symbol beside them are protected under the Plant Breeders Rights
Act 1994
® Registered Trademark
2020 NORTH STAR GRDC GRAINS RESEARCH UPDATE
24Commercial harvest loss assessments in chickpeas
Ed Offner, Jess Mickelborough, Edward Britten, Agronomist, MCA Agronomy Pty Ltd
Key words
chickpea, harvest, losses
Take home message
• Australian chickpea growers are potentially leaving hundreds of dollars per hectare behind at
harvest due to header setup
• Header set up and modifications may have a dramatic impact on harvest losses
• As farm scale has increased over time, harvest efficiency has become more crucial. However,
have harvest losses increased to achieve this efficiency? Is there potential to achieve both an
efficient harvest and reduce grain losses at harvest?
• Can we produce guidelines to educate growers on what can be achieved by improving harvest
setups or using header adaptions in chickpeas?
Introduction
Producing a chickpea crop is a large investment so there is nothing more frustrating than watching a
fair percentage of that crop being left on the ground through harvest losses.
Harvest losses are not a new issue to pulse production. Harvest evaluations in mungbeans in CQ in
1985-1987 seasons, found harvest losses to be on average 30% of harvestable yield. This equated to
approximately 230kg/ha (Cumming 2010).
Since that time, industry has been extremely fortunate to have had plant breeders working hard to
achieve huge advancements in the harvestability of modern pulse varieties including chickpeas.
There have also been significant engineering improvements to header fronts: drapers, self-levelling,
flex platforms and others.
Air reels were commonly used in the past for harvesting pulses to improve harvestability.
Improvements to modern fronts has meant the majority of growers are no longer using air reels as a
preferred option. Even with all of these engineering improvements, are we still incurring
unacceptable harvest losses?
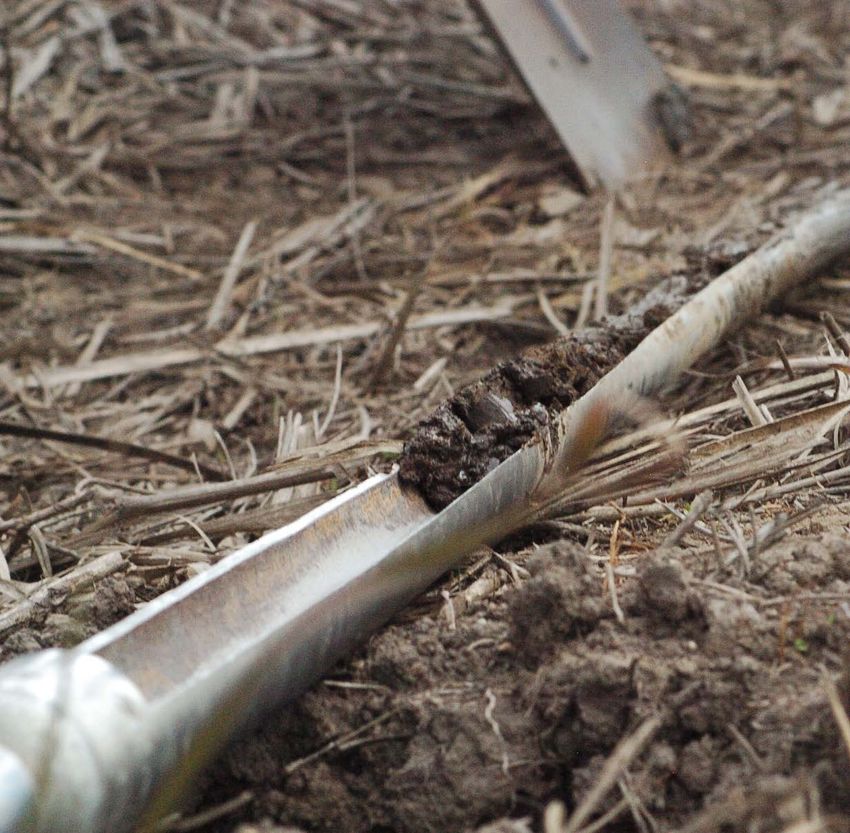
In recent years growers have been reporting particularly high levels of harvest losses in chickpeas,
predominantly at the header front near the knife. Growers were reporting that pod losses were
occurring when the knife hit the plant and when pods were rolling off the front over the knife. After
observing this happening on many of our clients’ farms, MCA undertook some basic pod counts to
better understand how much was being left behind. Assessments were undertaken on three farms in
the Meandarra district with varying header front set ups. Our data collection and analysis would not
stand up to any scrutiny by a biometrician, however the extent of the losses and the potential
impact on profitability was extreme in some cases. Refer to Figure 1. (Please note these were
multiple fields and in some cases had multiple machines working).
Method 1
Twelve random samples were assessed per field to look at the yield and dollars per hectare lost at
harvest. Each sample was 1/10th of a square metre. Whole unsplit pods were counted, and we
assumed an average of 1 seed per pod with a seed size of 5000 seeds/kg and an on-farm price
$800/t. Refer to Table 1 and Figure 1.
2020 NORTH STAR GRDC GRAINS RESEARCH UPDATE
25Table 1. 2018 Pod loss at the header front
Conventional Conventional Conventional Conventional Flex front Flex front Flex front
header header header header
set up set up set up set up
Seed counts/0.1m2 17 10 0 5 12 3 21
12 81 16 34 2 6 14
9 47 19 0 6 12 5
8 12 8 8 15 7 9
5 4 6 28 17 27 5
47 2 8 6 52 6 1
56 14 12 44 2 16 7
20 8 7 17 1 45 14
41 27 46 12 1 8 6
22 2 13 8 3 31 16
14 17 7 7 24 15 5
7 31 22 3 2 9 8
Total 258 255 164 172 137 185 111
Average 21.5 21.2 13.7 14.3 11.4 15.4 9.2
Seeds/m2 217 214 138 145 115 155 93
Seeds/ha 2167339 2142137 1378024 1444557 1150877 1554103 932460
GROWER GROWER GROWER GROWER GROWER GROWER GROWER
1 1 1 2 3 3 3
Variety HatTrick HatTrick HatTrick HatTrick Seamer Seamer Kyabra
Rigid/Flex front Rigid Front Rigid Front Rigid Front Rigid Front Flex Front Flex Front Flex Front
Kg/ha assuming 433 428 276 289 230 311 186
5,000 seeds
$/ha on the ground $347 $343 $220 $231 $184 $249 $149
assuming $800/t
Figure 1. 2018 Pod loss at the header front
(HatTrick , Seamer and Kyabra are varieties protected under the Plant Breeders Rights Act 1994)
2020 NORTH STAR GRDC GRAINS RESEARCH UPDATE
26Of note: Grower 1 for example, had variations from field to field and there were multiple headers
working in these fields. The variation may have been operator, ground conditions and/or set up. It
appeared that the flex fronts were an improvement, however in one of grower 3’s fields, there was
still significant losses.
After being quite shocked by what the pod counts were suggesting, we started asking the question,
“Can we reduce losses by modifying the header front?”.
Multiple clients tried different modifications, including adding paddles to the reel, fixing different
light crop fingers, adding bristles behind the knife sections and a combination of these attachments.
They achieved varying results. Some clients also purchased flex fronts, again achieving varying
results depending on the design of the front, and crop and field conditions.
After observing a well-regarded pulse grower utilise an AWS Airbar® attachment mounted in front of
the reel of a John Deere® flex front harvesting mungbeans, and achieving a large reduction in losses,
MCA became interested in the concept and started discussing it with clients.
In 2018 and 2019 four of our clients invested in the Airbar systems. We then decided to do some
more basic pod counts to try and measure a reduction in losses. The average improvement in losses
was 180 kg/ha with one very short low yielding crop showing an extreme improvement of 297 kg/ha.
Method 2
We asked header operators to do strips with the Airbar operating and then set up without the Airbar
operating. In these strips we assessed 20 x 625 cm2 samples and assumed 1.5 seeds/pod and a seed
size of 5000 seeds/kg. Please note our data collection and analysis is not to be seen as statistically
valid. Refer to Table 2 and Figure 2.
2020 NORTH STAR GRDC GRAINS RESEARCH UPDATE
27You can also read