U.S. BUS RAPID TRANSIT - 10 high-quality features and the value chain of firms that provide them - The Rockefeller Foundation
←
→
Page content transcription
If your browser does not render page correctly, please read the page content below
U.S. BUS RAPID TRANSIT
10 high-quality features and the value chain of firms that provide them

                             Marcy Lowe and Monica La
            Contributing researchers: Susan Wunderink, Shawn Stokes, and Charlie Haley
                                  Web specialist: Robert Cooper
                                          July 10, 2012
This research was prepared with generous support from The Rockefeller Foundation.

Acknowledgments – The authors are grateful for valuable information and feedback
from all participants in the working meeting held at Duke University on March 8,
2012. Many thanks also to Frances Hooper, Michael Replogle, Jason Hellendrung and
Martin Zogran. For valuable comments on later drafts, we would like to thank Cliff
Henke, Brendon Hemily, Alan Wulkan, Annie Weinstock, and Benjamin de la Pena.

None of the opinions or comments expressed in this report are endorsed by the
companies mentioned or individuals interviewed. Errors of fact or interpretation
remain exclusively with the authors. We welcome comments and suggestions.
The lead author can be contacted at marcy.lowe@duke.edu

Free copies of this report and the accompanying interactive visualization tool are
available at the CGGC website, http://www.cggc.duke.edu/

Cover image by Sasaki Associates, Inc.

© July 10, 2012. Center on Globalization, Governance & Competitiveness, Duke University
List of Abbreviations
 A&E          Architectural and Engineering                           KCATA   Kansas City Area Transportation Authority
 AC Transit   Alameda-Contra Costa Transit District                   LRT     Light Rail Transit
 AGC          Associated General Contractors of America               LTD     Lane Transit District
 APC          Automated Passenger Counters                            MBIA    Municipal Bond Investors Assurance Corporation
 APTA         American Public Transportation Association
                                                                      MBTA    Massachusetts Bay Transportation Authority
 AVL          Automatic Vehicle Location
                                                                      MPO     Metropolitan Planning Organization
 AWEA         American Wind Energy Association
 BRT          Bus Rapid Transit                                       NBRTI   National BRT Institute
 CAD          Computer Aided Dispatch                                 NEPA    National Environmental Policy Act
 CCTV         Closed-circuit television camera                        NOx     Nitrogen Oxides
 CGGC         Center on Globalization, Governance & Competitiveness   OEM     Original Equipment Manufacturer
 CM           Construction Manager                                    PM      Particulate Matter
 CMAQ         Congestion Mitigation and Air Quality Improvement       PMC     Project Management Consultant
 CMGC         Construction Manager General Contractor                 PMOC    Project Management Oversight Contractors
 CNG          Compressed Natural Gas
                                                                      PPP     Public-Private Partnership
 CTAA         Community Transportation Association of America
                                                                      REIT    Real Estate Investment Trust
 CTS          Center for Transportation Studies
 DB           Design-Build                                            RFP     Request for Proposal
 DBB          Design Bid Build                                        RPO     Rural Planning Organization
 DBE          Disadvantaged Enterprise                                RTC     Regional Transportation Commission
 DIF          Development Impact Fee                                  SME     Small and Medium Enterprise
 DOT          Department of Transportation                            STP     Surface Transportation Program
 DSR          Debt Service Reserve                                    SWF     Sovereign Wealth Fund
 FGIC         Financial Guaranty Insurance Company                    TIF     Tax Increment Financing
 FHWA         Federal Highway Administration
                                                                      TIFIA   Transportation Infrastructure and Finance Innovation
 FMOC         Financial Management Oversight Contractors
                                                                      TOD     Transit-Oriented Development
 FSA          Financial Security Assurance Inc.
 FSP          Full Service Professional                               TSP     Transit Signal Priority
 FTA          Federal Transit Administration                          TUF     Transport Utility Fee
 GCRTA        Greater Cleveland Regional Transit Authority            TVM     Ticket Vending Machine
 GEC          General Engineering Consultant                          VAA     Vehicle Assist and Automation
 ITDP         Institute for Transportation and Development Policy     VMT     Vehicle Miles Traveled
 ITS          Intelligent Transportation Systems
 ITSA         Intelligent Transportation Society of America (ITSA)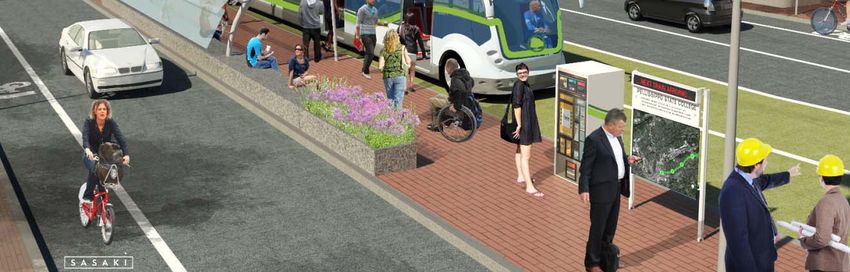
CONTENTS
     I. Executive Summary

     II. Creating High-Quality BRT in the United States

     III. BRT Value Chain

     IV. Potential for a BRT Business Constituency

     V. Conclusion

     VI. Appendix

4
Section I.
    I. Executive Summary

            Key Findings

            II. Creating High-Quality BRT in the United States

            III. BRT Value Chain

            IV. Potential for a BRT Business Constituency

            V. Conclusion

            VI. Appendix

5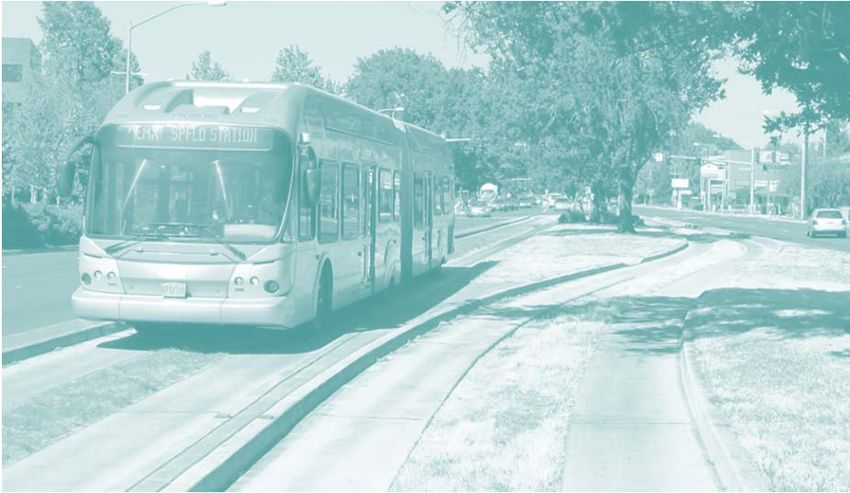
Key Findings
Bus rapid transit (BRT) is increasingly being considered in cities across the United States as a reliable and
cost-effective public transit mode. A large part of the appeal of BRT is its flexibility, offering a choice of
system features that can be adapted to each community’s needs and constraints. As more U.S. cities look
to BRT, they will need to understand the value chain that provides the vehicles, technology, services and
financing needed to create a high-quality BRT system.
Key Findings:
At least 390 firms across the value chain serve markets directly relevant to BRT. The BRT value chain is
essentially a public transit value chain. The Center on Globalization, Governance, and Competiveness
(CGGC) database of firms excludes those not directly relevant to BRT. In addition, of the total 390 firms
identified, half have already supplied an existing BRT project and/or explicitly address BRT on their
websites.
Experienced full-service professional firms (FSPs) will likely play a crucial role in the development of U.S.
BRT. FSPs stretch across all segments of the chain, performing services from architect/engineering to
legal matters to finance, communications, branding, and environmental impact. The large FSPs have
vital experience in coordinating public and private players and can draw on expertise gained in other
infrastructure projects to explore new financing and project delivery approaches for BRT.
BRT development promises an increasing role for Intelligent Transportation Systems (ITS). Lead firms
face growing competition from new players. Parallel to rapidly expanding technology options, a new
value chain sub-segment is emerging: ITS consulting.
The finance segment is less developed for BRT compared with rail or highway projects. As more cities
begin to embrace BRT—while facing strained state budgets and growing competition for federal dollars—
it will be increasingly important to identify key private sector players that can drive innovative finance
mechanisms.
6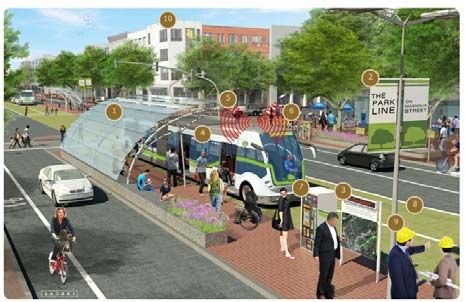
Section II.
              I. Executive Summary

     II. Creating High-Quality BRT in the United States
              What is BRT?
              BRT in the United States
              The Need for Clear Definitions
              10 CGGC Focus Systems
              The Emerging BRT Standard
              10 Features of High-Quality BRT
              This Report
              III. BRT Value Chain

             IV. Potential for a BRT Business Constituency

             V. Conclusion

             VI. Appendix
 7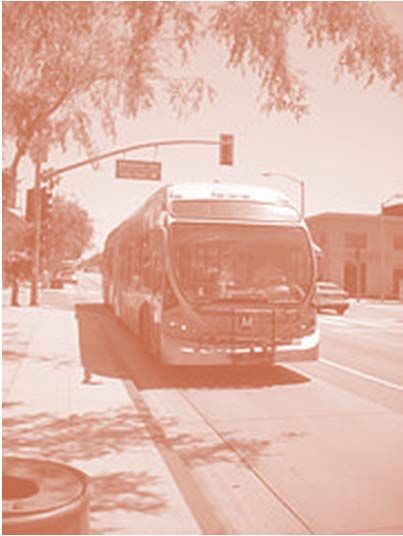
What is BRT?
Bus rapid transit (BRT) seeks to
achieve faster, more reliable bus
service via features commonly TransMilenio
associated with urban rail
systems—for example, running
the vehicles on their own right of
way, or collecting fares before
passengers get on board.
At its most developed, BRT can
offer speeds and capacities
similar to subways—as in Bogotá,
Colombia’s TransMilenio—at a
much lower capital cost. Yet all Photo credit: StreetsBlog, http://www.streetsblog.org/wp-content/uploads/2007/10/img_1265-throngs.jpg
BRT systems are far from the
same. Each system requires a Bogotá, Colombia
mix of characteristics uniquely Opened in 2000
suited to its community. Systems Over 54 miles of BRT lines
also vary widely in their level of
performance.1 1.3 million passengers per weekday2
Peak frequency (buses per hour)
8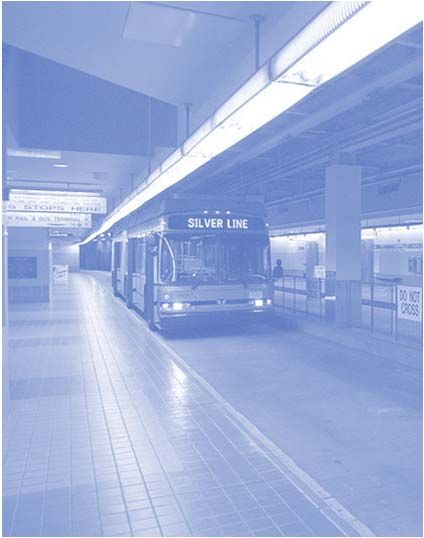
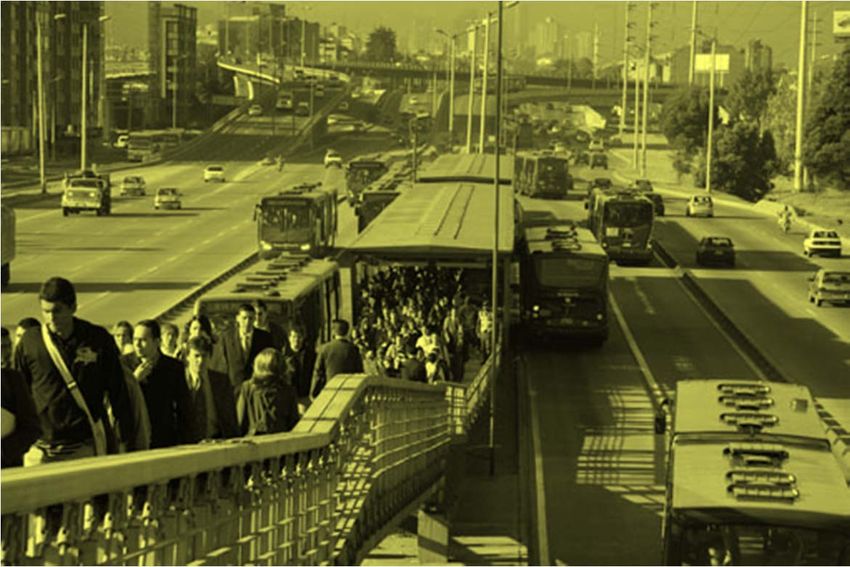
BRT in the United States
Compared to other countries where BRT has been most successful, the United States has lower density
land use, higher automobile ownership and less orientation toward public transit—all factors that mean BRT
will often look different in U.S. cities. Yet a number of trends suggest that the time is ripe for U.S. BRT:
Transit demand is growing
Young Americans are driving less and using transit more
Capital costs for BRT are usually much lower than for rail transit
Competition for federal transit dollars is increasing, making cost-effectiveness more important than ever
BRT projects can be developed in less time than rail projects
Important: BRT is not a blanket replacement for light rail or other rail options; each transit option has its
advantages or disadvantages in any given context
Credit: MBTA Silver Line Neoplan dual-
Credit: LA Wad Credit: Annie Weinstock, ITDP mode bus at South Station
9
Defining BRT
Considering the importance of securing federal funding, the project requirements under FTA’s Very
Small Starts grant program effectively set a federal minimum definition for BRT in the United States.
The Institute for Transportation and Development Policy (ITDP) is currently leading an effort to
establish a minimum standard for BRT based on the technical knowledge of the international BRT
community.
Federal Funding Requirements3 BRT Definitions by Different Authorities4
FTA Very Small Starts FTA Small Starts FTA TCRP NBRTI ITDP
A project must be a bus, rail The total project cost must be An enhanced bus An integrated An innovative, high A high-quality bus-
or ferry project and contain less than $250 million, with no system that operates on system of capacity, lower cost public based transit
the following features: greater than $75 million in bus lanes or other features, transit solution that can system that
• Transit Stations requested Section 5309 Capital transitways in order to services, and significantly improve delivers fast,
• Signal Priority/Pre- Investment Grant funding. In combine the flexibility of amenities that urban mobility. This comfortable, and
emption (for Bus/LRT) addition, a project must meet one buses with the efficiency improves the permanent, integrated cost-effective urban
• Low Floor / Level of the following guideway criteria: of rail. By doing so, BRT speed, system uses buses or mobility through
Boarding Vehicles • Be a fixed guideway for at operates at faster reliability, and specialized vehicles on the provision of
• Special Branding of least 50% of the project length speeds, provides greater identity of bus roadways or dedicated segregated right-of-
Service in the peak period –AND/OR- service reliability and transit. lanes to quickly and way
• Frequent Service - 10 • Be a corridor-based bus increased customer efficiently transport infrastructure,
min peak/15 min off project with the following convenience. It also passengers to their rapid and frequent
peak minimum elements: utilizes a combination of destinations, while operations, and
• Service offered at least advanced technologies, offering the flexibility to excellence in
14 hours per day o Substantial Transit Stations infrastructure and meet transit demand. BRT marketing and
• Existing corridor ridership o Signal Priority/Pre-emption operational investments systems can easily be customer service.
exceeding 3,000/day (for Bus/LRT) that provide significantly customized to community
• Less than $50 million o Low Floor / Level Boarding better service than needs and incorporate
total cost Vehicles traditional bus service. state-of-the-art, low-cost
• Less than $3 million per o Special Branding of Service technologies that result in
mile (excluding vehicles) o Frequent Service - 10 min more passengers and less
peak/15 min off peak congestion.
o Service offered at least 14
hours per day
10The Emerging BRT Standard
ITDP is developing The BRT Standard, an effort to recognize international best practices by
defining three levels of BRT: Gold, Silver, and Bronze.
The evolving BRT Standard provides a useful framework for understanding the principal
BRT features that together can create a high-quality BRT system.
This study uses the BRT Standard to identify 10 high-quality BRT features, as part of the
method for establishing the ecosystem of firms to be included in the BRT value chain.
Supporters of the BRT Standard5
ITDP is the main convener and secretariat of the BRT Standard. The BRT Standard Committee is
composed of the following experts who also represent their institutions unless otherwise indicated
by an (*):
Walter Hook, ITDP
Manfred Breithaupt, GIZ
Lloyd Wright, Asian Development Bank*
Dario Hidalgo, EMBARQ*
Gerhard Menckhoff, World Bank (retired), ITDP Vice President
Wagner Colombini Martins, Logit Consultoria
Carlos Felipe Pardo, Slow Research
Pedro Szasz, Consultant
Ulises Navarro, Modelistica
Scott Rutherford, University of Washington
The emissions scoring detail for buses was recommended by the International Council on Clean
Transportation, a member of the Best Practice Network of the ClimateWorks Foundation.
Lew Fulton and Tali Trigg of the International Energy Agency have also endorsed the BRT Standard.
11The BRT Standard, Version 1.0
Full text available at:
http://www.itdp.org/index.php?/microsites/brt-standard/
CRITERIA DESCRIPTION
SERVICE PLANNING
• Off-board fare collection One of the most important factors in reducing travel time and improving the customer experience.
• Multiple routes Having multiple routes operate on a single corridor is a good proxy for reduced door-to-door travel times by reducing transfer penalties.
• Peak frequency How often the bus comes during peak travel times such as rush hour is a good proxy for quality of service and corridor selection.
• Off-peak frequency How often the bus comes during off-peak travel times is a good proxy for quality of service and corridor selection.
• Express, limited, and local One of the most important ways to increase operating speeds and reduce passenger travel times.
services
• Control center Increasingly becoming a requirement for a host of service improvements, such as avoiding bus bunching, monitoring bus operations,
identifying problems, and rapidly responding to them.
• Located in top ten corridors Will help ensure a significant proportion of passengers benefit from the improvements.
• Hours of operations A viable transit service must be available to passengers for as many hours throughout the day and week as possible. Otherwise, passengers
could end up stranded or may simply seek another mode.
• Multi-corridor network Ideally, BRT should include multiple corridors that intersect and form a network as this expands travel options for passengers and makes
the system as a whole, more viable.
INFRASTRUCTURE
• Busway alignment The busway is best located where conflicts with other traffic can be minimized, especially from turning movements from mixed-traffic lanes.
• Segregated right-of-way A segregated right-of-way is vital to ensuring that buses can move quickly and unimpeded by congestion.
• Intersection treatments There are several ways to increase bus speeds at intersections, all of which are aimed at increasing the green signal time for the bus lane.
Forbidding turns across the bus lane and minimizing the number of traffic-signal phases where possible are the most important. Traffic-
signal priority when activated by an approaching BRT vehicle is useful in lower-frequency systems.
• Passing lanes at stations Passing lanes at station stops are critical to allow both express and local services. They also allow stations to accommodate a high volume
of buses without getting congested from backed-up buses waiting to enter.
• Minimizing bus emissions Minimizing bus tailpipe emissions (especially particulate matter (PM) and nitrogen oxides (NOx)) is critical to the health of both passengers
and the general urban population.
• Stations set back from Stations should be located at least forty meters from intersections to avoid delays, or else delays can be caused when passengers take a
intersections long time to board or alight and the docked bus blocks others from pulling through the intersection. If stations are located just before an
intersection, the traffic signal can delay buses from moving from the station and thus not allow other buses to pull in.
• Center stations Having a single station serving both directions of the BRT system makes transfers easier and more convenient—something that becomes
more important as the BRT network expands.
• Pavement quality Good-quality pavement ensures better service and operations for a longer period by minimizing the need for maintenance on the busway.The BRT Standard, Version 1.0
Full text available at:
http://www.itdp.org/index.php?/microsites/brt-standard/
CRITERIA DESCRIPTION
STATION DESIGN AND STATION-BUS INTERFACE
• Platform-level boarding One of the most important ways of reducing boarding and alighting times per passenger.
• Safe and comfortable One of the main distinguishing features of a BRT system as opposed to standard bus service is a safe and comfortable station environment.
stations
• Number of doors on bus The speed of boarding and alighting is partially a function of the number of bus doors. Much like a subway in which a car has multiple wide
doors, buses need the same in order to let higher volumes of people on and off the buses.
• Docking bays and sub-stops Multiple docking bays and sub-stops not only increase the capacity of a station, they help provide multiple services at the station as well.
• Sliding doors in BRT Sliding doors where passengers get on and off the buses inside the stations improve the quality of the station environment, reduce the risk
stations of accidents, and prevent pedestrians from entering the station in unauthorized locations.
QUALITY OF SERVICE AND PASSENGER INFORMATION SYSTEMS
• Branding BRT promises a high quality of service, which is reinforced by having a unique brand and identity.
• Passenger information Numerous studies have shown that passenger satisfaction is linked to knowing when the next bus will arrive. Giving passengers information
is critical to a positive overall experience.
INTEGRATION AND ACCESS
• Universal access A BRT system should be accessible to all special needs customers, including those who are physically-, visually-, and/or hearing-impaired,
as well as those with temporary disabilities, the elderly, children, parents with strollers, and other load-carrying passengers.
• Integration with other public Often, when a BRT system is built in a city, a functioning public transport network already exists, be it rail, bus, or minibus. The BRT system
transport should integrate into the rest of the public transport network.
• Pedestrian access A BRT system could be extremely well-designed and functioning but if passengers cannot access it safely, it cannot achieve its goals. Good
pedestrian access is imperative in BRT system design. Additionally, as a new BRT system is a good opportunity for street and public-space
redesign, existing pedestrian environments along the corridor should be improved.
• Secure bicycle parking The provision of bicycle parking at stations is necessary for passengers who wish to use bicycles as feeders to the BRT system. Formal
bicycle-parking facilities that are secure (either by an attendant or observed by security camera) and weather protected are more likely to
be used by passengers.
• Bicycle lanes Bicycle-lane networks integrated with the BRT corridor improve customer access, provide a full set of sustainable travel options, and
enhance road safety.
• Bicycle sharing integration Having the option to make short trips from the BRT corridor by a shared bike is important to providing connectivity to some destinations.
1310 High-Quality BRT Features
For interactive database, click
http://www.cggc.duke.edu/environ
ment/cleanenergy/brt/index.php
Based on ITDP, The BRT Standard
141 Stations 6 Integration and Access
Passengers board the vehicle at platform level BRT is integrated with other modes
Station is safe and comfortable Secure bicycle parking at stations
Space allows several buses to stop at once System is accessible to pedestrians and special-needs passengers
2 Branding 7 Fare Collection
All vehicles, routes, and stations follow a single unifying Passengers pay fare before boarding
brand that promises high-quality service Fare is integrated with other public transport options
3 Passenger Communication 8 Infrastructure
Route maps are easy to find Multiple bus routes can share the same BRT infrastructure
Passengers can get real-time information BRT vehicles have their own separate right-of-way
4 Vehicles 9 Service Planning
Doors allow many passengers to board or exit at once Service operates frequently in peak and off-peak
Vehicles are recognizable and clearly marked Express, limited, and local services
Vehicles meet strict emissions standards Operates late nights and weekends
5 Intelligent Transportation Systems (ITS) 10 Value Capture & Innovative Finance
Vehicle tracking and intelligent transportation systems Finance is not considered a BRT “feature,” nor is it included in the
Operation control system to reduce vehicle bunching BRT Standard. It is mentioned here because innovative finance
mechanisms are increasingly important for BRT projects facing
strained state budgets and competition for federal transit dollars.
Innovative finance mechanisms—such as special assessment
districts or public/private joint development projects—attempt to
capture the increased value of property surrounding a BRT line or
corridor, using it to leverage public funding resources and help pay
for capital costs.
Key private sector stakeholders include real estate developers and
investors, law firms and project management consultants.
For full description of high-quality features, see The BRT Standard.
15This Report
► This report examines the ecosystem of firms that provide services, vehicles and equipment
relevant to BRT projects in the United States. The value chain includes six main segments
and 21 sub-segments, each of which is analyzed for industry characteristics.
► The analysis also highlights 10 “CGGC focus” BRT systems to show selected system
characteristics, capital costs per mile, federal versus state and local funding, and the
relevant supplier firms from each segment of the value chain. Systems were selected
based on data availability. See the Appendix for more information on methods.
► Also considered is the potential to develop a business constituency. How can firms across
the value chain work together as an assertive industry to promote BRT in the United
States?
► Finally, this report includes three interactive databases:
1) 10 high-quality BRT features and the firms that provide them
2) 10 CGGC focus BRT systems, cost and funding data
3) 390 companies in the value chain, firm-level data
16Online Data Tools
2) 10 CGGC focus BRT systems, cost and funding data:
http://tinyurl.com/7czcgnm
1) 10 high-quality BRT features
and the firms that provide them:
http://www.cggc.duke.edu/environ
ment/cleanenergy/brt/index.php
3) 390 companies in the value chain, firm-level data:
http://tinyurl.com/7pmzwjj
17Section III.
I. Executive Summary
II. Creating High-Quality BRT in the United States
III. BRT Value Chain
The BRT Value Chain
Analysis of Each Value Chain Segment
Interactive Database of Firms
Condensed List of Firms, by Segment
U.S. Map of Firms
Interactive Firm-level Data
Vendors Used in 10 CGGC Focus Systems
IV. Potential for a BRT Business Constituency
V. Conclusion
VI. Appendix
18The BRT Value Chain
Planning Finance Construction Operation ITS Manufacture
Full-service Professional
Legal & Government Affairs Operation Systems BRT Vehicles
Funding and Finance Consulting Contractors Fuel Signal Priority Stations
Architect & Public Sources Passenger Bicycle
Engineering Communication Park./Share
Communications Investors Fare Collection
Specialty Real Estate Maintenance KEY
Public sector
Private sector
Safety and Security
Government: U.S. FTA, U.S. FHWA, U.S. and State DOTs, Elected Officials, MPOs, RPOs, Local Planning/Zoning
Advocates & Researchers: Transportation, Smart Growth, Community, Environment, Bike/Pedestrian, Labor, Chambers of
Commerce, Transit Users, Research Centers/Think Tanks
19Planning Finance Construction Operation ITS Manufacture
• Largest segment • Segment includes • Segment includes • Segment includes
prime construction • Firms that provide • Firms that provide
of the value chain public financial firms that provide Intelligent BRT vehicles,
contractors with
in number of firms players (federal, experience in transit Transportation shelters/street
• Represents a state and local mass transit management Systems (ITS) furniture, and
significant portion governments) and services, fuel, and
increasingly • Usually represents maintenance, as bicycle parking
of a BRT system’s • System
potential private greatest project well as safety and Operations, • CGGC database
total capital cost cost
players security—two Transit Signal emphasizes U.S.-
• Involved in all • Contractors build categories that
planning and • Potential private Priority, and based firms, since
sector players system according overlap with the
design phases of a Passenger manufactured
include investors, to final design ITS segment
BRT project developed by A&E Communication products procured
who participate in • Many are used in many with federal grant
• Includes firms the project itself, design team opportunities exist
from architects & U.S. BRT systems. money must
and real estate • Much activity is for public-private
engineers to interests, who can performed by local partnerships with comply with
• Off-board fare
financial & legal participate in contractors and transit Federal Buy
collection, less
professionals potential subcontractors management America
common in U.S., is
• Firms perform development • As the number of companies, requirements
considered a high-
coordination of opportunities major highway arrangements
associated with frequently found in quality feature • In exchange for
public and private infrastructure
the BRT project, Latin America, but naming rights or
players projects declines, • Advanced vehicle
such as transit – segment shows not yet common in advertising space,
• Involvement is assist/automation
oriented growing interest in the United States agencies can get
structured technologies in
development BRT projects, shelters or bicycle
according to especially those Safety/Security
project delivery sharing programs
that include road are a newer,
method at low or no cost
building growing U.S. field
components
► Six main segments
20FUND &
PLAN DESIGN BUILD MANAGE
FINANCE
•Political Support •Financial Planning: •Physical Design: •Pre-construction: •System Operations
•Corridor Selection: demand analysis, •Engineering: network, right-of-way •ITS
demand analysis, capital and operating runway, stations, acquisition, utility •Customer service
basic system and costs, funding and modal integration relocation
•Maintenance
operations design finance package (bicycles, pedestrians, •Final Impact Studies:
•Safety and security
•Institutional •Funding Options: New taxis) NEPA, others
Arrangements, Starts/Small Starts, •BRT vehicles, bus •Construction:
Stakeholder State and local shelters, fare runways, stations,
Coordination, Public- funding collection intermodal elements
Private Partnership •Financing Options •Operations Planning: •Manufacture: BRT
set-up, other •Public-Private bus operations, vehicles, fare
partnerships Partnership Options intermodal collection, bus
•Impact Studies: integration, ITS, shelters, bicycle
alternatives customer service, parking/sharing
analysis/NEPA safety and security, •Land Use and
(environment, traffic, local policies such as Development projects
economic, social, traffic restrictions
urban form) •Branding and
•Public Participation Marketing: overall BRT
system, BRT vehicles,
station design
•Land Use and
Development projects
such as TOD, joint Based on: ITDP Bus Rapid Transit Planning Guide, 2007.
development
► Firms operate within the transit project timeline
21Planning Finance Construction Operation ITS Manufacture
Full-service Professional
Legal & Government Affairs Operation Systems BRT Vehicles
Funding and Finance Consulting Contractors Fuel Signal Priority Stations
Architect & Public Sources Passenger Bicycle
Engineering Communication Park./Share
Communications Investors Fare Collection
Specialty Real Estate Maintenance
Safety and Security
►The first three segments of the value chain—Planning,
Finance, and Construction—relate differently to the
transit agency depending on the method of project
delivery
22Adapted from: NDCIC, 2010. See References for additional sources.
Design-Bid-Build Construction Manager Design-Build
(DBB) General Contractor
(CMGC) (DB)
Agency
Agency Agency
A&E
Construction Prime
A&E g
Manager
Contractor Contractor
Subcontractors Contractors Subcontractors
• Most widely used • Expected to increase in • Second most common
• Highest control and risk for prevalence • Lowest control and risk for
transit agency • Middle ground between DBB transit agency
• Lowest bid wins and DB in terms of control and • Often used for large
• Can include: risk infrastructure projects
• General Engineering • Offers greater integration • Streamlined process
Consultant (GEC) between design and build • Reduced risk of cost overruns
• Construction Manager phases from construction change
(CM) • Non-low bid method, so state orders
• Project Management laws may or may not allow
Consultant (PMC)
► Most transit projects use one of three types of delivery
23Adapted from: FTA, 2009, p.3-7
100%
Share of risk and control Agency-managed
Transit Agency
Design-Bid-Build (DBB)
GEC
CM
PMC
Construction Manager
General Contractor (CMGC)
Design-Build (DB)
0% 100%
Contractor
Share of risk and control
► Sharing of control and risk varies by delivery type
24Analysis of Each Value Chain Segment 25
26

 Architect &          Firms in this industry plan and design BRT buildings and structures, including road and transit
 Engineering
    (A&E)             infrastructure, shelters, and sometimes bus maintenance facilities and transit centers.

Industry Findings:
  • Firms are interested in working on BRT projects. 75% of the A&E firms in the CGGC list have documented BRT experience
    or mention BRT services on their company website.
  • Having a local/regional headquarters presence is an advantage. About half of the A&E firms with documented BRT
    experience are local/regional firms.
  • Alternative project delivery services are a priority. More than half of A&E firms explicitly list construction management
    and/or project management services on their website.

Typical core services:
  • Design – engineering design for corridors, stations, and sometimes maintenance facilities or transit centers, usually to
    fulfill preliminary engineering/final engineering requirements for FTA funding
  • Planning – studies/surveys to inform engineering and project design and operations planning, including feasibility studies
  • Project/Program Management – FTA grant process, especially financial requirements; procurement; public outreach
  • Construction Management –represent project owner in construction activities; participates in the design process to
    ensure constructability and manages estimated construction costs; may be responsible for hiring and managing
    subcontractors
Other typical services:
 • other construction services
 • environmental services
 • urban planning, including transit-oriented development, bicycle and pedestrian integration
Characteristics of A&E firms in CGGC database:
 • Some firms provide mostly engineering services or architectural design or planning services (e.g., ZGF Architects LLP)
No. of Firms         Annual Sales (in millions)               No. of Employees             No. of Locations (North America)
                     Average           Median            Average            Median            Average            Median
Procurement:
     51      Depends on project delivery
                   $148.1                method {see page875
                                       $40.5              X}                  264                17                 7
Full‐Service Firms in this industry are very large national—and sometimes global—A&E firms that provide a broad
Professional
Firms (FSP) suite of services across the value chain, in addition to their core architectural and engineering
services.
Industry Findings:
• FSPs or large, national construction firms are usually the prime contractors in a DB project delivery method.
• FSPs have expertise in alternative project delivery methods.
• In addition to core A&E services, FSPs can provide extensive ITS services, which is important for BRT projects.
• Some FSPs have business segments that perform construction.
Typical services:
• Core A&E services (see A&E)
• Environmental
• Construction
• Funding and finance consulting
• ITS consulting
• Operations and maintenance consulting
• Security and safety consulting
Characteristics of FSP firms in CGGC database:
No. of Firms Annual Sales (in millions) No. of Employees No. of Locations (North America)
Average Median Average Median Average Median
17 $2,629.2 $949.6 14,672 6000 83 50
27Funding & Firms in this industry specialize in public transportation funding/finance consulting or project
Finance management. They are combined into one industry because funding and finance consulting is a key
Consulting service offered by project management firms.
Industry Findings:
• CGGC-identified firms in this space are mostly small to medium-sized firms
• The industry can be divided into the following three sub-categories:
• firms that provide only transportation funding and finance services (e.g., Public Financial Management, Inc.)
• firms that provide only project/program management and/or construction management services (e.g., Gannett
Fleming Project Development Corp.)
• firms that provide consulting services, such as planning, funding/finance, and project management or
construction management (e.g., InfraConsult LLC).
Typical services:
• Federal funding consulting, especially FTA New Starts/Small Starts guidance and application preparation and
management
• Finance consulting – bonds and other public finance mechanisms; alternative financing methods – public-private
partnerships, value capture mechanisms
• Project/program management (see A&E)
• Construction management (see A&E)
• Planning consulting – operations planning, feasibility studies and data collection, market research, procurement
• Management consulting – workforce, operations, budget
Characteristics of Funding & Finance firms in CGGC database:
No. of Firms Annual Sales (in millions) No. of Employees No. of Locations (North America)
Average Median Average Median Average Median
52 $678.8 $2.8 2,144 32 11.7 3
28Legal & Firms in this industry provide public transportation legal and/or government affairs services for public
Government transportation agencies and contractors.
Affairs
Industry Findings:
• Firms do not explicitly promote BRT services on their websites, perhaps because the legal services needed for BRT are
mostly the same as for LRT and other major mass transit projects.
• Many law firms have traditional practices in transportation, construction, and/or real estate law.
• Law firms tout experience and services in public-private partnerships.
Typical services:
• Transportation law
• Construction law
• Real estate law
• Public-private partnerships counsel
• Financing counsel – bonds, innovative finance mechanisms
• Legal compliance with FTA requirements and other federal laws (e.g., Buy America, NEPA)
• Contracts, including government, private, contract negotiation and oversight
• Property, including right-of-way acquisition
• Dispute resolution
• Lobbying
• Government affairs, including monitoring of transportation policy and updating and providing counsel for clients
• Campaigns for state or local transportation funding initiatives such as new dedicated taxes or assessment districts
Characteristics of legal & government affairs firms in CGGC database:
No. of Firms Annual Sales (in millions) No. of Employees No. of Locations (North America)
Average Median Average Median Average Median
31 $65.7 $33 594 300 7.9 7
29The firms in this industry provide exclusively communications services, including branding and
Communications marketing, signage and maps, and/or public outreach.
Industry Findings:
• This industry faces competition from other industries that include communications in their suite of services. Many
A&E, project management, and law/government affairs firms also provide public outreach or branding and marketing
services.
• Except for advertising firms, most firms are small and specialize in the public transportation market.
• A potentially growing service, especially for BRT, is a marketing niche in finding sponsors to purchase naming rights as
part of a public-private partnership arrangement.
Typical services:
• Branding and marketing
• Advertising
• Signage and maps, including way-finding, bus stop signs, maps, timetables, sign/display fabrication
• Public outreach
Characteristics of communications firms in CGGC database:
No. of Firms Annual Sales (in millions) No. of Employees No. of Locations (North America)
Average Median Average Median Average Median
22 $2.3 $1 47 10 2 1
30Firms in this miscellaneous category provide ITS consulting, safety/security consulting or services,
Specialty environmental services, research services, or executive search services.
Industry Findings:
• Some A&E firms also provide ITS consulting, safety/security consulting, environmental services, and/or research
services.
• Executive search and security services (e.g., security guards) are specialized services not usually offered by A&E firms.
• For research firms in the CGGC database, federal research projects represent a large portion of their work. Local
agency projects may include consumer surveys/studies.
Typical services:
• Environmental, including noise/vibration consulting
• ITS consulting
• Safety/security consulting or services – IT security consulting, guards
• Executive search
• Consumer surveys
31Additional Planning Segment Dynamics:
FTA Oversight Contractors.1,2 Grantees receiving FTA funding, including New Starts funding, may be assigned FTA oversight
contractors—project management oversight contractors (PMOC) and financial management oversight contractors (FMOC)—to
oversee the project on behalf of the FTA. These contractors make sure the projects are on track, within budget, conform to
Federal requirements, and are constructed according to approved plans in an efficient and effective manner. FTA oversight
contractors may offer technical advice but do not have the authority to sign off on project documents or inspect, approve, or
accept construction, vehicles or equipment. FTA contractors are typically A&E firms, have been FTA-approved as a
PMOC/FMOC, and are competitively selected for projects.
Procurement Requirements.3 FTA requirements and/or state or local laws may also require agencies to contract with a certain
percentage of small and medium enterprises (SMEs) and/or disadvantaged business enterprises (DBEs). Federal DBE
requirements for projects receiving federal funding is at least 10% of authorized funds.
32To date, the bulk of funding for BRT projects has come from federal programs, with state and local
Public Sources sources providing a designated or negotiated match. In a few cases, cities have built BRT projects with
little or no federal funding.
Federal Funding Sources4 Regional, State and Local Funding Sources5
FTA Grant & Formula Programs State
“Transit Capital Investment Program” (49 U.S.C. 5309) General funds
o Fixed Guideway Modernization Taxes: sales, gas, motor vehicle/rental car
o Bus Capital program Vehicle registration/license/title fees
o New Starts program Other
Small Starts o State highway funds
Very Small Starts o Trust funds
Urbanized Area Formula Grants program o Lottery funds
o Documentary stamps
The Interagency Partnership for Sustainable Communities o Miscellaneous taxes, fees, revenues,
Bus Livability grants assessments
Local
ARRA (Recovery Grants) Local sales tax, local property tax
General revenues
Flexible Funding Highway/road departments (maintenance funds)
Surface Transportation Program (STP)
Congestion Mitigation and Air Quality Improvement
Program (CMAQ)
Federal and State Credit Programs6 Debt Instruments6
Transportation Infrastructure and Finance Innovation Capital Leasing
Act (TIFIA) Revenue Bonds
State Infrastructure Banks (SIBs) o Fare Box Revenue Bonds
o Grant Anticipation Notes
Debt Service Reserve (DSR)
Advance construction
3310 CGGC Focus Systems: Capital Costs and Funding
Boston
Silver Line-Waterfront/Phase II
$100.00
8.9 miles
$89.17
$90.00
$80.00
For interactive database, click
$70.00 http://tinyurl.com/7czcgnm.
Cost per mile ($ millions)
$60.00
$50.00
Boston Pittsburgh Los Angeles
$40.00 Silver Line-Washington MLK Jr. Orange Line
Street/Phase I East Busway Eugene 14.2 miles
$30.00 2.4 miles 9.1 miles EmX $25.00
Cleveland $20.00 4 miles Oakland Kansas City
$19.39 Las Vegas
$20.00 HealthLine $16.46 San Pablo MAX Los Angeles
7.1 miles MAX and SDX 12 miles
Rapid Metro Rapid
$10.00 $7 19 miles $5.49
14 miles 400 miles
$2.72
$0.23 $0.24
$-
Selected U.S. BRT systems, by length
Federal State and
BRT system Miles Capital costs Cost per mile
funding local funding
Boston Silver Line-Washington Street/Phase I 2.4 $ 46,530,000.00 $19,387,500.00 0% 100%
Cleveland HealthLine 7.1 $ 197,182,000.00 $7,000,000.00 50% 50%
Boston Silver Line-Waterfront/Phase II 8.9 $ 624,200,000.00 $89,171,428.57 77% 23%
Pittsburgh MLK Jr. East Busway 9.1 $ 68,000,000.00 $20,000,000.00 50% 50%
Eugene EmX 4.0 $ 65,854,120.00 $ 16,463,530.00 80% 20%
Oakland San Pablo Rapid 14.0 $ 3,200,000.00 $228,571.00 N/A N/A
Los Angeles Orange Line 14.2 $ 377,600,000.00 $25,000,000.00 7% 93%
Las Vegas MAX and SDX 19.0 $ 51,600,000.00 $ 2,715,789.47 82% 18%
Kansas City MAX - Main and Troost 12.0 $ 65,854,120.00 $ 5,487,843.33 63% 37%
Los Angeles Metro Rapid 400.0 $ 94,000,000.00 $ 235,000.00 77% 23%This sub-segment includes 1) municipal bond players, 2) private equity investors, and 3) sovereign
Investors wealth funds (SWFs). The analysis focuses on finance mechanisms associated with transportation
infrastructure projects in general, with potential relevance for BRT.
Investors Sub-segment Findings:
• Infrastructure funding in the United States is in crisis. The burden falls largely on state and local governments, which
traditionally access municipal bond markets for funding. However, state budget problems are making bond investments
less attractive and proposed policies to eliminate municipal bond tax benefits further threaten the market.7
• There is growing interest in innovative finance strategies and new funding sources, especially from investors and SWFs.8
• Public-private partnerships are important vehicles for channeling investment from investors and SWFs, but obstacles
remain in the United States, especially regulatory issues.8
• Attracting U.S. investment from SWFs will require major foreign policy initiatives at the national level.7
• Investment in infrastructure currently represents a very small portion of investor investment.8 BRT projects will face
additional hurdles in attracting investors.
1) Municipal Bond Market
Bonds are a traditional financing tool for governments securing financing for public projects. Key players:9
• Bond Buyers – commercial banks, mutual funds, insurance companies, and others
• Rating Agencies – Standard & Poor’s, Moody’s, and Fitch are the three main bond rating agencies in the municipal market
• Insurers – buy bonds and re-sell insured bonds, which are secured against default and have lower interest rates. Major
bond insurers are Municipal Bond Investors Assurance Corporation (MBIA Corporation), the Ambac Financial Group
(AMBAC), the Financial Guaranty Insurance Company (FGIC), and the Financial Security Assurance Inc. (FSA) Company
352) Private Equity
Investors
Interest is growing in the potential for private equity to help finance public infrastructure projects, though
it is not common for transit projects at present. Investors are interested in diversifying portfolios with the
long-term, stable assets associated with infrastructure.10
Page et al. characterize two types of investors: Strategic and Financial. Strategic investors are typically
value chain firms (e.g., A&E, construction) who invest equity in a project for the greater purpose of
supporting their industry. Financial investors are focused on direct financial returns.
Macquarie and Goldman Sachs are largest
Strategic vs. Financial Investors infrastructure investors
top investors in the infrastructure asset class, 2011
Strategic Financial
5-Yr Capital
Goal Benefits from project beyond Financial returns Rank Investor Name Creation total ($bn)
direct financial returns 1 Macquarie Group $31.83
2 Goldman Sachs $10.72
Players • Construction Investment banks 3 Canada Pension Plan Investment Board $9.97
• A&E Pension funds 4 Ferrovial $9.42
• Equipment suppliers (e.g., Private Equity 5 APG Asset Management $7.43
transit vehicles) Infrastructure Funds 6 Alinda Capital Partners $7.10
(PEIF)
7 Energy Capital Partners $7.04
Financial Wide range: large firms are Enormous new capacity, 8 Brookfield Asset Management $6.26
Capability capable (ample funds), smaller primarily through PEIFs; new
9 QIC $6.24
firms are less capable (few pension fund focus
10 La Caisse de dépôt et $5.92
funds) placement du Québec
Adapted from: Page et al., 2008, p.103 Adapted from: ULI, 2012, p. 58
36Investors Sovereign Wealth Funds • SWFs are state-owned investment funds composed of a country’s reserves to be used for investment purposes. • 56% of all SWFs currently invest in infrastructure, a 16% increase since 2011.11 • China has been particularly aggressive in investing in infrastructure investment in Africa and other parts of the world.8 • Abu Dhabi Investment Authority is one of the largest SWF infrastructure investors.11 • Because of its cash availability, SWFs can usually invest directly with concession teams, eliminating fees from financial institution intermediaries and reducing equity payouts to investors.8 37
This sub-segment encompasses major players in potential real estate development projects associated
  Real Estate      with BRT projects, including 1) REITs, 2) other large developers, and 3) major employers and
                   institutions.

Real Estate Sub-sector Findings:
• Fixed-guideway (rail) projects are often associated with an increase in economic development and real estate value, a
  benefit long assumed to result from a rail line’s “permanent” nature. However, recent experience with BRT suggests that
  a fixed guideway is not necessary to create a positive effect on real estate and economic activity.12,13
• Real estate development projects such as transit-oriented development or joint development require an intensive
  stakeholder management process that will involve local authorities, business owners, community organizations, and
  citizens, in addition to the real estate players.14
• To facilitate coordination, partnerships may form among stakeholders, such as commercial property owners (White Flint
  Partnership in Montgomery County, MD)15 or diverse community stakeholders (University Circle Inc. in Cleveland).16

1) Real Estate Investment Trusts (REITs)
REITs are publically traded companies that own and usually manage a portfolio of real estate property. Some REITs also
finance real estate projects.17 To qualify for tax benefits, a REIT must distribute at least 90% of its taxable income to its
shareholders.18 Major companies include: Simon Property Group, Vornado Realty Trust, ProLogis, and Equity Residential.17
2) Other Large Developers
Companies that own, develop, and manage properties. Large developers are involved in all phases of real estate
development – from planning and construction to leasing and property management. An example is Lerner Enterprises,
based in the DC metro area.19 Lerner is involved in the proposed Montgomery County, MD BRT via a coalition of other
developers.15
3) Major Employers and Institutions
Local employers and institutions, such as hospitals, universities, or museums located in or near a proposed or existing BRT
corridor. The Cleveland Clinic hospital and Cleveland State University were very influential institutional players in the
success of the Cleveland HealthLine BRT.14

  38
Innovative Finance Mechanisms
1) Value Capture – “Refers to circumstances in which the provision of a public service or facilities such as public transportation increases the market value of
surrounding real estate, and measures are enacted to capture some or all of that increase to defray public expense. Various mechanisms are used to capture either
the current or future value created by public investment” (CTS, 2009).
• Assessment Districts – Dedicated taxes from newly established district expected to rise in property value are used toward transportation project costs
• Tax Increment Financing District (TIF) – a TIF district is established for a set number of years; property taxes collected in excess of the baseline property
value (due to rising property values in the district) are used to pay for the public transportation project
• Special Assessment District – properties in the district are taxed or pay a fee in an amount that depends on the benefit the property receives from the
transportation project; the taxes/fees are used to pay for the public transportation projects
• Development – development investment by real estate interests around the public transportation infrastructure can help fund some transportation facilities (e.g.,
stations) or surrounding community development
• Joint Development – the coordinated development of a transportation facility (e.g., a transit station) and adjacent private real estate development;
usually a mechanism used to help fund the transportation facility
• Transit‐Oriented Development (TOD) – “compact, mixed‐use development near transit facilities and high‐quality walking environments” (USDOT, 2012)
• Air rights – development rights above or below an existing transportation facility
• Fees
• Development Impact Fees (DIFs) – charges collected from the developer to help pay for new infrastructure and services associated with the new
development; fees may be used for off‐site services such as schools or parks
• Exactions – similar to DIFs except they are usually contributions that can take the form of an in‐kind local road or other public good on‐site in the new
development, rather than a formulaic determined fee that can be applied to an off‐site infrastructure provision
• Transportation Utility Fees (TUFs) – based on the notion that transportation networks can be treated like utilities, such as water and wastewater
treatment, where fees are based on usage/demand (rather than property taxes); commercial and industrial properties would pay more because they
usually use transportation infrastructure more than their relative tax contributions
2) Public‐Private Partnership – arrangement between public and private sectors to acquire, build or maintain a public project (for variety of arrangements, see:
http://www.ncppp.org/howpart/ppptypes.shtml)
3) Naming Rights – fees paid for the rights to name a component of the transportation project, usually the transit line or station name
4) User/Market‐Based – mechanisms for collecting fees from drivers in a market‐based approach that seeks to discourage driving and support transit; some or all the
revenue would be dedicated to transit
• Tolling – fees paid to access a roadway
• Congestion pricing – charges for use of a roadway based on the level of congestion
• Emissions fees – charges based on air pollution emissions
• Vehicle miles traveled (VMT) – charges based on mileage drivenExamples of Innovative Finance in U.S. BRT
Innovative Finance Mechanisms BRT Examples
Value Capture Mechanisms
Assessment Districts
• Tax Increment Financing District (TIF) Chicago BRT (planned) – $7 million from new TIF district to match New Starts FTA grant14
• Special Assessment District
Development Cleveland HealthLine – attracted $4.2 billion in new real estate investment along the
• Joint Development corridor14,20
• Transit-Oriented Development (TOD)
• Air rights
Fees
• Development Impact Fees (DIFs) San Francisco Van Ness Avenue BRT (planned) – Proposed financial plan includes
• Exactions Development Impact Fees as a local funding source, and would contribute less than 4.4%
• Transportation Utility Fees (TUFs) of total project funding21
Public-Private Partnership (P3) Las Vegas RTC – RTC outsources all of the operations and maintenance for its fixed bus
(Alternative Project Delivery Methods) route services to private transit management firms.22
York Region, Ontario, Canada Viva BRT – In North America’s first transit P3 arrangement
of its kind, the transit agency partnered with the York Consortium (made up of 7 firms) to
execute the design, building, operation, and maintenance of the Viva BRT23
Naming Rights Cleveland HealthLine – sold naming rights of BRT system to the Cleveland Clinic and
University Hospitals for $250,000 annually over 25 years ($3.25 million total); revenue
will be used to help cover maintenance costs24
User/Market-Based Los Angeles Orange Line funding consisted almost entirely of non-federal funding sources
• Tolling (93.4%), some of which came from congestion pricing revenue (by charging for use of a
• Congestion pricing roadway based on the level of congestion)14,25
• Emissions fees
• Vehicle miles traveled (VMT)Firms in this industry do construction of BRT infrastructure, a function also sometimes performed by
Contractors large FSPs. Segment also includes involvement by legal and government affairs firms.
Industry Findings:
• Prime contractors are typically large national or international firms.
• Prime contractors also offer construction management and/or project management services.
• Prime contractors are also usually responsible for hiring and managing subcontractors.
• Since many subcontractors are local, the CGGC database lists only types of subcontractors, with some sample firms.
Subcontractor types include heavy construction, electrical, environmental, wrecking and excavating, landscaping, and
materials suppliers.
• Contractors working on FTA projects are required to furnish three types of bonds—bid bonds, payment bonds, and
performance bonds.
Characteristics of contractors in CGGC database:
• Average (Median) # locations:
No.•of Average
Firms (Median) # employees:
Annual Sales (in millions) No. of Employees No. of Locations (North America)
Procurement: Depends on project delivery method
Average Median Average Median Average Median
16 $4,595.6 $361.5 8,040 450 7.7 1
41Firms in this sub-segment provide transit management services for large fixed-route systems, ranging from a
Operation
few services (such as fleet maintenance) to comprehensive management of bus operations. Opportunities
exist for public-private partnerships with transit management companies, arrangements frequently found in
Latin America. Although outsourcing of operations is not common, it is growing in the United States. Denver
and San Diego partly outsource their operations, while Las Vegas has long hired contractors such as Veolia
Transportation to manage its entire fixed-route services. Veolia also manages the operations of some of the
biggest BRT systems in the world, such as TransMilenio in Bogotá, Colombia.26
Greener bus fleets that use less fuel and emit fewer emissions are a goal of many existing and planned BRT
Fuel
system operators because of the cost savings, environmental benefits, and green marketing opportunities.
About one-third of U.S. transit buses use an alternative source of power, with compressed natural gas (CNG)
buses representing the most common type of green bus.27 The United States already supports an extensive
network of natural gas pipelines and refueling stations.27 The CGGC database includes two major natural
gas fuel suppliers for transit agencies, Clean Energy Fuels Corp. and Trillium USA.
Firms in this sub-segment include those that provide ITS technology for bus fleet maintenance and
Maintenance
monitoring, as well as firms that provide parts, refurbishment, and major repair. The greatest maintenance
cost for agencies may be in the capital costs of bus maintenance facilities, which can cost millions of dollars
to build and are usually treated as major construction projects on their own, separate from the BRT project.
For example, construction of the Las Vegas RTC Sunset Maintenance facility alone cost $90 million.28 Typical
maintenance facility features include repair bays, fueling stations, bus wash, bus parking, offices, and
others.28 Facilities also offer opportunities to incorporate green building features. Many firms in the
Planning and Construction segments in the CGGC database also offer maintenance design/building
services.
Safety and In addition to firms that provide surveillance technology (addressed in this report under ITS), the database
Security includes one firm that provides security staff services, G4S Secure Solutions USA (formerly Wackenhut
Corporation), used by the Las Vegas transit system. Some firms in the Planning segment also provide safety
and security consulting services.
42You can also read