West Sussex Local Transformation Plan (2015-2021) Refresh 2019/20 Children and Young People's Mental Health and Emotional Wellbeing October 2019
←
→
Page content transcription
If your browser does not render page correctly, please read the page content below

West Sussex Local Transformation Plan
             (2015-2021)
          Refresh 2019/20
     Children and Young People’s
Mental Health and Emotional Wellbeing
            October 2019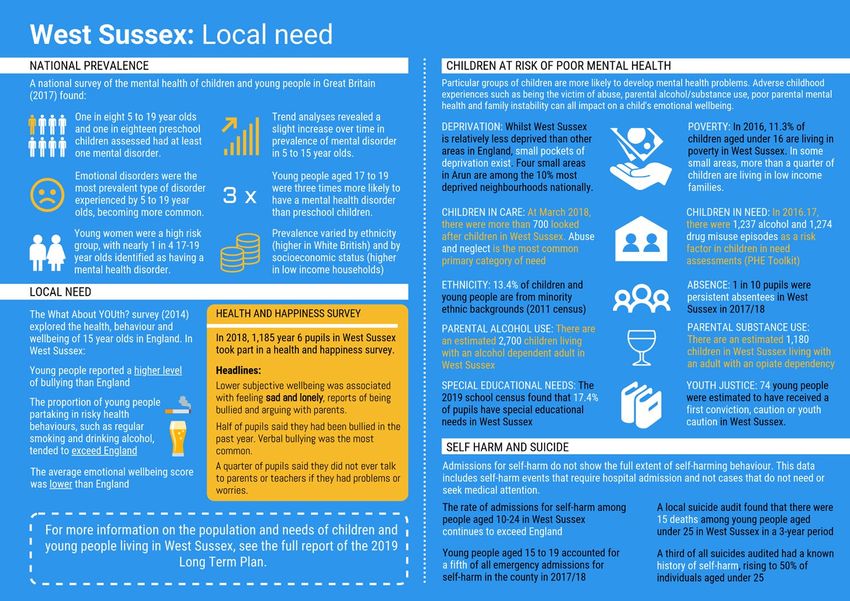
FORWARD

The transformation of children and young people’s emotional wellbeing and mental health services in West
Sussex is well underway. There have been a number of key achievements over the past four years,
particularly around investment and service redesign across Early Intervention and Prevention services.
These developments represent a strong foundation for moving forward with the next phase of
transformational change.

The three Clinical Commissioning Groups (Coastal West Sussex, Crawley, and Horsham and Mid Sussex
CCGs) in collaboration with West Sussex County Council (the Council) are taking an evidence based,
collaborative and integrated approach to developing their plans for commissioning the service and
pathways best suited to the needs of children, young people and their families . This collaboration is
enabled through the Section 75 arrangements between the CCGs and the Council which establishes an
aligned budget and lead commissioning arrangement. We also collaborate both across and outside of the
county, commissioning with colleagues across Kent, Surrey and Sussex where greater economies of scale
can enhance the quality of services, and on initiatives to support workforce transformation. Through this
approach we work together to build resilience, intervene early and improve access to ensure that we
deliver a whole system wide approach to transforming services across the county, in particular to the most
vulnerable.

The West Sussex Transformation Plan sets out our shared priorities for change and our commitment to
ensuring that this happens.

                                                                                                        2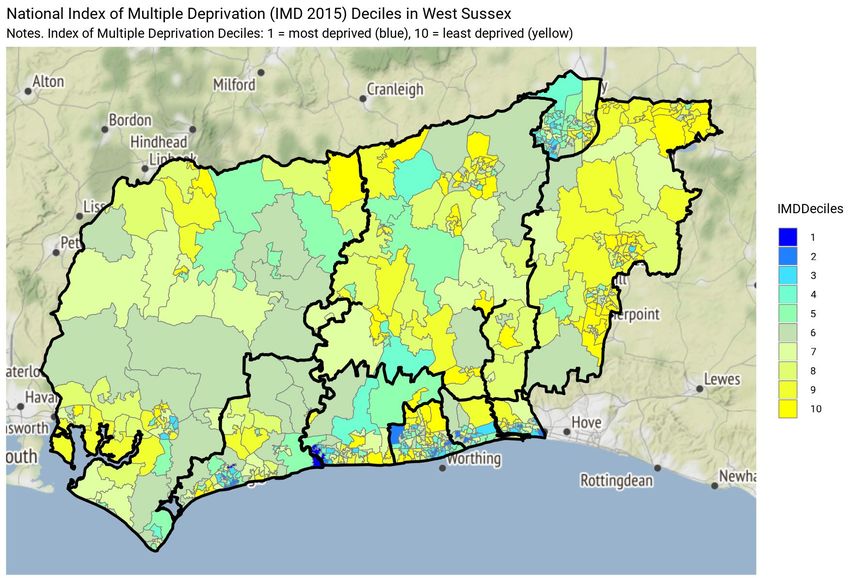
Contents
EXECUTIVE SUMMARY

1   INTRODUCTION .................................................................................................................. 6

2   BACKGROUND AND CONTEXT ........................................................................................... 7

3   CURRENT PROVISION IN WEST SUSSEX AND PROGRESS SO FAR .................................... 34

4   TRANSFORMATION FUTURE DELIVERY - PRIORITIES MOVING FORWARD...................... 51

5   FINANCIAL PLAN............................................................................................................... 67

6   ENABLERS TO DELIVERY – ACHIEVEMENTS AND AMBITIONS ......................................... 71

    -   Engagement with CYP and their families
    -   Communication
    -   Collaborative Commissioning

7   MANAGING RISK .............................................................................................................. 77

8   GOVERNANCE .................................................................................................................. 79

Appendix 1 - Commissioned Services in West Sussex
Appendix 2 - West Sussex CYP Outcomes Framework
Appendix 3 - West Sussex Health and Justice Pathway
Appendix 4 - Commissioned Services Workforce Breakdown
Appendix 5 – High Risk High Needs Strategic View (Separate document)
Appendix 6 - LTP Governance and Reporting Structure
Appendix 7 - TOR for Children and Young People’s Emotional Wellbeing and Mental Health
Partnership Board

Appendix 8 – Outline Workforce Strategy (Separate document)
Appendix 9 - Key Lines of Enquiry (KLOE) (Separate document)

                                                                                                                                        3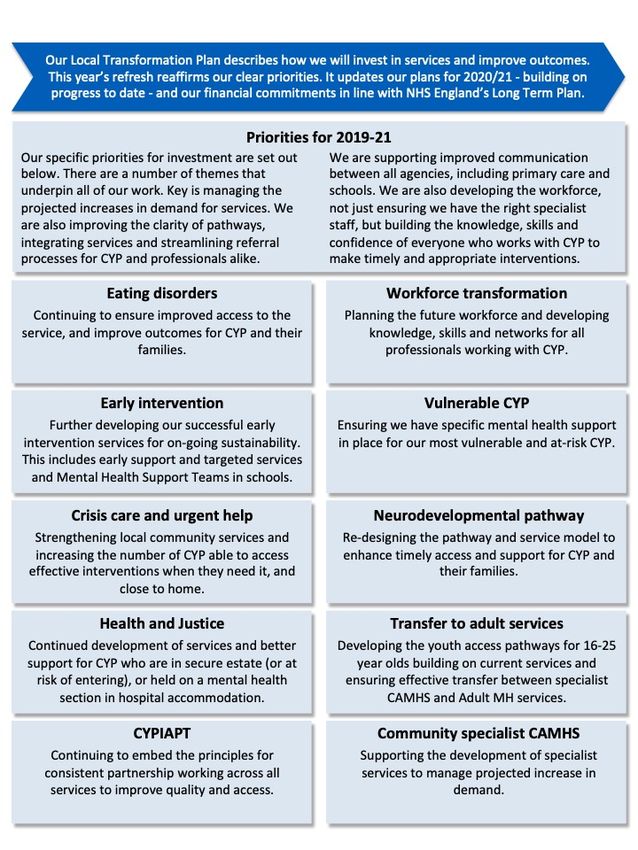
EXECUTIVE SUMMARY

                    4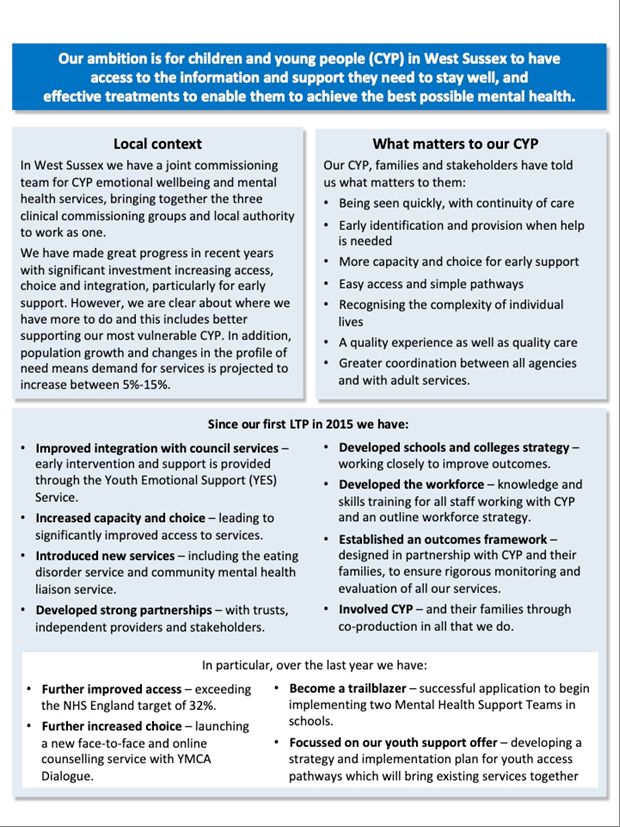
5
1       INTRODUCTION

The West Sussex Local Transformation Plan (LTP) outlines an integrated, multi-agency system-wide
approach which builds resilience, improves access to services and supports CYP along pathways of care
whatever their needs. By 2021, in collaboration with key partners, we will have achieved:

1.   Accessible, timely services in the community.
2.   Intervention and targeted services catching problems early.
3.   More capacity and greater choice along the continuum of need.
4.   A focus on outcomes, particularly for the most vulnerable.
5.   Fewer gaps between services, including improved transition between CYP and adult provision.
6.   A workforce with the skills required to deliver the services CYP tell us they want and need.

This report is structured as follows:

•    Background and context is contained in Section 2
•    The current provision of Services and progress so far is explained in Section 3
•    Our priorities for the future are outlined in Section 4
•    The financial plans that underpin the transformation are detailed in Section 5
•    The enablers to support delivery are described in Section 6
•    Governance and risks are explained in Sections 7 and 8

All Appendices are attached including our response to the Key Lines of Enquiry.

                                                                                                    6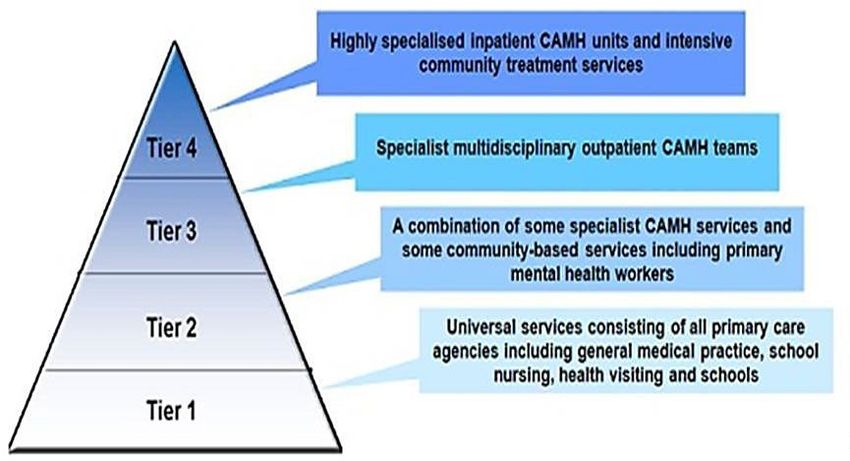
2       BACKGROUND AND CONTEXT

2.1     National policy context

National policy reflects the general consensus that the resilience and emotional wellbeing of CYP is facing
greater challenges than ever before. The publication of Future in Mind – promoting, protecting and
improving our children and young people’s mental health and wellbeing1 marked the start of a determined
effort to improve the services offered to CYP experiencing mental health and emotional wellbeing issues
through the development of LTPs.

This drive for transformation was reflected in The Five Year Forward View2 which highlights the need for
more extensive prevention, reduced inequalities between geographical areas and types of CYP, further
engagement of CYP, and strong clinical leadership to build new ways of working.

The publication of the NHS Long Term Plan this year has provided renewed and further commitment to
improving mental health support and services for CYP. The Long Term Plan builds on the work already
underway.

Specific aims in the Long Term Plan for children and young people’s mental health include:
        a) By 2023/24 an additional 345,000 children and young people 0-25 will access mental health
           support;
        b) Continue to achieve the access targets for eating disorder services as outlined in the FYFVMH;
        c) Ensure children experiencing a mental health crisis receive the response they need through
           mental health liaison teams in acute hospitals and a 24/7 response via NHS 111 with a robust
           community follow up support;
        d) Embedding mental health support in schools through the roll out of Trailblazers;
        e) Integrated approach across health and care, education and the voluntary sector, using the Thrive
           model, to develop a model of care for 0-25 year olds;

The work and progress to date within this local transformation programme provides a solid foundation,
and is underpinned by the priorities outlined in the Long Term Plan.

2.2     Local context

In this Section we explain our local context across three key areas: CCG, local authority relationships and
the STP agenda.

The three West Sussex CCGs (Coastal West Sussex, Crawley, and Horsham & Mid Sussex CCGs) have
supported the development of emotional well-being and CAMHS services well before the advent of the
LTP. CCGs have allocated additional Redesign Funds on an annual basis to commissions since April 2015
(see Section 6.1 for further detail). Our LTP refresh builds on the foundations and aspirations of the
previous 4 years and reflects the ongoing commitment of local commissioning organisations to improve
CYP mental health and emotional well-being services.

1
  NHS England Publication Gateway Ref. No 02939
2
  NHS England October 2014
3
  NHS England January 2019
                                                                                                          7
It is important to note in West Sussex, children’s emotional health and wellbeing services are jointly
planned and commissioned by WSCC and the three CCG’s and the team is integrated with NHS and Local
Authority employees. Working closely with the Council is particularly important in the Transforming Care
Programme (another key national driver for change). More specifically in recent years there have been a
number of requirements for the NHS and local authorities to review and improve the care for CYP with
complex learning disabilities (and/or autism, challenging behaviour and other mental health issues) as well
as those with mental health needs being treated in hospitals.

Our LTP remains a whole system approach and we are working locally with a range of services and other
agencies such as schools, colleges, children’s social care services, voluntary and community services and
primary care. Plans for these services have also gone through several versions and modifications. This plan
is our fourth LTP refresh and supersedes previous iterations. The LTP is subject to governance and
approval by the Health & Well Being Board, CCG Boards and our CYP Emotional Wellbeing and Mental
Health Partnership Board.

We have a strong track record of successful collaborative commissioning across Sussex and have
maximised opportunities to collaborate further with our commissioning colleagues in Brighton and Hove,
and East Sussex. Together with providers, we are already sharing approaches (and resources) across the
STP to ensure a sustainable system. This process is being formalised through the development of
Integrated Care Systems where mental health has already been identified as a priority area.

Sussex wide review of Emotional health and wellbeing services

To further support the transformation of CYP emotional wellbeing and mental health across Sussex, an
independent Sussex-wide review of emotional health and wellbeing support for children and young people
is currently underway. The review was prompted by recognition that the number of children and young
people needing help and support for their mental health and emotional wellbeing is growing. While staff
work hard to get children and young people the help and support they need, the system does not always
work as well as it should. Children, young people, their families and carers say that they wait too long for
an assessment or diagnosis, they do not know what services are available or they do not feel support is
forthcoming or proactive enough. This is something that the local health and social care bodies have
collectively agreed needs to change.

The NHS and local authorities across Sussex have jointly commissioned a review of emotional health and
wellbeing support for local children and young people between 0-18 and including transition to adulthood.
The review will give an up-to-date perspective about the way our system works in designing and delivering
emotional health and wellbeing services and support for children and young people. It will look at
evidence, insights and feedback from a wide variety of stakeholders – including clinicians and people who
work in services, children, young people and their families - to produce a report with recommendations for
how services and support can be improved.

The engagement period started in May 2019 and will run until the end of September 2019. Methods of
engagement include surveys for children and young people, parents and carers and health professionals,
                                                                                                          8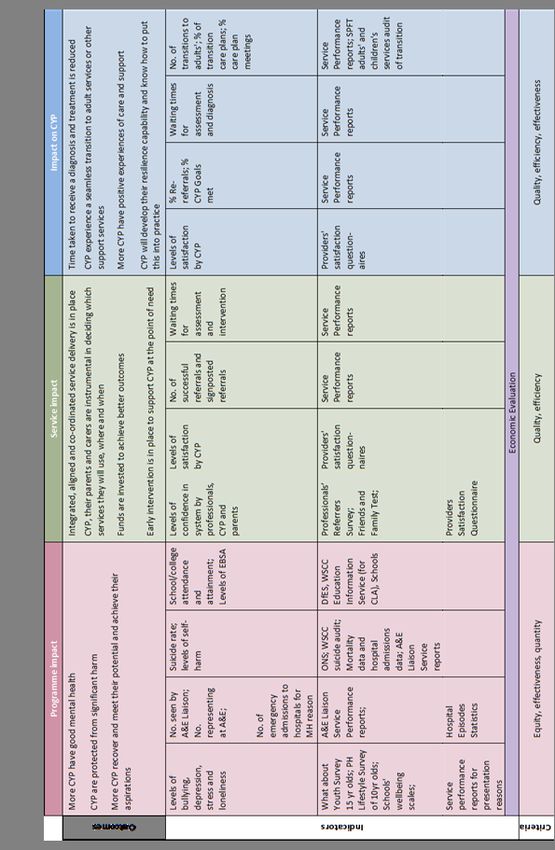
focus groups, face-to-face meetings, public events and service visits with patients, their advocates and
staff.

A report with recommendations for local commissioning and commissioned organisations will be published
in early 2020.

The key lines of enquiry are:
   • Personal experiences – listening to insights, views and feedback from children, young people and
       their families and carers and asking them what works well and what they think needs to change.
   • Access – how easy it is for people to get the services or support they need, when they need it. It
       also covers how easy it is for professionals such as family doctors and schools to refer people for
       specialist treatment and support.
   • Capacity – looking at whether there are enough services and support for the children and young
       people in our area who need them.
   • Funding and commissioning – looking at how health and care budgets are spent on emotional
       health and wellbeing support for children and young people and how that support is commissioned
       by the people who hold the budgets.
   • Effectiveness – looking at the quality of the services and support on offer, whether they do the job
       and if they need to be improved.
   • Relationships and partnership working – support and services can often involve different health and
       care bodies. We want to know how good these different teams are at talking to one another and
       how the way that care and support is joined-up around a person can be improved.

The findings from the review will inform our plans for 20/21 and beyond.

2.3    Understanding local need

Our understanding of need is based on several pieces of analysis conducted in the past few years. This
section aims to summarise our understanding of need, demand and capacity, as well as any gaps identified
that may impact on our future plan.

.

                                                                                                        9
10
Demographic profile

 West Sussex is a diverse community with approximately 230,700 children and young people aged under 25
 (26.9% of the total resident population 1 - Table 1).

 Table 1: Mid-year population estimates (2018) for children and young people aged 0 to 24 in West
 Sussex, by 5 year age bands

                        0 to 24
             All Ages                                                                             Total aged 0 to 24
                        0 to 4      5 to 9     10 to 14               15 to 19      20 to 24
Adur       63,869       3,601       3,956      3,494                  3,143         2,807         17,001          26.6%
Arun       159,827      7,732       8,696      7,821                  7,213         7,165         38,627          24.2%
Chichester 120,750      5,705       6,627      6,395                  6,042         6,551         31,320          25.9%
Crawley    112,448      8,006       8,294      7,118                  5,989         5,816         35,223          31.3%
Horsham 142,217         7,338       8,315      8,587                  7,734         6,013         37,987          26.7%
Mid Sussex 149,716      8,584       9,790      9,256                  8,061         6,187         41,878          28.0%
Worthing 110,025        5,855       6,494      6,133                  5,337         4,851         28,670          26.1%
West Sussex858,852      46,821      52,172     48,804                 43,519        39,390        230,706         26.9%
South East 9,133,625 527,245        579,842    547,098                513,034       538,488       2,705,707       29.6%
England    55,977,178 3,346,727 3,523,866 3,274,119                   3,096,575     3,512,654     16,753,941      29.9%
 Source: ONS – mid-year population estimates 2018

 Recent population projections by the ONS 2 suggest that if current trends continue, the total size of the
 population of children and young people aged 0-24 will see a small increase in the coming years in West
 Sussex (Figure 1). This is expected to be driven by growth in the population size of children aged 10-14
 (+18.1%) and young people aged 15-19 (+14.8%).

 Figure 1: Projected change in population of CYP (aged 0 to 24) in West Sussex from mid-2016 to mid-
 2026

 Source: ONS – subnational population projections (2016 base)

 1 Office for National Statistics: Mid-2018 Estimates of the population for the UK, England and Wales, Scotland and Northern
 Ireland
 2 ONS: subnational population projections 2016. Population projections examine current trends in births, deaths and
 migration (in the previous 5-years), and project these forward. Population projections are not predictions and do not take
 into account changes in policy/government etc.

                                                                                                                          11
Deprivation and poverty
Whilst West Sussex is relatively less deprived than other areas of England (ranked 21st least deprived
upper-tier local authority), small pockets of deprivation do exist. In 2015, four small neighbourhoods in
Arun were among the 10% most deprived areas in England, and a further 44 neighbourhoods in the county
are among the 30% most deprived nationally. This equates to 9.5% of small areas in West Sussex that are
among the 30% most deprived nationally. Of the district and boroughs, Adur remains the most deprived,
followed by Crawley, Arun and Worthing. Mid Sussex remains the least deprived in West Sussex.
Source: Office for National Statistics: Open Geography; MHCLG: Index of Multiple Deprivation 2015
In 2016, the overall proportion of children (aged under 16) living in low income families in West Sussex was
11.3% 3. This equates to nearly 16,000 children in the county. Nationally, 17.0% of under 16s are estimated
to be living in poverty. Child poverty varies across West Sussex with the highest proportion seen in Crawley
(14.9% - equating to nearly 3,500 children), and the lowest in Mid Sussex (7.2%). Whilst all district and
boroughs within West Sussex fall below the national estimate, there is considerable variation at small
areas. For example, more than a quarter of children under the age of 16 are living in poverty in some small
areas within Arun and Crawley.
3 Children in low income families local measure: 2016 snapshot as at 31st August 2016. LSOA data South East. HMRC
12Ethnicity
Some groups are more likely to experience unfavourable social, economic and environmental
circumstances. People from black and minority ethnic groups have an increased risk of developing mental
health problems4.
In West Sussex, 13.4% of children and young people (aged under 18) are from minority ethnic
backgrounds5,6. This is a smaller proportion compared with the national average (25.5%). The largest
minority ethnic group in West Sussex are from Asian/Asian British communities (4.5% of under 18s). The
proportion of children and young people from minority ethnic groups varies across the county. Of the local
authorities within the county, Crawley has the greatest proportion of under 18s who are from a minority
ethnic group (32.4%).
SEND
In West Sussex 81.3%, of school aged pupils with identified SEND will have their needs met at school
through resources and support that are ordinarily available to the school’s national SEND budget. This is
called School Support. West Sussex has 17,036 pupils in their schools recorded as being on School Support.
Currently 3.2% of the school population in West Sussex will require an EHC Plan to enable additional
support not ordinarily available to them to be provided through the EHC Plan. In West Sussex we have a
slightly higher proportion of pupils with EHC Plans when compared with the national picture (3.1% for
England). There are just over 5,000 West Sussex pupils with EHCPs. The most commonly identified key
need for an EHCP in West Sussex is for primary needs in the area of ‘communication and interaction’.
National and local prevalence
Major national surveys remain the best source of evidence on the prevalence of mental health disorders
among children and young people7.
National survey of mental health of children and young people in England (2004 and 2017)
In 2004, ONS conducted a national survey8 to estimate the prevalence of mental health conditions in
children aged 5-16. Public Health England 9 has applied the survey results to local populations taking into
account age, sex and socio-economic classification. In 2015, 8.4% of children and young people aged 5-16
were estimated to have a mental health condition in West Sussex. This equates to around 9,500 children
(Table 2). Since there is evidence to suggest that prevalence of mental health conditions among children
and young people has increased, it is possible that this represents an underestimate.
4 PHE: Better mental health: JSNA toolkit: Understanding people.
5 Defined as any ethnic background other than White English/Welsh/Scottish/Northern Irish/British.
6 NOMIS: 2011 Census (Detailed Characteristics 2101EW – Ethnic group by sex and age)
7National surveys may hide variation across small areas which are likely to differ by local level characteristics such as
demographics (e.g. age, sex, ethnicity), deprivation, service availability etc.
8 NHS Digital: Mental health of children and young people in Great Britain (2004)
9 As part of the PHE CYP mental health and wellbeing profile (Fingertips)
13Table 2: Estimates from the 2004 Survey:
Estimated prevalence among CYP (aged 5 to 16) of: Estimated count*
Mental health disorders: 8.4% 9,490
Emotional disorders: 3.2% 3,655
Conduct disorders: 5.0% 5,635
Hyperkinetic disorders: 1.3% 1,515
Note. Prevalence and count adjusted by age, sex and socioeconomic status of local area. * estimated counts rounded to nearest
5. Counts are based on the 2015 mid-year population estimate by the ONS.
Source: PHE Children and Young People’s Mental Health and Wellbeing Profile
The 2004 survey has now been updated with a new series of data collection completed in 2017 10. NHS
Digital released the findings from this survey in 2019. This goes beyond the 2004 survey, providing
estimates of the prevalence of mental health disorder in 2 to 4 year olds, and spans the transition into
adulthood covered by 17 to 19 year olds. The main findings from the 2017 survey include:
• One in eight (12.8%) 5 to 19 year olds and one in eighteen (5.5%) preschool children assessed had
at least one mental disorder
• Rates of mental health disorders increased with age. Young people aged 17 to 19 were three times
more likely to have a mental health disorder (16.9%) than preschool children aged 2 to 4 (5.5%),
although data collection methods varied by age
• Young women were identified as a high risk group in relation to mental health, with nearly one in
four (23.9%) 17 to 19 year old girls identified as having a mental disorder
• Prevalence of mental health disorders also varied by ethnicity (higher in White British children) and
by socio-economic status (higher among children living in lower income households)
• Emotional disorders were the most prevalent type of disorder experienced by 5 to 19 year olds in
2017 (8.1%). Behavioural disorders were the most prevalent (2.5%) for preschool children
• Trend analyses revealed a slight increase over time in the prevalence of mental health disorder in 5
to 15 year olds
• Emotional disorders have become more common in 5 to 15 year-olds, whilst prevalence of other
mental health disorders have remained similar over time
• Most children with a disorder who had used professional services tended to view them as helpful.
Primary care was the service most likely to be rated as unhelpful; 17.0% of 5 to 19 year olds with a
disorder who had contact with a primary care professional due to worries about mental health
described the contact as unhelpful or very unhelpful.
10 NHS Digital: The Mental Health of Children and Young People in England, 2017 survey
14Table 3 presents the national prevalence estimates from the 2017 survey. These have been applied to the population of 5 to 19 year olds in West Sussex to
provide an estimate of local need.
Table 3: National prevalence of mental disorders in 5 to 15 year olds applied to local population in West Sussex
5 to 10 year olds 11 to 16 year olds 17 to 19 year olds All
Mental disorders Males Females Total Males Females Total Males Females Total Males Females Total
%N % N % N %N % N % N %N % N % N %N % N % N
Any disorder 12.23,6906.61,8609.55,5501 4.34,05014.43,77014.47,83010.31,47023.93,11016.94,61012.69,19012.98,74012.817,930
Emotional disorders 4.6 1,3803.61,0204.12,4007.1 2,00010.92,8509.0 4,8807.9 1,12022.42,92014.94,0706.2 4,49010.06,7808.1 11,300
Behavioural disorders 6.7 2,0103.2910 5.02,9207.4 2,1005.0 1,3106.2 3,4001.0 150 0.5 70 0.8 220 5.8 4,2503.4 2,2804.6 6,500
Other less common disorders3.4 1,0101.0270 2.21,2802.4 680 2.0 520 2.2 1,1901.4 190 2.2 290 1.8 490 2.6 1,8901.6 1,0702.1 2,960
Source: Mental Health of Children and Young People Survey, NHS Digital; Mid-year population estimates 2018, ONS
Note. These counts are estimates. These apply the national prevalence from the 2017 survey to the West Sussex CYP population (mid-2018 population
estimate). These estimates are included in the absence of an alternative approach. They should be interpreted with caution and consideration of local data
and intelligence, which may generate better estimates of true local prevalence.
The 2017 survey provides prevalence estimates for specific mental health conditions within different groups (age, sex, ethnicity, socio-economic status,
special educational needs etc.), explored behaviours associated with mental health (risky health behaviours, absence/exclusion, social media use, social and
family context), as well as views on engagement with professional services and treatment. For more information see the full reports.
15What about YOUth? (2014)
In addition to the 2004 and 2017 surveys, the What About YOUth survey 11 (2014) focussed on
the health, behaviour and wellbeing of 15 year olds in England. The data 12 showed that 59.0% of
those surveyed in West Sussex reported being bullied in the past couple of months - significantly
higher than England (55.0%). The average WEMWBS score (a set of questions on emotional
wellbeing) of 15 year olds was 46.8 in West Sussex, significantly lower than the national average
of 47.6. Proportions of 15 year olds reporting risky health behaviours (such as regular alcohol
consumption, trying cannabis, and regular smokers) also tended to exceed national averages.
West Sussex Health and Wellbeing Survey (2017/18)
Locally, the Public Health and Social Research Unit has recently (Spring 2018) completed a health
and wellbeing survey 13 of year 6 pupils attending schools within the county. A total of 1,185
pupils from 39 schools took part (representing around 13.4% of the total year 6 population in
West Sussex). Key findings from the survey include:
•Lower subjective wellbeing 14 was associated with feeling sad and lonely, as well as a
greater likelihood to report being bullied and arguing with parents
• Self-reported level of physical activity was associated with a range of positive aspects.
For example, being “very active” was positively associated with self-reported happiness
and life satisfaction
• Half of pupils reported that they had been bullied in the past year. Verbal bullying
(someone said something hurtful) was the most commonly reported. Girls were more
likely to report being bullied than boys
• 13.5% of pupils reported feeling lonely and 16.1% reported feeling sad often
• A quarter of pupils said they did not ever talk to their parents or teachers if they had
problems or worries
• 50% of pupils said they did something that gave them a sense of achievement often or
very often
• 43.5% of pupils said that they had tried an alcoholic drink
• Two-thirds of girls and half of boys surveyed reported having a social networking account
(such as Facebook, Whatsapp, Instagram, Twitter or Snapchat)
A needs assessment (which included a wide range of user consultation and the mapping of
current services) was undertaken in 2014 and provided a comprehensive view of local provision,
11NHS Digital: Health and Wellbeing of 15-year olds in England – Main findings from the What About YOUth?
Survey 2014
12Data can be easily explored on the Public Health England Fingertips website – Child and Maternal Health
Profile
13 Public Health and Social Research Unit: Health and Happiness Survey of Year 6 Children (2018)
14 Measured using the Cantril Ladder
16need and gaps15. In addition to analysis of national and local datasets, the views of CYP, their
families and stakeholders were sought and were integrated into the priorities highlighted in the
original LTP.
Expected prevalence by CAMHS tier for West Sussex
Mental health services are often described in terms of tiers, where services become more
specialised, from emotional wellbeing services at Tier 1 to highly specialist outpatient teams and
inpatient provision at Tier 4.
Prevalence estimates (population aged 17 and under) based on findings published in “Treating
Children Well” 16 are shown below against each of the tiers. These provide an estimate of West
Sussex CYP who may at any one time, need a service response or support.
Figure 2: Estimated number of children and young people by service tier (prevalence estimates applied
to 2018 mid-year population)
Estimated number of children in West
Prevalence assumption
Sussex (rounded to nearest 5)*
Tier 4 0.075% 130
Tier 3 1.85% 3,230
Tier 2 7.00% 12,225
Tier 1 15.00% 26,200
* Based on 2018 mid-year population estimates. Counts rounded to nearest 5.
Suicide prevention, self-harm and mental health admissions
A West Sussex Suicide Prevention Strategy (2017-2020)17 has been completed and supports both
the cross-Government National Suicide Prevention Strategy (2012) and the Five Year Forward
15Public Health and Social Research Unit: West Sussex Mental Health Needs Assessment: Children and Young
People (June 2014)
16Kurtz, Z. (1996) Treating children well: a guide to using the evidence base in commissioning and managing
services for the mental health of children and young people. London. Mental Health Foundation.
17View (which states the ambition is to reduce the number of people taking their own lives by 10%
nationally by 2020-21 compared to 2016-17). The strategy identifies key priorities including
increasing confidence and skills of the workforce who support CYP at risk of suicide.
In addition, a recent local audit of suicide and assessment of self-harm admissions found that:
•West Sussex has had a consistently higher rate of self-harm admissions among children
and young people (aged 10-24) than England for a number of years, In 2017/18, there
were 685 admissions for self-harm among children and young people (aged 10-24) in
West Sussex – a directly standardised rate of 535.9 per 100,000. 80% of these admissions
were female (approx. 550 of the 685 admissions).
• Self-harm is more common among young people and often manifests during
adolescence; locally, a fifth of all emergency hospital admissions for self-harm were
among young people aged 15-19 (2017/18 data)
• The West Sussex suicide audit 18 revealed that a third (34%) of individuals had a known
history of self-harm, rising to 50% in those aged under 25 years
• During a three-year period (2013-15) there were less than 5 deaths recorded among
under-18’s and fifteen deaths in under-25’s (7.0% of total)
• In West Sussex, males were more likely to take their own lives at an earlier age, with two
fifths (41.6%) of male suicides among men under the age of 45 (compared to 26.9% of
women)
• In general, a lower proportion of suicides involve adults aged under 45 in West Sussex
compared to England.
Figure 3 highlights the significant proportion of self-harm admissions accounted for by young
people aged 15 to 19 in West Sussex. This data shows only those self-harm events that are
severe enough to warrant hospital admission and does not reflect the true burden of self-harm
on the health and wellbeing of young people in West Sussex.
Figure 3: Proportion of emergency admissions for self-harm in West Sussex by 5-year age
group and sex (2017/18)
17 Public Health and Social Research Unit: West Sussex Suicide Prevention Strategy
18 Public Health and Social Research Unit: West Sussex Suicides Audit 2013-2015
18Note. * indicates where data has been suppressed due to small counts (five or fewer). Data reflects admissions, not
individuals; the same individual may have been admitted to hospital on multiple occasions within the reporting
period.
19Recommendations from a rapid needs analysis of self-harm in West Sussex (completed in 2019)
include:
• Establish a multi-agency self-harm oversight group, as a sub-group of the West Sussex
suicide prevention steering group
• Continue the joined up and strategic approach to children and young people’s mental
and emotional health and wellbeing in educational settings
• Commission focussed rapid research/data gathering on community self-harm activity (i.e.
which does not result in emergency admission), including in educational settings
• Deliver a systematic programme to increase skills and awareness amongst relevant
professional groups
• Ensure that when targeting interventions for self-harm prevention, data for deprivation is
used to identify where those most at risk groups are
• Set out a plan for working with acute trust partners to assess the quality and
coordination of secondary care to prevent readmission
• Establish an agreed West Sussex pathway to support people through bereavement – for
end of life and planned/expected deaths as well as suicide/ sudden and unexpected
death
• Deliver a campaign focussed on messaging and interventions promoting middle aged
men’s mental and emotional health and wellbeing
• Establish what additional support is available for LGBTQI people’s emotional and mental
health and wellbeing and identify gaps, partnership working and training opportunities
• Develop a plan for working with CCGs, SPFT and community pharmacists as well as
parents/families to identify opportunities for reducing incidences of self-poisoning
• Strategic activity around safe internet use in the county to explicitly support self-harm
prevention, through the new self-harm prevention Programme Manager role
• Assess optimal digital approaches supporting self-harm prevention interventions
• Develop a plan to work with CVS organisations who work with high risk groups, to
develop nuanced and suitable messages around self-harm and good mental health.
Hospital admissions for mental health conditions
During 2017/18, there were 138 inpatient admissions of children and young people (aged under
18) for mental health conditions in West Sussex19. This does not differ significantly from England
(79.6 per 100,000 population in West Sussex compared with 84.7 per 100,000 nationally).
19 NHS Digital – Hospital Episode Statistics (reproduced in Fingertips)
20Children at risk of poorer mental health
Particular groups of children are more likely to develop mental health problems 20. Factors
such as a child’s gender, socio-economic status, ethnicity, sexual orientation, involvement with
children’s social care, long-term health problems and disability can all impact on emotional
and mental wellbeing.
The following section presents national and local level data on factors that may be associated
with emotional and mental health during childhood. It is important that these are not
considered in isolation, as evidence suggests that cumulative exposure to negative
experiences/factors (such as ACEs) can further increase likelihood of adverse mental health.
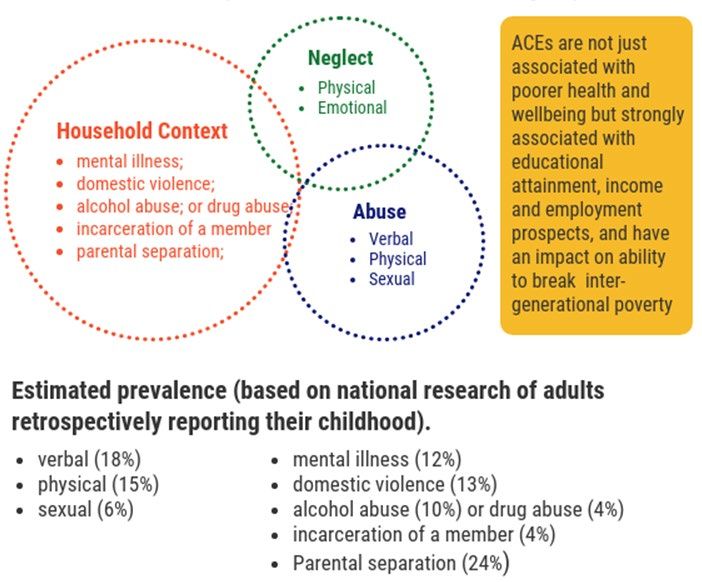
Adverse childhood experiences
Childhood experiences can also affect a child’s current and future mental health. Adverse
childhood events (ACEs), such as being the victim of physical, emotional or sexual abuse,
parental separation, parental alcohol/substance misuse and parental mental health can affect
emotional wellbeing. ACEs have been shown to have an enduring effect on individuals. Broadly
these are summarised into three groups: household context, neglect and abuse (Figure 4). Local
level data on ACEs is limited, with national research providing the best picture currently.
Figure 4: Adverse childhood experiences
20 PHE: Better Mental Health: JSNA Toolkit.
21Special educational needs 21
People with physical and learning difficulties may be more likely to experience adversity (such as
inconsistent living arrangements and employment, poor access to services etc.), which may
contribute to poorer mental health.
The 2019 school census found that 17.4% of pupils22 had special educational needs in West
Sussex (Table 4). This includes pupils with SEN support (approx. 14.2% of pupils) or a
statement/Education Health and Care (EHC) Plan (approx. 3.2%).
Table 4: Number and percentage of pupils with special educational needs in West Sussex, the
South East and England (based on where the pupil attends school) - school census January
2019
All schools
Pupils with statements or
Areas Pupils on SEN support Total pupils with SEN
Total Pupils EHC plans
Number % Number % Number %
West Sussex 125,621 4,031 3.2 17,783 14.2 21,814 17.4
SOUTH EAST 1,433,118 46,781 3.3 166,386 11.6 213,167 14.9
ENGLAND 8,819,289 271,165 3.1 1,047,163 11.9 1,318,328 14.9
Source: Special Educational Needs in England: January 2019
Of those pupils with special educational needs, the most common primary type of need was:
- Speech, language and communication needs (32.9%; 3,178 pupils) among primary school
pupils
- Specific learning difficulty (28.9%; 2,187 pupils) among secondary school pupils
- Autistic spectrum disorder (24.9%; 464 pupils) among special school pupils
Of pupils with special education needs, social, emotional and mental health was a primary need
for 15.8% of primary school pupils (2.3% of all pupils with and without SEN), 15.5% of secondary
school pupils (2.5% of all pupils with and without SEN) and 11.0% of special school pupils (Table
5).
Table 5: Number and percentage of pupils with SEN who have a primary type of need of social,
emotional and mental health in West Sussex, the South East and England – school census
January 2019
Primary schools Secondary schools Special schools
Number % Total with SEN Number % Total with SEN Number % Total with SEN
West Sussex 1,521 15.8 9,653 1,175 15.5 7,574 205 11.0 1,865
SOUTH EAST 17,307 17.4 99,643 12,376 19.4 63,939 2,790 12.8 21,840
ENGLAND 108,97916.3 670,111 81,223 19.6 413,787 15,891 12.8 124,282
Source: Special Educational Needs in England: January 2019
Special Education Needs in England: January 2019. Department for Education
21
22 This count is from the DfE special educational needs LA level tables. This includes all academies including
free schools, state-funded and non-maintained special schools, middle schools as deemed, all-through schools,
city technology colleges, university technology colleges, studio schools, direct grant nursery schools, pupil
referral units and general hospital schools.
22Autism spectrum conditions
Autistic people are more likely to experience mental health problems. In the 2019 school census,
there were 1,317 school pupils with special educational needs who had a primary need of autism
spectrum conditions in West Sussex.
A major survey 23 of the mental health of children and young people identified autism spectrum
conditions in 1.2% of 5 to 19 year olds. Due to the small number of cases identified in this
sample and the sampling method used (such as self-report only for 17-19 year olds), it is possible
that this reflects an underestimate. Applying this prevalence estimate to the local population of
5 to 19 year olds in West Sussex suggests that there are around 1,700 autistic children and
young people in the county.
Absence and exclusions
Mental health problems among children may contribute to recurrent absence from school.
Absence
The Department for Education monitors pupil 24 absence levels using two key measures:
1. Overall absence rate - aggregated total of all authorised and unauthorised absences
2. Persistence absence rate – where a pupil’s overall absence equates to 10% or more of
their possible sessions
In 2017/18, the overall absence rate for pupils attending state-funded schools in West Sussex
was 4.8% 25. This does not differ significantly from England (4.8%). Of the local authorities within
West Sussex, Arun had the highest rate of overall absence (5.2%) - significantly higher than
England.
In 2017/18, 10.8% of pupil enrolments in West Sussex were classed as persistent absentees
(missing 10% or more of possible sessions - Table 6). Across the local authorities, Arun (12.2%)
and Crawley (11.9%) had the highest rates of persistent absentees in 2017/18. Persistent
absence is generally higher among pupils eligible for free school meals, those with special
educational needs (particularly those with an EHC plan) and those from some ethnic minority
groups (such as children from traveller communities, although counts tend to be small).
23 NHS Digital: The Mental Health of Children and Young People in England, 2017 survey
24 Defined as pupils of compulsory school age (i.e. between 5 and 15 years of age as at the start of the academic
year)
25Note that this data relates to pupil residence rather than location of the school and may therefore differ from
other published estimates.
23Table 6: Number and proportion of persistent absentees (missing 10% or more possible
sessions) in West Sussex, the South East and England (2017/18)
Primary, secondary and special schools
Number of
Area Number of
persistent % LCI UCI
enrolments
absentees
Adur 6,694 715 10.7 10.0 11.4
Arun 16,149 1,970 12.2 11.7 12.7
Chichester 12,884 1,518 11.8 11.2 12.4
Crawley 16,319 1,942 11.9 11.4 12.4
Horsham 16,556 1,516 9.2 8.7 9.6
Mid Sussex 18,392 1,759 9.6 9.1 10.0
Worthing 13,958 1,517 10.9 10.4 11.4
West Sussex 100,952 10,937 10.8 10.6 11.0
South East 1,105,858 119,564 10.8 10.8 10.9
England 7,015,051 783,424 11.2 11.1 11.2
Source: DfE – Pupil absence in schools in England: 2017 to 2018
Exclusions
Permanent exclusions refer to pupils who are excluded from school and will not return to the
same school. There were 123 permanent exclusions from state-funded primary, secondary and
special schools in West Sussex in 2016/17. The overall rate of permanent exclusions in West
Sussex was 0.11%. Nationally, the rate of permanent exclusions was 0.10%. The most common
reasons for permanent exclusion in West Sussex were persistent disruptive behaviour (41% of
permanent exclusions), and physical assault against a pupil (21% of permanent exclusions).
Fixed period exclusions refer to pupils who are excluded from a school for a fixed period of time.
This can involve part of the school day and does not have to be for a continuous period. A pupil
may be excluded for one or more fixed periods up to a maximum of 45 school days in one
academic year (and includes exclusions from previous schools). Unless otherwise specified, this
data reports the number of fixed period exclusions rather than the number of pupils who have
received one (or more) fixed period exclusion in the academic year.
In 2016/17, there were 4,258 fixed period exclusions across state-funded primary, secondary
and special schools in West Sussex; a rate of 3.83% of pupil enrolments. Nationally, the rate of
fixed period exclusions was 4.76% of pupil enrolments. The 4,258 fixed period exclusions in West
Sussex were accounted for by 2,080 pupil enrolments (i.e. 2,080 pupils had one or more fixed
period exclusions in 2016/17).
For primary school pupils, there were 951 fixed period exclusions in West Sussex in 2016/17;
1.49% of pupil enrolments. This is significantly higher than England (1.37% of pupil enrolments)
and appears to be increasing over time (0.80% in 2012/13). For secondary school pupils, there
24were 3,123 fixed period exclusions in West Sussex, 6.86% of pupil enrolments. Whilst this is
significantly lower than England (9.4% of pupil enrolments), the rate of fixed period exclusions of
secondary school pupils in West Sussex has increased every year since 2013/14 (2013/14: 2,121
fixed period exclusions; 4.8% of pupil enrolments).
Similarly to permanent exclusions, the most common reasons for fixed period exclusions were
persistent disruptive behaviour (29% of fixed period exclusions), physical assault against a pupil
(20%), and verbal abuse or threatening behaviour against an adult (19%).
Youth Justice
Children and young people at risk of offending often have greater health needs than other young
people. In 2018, 74 young people (aged 10-17) were estimated to have received their first
conviction, caution or youth caution in West Sussex 26. This equates to a rate of 99.7 per 100,000
population, significantly lower than England. This rate has fallen overtime.
Children in need
A child in need is defined as a child who is unlikely to reach or maintain a satisfactory level of
health or development, or their health or development will be significantly impaired without the
provision of services, or the child is disabled. In West Sussex, there were 7,233 children in need
episodes at 31st March 2018 27.
In 2017/18, 7,541 of the 10,004 assessments (75.4%) carried out in West Sussex had factors
identified that contributed to the child being in need 28. It is important to note that more than
one factor can be identified and recorded at assessment. Domestic violence was the most
common factor identified at end of assessment for children in need (61.5% - 4,641 assessments
with factor information). This was followed by mental health (a factor in 44.8% of assessments
with factor information).
Children who are looked after
Children who have become looked after and care leavers are more likely to have negative life
experiences that result in poorer outcomes (such as lower educational attainment, poorer
employment prospects, increased likelihood of being engaged with justice system). Statistics on
children looked after regularly reported by the Department for Education.
At March 2018, the number of children looked after by local authorities in England increased, up
4% from 2017, continuing increases seen in recent years. The rate of looked after children in
West Sussex was 41 per 10,000 children at 31st March 2018 (704 children), a small rise from 39
per 10,000 children at March 31st 2017 (663 children – see Table 7, Figure 5).
26 PHE: Fingertips – Indicator 10401 – First time entrants to the youth justice system
27 DfE – Characteristics of children in need: 2017 to 2018
28The quality of data identified and recorded at assessment may be less robust than other data returned in this
collection. This data is based on the opinion of the social worker assessing the case and may be volatile to
change, Care should be taken when drawing comparisons using this information, particularly at local level.
25The Public Health and Social Research Unit have recently completed a Children Looked After
needs assessment (2017)29. This piece of work revealed:
- The rate of looked after children for West Sussex has been consistently below that for
England
- The rate for England and West Sussex has remained fairly constant between 2013 and
2017
- Compared with England, the profile of looked after children in West Sussex is older, with
a similar proportion of those aged under 4 and a smaller proportion of those aged 5 to 9
years
- Locally, there has been a steady increase in unaccompanied asylum seeking children
between 2012 and 2015, and a marked rise from 2016 (particularly among those aged
16+)
- The changing age and sex profile of the county’s looked after children may be due to the
rising number of unaccompanied asylum-seeking children, who tend to be older and
more ethnically diverse.
Table 7: Children looked after at 31st March in West Sussex, the South East and England (2014
to 2018)
2014 2015 2016 2017 2018
West 602 36 644 38 639 37 663 39 704 41
Sussex
South East 8,950 47 9,310 49 9,870 51 9,830 51 10,000 51
England 68,810 60 69,470 60 70,400 60 72,590 62 75,420 64
Source: Local authority tables: children looked after in England including adoption 2017 to 2018
Figure 5: Rate of children looked after at 31st March (per 10,000 children aged under 18) during
2014 to 2018 in West Sussex, the South East and England
29 Public Health and Social Research Unit: Children Looked After Needs Assessment 2017
26Table 8 30 reveals that the primary category of need for children looked after in West Sussex is
dominated by abuse and neglect (which we know has a significant and enduring impact on
emotional wellbeing and mental health).
Table 8: Number of children who started to be looked after during the year ending 31st March
2011 to 2018 by category of need in West Sussex
Children who started to be looked after in the year ending 31st March
Category
2011 2012 2013 2014 2015 2016 2017 2018
Absent parenting 55 35 40 45 65 90 95 70
Abuse or neglect 175 155 195 150 185 180 195 235
Child's disabilityFigure 6: Proportion of children who started to be looked after in the year ending 31st March
by category of need (2011 to 2018), West Sussex
The Insight team at West Sussex County Council has undertaken demand projections for
Children’s Social Care, to 2022/23; this includes projections of the number of children who will
be looked after. These analyses suggest that the number of CLA is projected to increase by 5.2%
by March 2023 from our current total (734 CLA at end of June 2019 to closer to 775 by March
2023 – a projected increase of around 40 children).
A four year forecast model was developed to project numbers of CLA up to 2022/23 and their
associated costs. The model has been updated in July 2019. Our current total of 734 looked after
children (June 2019) is above the maximum estimated from the 2016 model and is slightly above
projections from 2017.
Permanence – Adoption in West Sussex
The proportion of looked after children who have been adopted (during the year) is generally
slightly lower in West Sussex than the South East and England (Figure 4) 31. In 2018, 35 children
were adopted in West Sussex. Around 30-50 children are adopted each year in West Sussex.
31
DfE: Children looked after in England including adoption (underlying data 2010 to 2018)
28Figure 7: The proportion of children in care who ceased to be looked after (during the year
ending 31st March) due to adoption (2010 to 2018) in West Sussex, the South East and England
Post-adoption support is critical to build and sustain the resilience of the child and their adoptive
families and to reduce the risk of adoption breakdown.
Children leaving care
The mental health of looked after children is poorer than their peers, with almost half of
children and young people in care having a diagnosable mental health condition 32. In 2017/18,
338 children ceased to be looked after in West Sussex. This equates to 19.5 per 10,000 of the
population (see Table 9).
Table 9: Number and rate of children (under 18) leaving care
Crude rate per 95% confidence levels
Year Count
10,000 Lower Upper
2012/13 355 21.4 19.2 23.7
2013/14 380 22.7 20.5 25.1
2014/15 325 19.2 17.2 21.5
2015/16 385 22.6* 20.4 25.0
2016/17 355 20.6 18.5 22.9
2017/18 338 19.5 17.5 21.7
Note. * value based on rounded count (to nearest 5)
Source: Public Health England – Fingertips
32House of Commons Education Committee: Mental health and wellbeing of looked-after children: forth report
of session 2015-16
29Local demand and capacity
Building on analyses of need, we have explored referral, activity and caseload activity to CAMHS
in West Sussex. The figures below reflect monthly activity from April 2016/17 through to June
2019/20. Whilst monthly variation is apparent, referrals to CAMHS services have been generally
consistent during the past 3 years (just over 4,000 new referrals received each year - Figure 8).
Figure 8: Number of new referrals received by CAMHS from West Sussex CCGs
Note. This shows all referrals (not accepted referrals) for patients in West Sussex CCGs referred
into any service in Sussex CAMHS. Some services are not included (see performance reports for
more detail)
After an initial increase in 2016/17, the proportion of referrals to CAMHS that have been
signposted to other services 33 has remained stable in 2018/19 (49.9%) compared with 2017/18
(50.9%).
Figure 9: Proportion of referrals to CAMHS signposted
33 Referrals closed in the month following initial triage
30The number of first (Figure 10) and follow-up (Figure 11) appointments offered each month has
been relatively consistent throughout 2018/19. Although monthly variation exists, the total
number of first appointments offered has not changed hugely from 2017/18 to 2018/19. The
number of follow up appointments was far higher in 2016/17 than in later years, becoming more
similar from 2017/18 to 2018/19 (a small decrease of -6.6%).
Figure 10: Number of first appointments offered
31Figure 11: Number of follow-up appointments offered
32Conclusion
The key findings are:
1. Nationally and locally there is an increasing need for services for CYP who require
emotional and mental health support.
2. Current levels of referrals do not fully capture the mental health needs of children and
young people locally.
3. There is a need to continue to commission both more, and different, types of capacity
across the range of EWB and CAMHS services due to the: wider societal and policy
changes, the increases in the projection of local 0-18 population and the increasing
complexity of CYP presenting to services.
4. Additional early help has supported a wide range of CYP and there is evidence emerging
of the value of this in offering a timely response.
5. In terms of continuous improvement, our investment plans need to be informed by
further analysis of the need, demand and capacity across the whole pathway - and not
just a focus on waiting times for mental health assessment or caseloads.
Overall, with population growth and changes in the profile of need, demand for services are
projected to increase. Although any description of the future is always subject to very high levels
of variability, current capacity across the whole system will need to manage an increase in
demand of between 5 to 15%.
333 CURRENT PROVISION IN WEST SUSSEX AND PROGRESS SO FAR
Significant improvement in local services has been made possible in the first 4 years of LTP
investment. Prior to 2015 (and the redesign and LTP investments) there was an overall lack of
capacity in early intervention and support (Tier 2). This year we have continued to develop our
core early intervention and emotional support services (YES, Counselling and CMHL) and work
closely with specialist CAMHS, to try to ensure our CYP get the right service first time when they
need it. West Sussex now has a wide range of services currently available for CYP needing
mental health and emotional wellbeing support. These services are commissioned to provide to
all CYP including those with SEND.
In addition to developing local services to meet the need of our CYP in West Sussex we have also
focussed on developing care pathways and importantly relationships between providers and
also working closely with those that support CYP and refer and signpost to services, for example
GPs and Schools.
We have developed a joint CYP Emotional Wellbeing and Mental Health Pathway to support GPs
to refer and / or signpost. The pathway document can be found here:
https://www.coastalwestsussexccg.nhs.uk/map-of-cyp-mental-health-services
Information about services and support has also been developed on the following websites:
For GPs: https://www.coastalwestsussexccg.nhs.uk/map-of-cyp-mental-health-services
For young people: https://www.westsussex.gov.uk/education-children-and-families/your-
space/health/emotional-wellbeing-and-mental-health/emotional-wellbeing-information-and-support/
For parents / carer and professionals: https://local-offer.org/information_pages/389-services-mental-
health-and-emotional-wellbeing
3.1 Making Progress, Making a difference – our achievements so far
Each year we produce a document for stakeholders called Making Progress, Making a
Difference. The documents highlight the progress made during the year, outlines the services
that have support our CYP and activity undertaken during the year. Full details of our progress
to date can be found in:
• Making Progress, Making a Difference 2017
• Making Progress, Making a Difference 2018
• Making Progress, Making a Difference 2019
The documents can be found at:
https://www.coastalwestsussexccg.nhs.uk/children-and-young-people
This section highlights the range of services which commissioners have redesigned with CYP and
partners and how we measure activity and outcomes. A comprehensive list of current
commissioned services is included in Appendix 1.
343.2 Early intervention and prevention
As a result of our local transformation plan we have invested additional funding to increase the
core services of Youth Emotional Support (YES), Dialogue Counselling Services and the schools
and colleges offer. We have also introduced targeted services to meet the need of our CYP in
West Sussex.
Youth Emotional Support (YES)
YES provides intensive 1-2-1 emotional wellbeing support and access to counselling, group
programmes and support from other agencies. During 18/19, YES supported 2,152 young people
aged 11-18 with a wide range of emotional wellbeing issues, helping them to make positive
choices and build resilience. Many others were supported to access other more appropriate
services.
Operating from the eight FindItOut centres across the county, YES accepts self-referrals and
referrals from GPs, child and adolescent mental health services (CAMHS) and school nurses. YES
works closely with the Integrated Preventions and
Earliest Help (IPEH) service to ensure integration with “Without your support, and
other services and wider family support where coming with me on a long journey,
appropriate. It also works closely with CAMHS to carry I wouldn’t have been able to
achieve what I have so far this last
out joint assessments and ensure timely and
year… None of this would have
appropriate escalations. On average, less than 2% of been possible without going to
people receiving support from YES go on to require a YES.”
referral to CAMHS.
This year, YES has introduced a range of emotional wellbeing workshops to provide coping
strategies, practical tools and tactics to help young people manage their wellbeing in a more
proactive and positive way.
YMCA Dialogue Counselling
YMCA Dialogue offers face-to-face counselling in various locations for 11-18 year olds with mild
to moderate mental health difficulties. The service
re-launched in November 2018 to include an
“I found I learnt a lot about myself
integrated online counselling offer.
and things to take away that will
help me in the future.”
The service received 1,201 referrals last year, an
increase of nearly 10% from 2017/18. Outcomes for
young people include coping better, feeling better in themselves or feeling less anxious. Nearly
three quarters rated the service 8/10 or more for helpfulness.
35You can also read