STATE OF EUROPEAN MARKETS 2017 - Watershed Investments - MAINPARTNER PROMOTEDBY - Ecostar
←
→
Page content transcription
If your browser does not render page correctly, please read the page content below

STATE OF EUROPEAN MARKETS 2017
                Watershed Investments

 MAIN PARTNER   PROMOTED BY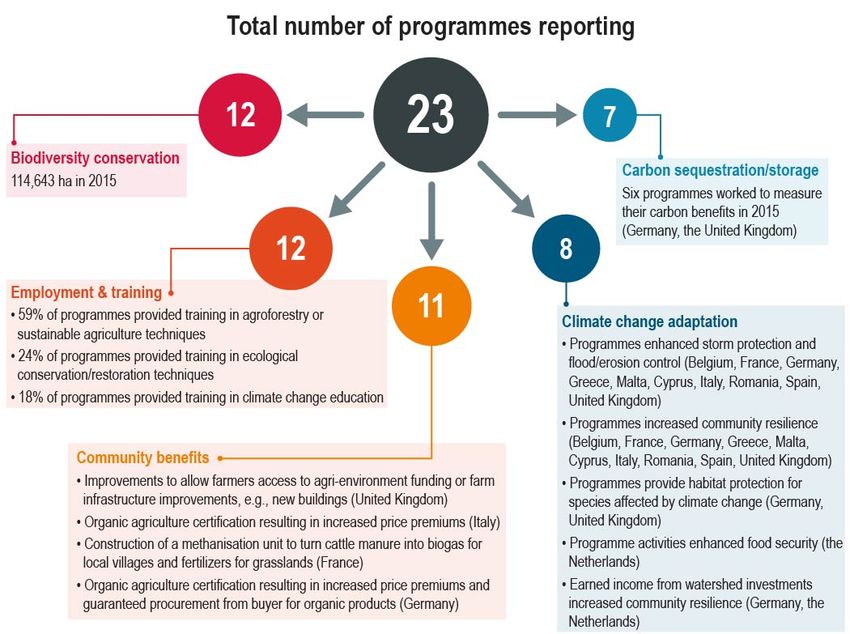
ABOUT FOREST TRENDS’ ECOSYSTEM MARKETPLACE
Ecosystem Marketplace, an initiative of the non-profit organization Forest Trends, is the leading global source of
information on environmental finance, markets, and payments for ecosystem services. As a web-based service,
Ecosystem Marketplace publishes newsletters, breaking news, original feature articles, and annual reports about
market-based approaches to valuing and financing ecosystem services. We believe that transparency is a hallmark
of robust markets and that by providing accessible and trustworthy information on prices, regulation, science, and
other market-relevant issues, we can contribute to market growth, catalyse new thinking, and spur the development
of new markets, and the policies and infrastructure needed to support them. Ecosystem Marketplace is financially
supported by a diverse set of organizations including multilateral and bilateral government agencies, private
foundations, and corporations involved in banking, investment, and various ecosystem services.
Forest Trends works to conserve forests and other ecosystems through the creation and wide adoption of a broad
range of environmental finance, markets and other payment and incentive mechanisms. Forest Trends does so by
1) providing transparent information on ecosystem values, finance, and markets through knowledge acquisition,
analysis, and dissemination; 2) convening diverse coalitions, partners, and communities of practice to promote
environmental values and advance development of new markets and payment mechanisms; and 3) demonstrating
successful tools, standards, and models of innovative finance for conservation.
For up-to-date information on environmental markets, sign up for our newsletters here: http://www.forest-
trends.org/dir/em_newsletter
                                       Forest Trends’ Ecosystem Marketplace
                                           1203 19th Street, NW, 4th floor
                                               Washington, DC 20036
                                         info@ecosystemmarketplace.com
                                         www.ecosystemmarketplace.com
                                               www.forest-trends.org

ABOUT ECOSTAR | NATURAL TALENTS
The first Impact Hub and Accelerator for nature-based businesses
ECOSTAR is a research-enterprise impact hub and accelerator that promotes entrepreneurship and innovation for
nature-based businesses. The initiative is implemented by a university-enterprise partnership between European
and US-based institutions. ECOSTARis co-funded by the Erasmus+ Programme of the European Union and private
investors. ECOSTAR pursues its mission through the following activities:

•   An Impact Hub that promotes the start-up and acceleration of new business initiatives with a positive impact
    on environment and society

•   A Research-Business alliance that links universities and companies, providing networking and market-
    oriented training

•   Knowledge products that highlight profitable business models that market, promote, and enhanc
    biodiversity and ecosystem services
Find out more at www.ecostarhub.com and subscribe to our newsletter at: http://bit.ly/2rd1JUm.
This project has been funded with support from the European Commission. This publication reflects the views only
of the authors, and the Commission cannot be held responsible for any use which may be made of the information
contained therein.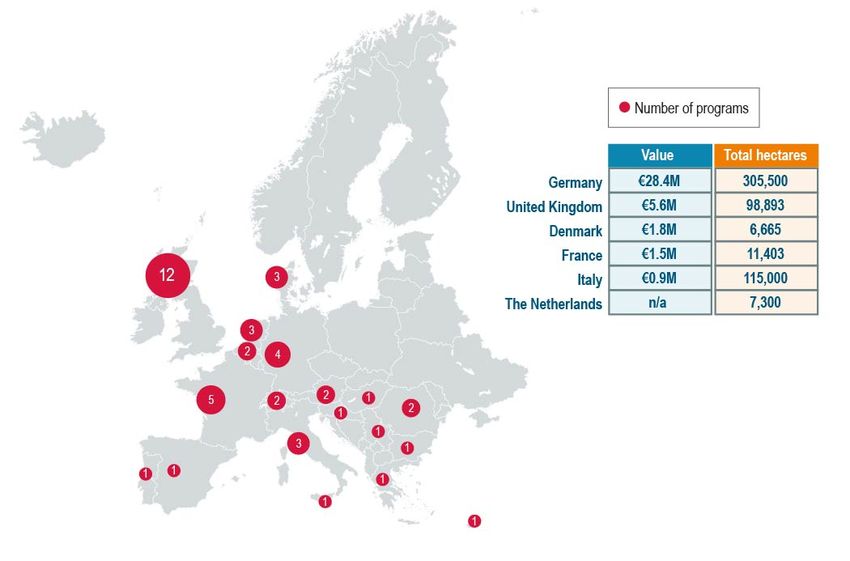
State of European Markets 2017
   Watershed Investments

                                       June 2017

Authors                                Contributors
Genevieve Bennett                      Jens Abildtrup
Senior Associate                       French National Institute for Agricultural Research
Forest Trends’ Ecosystem Marketplace
                                       Giulia Amato
Alessandro Leonardi                    ETIFOR
Chief Executive Officer
ETIFOR                                 Jose Barquín
                                       University of Cantabria Institute of Environmental
Franziska Ruef                         Hydraulics
Research Assistant
Forest Trends’ Ecosystem Marketplace   Marc Benoît
                                       French National Institute for Agricultural Research
                                       Theresa Bodner
                                       ETIFOR
                                       Julien Fiquepron
                                       National Center for Forest Owners (CNPF)
                                       Serge Garcia
                                       French National Institute for Agricultural Research
                                       Claire Montagné-Huck
                                       French National Institute for Agricultural Research
                                       Colm O’Driscoll
                                       ETIFOR
                                       Ignacio Pérez-Silos
                                       University of Cantabria Institute of Environmental
                                       Hydraulics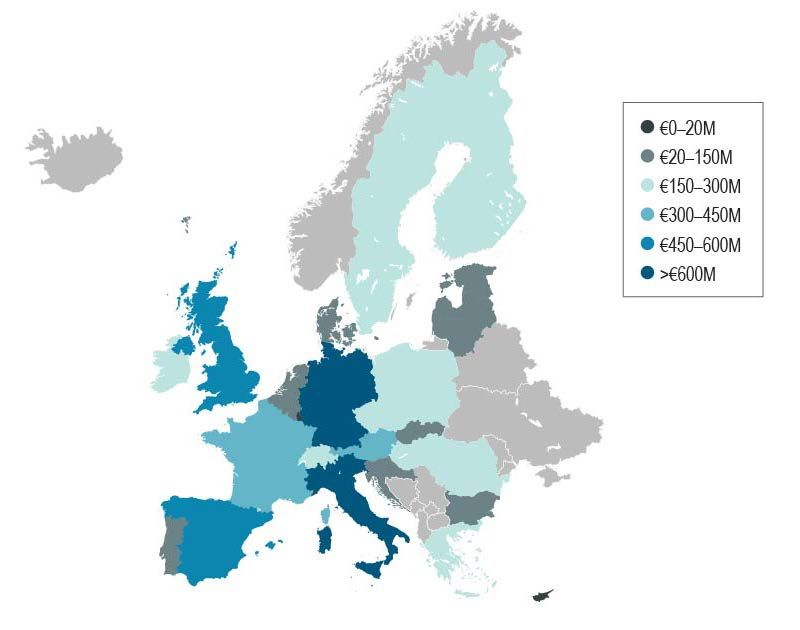
CREDITS

Project title

ECOSTAR

WP reference

WP3 Research and Assessment of Needs

Task reference

Task 3.4

ECOSTAR contacts

info@ecostarhub.com

Authors and affiliation

Genevieve Bennett (Forest Trends’ Ecosystem Marketplace)

Alessandro Leonardi (University of Padova and ETIFOR)

Franziska Ruef (Forest Trends’ Ecosystem Marketplace)

15/06 2017

Document version/status

Draft v.2.0

This project has been funded with support from the European Commission. This publication
reflects the views only of the author, and the Commission cannot be held responsible for any
use which may be made of the information contained therein.
DISCLAIMER
This document was based upon information supplied by participants in a market survey. Forest Trends’ Ecosystem
Marketplace does not represent or warrant the accuracy, suitability, or content of the survey responses or the results
of that survey as set out herein. It is the sole responsibility and obligation of the reader of this report to satisfy
himself/herself as to the accuracy, suitability, and content of the information contained herein. Forest Trends’
Ecosystem Marketplace (including its respective affiliates, officers, directors, partners, and employees) makes no
warranties and shall have no liability to the reader for any inaccuracy, representation, or misrepresentation set out
herein. The reader further agrees to hold Forest Trends’ Ecosystem Marketplace harmless from and against any
claims, loss, or damage in connection with or arising out of any commercial decisions made on the basis of the
information contained herein. The reader of this report is strongly advised not to use the content of this report in
isolation, but to take the information contained herein together with other market information and to formulate his/her
own views, interpretations, and opinions thereon. The reader is strongly advised to seek appropriate legal and
professional advice before entering into commercial transactions.

ACKNOWLEDGMENTS
This report is a compilation of the insights of a wide range of individuals across several continents. It would not be
possible without the hundreds of individuals who shared critical information about their organizations.

The country sections of this report have been produced thanks to a collaboration with a COST Action project
(CA15206) on Payments for Ecosystem Services (“Forests for Water”), which allowed report authors to connect
with a European Union network of experts on the topic. More information on this project is available at
https://forestry.gov.uk/fr/pesforw.

Graphics by Clarise Frechette Design, LLC (www.clarisefrechette.com).
This page intentionally left blank.
i

TABLE OF CONTENTS
1.          Introduction ......................................................................................................................................................1
2.          Watershed Investment: The Basics .................................................................................................................2
3.          Scope and Methodology ..................................................................................................................................5
4.          Market Overview ..............................................................................................................................................6
5.          Mechanisms: Public Subsidies ........................................................................................................................7
6.          Mechanisms: User-Driven Investments ........................................................................................................ 11
7.          User-Driven Watershed Investments: Buyers .............................................................................................. 14
8.          User-Driven Watershed Investments: Demonstrating Performance and Assurances Required by Buyers. 16
9.          Co-benefits: “Beyond Water” Outcomes for Communities & Nature ............................................................ 17
10.         Country Profiles ............................................................................................................................................ 19
     10.1         Germany ................................................................................................................................................ 19
     10.2         France.................................................................................................................................................... 20
     10.3         Spain...................................................................................................................................................... 22
     10.4         Italy ........................................................................................................................................................ 23
     10.5         United Kingdom ..................................................................................................................................... 24
11.         Outlook .......................................................................................................................................................... 25
12.         Bibliography .................................................................................................................................................. 27

FIGURES, MAPS, TABLES, BOXES
Figures
Figure 1: Mechanisms Tracked in This Report ...........................................................................................................3
Figure 2: The Green-Grey Infrastructure Spectrum ...................................................................................................4
Figure 3: Rural Development Programmes for CAP II Priority 4: Land Area Targeted and Implemented to
          Date by Country, 2015 ............................................................................................................................ 10
Figure 4: User-Driven Watershed Investments: Cumulative Growth in Programmes by Year ............................... 12
Figure 5: User-Driven Watershed Investments: Buyers by Type and Value Transacted in 2015 ........................... 15
Figure 6: User-Driven Watershed Investments: Assurances Required by Buyer Sector ........................................ 17
Figure 7: User-Driven Watershed Investment Programmes: Co-Benefits Reported in 2015.................................. 18
Figure 8: Governance Structure of the Lower Saxony Co-operation Model ........................................................... 20
Figure 9: Governance Structure of the Vittel Project by Nestlé Waters France ...................................................... 22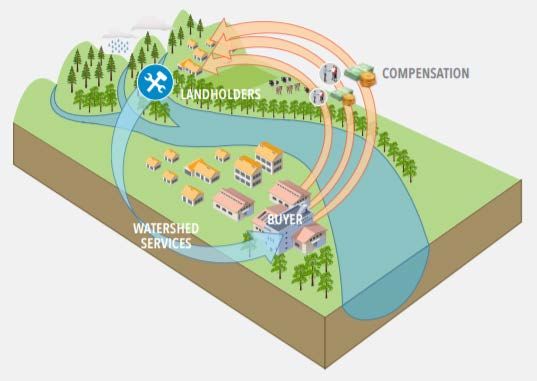
ii

Maps
Map 1: Public Subsidies for Watershed Protection in 2015: Countries by Value and Area under Management.......7
Map 2: User-Driven Watershed Investment Programmes by Country .................................................................... 11

Tables
Table 1: Mechanisms Tracked in This Report: Value, Area under Management, and Number of
          Operational Programmes in 2015 ..............................................................................................................6
Table 2: Most Popular Interventions, User-Driven Watershed Investment Programmes ....................................... 13
Table 3: User-Driven Watershed Investment Programme Buyers by Profit Status, Number of Buyers,
          Average Share of Value, and 2015 Value ............................................................................................... 14
Table 4: User-Driven Watershed Investment Programmes: Buyer Motives by Sector ........................................... 16

Boxes
Box 1: Benefits of Green Infrastructure for Water Supplies .......................................................................................2
Box 2: Watershed Approaches: The European Policy Context ..................................................................................8
Box 3: Rural Development Programme Priorities, Focus Areas, and Measures Tracked in this Report ...................9
Box 4: The Lower Saxony Co-operation model ....................................................................................................... 20
Box 5: Nestlé Waters (formerly Vittel) ..................................................................................................................... 21
Box 6: "El Bajo Ebro" project in the North-East of Spain......................................................................................... 23
Box 7: Upstream Thinking ....................................................................................................................................... 25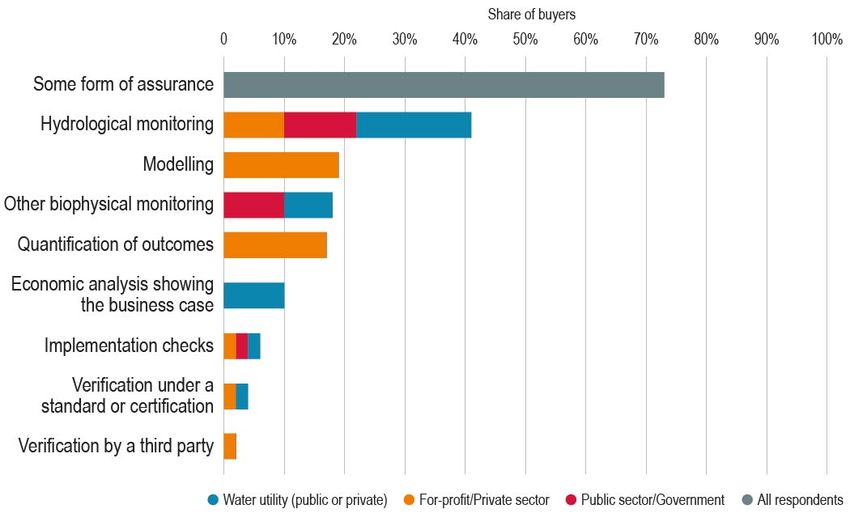
iii

ACRONYMS
CAP         Common Agricultural Policy

EAFRD       European Agricultural Fund for Rural Development

ESIF        European Structural Investment Funds

EU          European Union

MS          Member States

NWRM        Natural Water Retention Measure

SWW         South West Water

USD         United States Dollars

WFD         Water Framework Directive

GLOSSARY
Bilateral agreements for watershed protection: This transaction mechanism involves a single user or beneficiary
of ecosystem services compensating one or more parties for activities that maintain or enhance ecosystem services
delivery to the payer.

Buyers: The actors who pay for watershed services in a transaction. Buyers may act on their own behalf or in the
public interest.

Co-benefits: Additional environmental, social, or other benefits arising from a watershed investment project and
quantified based on metrics or indicators defined by the project developer, a co-benefits certification programme,
or third-party project standard accounting for both watershed services and co-benefits.

Collective action: Collective action for watershed management refers to voluntary cooperation among various
stakeholders in a watershed, where multiple actors from the public, private, and/or civil society sectors self-organise
to address water resources management through information-sharing, joint decision-making, and other coordinated
activities. Typically, these partners are united by common challenges or goals and recognise that collective action
will deliver better outcomes than unilateral action by any one actor.

Collective action fund/Water fund: Collective action funds are collective action partnerships that include a
cooperative funding element in order to maintain, restore, or create green infrastructure in the watershed. Partners
contribute financial and/or in-kind support to watershed protection activities, which are typically designed and
implemented in consultation with the group. Collective action funds may establish an endowment or trust fund to
manage contributions, as in the case of a number of “water funds” in Latin America and the Caribbean; or they may
use other systems for administering funds or operate on the principle of matching funds (where partners coordinate
investments but resources are never actually pooled).

Compliance markets: Ecosystem services markets whose buyers participate in them in order to meet regulatory
obligations.

Credit: A defined unit of environmental goods or services that can be applied toward compliance with a permit,
held, traded, sold or retired. Credits may be measured in terms of mass, area, functional units, or other assessment
iv

methods. In water quality trading markets a credit represents the quantity of a pollutant reduced over a specified
time period that is in excess of the required reduction for a certain source.

Ecosystem market: Any programme or platform that facilitates transactions between buyers and sellers who
exchange financial compensation for ecosystem assets or practices that restore, enhance, or protect ecosystem
services. Markets are organised around specific asset types; ecosystem assets or credits are typically not fungible
across markets.

Ecosystem services: The benefits nature provides to human society, such as reliable flows of clean water, timber
products, pollination of crops, or cultural values associated with a specific place.

Green infrastructure: Green infrastructure restores, maintains, or mimics natural hydrological processes through
natural and semi-natural features and practices. Green infrastructure may be implemented at the site scale or as
part of a landscape-scale network. Within urban areas, the term often is used to refer to specific low-impact or green
urban design elements/practices, such as the use of bioswales or tree plantings to manage stormwater. However,
in this report we use the term more broadly as defined above.

High Nature Value farming: Farming practices based on traditional low-intensity agricultural systems that include
semi-natural areas and features such as pastures, meadows, orchards, and hedges. High Nature Value farming
aims to provide ecological connectivity and a mosaic of habitat types on the landscape, as well as ecosystem
services such as hydrological filtration and carbon storage.

Interventions: The specific land management, restoration, enhancement, or conservation activities undertaken in
expectation of ecosystem services benefits or maintenance.

Offset: This term refers to a quantified environmental benefit that is designed to compensate for impacts to habitat,
environmental functions, or ecosystem services. Offsets may be regulatory or voluntary. In water quality trading
markets, offsets refer to pollutant load reductions that are purchased by a new or expanding facility with pollutant
load discharges, to mitigate its increased discharge to an impaired waterbody.

Natura 2000: A network of nature protection areas in the European Union. Natura 2000 sites include Special Areas
of Conservation (SACs) designated under the Habitats Directive and Special Protection Areas (SPAs) designated
under the Birds Directive. SPAs are established by Member States themselves. SACs are selected by the European
Commission from a list of sites submitted by Member States.

Programme: The overarching system that facilitates transactions between buyers and sellers, linked by a common
administrator and/or market infrastructure (such as an exchange mechanism, crediting protocol, or regulatory
framework). A programme can encompass many distinct projects.

Project: A site, or suite of sites, where restoration, enhancement, or other resource conservation actions are
implemented for the purposes of marketing the resulting ecosystem service assets or outcomes to buyers.

Public subsidies for watershed protection: Public subsidies for watershed protection reward land managers for
enhancing or protecting ecosystem services. They are funded by governments (sometimes with multilateral or donor
support), acting on behalf of the public good, and typically operate at a large scale.

Replenishment: Broadly, a guiding principle for activities that aim to generate an annual volumetric benefit equal
to a company’s consumptive use by watershed restoration, water access and sanitation projects, irrigation efficiency
improvements, and/or other interventions. Companies may commit to replenishment activities or targets in order to
“balance” their water impacts.

Sellers: The actors who receive compensation or payments from buyers for interventions resulting in maintained,
enhanced, or restored watershed services or specific watershed services outcomes.
v

Transaction: We consider “transactions” to occur at the point that offsets or other agreed deliverables are
contracted, regardless of the date of delivery.

User-driven watershed investments: Investments that channel payments from water users, such as companies
or water utilities acting on behalf of customers, to landholders or other parties (“sellers”) in exchange for conserving,
restoring, or creating green infrastructure. Buyers may contract directly with sellers in a process known as “bilateral
agreements for watershed protection,” or pay into a “collective action fund/water fund” that pools contributions for
greater impact. User-driven programmes can be voluntary or a mechanism to meet regulatory compliance. Also
see definitions of “Bilateral agreements for watershed protection” and “Collective action fund/Water fund.”

Voluntary markets: Markets through which firms, individuals, and organizations voluntarily buy offsets or pay for
ecosystem services.

Water quality trading and offsets: Water quality trading and offsets allow water users to manage their impacts on
watersheds by compensating others for offsite activities that improve water quality or supply. Compensatory
activities are packaged as a credit or some other unit traded in an established “market,” defined by watershed
boundaries. Trading and offsets are often compliance-driven.

Watershed investments: Any transaction between a buyer and a seller where financial value is exchanged for
activities or outcomes associated with the maintenance, restoration, or enhancement of watershed services or
natural areas considered important for watershed services.

Watershed services: Ecosystem services associated with hydrological functions or systems.
1

1.         INTRODUCTION

The European Union (EU)’s Water Framework Directive (WFD) was first announced more than a decade and a half
ago, in 2000. Yet its core principle–that good water resources management requires a basin-scale approach–still
represents innovative, if not yet fully realized, policy.

The WFD sets ambitious targets for improving water management and water quality in EU water bodies, and for
conserving ecosystems within and around those water bodies. Despite progress, Europe faces challenges in
meeting those targets. Fewer than half of water bodies met the standard of “good status” by 2015 (European
Environment Agency 2015). However, governments responded to this setback by strengthening policy and
financing commitments. In the latest round of funding under the Common Agricultural Policy (CAP), the budget for
payments to landholders who voluntarily carry out sustainable landscape management activities jumped by €2
billion (B) per year. Meanwhile, the European Commission is supporting numerous high-level projects that
encourage demonstration and integration of green infrastructure 1 in planning and policy, demonstrating a vote of
confidence in the potential of healthy landscapes to deliver clean, reliable water to European citizens.

At the same time, many of the sources of water risk are tightly linked to specific places on the landscape and local
land-use patterns, and so solutions must also be found at that scale, and not just in Brussels. European
communities, companies, and local government are showing growing interest in incentive mechanisms, local
partnerships, and innovative approaches involving both the private and the public sector to address water risk.
While funding for watershed protection continues to be led by the public sector, this report finds evidence of water
users themselves–particularly utilities and the private sector–steadily increasing support for green infrastructure as
well in recent years.

This report seeks to capture the scale and performance of incentives and market-based mechanisms for green
infrastructure for water. It includes not only public finance for watershed health, but also local-scale initiatives driven
by water users themselves to address shared water challenges. We focus specifically on transactions for
watershed protection, where financial value is exchanged between a buyer and seller for activities or outcomes
associated with the maintenance, restoration, or enhancement of watershed services or natural areas considered
important for watershed services. 2 We use the term “watershed investment” in the sense of a long-term investment
in an asset, just as a city would “invest” in upgrades to its wastewater treatment plant. Watershed investments may
provide financial returns to the parties funding them, but more often the benefits come in the form of cleaner or
more reliable water supplies, cost-savings (for example, for water service providers), or even co-benefits like
increased incomes for farmers participating in a watershed investment programme.

In this report, broad trends in the size, scope, and direction of watershed investment mechanisms are presented at
the European level. National-level data is also provided for a number of countries where watershed investments
are prominent, along with information on policy and key trends. Several case studies are offered to highlight
innovative programmes active in Europe. Readers interested in learning more about watershed investment or
specific initiatives are encouraged to consult our global State of Watershed Investment 2016 report (Bennett and
Ruef      2016)       and    explore      Ecosystem      Marketplace’s      online   programme     inventory    at
http://www.watershedconnect.org/programs. We hope that this report provides an interesting and inspiring look at
watershed investment in Europe, and lessons for how communities, government, and companies are already
successfully working to address water risk through nature-based solutions.

1   All terms highlighted in bold blue text are defined in the Glossary.
2 Direct investments in green infrastructure where no transaction between a buyer and a provider of green infrastructure takes
place are excluded from this study. For example, a city planting trees along public sidewalks, while certainly a green
infrastructure intervention, will not be included in this report since no incentive or payment is deployed. If that city paid private
property owners to install green roofs or rain gardens, on the other hand, those activities would fall within our tracking.
2

2.      WATERSHED INVESTMENT: THE BASICS

This report benchmarks global transactions in 2015 that delivered funding for green infrastructure for water (referred
to in this report simply as “green infrastructure”) from buyers who believe that restoring, enhancing, or protecting
natural systems is an effective, sustainable, and (often) cost-effective way to ensure clean, reliable water supplies
(Box 1).

                            Box 1: Benefits of Green Infrastructure for Water Supplies
 Healthy landscapes support a complex network of ecosystem services and offer numerous benefits—like plant pollination
 or flood protection—each with their own unique value to ecology and economies.
 Some of these services (like pollination) cannot be replaced with existing technology. In other cases, integrating nature-based
 and built solutions for water treatment, storage, or delivery can reduce operating costs or prolong the lifespan of built
 infrastructure. For example, reforesting hillsides can limit sedimentation in a hydropower station’s reservoir—protecting the
 turbines from damage and prolonging the life of the reservoir—and also provide immediate, direct benefits for rural
 communities nearby in terms of soil retention, reduced flood risk, or enhanced groundwater recharge. These benefits are
 known as watershed services.
 Other examples of watershed services provided by healthy landscapes:
 Water for consumptive and non-            Healthy natural systems help ensure clean, reliable water for drinking, agriculture,
 consumptive human use                     hydropower generation, navigation, and other uses.
 Aquatic productivity                      Healthy aquatic habitats and the species that live in them are an important source
                                           of food and medicine. Water quality in coastal fisheries, for example, can be
                                           strongly affected by the condition of adjacent upstream watersheds. In other
                                           words, what happens on the mountain ridges—for better or worse—impacts the
                                           reefs.
 Flow regulation and storm/flood           Healthy forests, wetlands, grasslands, and mangroves in some cases act as
 buffering                                 natural “sponges” that absorb water—recharging groundwater supplies, reducing
                                           flood risk, and/or maintaining stream flows during dry periods.
 Filtration of nutrients and               Ecosystems, including forests and wetlands, filter pollutants, improving water
 contaminants                              quality by trapping sediments and pollutants before they enter surface waters.
 Erosion control and soil fertility        Healthy forests and grasslands help stabilise soils, preventing erosion and
                                           landslides. Natural areas also host critical nutrient cycling, maintaining soil health
                                           and productivity.

Market Mechanisms for Green Infrastructure

All mechanisms covered in this report originate with a water service provider, government, business, or other party
that attaches value to a watershed service, or set of services, and agrees to compensate providers of the service(s)
accordingly. For example, a beverage company might be willing to pay local farmers €100,000 per year to reduce
pesticide use, if on-site treatment of polluted water would otherwise cost €150,000 per year. In this scenario, an
individual farmer might be willing to curtail his or her pesticide use for €5,000 per year, assuming that this amount
would cover the costs of switching to organic methods or otherwise compensate him or her for foregone income.

This is only one example. In practice, the nature of payments varies according to a buyer’s specific goals and the
political, social, economic, geographic, and environmental context (Figure 1). Many governments elect to pay
subsidies to farmers or other landholders for watershed protection. One business may decide to partner directly
with landholders located near its water source, while another may prefer to contribute to a watershed restoration
fund that handles the land management decisions. Some programme types require fairly sophisticated regulatory
frameworks and institutional capacity (such as trading and offsets).
3
Figure 1: Mechanisms Tracked in This Report
Public subsidies for watershed protection reward land
managers for enhancing or protecting ecosystem services.
They are funded by governments (sometimes with
multilateral or donor support), acting on behalf of the public
good, and typically operate at a large scale.
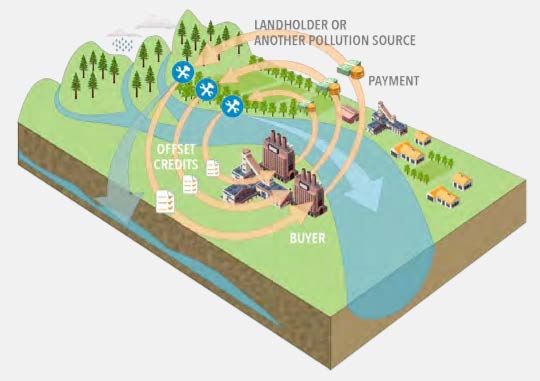
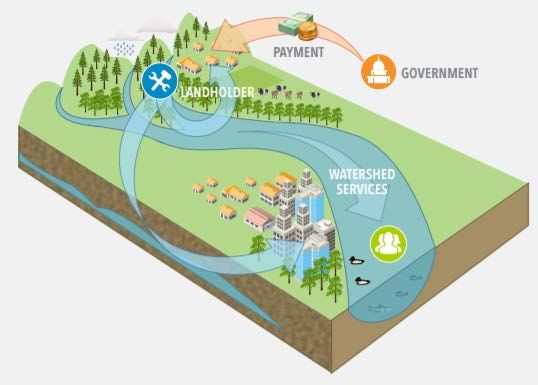
User-driven watershed investments channel payments
from water users, such as companies or water utilities
acting on behalf of customers, to landholders or other
parties (“sellers”) in exchange for conserving, restoring, or
creating green infrastructure. Buyers may contract directly
with sellers in a process known as bilateral agreements
for watershed protection or pay into a collective action
fund/water fund that pools contributions for greater
impact. User-driven programmes can be voluntary or a
mechanism to meet regulatory compliance.
Water quality trading and offsets allow water users to
manage their impacts on watersheds by compensating
others for offsite activities that improve water quality or
supply. Compensatory activities are packaged as a credit
or some other unit traded in an established “market,”
defined by watershed boundaries. Trading and offsets are
often compliance-driven.
In contrast to other ecosystem market mechanisms tracked by Ecosystem Marketplace, there is no real “market”
for green infrastructure; there is no single established platform where a buyer can go to directly finance4
interventions that deliver services like aquifer recharge or floodwater storage. There is rarely a market-determined
price for watershed services. Even the unit of delivery varies: buyers might pay for hectares of land sustainably
managed or kilograms of pollution kept out of water bodies.
Hydrological benefits from green infrastructure are highly localized. Thus, transactions often are local, too. This
contrasts with markets for greenhouse gas emissions reductions where transactions and climate benefits span the
globe and are based on the exchange of a clearly defined and universally accepted unit (one tonne of carbon
dioxide equivalent). In contrast, contracts for green infrastructure services and the basis of payment can vary
tremendously.
Green Infrastructure and Water Systems
However, common to most watershed programmes tracked in this report is the recognition that natural systems can
complement or substitute for “grey” (i.e., built or “hard”) infrastructure. Forests or wetlands, for example, can filter
out water pollution, regulate stream flows, recharge aquifers, and absorb flooding, thus limiting the need for hard
infrastructure to perform these functions. For example, a green-grey hybrid infrastructure approach for a coastal
city facing flood risks might include the following defences: wetland restoration on the periphery of urban areas,
bioswales or permeable pavements within the city itself to naturally absorb floodwaters, upgrades to constructed
seawalls to buffer surges, and wastewater infrastructure in order to minimise sewer overflows in the event of a flood
event.
These green-grey infrastructure hybrids incorporate modern technology with practices from watershed
management, low-impact development, and even ancient technologies for treating, storing, and moving water
across the landscape (Figure 2). Hybrid and green infrastructure solutions can often be implemented at lower cost
and in incremental fashion, delaying large upfront capital costs. Green infrastructure can also improve the
functioning of built infrastructure, helping society to fully capture or exceed the expected returns on infrastructure
investments. Cities and communities often face complex, interlinked water resource challenges with respect to land
use in their surrounding areas. For example, new energy development or growing demand for water-intensive crops
such as almonds can conflict with drinking water needs. Watershed-scale approaches can help manage such
challenges and trade-offs holistically.
Figure 2: The Green-Grey Infrastructure Spectrum
Green Green + Grey Grey5 3. SCOPE AND METHODOLOGY This report summarises data on watershed investments in Europe drawing from two primary sources: data from Forest Trends’ Ecosystem Marketplace’s 2016 survey of programme administrators on watershed investments in 2014 and 2015, and agri-environmental subsidy data on European Structural Investment Funds (ESIF) obtained from the System for Fund Management for the EU. Ecosystem Marketplace gathers data through a global survey of administrators of watershed investment programmes; ongoing tracking through programme reports, donor reports and databases, statistical yearbooks, credit ledgers; credit registries; and interviews with programme administrators and market intermediaries. The survey, which gathered data on activity in 2014 and 2015, was available online and disseminated via personal contacts and Ecosystem Marketplace newsletters and announcements from March 28 until June 1, 2016. Our scope included both EU and non-EU European countries. A total of 40 European programmes were identified: 34 were in an active or pilot/demonstration stage, four were inactive, and two were in development and not yet transacting. Eighteen programmes responded directly to the survey. In other cases, Ecosystem Marketplace staff compiled programme profiles based on previous years’ survey responses or desk research and provided programme contacts with an opportunity to review and correct data. Where programme activity could not confirmed, programmes were not included in the dataset informing this report. All transaction data was collected in US dollars (USD) and converted to Euros at a rate of EUR0.89775:USD1.00. Transaction data is non-adjusted for inflation. ESIF data on came from two primary databases: ESIF Finance Details, which summarises ESIF financing (EU and National amounts) by country, operational programme, priority axis, thematic objective, category of region, and measure (where available); and ESIF Achievement Details, which summarises ESIF achievements by country, operational programme, priority axis, thematic objective, and investment priority (where available). These datasets are updated regularly; readers should note that a more recent version of the data became available in July 2016, and thus numbers on EU public finance for watershed protection are slightly different than those reported in our global State of Watershed Investment 2016 report (which relied on a dataset published in November 2015). This is because financial allocations may change over time due to transfers between themes or between funds. We apologise for any confusion on this matter but in the interests of accuracy have opted to use the new ESIF dataset. The new ESIF Achievements Details dataset also contains data on activities implemented through the end of 2015, which are included in this report.
6

4.         MARKET OVERVIEW

       Table 1: Mechanisms Tracked in This Report: Value, Area under Management, and Number of
                                   Operational Programmes in 2015

                                                                                                               Median
                                                   Total Value,                  Total Area,                                             Median
                                                                                                             Programme
                                                 All Programmes               All Programmes                                         Programme Area
                                                                                                                Value
    Public subsidies for watershed
              protection                               €5,668M                     12.8M ha                     €77.6M                    417,020 ha

        User-driven watershed
             investments                                €39.4M                      0.6M ha                      €0.8M                     3,500 ha

     Water quality trading/offsets                        n/a                          n/a                         n/a                         n/a

                  TOTAL                                €5,708M                     13.4M ha                          -                          -

  Notes: Data are not reported for water quality trading and offsets programmes in this table. Ecosystem Marketplace requires a minimum of three data
points to report figures publicly in order to protect respondents’ confidentiality. Data was only collected for two programmes in the water quality trading and
                                                              offsets mechanism category in 2015.

In 2015, an estimated €5.7B in payments for watershed protection flowed to landowners and public land managers
on 13.4 million (M) hectares (ha) of land in Europe (Table 1).

Nearly all value (€5.668B or >99% of total transactions) associated with watershed investment in Europe in 2015
was public finance. Public subsidies for watershed protection, mainly agri-environmental contracts for sustainable
landscape and water management funded under the CAP’s Pillar II, averages €5.5B a year for the 2014-2020
period.

But in some cases, water users themselves also directly funded watershed protection incentives, driven by growing
water risks and stricter regulation. This study documented €39.4M in user-driven watershed investments in 2015.
These initiatives were generally much smaller in scale than public subsidy programmes (Table 1) and were
motivated by specific local water concerns. Typically user-driven investment took the form of direct contracts
between landholders and water users, or contributions from water users to a collective action fund (see the
“Watershed Investment: The Basics” chapter on page 2 for more information on these mechanisms).

Finally, two cases in the United Kingdom and Germany involved local public water service providers who used a
water quality offsetting mechanism to meet water quality standards and manage risk in the watershed. Water quality
offsets are a relatively new mechanism in Europe.

Virtually all of the watershed protection finance that we tracked targeted private landowners: 12.9M ha reported
under watershed management in 2015 were privately owned, compared to slightly more than 42,000 hectares of
public lands. 3

3   Based on 12,950,344 ha for which ownership type was reported.
7
5. MECHANISMS: PUBLIC SUBSIDIES
Map 1: Public Subsidies for Watershed Protection in 2015: Countries by Value and Area under
Management
The primary source of public incentives for land management that supports watershed health is the European
Agricultural Fund for Rural Development (Box 2). The EAFRD is the funding mechanism for national and subnational
rural development programmes implemented under Pillar II of the CAP. 4
For the 2014-2020 period, an average of €5.5B per year is committed to restoration, conservation, and sustainable
management activities that benefit watershed health under Priorities 4 and 5 of the EU rural development policy.
Priority 4 sets an objective of “restoring, preserving, and enhancing ecosystems related to agriculture and forestry,”
while Priority 5 concerns “promoting resource efficiency and supporting the shift towards a low-carbon and climate-
4 Farmers who receive direct payments under Pillar 1 of the CAP must comply with certain standards related to animal welfare,
food safety, environmental protection, and landscape maintenance. Since these “cross-compliance” measures are mandatory,
they are not included in the scope of this report.8
resilient economy in agriculture, food, and forestry sectors,” which includes improving water use efficiency in
agriculture. 5 (See Box 3 for a detailed explanation of priorities, focus areas, and measures tracked in this report.)
Roughly €3.5B of annual rural development funds comes in the form of EU co-financing, which is matched by €2B
from MS. The share of EU co-financing of national rural development budgets for 2014-2020 ranges from 26% of
total national budget (Luxembourg) to 95% (Romania). The average annual national share of EU co-financing for
measures tracked in this report was 65%. Landholders themselves also provide match funding for public subsidies
under Pillar II of the CAP. Subsidies cover 80% of the total costs of implementation of activities, with landholders
contributing the remaining 20%.
Rural development funding is implemented at the MS level. Countries establish their own targets in line with the EU
rural development policy and administer their own national or subnational rural development programmes, which
must be approved by the European Commission. In total there are 118 rural development programmes active for
the 2014-2020 period.
Italy spends the most of any EU country on the watershed protection measures tracked in this report, with an
estimated €721M committed annually, followed by Germany (€644M) and the United Kingdom (€581M). Meanwhile,
the United Kingdom allocates the greatest share of its total rural development budget to restoring, preserving and
enhancing ecosystems related to agriculture and forestry (73.1%). Overall, Priority 4 activities have been embraced
across the continent. Priority 4 is accorded at least one-quarter of total national rural development budgets in all
MS and accounts for 43.1% of overall EAFRD funding for 2014-2020 (European Commission 2015).
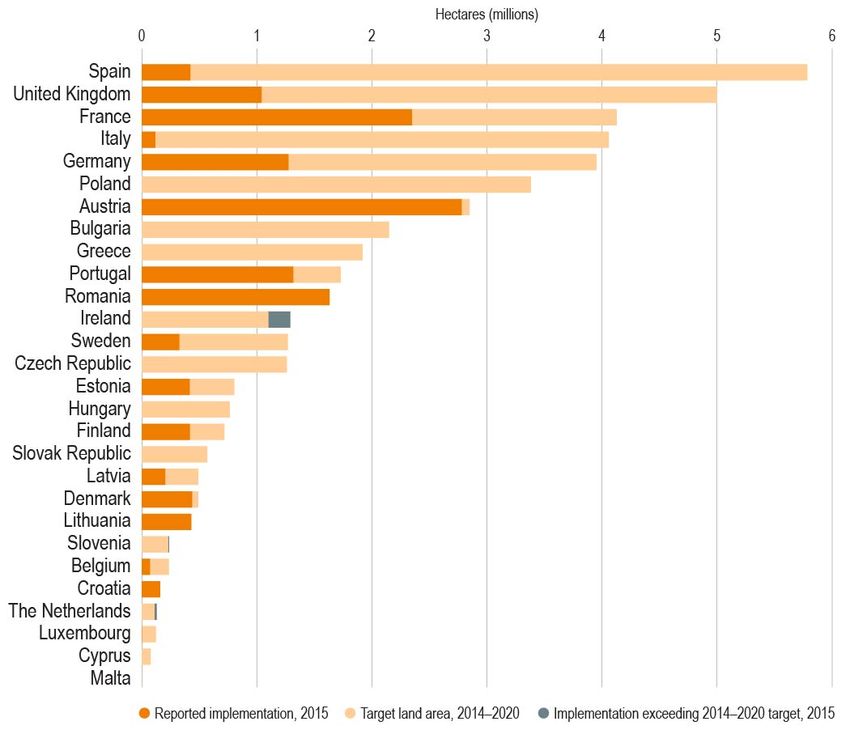
These funds aim to enrol more than 47M ha by 2020 in contracts supporting ecosystem services on agricultural
lands, organic farming, land rehabilitation, and conservation of natural areas. As of the end of 2015, MS have
implemented these activities on more than 12.8M ha, with the greatest progress to date reported by Austria, France,
and Portugal (Figure 3).
Box 2: Watershed Approaches: The European Policy Context
EU Water Framework Directive
The EU WFD sets out a set of steps for EU Member States (MS) to reverse trends of deteriorating water quality in EU rivers,
lakes, and groundwater, and to achieve “good status” in ecological and chemical terms for all EU waters. Its scope includes
inland, surface, transitional, coastal and groundwater resources, as well as the ecosystems in and around water bodies. The
WFD requires countries to implement management at the scale of the river basin, rather than according to political
jurisdictional boundaries. Thus a number of transboundary basin districts now exist where management and planning are
coordinated across national borders. The WFD also mandates that MS ensure cost-recovery in setting water prices and carry
out research, monitoring, and public reporting and consultation on basins’ statuses.
EU Common Agricultural Policy
Reform of the EU CAP for the 2014–2020 period included a commitment to target 30% of Pillar I direct payments to farmers
for “greening” measures (including for crop diversification, grassland conservation, and designation of “ecological focus
areas”). However, some environmental groups have noted that mechanisms designed to provide MS with more flexibility
have resulted in loopholes and weakening of environmental measures.
This report tracks only Pillar II of the CAP, namely rural development funds associated with Priority 4 of the EU rural
development policy, which support activities conducive to watershed and landscape health, and Priority 5a which is
associated with agricultural water use efficiency.
5Regulation (EU) No 1305/2013 of the European Parliament and of the Council, Title 1, Chapter 2, Article 5 (17 December
2013).9
Box 2 (continued)
EU Rural Development Policy Priorities 4 & 5
Title 1, Chapter 2, Article 5 of the European Agricultural Fund for Rural Development (EAFRD) regulation defines priorities as:
Priority 4: Restoring, preserving, and enhancing ecosystems related to agriculture and forestry, with a focus on the
following areas: (a) restoring, preserving, and enhancing biodiversity, including in Natura 2000 areas, and in areas
facing natural or other specific constraints, and High Nature Value farming, as well as the state of European
landscapes; (b) improving water management, including fertiliser and pesticide management; and (c) preventing soil
erosion and improving soil management.
Priority 5: Promoting resource efficiency and supporting the shift towards a low-carbon and climate-resilient
economy in agriculture, food, and forestry sectors, by: increasing efficiency in water use by agriculture.
Box 3: Rural Development Programme Priorities, Focus Areas, and Measures Tracked in this Report
Focus Area Associated Measures
Priority 4: Restoring, preserving, and enhancing ecosystems related to agriculture and forestry
4a: Restoring, preserving, and enhancing biodiversity, including in Measure 8: Investments in forest areas
Natura 2000 areas, and in areas facing natural or other specific
Measure 10: Agri-environment-climate payments
constraints, and High Nature Value farming, as well as the state
of European landscapes Measure 11: Organic farming
4b: Improving water management, including fertiliser and Measure 12: Natura 2000 & WFD payments
pesticide management
Measure 15: Forest-environmental and climate services
4c: Preventing soil erosion and improving soil management and forest conservation practices
Priority 5: Promoting resource efficiency and supporting the shift towards a low-carbon and climate-resilient
economy in agriculture, food, and forestry sectors
5a: Increasing efficiency in water use by agriculture Measure 16: Cooperation [approaches among different
actors in the Union agriculture sector, forestry sector,
and food chain, and other actors that contribute to
achieving the objectives and priorities of rural
development policy]
Source: Regulation (EU) No 1305/2013 of the European Parliament and of the Council (17 December 2013).
Notes: Focus Area 5a is also linked to Measure 4, “Investment in physical assets,” in EU rural development policy legislation. However, it is not tracked
here as it is not possible to determine to what extent investment is in “green infrastructure” assets rather than built assets.10
Figure 3: Rural Development Programmes for CAP II Priority 4: Land Area Targeted and
Implemented to Date by Country, 2015
Source: ESIF Achievement Details 2016.
Notes: This figure displays progress reported by MS to the European Commission through 2015. Implementation data for 2015 was not available for
Belgium, Bulgaria, Croatia, Cyprus, Czech Republic, Greece, Hungary, Lithuania, Malta, Poland, Romania, and the Slovak Republic at the time of writing
this report. Meanwhile, Ireland, the Netherlands, and Slovenia have reported greater implementation figures than the original targets established in their
rural development programmes.
This figure summarises hectares targeted and implemented reported by MS for the following indicators: agricultural land under management contracts
supporting biodiversity and/or landscapes, organic farming, land rehabilitation (total surface area of rehabilitated land), and nature and biodiversity
(surface area of habitats supported to attain a better conservation status). Progress associated with implementation of Priority 5 measures tracked in this
report is not included, since it is not reported in hectares.11
6. MECHANISMS: USER-DRIVEN INVESTMENTS
Map 2: User-Driven Watershed Investment Programmes by Country
Despite their smaller profile, user-driven watershed investment programmes continue to grow steadily in number
reaching 34 operational programmes in 2015 (Figure 4). These programmes transacted a reported €39.4M in
watershed payments in 2015. They supported watershed management on 604,400 ha, frequently focused on
sustainable agriculture, grassland conservation, and forest restoration (Table 2).12
Figure 4: User-Driven Watershed Investments: Cumulative Growth in Programmes by Year
Notes: Based on 32 programmes reporting mechanism and year in which programme was launched. Start year was unavailable for two programmes.
Most user-driven programmes (20 out of 34 operational in 2015, transacting a total of €36.9M) took the form of
direct contracts between a single buyer of watershed services and one or more landowners. Four programmes
reported using a collective action fund mechanism, pooling a total of €2.5M in funds in 2015 from multiple buyers
in their watersheds. 6
6 For three programmes, mechanism could not be determined because the source of funds was not reported.13
Table 2: Most Popular Interventions, User-Driven Watershed Investment Programmes
Intervention % of Programmes (Number)
Agricultural or pastoral sustainable management 62% (21)
Grassland conservation 50% (17)
Forest restoration or enhancement 50% (17)
Forest conservation 29% (10)
Wetland restoration or enhancement 24% (8)
Notes: Interventions are reported for total share of programmes implementing that intervention. Most programmes use a mix of interventions – thus
percentages sum to greater than 100%.
Most user-driven programmes (20 out of 34 operational in 2015, transacting a total of €36.9M) took the form of
direct contracts between a single buyer of watershed services and one or more landowners. Four programmes
reported using a collective action fund mechanism, pooling a total of €2.5 M in funds in 2015 from multiple buyers
in their watersheds. 7
Germany led Europe in value, with a reported €28.5M in user-driven watershed payments in 2015. The United
Kingdom (€5.7M), Denmark (€1.8M), and Italy (€0.9M) all hosted a number of long-running programmes as well.
Several programmes were active in multiple countries in 2015, including a multi-country effort to restore wetlands
along the Danube River in Hungary, Croatia, Serbia, Romania and Bulgaria, and Austria. Initiatives funded by Coca-
Cola and Nestlé Waters to protect source water areas and “replenish” water use impacts also spanned borders.
Nestlé Waters continued to pay for watershed protection in France, Italy, and Switzerland, while Coca-Cola and its
local partners supported projects in 2015 in Belgium, Cyprus, France, Germany, Greece, Italy, Malta, Romania,
Spain, and the United Kingdom.
Programmes were typically fully financed by water users, with little reliance on grants or donations reported for
2015. Two-thirds of programmes (15) reported that they were 100% financed by revenues from buyers, which
amounted to €30.4M in 2015. Another five (19%) programmes relied on a mix of buyer revenues and public loans
or grants, with an average ratio of 61% buyer revenues to 39% loan/grant finance. Three programmes (11%) said
they were fully dependent on public loans or grants as they worked to court potential buyers. The total reported
public support for these programmes was slightly under €1M in 2015. 8
Among programmes funded by drinking water utilities, 55% (or 6 out of 11 utilities providing detailed data on their
funding sources) have an established charge or fee paid by customers that directly funds watershed protection
activities. Others use a portion of the utility operating budget, or combine funds from multiple sources to finance
watershed protection.
7 For three programmes, a mechanism could not be determined as it was unclear where funding was coming from.
8 Based on 23 operational programmes provided financing data for 2015 representing €30.1M in funding.14
7. USER-DRIVEN WATERSHED INVESTMENTS: BUYERS
Private sector entities were the largest group of buyers participating in user-driven watershed investment in 2015,
but in terms of value, utilities spent more than any other buyer type, accounting for more than nine out of every ten
dollars transacted (Table 3). 9 The average utility contribution to user-driven programmes in 2015 was nearly €6.7M,
compared to private buyers’ average of €366,245 and the public sector’s €121,531.
Programmes also indicated significant reliance on a single sector in 2015. If a programme engaged a private sector
buyer in 2015, that buyer was on average responsible for 90% of total transaction value (Table 3). Similarly,
programmes with utility funding were virtually entirely supported by utilities. Meanwhile, when public sector buyers
engaged in user-driven watershed investment, they were far more likely to do so along with other buyers: the
average public sector buyer in 2015 contributed 38% of total funds to its respective programme.
Table 3: User-Driven Watershed Investment Programme Buyers by Profit Status, Number of Buyers,
Average Share of Value, and 2015 Value
Average Share of Total Value Average
Number
Revenues per Reported in Transaction per
of Buyers
Programme Transactions Buyer
For-profit/Private sector 26 90% €1.8M €366,245
Public sector/Government 20 38% €1.3M €121,531
Water utility (public or private) 19 98% €33.3M €6,662,302
ALL BUYERS 65 - €36.4M €1,737,122
Notes: Based on 65 buyers reported by 31 programmes representing €36.4M in user-driven watershed investment transactions (or 92% of total transactions reported).
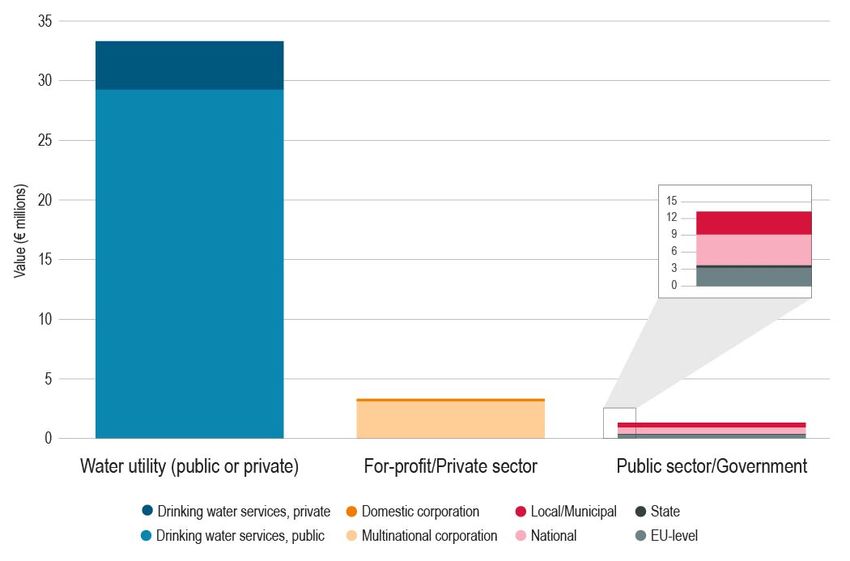
Public utilities were responsible for the largest share of utility transaction values in 2015 (Figure 5) thanks in large
part to legal frameworks in Germany channelling water abstraction charges toward payment programmes for
farmers voluntarily implementing groundwater protection practices.
Private sector transactions were dominated by multinational corporations in the food & beverage and consumer
goods sectors (totalling €1.6M out of €1.8M in cumulative spending by companies in 2015). These sectors funded
11 different programmes across the European continent in pursuit of water stewardship and water use
replenishment commitments, which sought to “balance” impacts from companies’ water use in their operations
and/or supply chains.
Meanwhile, public sector funding tended to come from the top: national and EU-level (non-CAP) funds accounted
for most of the public contributions to user-driven watershed investments in 2015.
9In this report, utilities are generally treated as a distinct category from either government or private business. Utilities
encompass both publicly and investor-owned water service providers, since both are typically subject to similar regulations
and face similar water resource challenges.15
Figure 5: User-Driven Watershed Investments: Buyers by Type and Value Transacted in 2015
Buyer motives varied across sectors (Table 4). Public sector buyers were motivated by broader societal challenges
like climate change and supporting rural livelihoods. On the other hand, programmes reported that private sector
buyers were driven by reputational concerns, as well as the desire to manage water-related risks to their supply
chains and operations. Water utilities shared these concerns about water risk, particularly when it came to land-use
patterns in their basins, but also were more likely to be motivated by compliance or cost-savings opportunities.You can also read