The Asia Pacific Region - Continental Profile - Western Cape Government
←
→
Page content transcription
If your browser does not render page correctly, please read the page content below
Continental Profile

The Asia Pacific Region
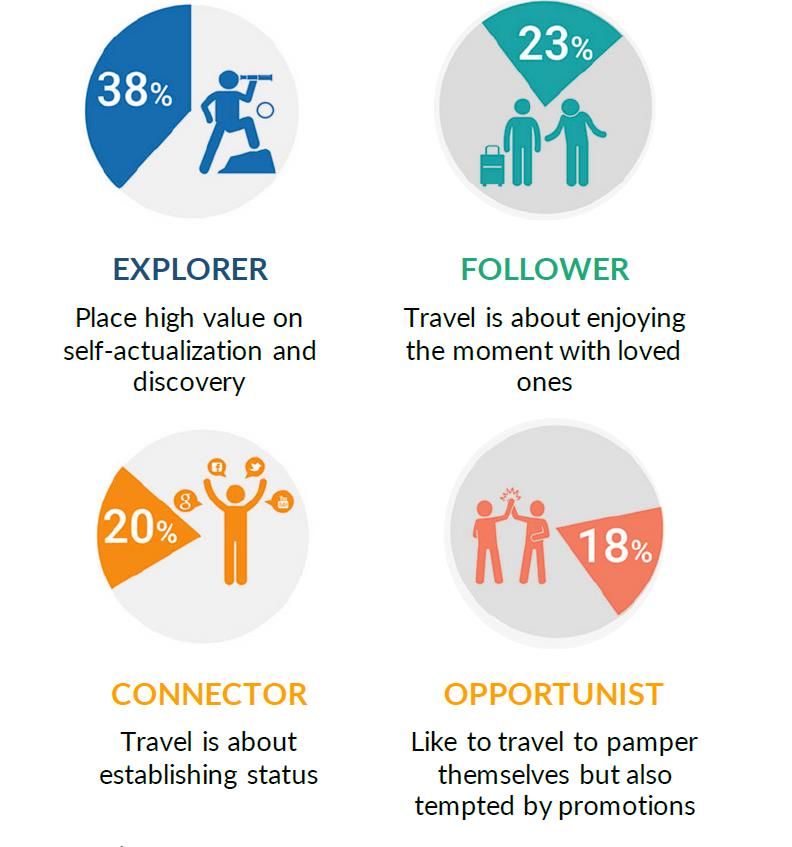
Table of

CONTENTS
ASIA PACIFIC OUTBOUND TOURISM

Unprecedented Growth in the Asia Pacific Region

Asia Pacific’s Interregional Outbound Travel

Tourism Expenditure

Asia Pacific countries leads as Origin Markets

Growth in Asia Pacific’s Socio-economic environment

Tourism Forecast

KEY TOURISM TRENDS IN ASIA PACIFIC

Four Key Trends

Key Growth Markets

      China Outbound Market

      Halal Tourism Market

                                                      1
ASIA PACIFIC OUTBOUND TOURISM TO SOUTH AFRICA

Tourists Arrivals

Purpose of Travel

Asia Pacific Total Foreign Spending

Asia Pacific Travellers Length of Stay

Accommodation Type

Seasonality

Preferred Activities

SOUTH AFRICA TOURISM COMPETITIVENESS INDEX

Competitiveness Index

Tourism Performance Overview

ACTIVATING ASIA PACIFIC TOURISM 2020

Geographic Focus

Target Market Definition

Key Tourism Potentials and Opportunities for Development

Perceived Constraints and Barriers

                                                           2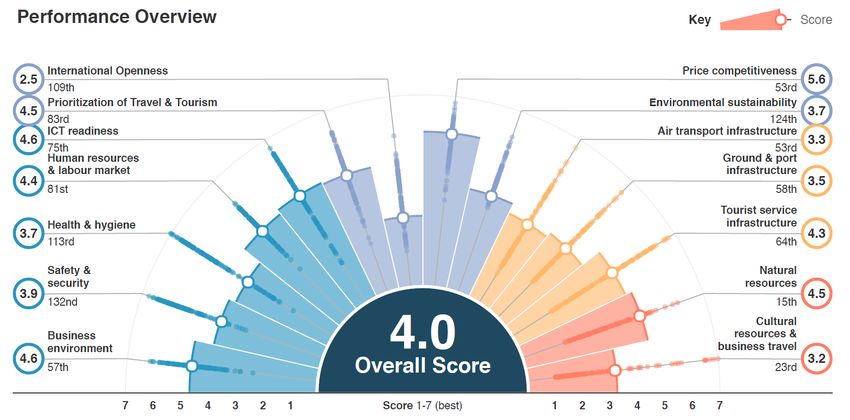
STRATEGIC FOCUS AREAS

Expand Western Cape Experiences

Marketing and Communicating: Reaching the target markets

Quality Service: Human Capacity Building

                                                           3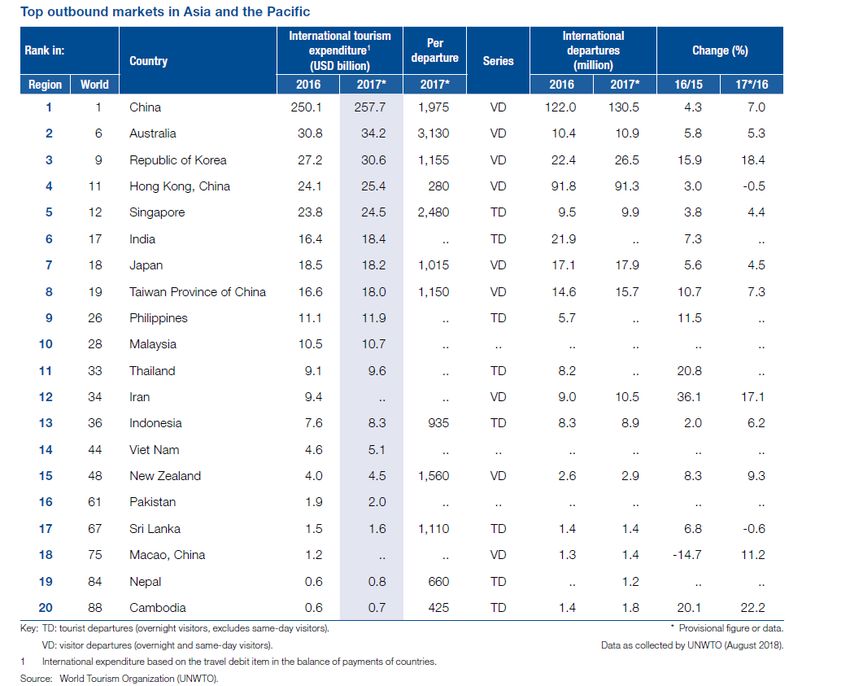
INTRODUCTION

Travel and tourism impacts the global economy significantly and is becoming

one of the largest and fastest growing economic sectors. In 2018, international

tourist arrivals increased by a remarkable 6 percent, recording a total of 1.4

billion. 2018 witnessed the second strongest growth year in international tourism

since 2010 and reached the 1.4. billion mark two years ahead of UNWTO’s long

term projection issued in 2010. This strong momentum can be attributed to a

favourable global economic environment and robust outbound tourism from

major source markets.

Home to over half the world’s population, the Asia Pacific region has undergone

dramatic changes over the past decade, with economic, infrastructure and

technological development fuelling rapid travel market growth. An expanding

middle class and rising disposable income in Asia Pacific markets including

China, India, Indonesia and Malaysia are driving increased travel demand. In

addition to rising domestic travel, a growing share of travellers is venturing

abroad, many for the first time, with China’s large and growing outbound travel

population.

Asia Pacific households now account for one in three global traveling

households, up from one out of four in 2006 (Visa Inc, 2018). Growth could

accelerate even faster as more Asia Pacific households in more cities cross the

                                                                                    4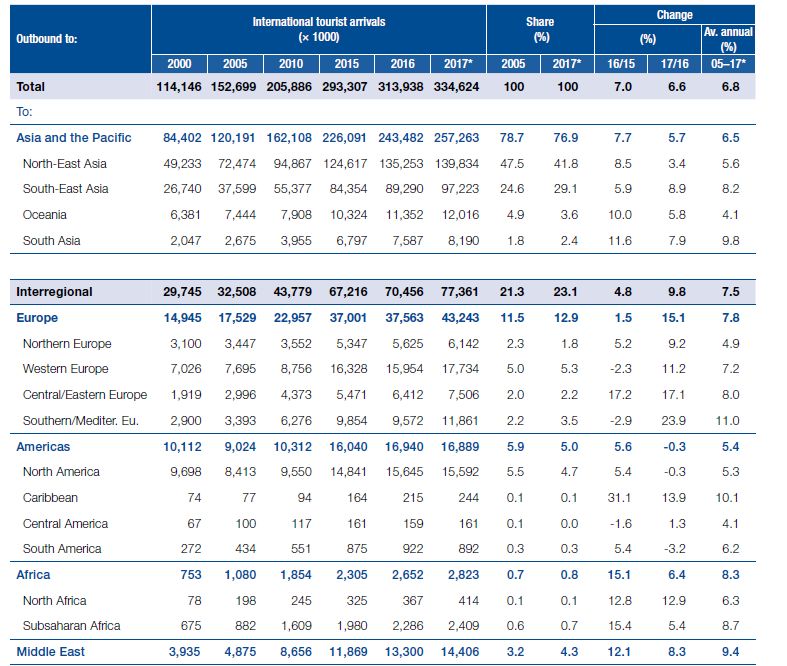
tipping point into the ranks of the global traveling class, adding an estimated

nearly 90 mil. households by 2025. Accounting for 37% of the world’s

international tourism expenditure, the contribution of Asia and the Pacific to

global tourism warrants attention (UNWTO/GTERC, 2018).

UNPRECEDENTED GROWTH IN THE ASIA PACIFIC REGION

Asia Pacific region can be separated into 4 areas which are North-East Asia,

South Asia, Oceania, and Southeast Asia. The region has played a vital role in

global tourism as an outbound tourism market and demonstrated eight

consecutive years of strong growth in outbound travel since 2009. Visitation out

of Asia and the Pacific comprised 25% of global outbound tourism in 2017,

totalled 335 million tourists and increased 7% from 2016-2017 (almost 60% on

aggregate). This average growth has been maintained between 2010 and 2017,

resulting in an aggregate increase of 63% during this period. Interregional travel

(to other regions) witnessed a strong 10% growth from 2017-2018 indicating a

positive demand for long haul travel.

                                                                                     5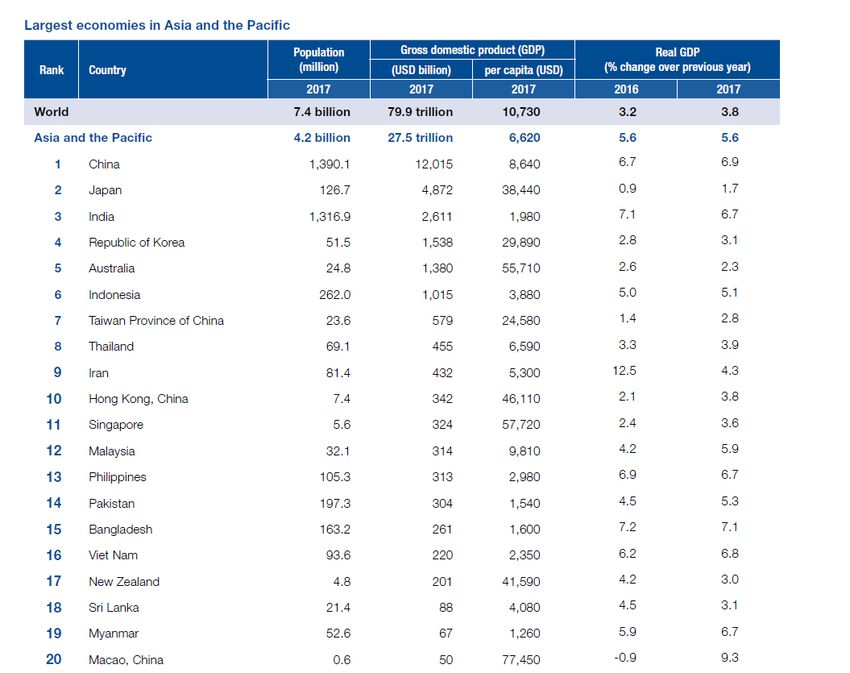
Outbound Tourism by Region of Origin (%)

Source: UNWTO (2018)

Outbound tourism from the region is strongly led by the North-East Asia, primarily

due to the growth of Mainland China. China’s demand for international travel

can be seen in its volume of outbound trips comprising130 million trips abroad in

2017 (total departures including same-day trips, as reported by China), the

majority of which to North-East Asian and South-East Asian destinations.

                                                                                 6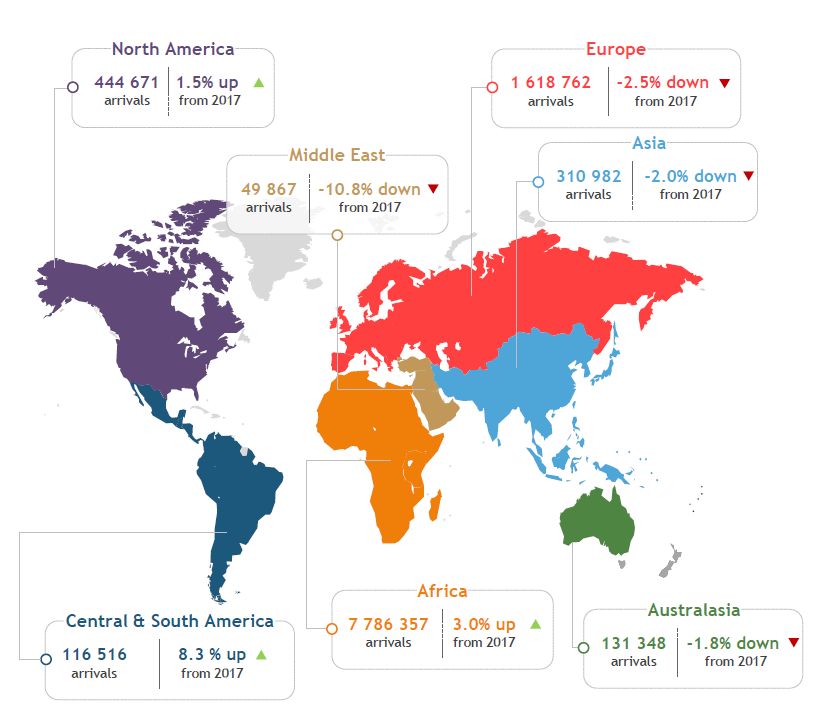
Top Outbound Markets in Asia and the Pacific

Source: UNWTO (2018)

                                               7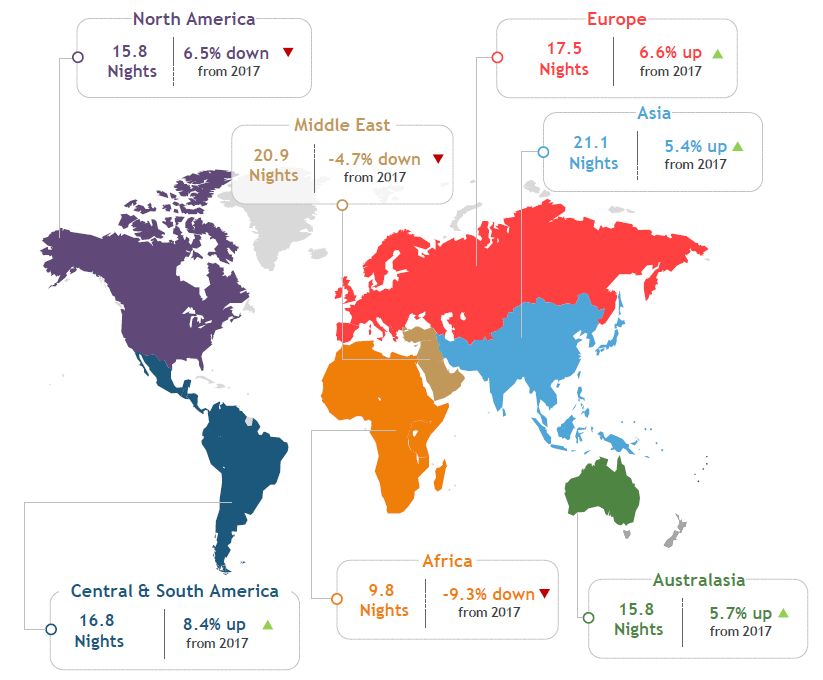
Air traffic Demand

IATA reported that Asia Pacific will be the biggest driver of air traffic demand

during the period of 2015-2035, and account for more than 42% of air traffic with

more than half of the new passenger traffic coming from the region (IATA, 2019).

Of the five fastest-growing markets globally in terms of additional passengers per

year over the forecast period, four will be from Asia.

   1.   China (817 million new passengers for a total of 1.3 billion)
   2.   US (484 million new passengers for a total of 1.1 billion)
   3.   India (322 million new passengers for a total of 442 million)
   4.   Indonesia (135 million new passengers for a total of 242 million)
   5.   Vietnam (112 million new passengers for a total of 150 million).

ASIA PACIFIC’S INTERREGIONAL OUTBOUND TRAVEL

Europe is the top long-haul destination for travellers from Asia and the Pacific,

accounting for 56% of Asia Pacific’s interregional travel (outside the region) and

13% of Asia Pacific travel overall (measured in arrivals in destinations). The

Americas account for 22% of interregional travel from Asia and the Pacific and

5% of outbound travel overall. The Middle East represents 19% of Asia Pacific’s

interregional tourism and 4% of the region’s total outbound flows. Travel to Africa

is still rather low, accounting for 4% of interregional trips and 1% of Asia Pacific’s

outbound travel (UNWTO/GTERC, 2018).

                                                                                         8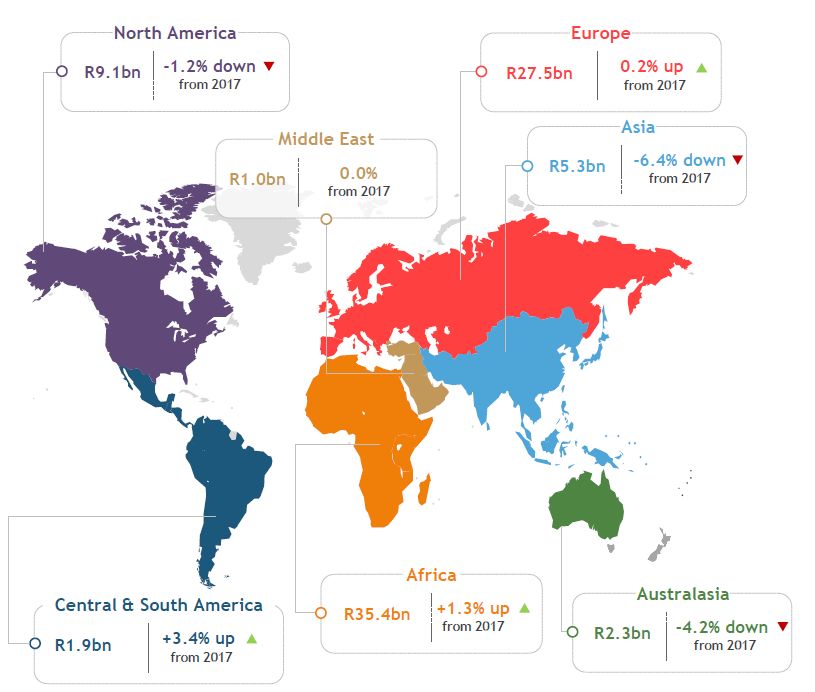
The Europe region is the fastest-growing interregional destination for Asians in the

period 2010-2018 (+9% per year), followed by the Middle East (+8% per year), the

Americas (+7%) and Africa (+6%). The development of economic links between

Asia and the Middle East and with Africa will stimulate both business and leisure

travel beyond Asia and the Pacific (UNWTO/GTERC, 2018).

Asia Pacific Outbound Travel to All Regions

Source: UNWTO (2018)

                                                                                    9
Growth (% change) in Asia Pacific outbound travel to all regions in the year 2017
and 2018.
Source: UNWTO (2018)
TOURISM EXPENDITURE
Tourism expenditure from the region has also increased substantially,
experiencing double digit growth. Asia Pacific travellers spent USD 502 billion on
international tourism in 2017, some 37% of the world total, up from 24% in 2010
(UNWTO/GTERC, 2018). North-East Asia accounts for 70% of Asia Pacific’s
spending, amounting to USD 352 billion. South- East Asia accounts for 14% of the
10region’s tourism spending, while Oceania and South Asia account for 8% and 7%
respectively.
World’s Top 10 Spenders
Source: UNWTO (2018)
Mainland China represents over half (51%) of the total spending of North-East
Asia, amounting to USD 258 billion. Australia is the 2nd largest tourism spender in
the region, with USD 34 billion recorded in 2017. The Republic of Korea is the 3rd
largest with USD 31 billion spent last year, Hong Kong (China) is 4th with USD 25
billion and Singapore is 5th with USD 24 billion. Combined, these four markets
11represent 23% of international tourism spending in Asia and the Pacific. India,
Japan and Taiwan Province of China are increasingly noted as growing source
markets, totalling about USD 18 billion on international tourism in 2017.
Australia and Singapore recorded a relatively low number of outbound trips, but
spend the most per trip. China is the third biggest spender per trip with an
average of USD 1,975, followed by New Zealand (USD 1,560) and the Republic of
Korea (USD 1,150). These sources markets (with the exception of China) are high-
income economies with relatively small populations, which results in high
spending per trip, and also per capita.
ASIA PACIFIC COUNTRIES LEADS AS ORIGIN MARKETS
Mastercard’s Global Destination Cities Index (2019) which ranks the world’s top
200 cities reported the significance of the Asia Pacific region as a noteworthy
origin market that deserves the attention of both the public and private sectors
at global destinations. It is critical to better understand commerce patterns and
deliver attractive experiences for these eager and affluent travellers from across
the region.
An important finding is that since 2009, mainland China has jumped six places to
be the No. 2 origin country for travellers to the 200 included destinations—
behind only the U.S. In addition, South Korea and Japan are promising origin
12markets fuelling rising travel expenditure and overnight arrivals across the top
200 destinations globally.
Ranking of the Asia Pacific destinations among the top 200 international origin
markets.
Rank Origin Market % Share Contribution To Top 3 global cities of origin
200 Global Destinations in 2018 markets
By
Ovn International Expenditure
Arrivals
2 Mainland China 8.90% 9.40% Bangkok
Seoul
Tokyo
6 South Korea 3.50% 3.30% Osaka
Hokkaido
Tokyo
7 Japan 3.10% 3.40% Taipei
Seoul
Bangkok
10 Australia 2.30% 2.60% Bali
Singapore
New York
11 India 2.00% 2.80% Dubai
Singapore
Makkah
14 Taiwan 1.50% 1.50% Tokyo
Hokkaido
Okinawa
10 Indonesia 1.20% 1.60% Singapore
Kuala Lumpur
Makkah
11 Malaysia 1.10% 1.30% Singapore
Bangkok
13Chennai
Source: Mastercard’s Global Destination Cities Index (2019)
GROWTH IN ASIA PACIFIC’S SOCIO-ECONOMIC ENVIRONMENT
The strong tourism growth in the region can be attributed to several favourable
factors. Rapid economic growth in a region with increasing population, coupled
with rising air connectivity, market openness and travel facilitation have largely
boosted international travel in Asia and the Pacific, both within the region
(intraregional) and to/from other regions (interregional).
With a population of 4.2 billion inhabitants, Asia Pacific is the world’s largest
region demographically, accounting for more than half of the population on
the planet (56%). In 2017 the GDP of Asia and the Pacific reached USD 27.5
trillion, the highest of all world regions, measured in US dollars. Between 2000 and
2017, Asia experienced the fastest economic growth across world regions,
largely driven by China and India.
Most of Asia and the Pacific’s GDP is generated in North- East Asia (70%),
particularly by China (44%) and Japan (18%), which are Asia’s leading
economies. India (South Asia) contributes 9% to regional GDP, while the
Republic of Korea and Australia (Oceania) account for about 6% and 5%,
respectively.
14Asia Pacific Population and GDP
Source: UNWTO/GTERC (2018)
IMF (2018) Regional Economic Outlook: Asia and Pacific report highlighted Asia
as the world’s most dynamic economic region which will continue to be the
main growth engine of the world. Overall per capita income in Asia still
substantially lags that in the United States and Europe, but in growth terms, the
region is very much at the forefront of the global economy, accounting for more
15than 60 percent of world growth and projected to grow at 5.6 percent in 2018
and 5.4 percent in 2019.
Income levels have surged in Asia and the Pacific since the past decade, with
the region’s per capita GDP more than doubling from USD 3,170 in 2005 to USD
6,620 in 2017 an increase of 109%. By subregion, South Asia (+145%) and South-
East Asia (+144%) recorded the highest growth. North-East Asia (+115%) also saw
its per capita GDP more than double. By subregion, South Asia (+145%) and
South-East Asia (+144%) recorded the highest growth. North-East Asia (+115%)
also saw its per capita GDP more than double. Macao (China) has the highest
GDP per capita in Asia and the Pacific, at USD 77,450, followed by Singapore
(USD 57,700) and Australia (USD 55,700).
16Source: Statista (2019)
In Asia Pacific, as in many travel markets worldwide, total travel market growth is
outpacing overall economic gains. With the exception of South Korea and Hong
Kong, Asia Pacific travel markets are expanding faster than GDP on a local
currency basis. In Malaysia, for example, travel gross bookings rose a projected
9.7% in 2018, compared to GDP growth of 4.7%. In China, the region’s largest
individual travel market by a wide margin, travel gross bookings jumped 9.7%,
versus GDP gains of 6.6% (PhocusWright, 2019).
17APAC Gross Domestic Product and Total Travel Market, Annual Change (%,
Local Currencies) by Market, 2018
Source: Phocuswright Inc (2019)
Visa Inc (2018) reported a similar finding that outbound travel demand is
outpacing income growth throughout much of the Asia Pacific. Measured by
travellers’ spending abroad, demand in 12 of the major Asia Pacific economies
has grown on average twice as fast in constant dollars and prices over the last
decade as real economic growth, which is often viewed as a proxy for income
growth. For instance, outbound travel demand in China, the regional leader,
rose 22 percent per year from 2006 to 2016, compared with only 9 percent per
year growth in real GDP. Trends in outbound travel from Southeast Asia are also
18encouraging, with growth in outbound travel significantly exceeding real
economic growth in the Philippines, Malaysia and Thailand.
Mastercard Insights (2016) studied the regional outlook of outbound travel from
2016-2021 of 17 tourism markets in Asia Pacific and reported that outbound
travel is generally growing faster than real GDP in most of these destinations
except in the case of Bangladesh, Philippines and Malaysia. Myanmar is the
fastest growing outbound market at 10.6 percent over the forecast period,
followed by Vietnam (9.5 percent) Indonesia (8.6 percent), China (8.5 percent)
and India (8.2 percent). The fastest growing developed markets are South Korea
at 3.8 percent, followed closely by Singapore, Australia, and New Zealand, all of
which are projected to grow by about 3.5 percent over the forecast period.
Interestingly, the three growth markets Singapore, Taiwan and Hong Kong, are
also the smallest in geographic size among the 14 markets covered, but the
limited competition from domestic tourism destinations adds to the overall size of
international tourism.
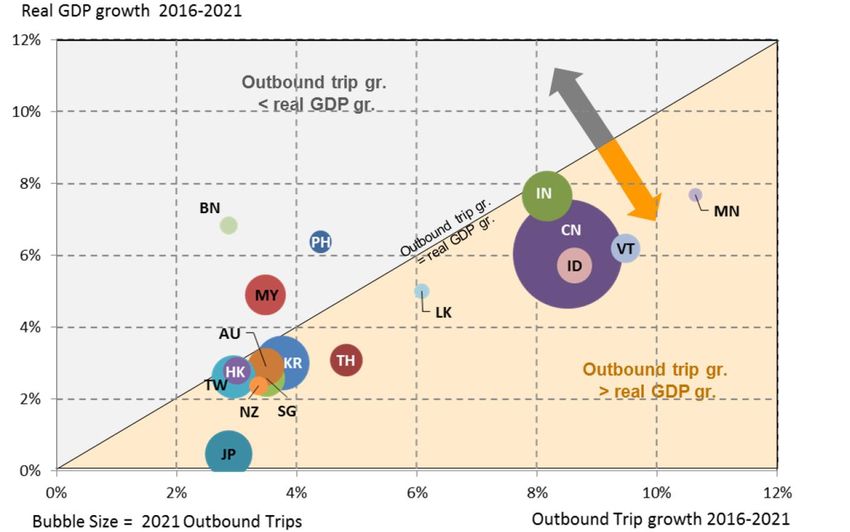
The chart below locates the positions of each of the 17 Asia Pacific markets in
the two-dimensional space combining real GDP growth rates vertical axis) and
the growth rates of outbound travel (horizontal axis). The chart also suggests that
the outbound travel growth tends to be higher than real GDP growth (as
indicated by points further below the diagonal line) for the developing markets
of Myanmar, Vietnam, Indonesia, Thailand, and China compared to the
19developed markets (excluding Japan) which tend to have outbound growth
much closer to the forecasted real GDP growth (as indicated by points hugging
or close to the diagonal line).
Outbound travel growth versus Real GDP growth
Source: Mastercard Insights (2016)
20TOURISM FORECAST
According to the forecast report Tourism Towards 2030 (UNWTO, 2018), the
number of international tourist arrivals worldwide will increase by an average of
3.3% a year over the period 2010 to 2030. At the projected rate of growth,
international tourist arrivals worldwide are forecast to reach 1.4 billion by 2020
and 1.8 billion by 2030.
Collectively, outbound travel from Asia Pacific is expected to grow by an
annual rate of 6 percent over the forecast period of 2016-2021 (Mastercard,
2017). China is projected to be the largest outbound travel market by 2021,
(excluding trips to Hong Kong and Macau), followed by South Korea and India.
At a projected 103.4 million trips in 2021, outbound China travel will be four to
five times that of South Korea and India, and will constitute almost 40 percent of
all Asia Pacific outbound travel by 2021.
Emerging Asia Pacific destinations currently records about 1.5 times more
outbound trips than Developed Asia Pacific destinations and will grow more
than twice as fast as Developed Asia Pacific (7.6 percent versus 3.3 percent)
over the forecast period of 2016-2021.
Given the dynamics around international travel, Asia Pacific travel could
accelerate even faster than its current pace as more cities reach the necessary
size to support mass tourism. Although, currently, travellers within Asia Pacific
residents skew more heavily to short-haul and regional cross-border travel. as the
21level of income and affluence rises in the rapidly developing Asia, more and
more of its cities will likely grow in importance for outbound cross border tourism.
In China alone, the number of cities reaching the tipping point in cross-border
tourism is likely to double by 2025—adding around 80 million more households to
the global traveling class (Visa Inc. 2018).
Asia Pacific Outbound Trips Forecast: 2016-2021
Source: Mastercard (2016)
22KEY TOURISM TRENDS IN ASIA PACIFIC
The potential for outbound tourism growth from the Asia Pacific region is
tremendous. The continued rise of the middle class, increased market openness,
air connectivity, and travel facilitation are expected to fuel growth. Thus, it is
important for the industry stakeholders to keep up-to-date with the key drivers
impacting tourism growth, with the following being of particular influence and
impact.
The dominance of China:
Chinese tourists are already the world’s most powerful single source of demand,
yet its potential is far greater, as only an estimated 9 percent of the Chinese
population have currently been issued passports. China’s National Immigration
Administration revealed that for the first half of 2018, a total of 164.16 million
Chinese residents applied for their passports for private purposes, a 21% increase
from the previous year. 160 million, that’s half the size of America’s population
and 3 times the size of UK’s population according to the World Bank. The industry
expects 200 million Chinese to travel abroad in a few years’ time. The growth of
this market and its development potential will continue generating tremendous
business opportunities for tourism destinations, local tourism suppliers and service
providers.
Emerging India. The planet’s second-fastest-growing outbound market is steered
by similar socio-economic drivers as China, but garners less global face-time.
23Around 22 million Indians travelled overseas in 2017 spending approximately
USD19 billion, and the UNWTO has predicted Indian outbound travellers will total
50 million in 2020, contributing USD28 billion in expenditure. The average
propensity to spend of Indian holidaymakers is impressive, the LCC sector is
expanding and thriving outbound niches range from destination weddings to
extended family travel and MICE.
Asian Millennial Travellers
Millennials represent more than 45 percent of Asia Pacific’s population and 60
percent of the world’s millennials expected to live in Asia by 2020 and more
than one-third of the Asian millennial travellers will originate China or India
(Amaedus, 2017). With these millennials entering their peak earning and
spending years, with an estimated spending of $340 billion on international
travel by 2020, it’s not a market segment that destinations can afford to ignore.
Within our key source markets in the Asia Pacific, markets with high proportions
of millennials amongst its total leisure outbound travellers include the Philippines,
China, India, Indonesia and South Korea (Euromonitor International, 2014).
More so than the generations that have come before them, millennials are
embracing new technology, experiences, and ways of traveling. Millennial
travellers travel to take a break from their daily life while broadening their
horizons. They seek authentic experiences that allow them to get a taste of the
local culture and are more open to novel experiences compared to other
24segments. These travellers value autonomy over travel experience and being
extremely savvy with technology, they thrive on being connected and having
information at their fingertips.
Technological (R)Evolution
The rapid development of technology is one of the key factors that drive the
development of tourism industry. Worldwide, rapid adoption of mobile devices
has changed the way travellers’ research, shop and book travel and profoundly
altered how travellers’ access information while in destination. Nowhere is this
shift more evident than in Asia Pacific.
In 2019, Phocuswright projected that 55% of online travel bookings in the APAC
region will be made via a mobile device. By comparison, mobile share of the
online market will be just 25% in the U.S. and 30% in Europe. In a smartphone
saturated Asia pacific region, technology is largely shaping the travel
experiences of the outbound travellers from this region. China is the key driver of
APAC’s mobile dominance, with mobile in 2019 to account for nearly 80% of
China’s online travel gross bookings. Asia Pacific boasts three of the top five
mobile travel markets worldwide: India and Japan will each have projected
mobile travel penetration of 37% in 2019.
To stay competitive, product and service providers must adapt to and
implement new technologies to ensure traveller satisfaction. The influence of
25technology can be analysed under 3 components which are payment
methods, messaging systems, and digital advertisements.
Payment method
As mentioned, Chinese travellers’ have become the primary source for global
tourism industry. Nielson (2017) reported that although Chinese travellers’ will still
heavily rely on cash payment and cashless payment (bank cards), mobile
payment can help to increase their satisfaction during overseas travel.
Messaging system with extended functionality
The messaging system has become more critical as a tool to connect people
and for customer service, content-sharing, and information (Ho, 2018). The most
significant example is WeChat. Service and product providers are required to
integrate these new systems and their functionalities in their operation to stay
competitive. While traveller preferences vary by market, global social networks,
including Facebook, Twitter and Instagram, are popular in Asia Pacific, as well
as Asia Pacific -grown players like Weibo (China) and Line (Japan). Top
messaging platforms include Facebook Messenger, WhatsApp and China’s
super app WeChat.
Travel as a form of self-expression and self-actualization
Sabre (2017) published a study detailing four new types of travellers emerging in
Asia Pacific. The largest share of travellers falls into the category of ‘Explorers’,
26who place high value on discovery and self-actualisation. Travel is about
helping them grow as individuals. A one-stop approach is no longer valid in the
travel market. With travel becoming an important means of self-expression,
travel products and services need to be more personalized. Furthermore, as
travellers crave new and novel experiences - something that is ‘share-worthy’ -
hotels need to rise to the challenge and go beyond cookie-cutter rooms and
services to surprise and delight guests. Meanwhile, 20 percent of travellers are
‘Connectors’ and 18 percent are ‘Opportunists’, whose travel motivations are
mainly self-expression, self-indulgence, establishing status, and sharing
experiences.
Types of Emerging Travellers in Asia Pacific
Source: Sabre (2017)
27KEY GROWTH MARKETS
1) Chinese Outbound Market
The Chinese tourists have already become the most powerful market segment.
International outbound travel by China’s residents was around 68.7 million in
2016, and is forecasted to grow by an average of 8.5 percent per year to reach
103.4 million trips by 2021. Total outbound trips will grow much faster than total
household growth (8.5 percent versus 0.4 percent) over the forecast period
resulting in a ratio of outbound trips to households that is projected to reach 23.0
percent in 2021 from 15.6 percent in 2016. The disposable income per capita has
increased (Ho, 2018) and outbound travel will be dominated by the fast-growing
middle and higher-income households which together make up 35.7 percent of
all households (Mastercard, 2016). The role of Chinese travellers will continue to
be crucial in generating tremendous business opportunities and considerable
income in the future to tourism service providers.
28(excludes trips to HK and Macau) 2013 2014 2015 2016 2021 2016-2021
CAGR
Outbound trips (mn) 38.8 48.1 61.6 68.7 103.4 8.5%
Households (mn) 435.2 437.5 439.6 441.7 449.7 0.4%
Total outbound trips as % of total 8.9% 11.0% 14.0% 15.6% 23.0%
households
Source: Mastercard (2016)
Chinese travellers’ profile
Nielson (2017) conducted an in-depth study and analysis of current
consumption and payment behaviours of outbound Chinese tourists travelling
overseas. The top three categories of expenses by outbound Chinese tourists are
shopping, hotel accommodations, and dining. Regardless of destination country
or region, Chinese tourists tend to always spend the largest portion of total travel
expenses on shopping. Chinese tourists spent an average of USD 762 per person
towards shopping on their most recent overseas trip, while non-Chinese tourists
averaged USD 486.
The survey showed that to the Chinese travellers, tourist attractions and the
travel experience are more important factors than the costs that might be
incurred. The beauty and uniqueness of the destinations were an important
consideration in addition to the safety of the destination, ease of visa
29procedures and the friendliness of the local communities. Expedia Media
Solution (2017) indicated that the top 3 considerations that influence Chinese
travellers’ decision making before the trip include activities, food experience
and accommodations.
Factors that influence Chinese travellers when traveling overseas
Source: Nielson (2017)
Chinese tourists expressed that they desired to have unique experiences during
their travels, such as visiting historical sites, trying local cuisine, shopping for local
products, and various other unique options. Chinese travellers prefer natural
scenery and theme parks compared to cultural and historical attractions. In
Nielson (2017) study, the Chinese travellers reflect a preference for independent
or semi-independent travel followed by package travel.
TrekkSoft (2019) reported that the modern Chinese traveller wants an
experience of a lifetime. Chinese travellers are searching for experiences that
allow them to “travel like a local”. This shift in travel behaviour shows no signs of
slowing down. Chinese travellers are taking even more “independent” trips
(40%), while others are taking “modular” trips (40%) and only 20% still book
themselves on traditional packaged tours.
30Chinese tourists travel overseas mainly for leisure, such as dining and shopping.
However, there are minor differences in the travel objectives of Chinese
travellers among the various age groups. The millennials tend to be more
adventurous, the post-80s generation is more focused on shopping and
romantic getaways while the post-70s prefer a relaxing travel experience.
According to Travel China Guide, an average trip to countries nearby like
Japan or Thailand averages 6 to 9 days. For trips further from home, to
destinations like Australia, Europe and the United States, an average trip would
be 12.6 days. When it comes to visiting Europe, people tend to visit an average
of two countries per trip (TrekkSoft, 2019).
Globally, Travel China Guide (2018) reports the following to be the top
destinations for Chinese travellers:
1. Thailand
2. Japan
3. Singapore
4. Vietnam
5. Indonesia
6. Malaysia
7. Philippines
8. America
9. South Korea
10. Maldives
31Influence of technology
When it comes to mobile payments, China is leading the way. China is living in
3019 compared to the rest of the world. According to TrekkSoft (2019), by
October 2017, mobile payments grew by 37.8% compared to 2016, totalling USD
12 trillion, 50 times larger than America’s. Chinese travellers favour mobile
payments as it eliminates the risk of carrying cash and of exchange fluctuations.
As of 2018, eMarketer reports that adults in China will spend more time on their
mobile devices (2 hours 39 minutes) than they will watching TV (2 hours and 32
minutes). This is an 11.1% increase compared to 2017, taking up 41.6% of their
daily media time. Consumption of short videos is said to be the key driver of
increased mobile time.
The two dominant service providers for mobile payments are Alipay (54%) and
WeChat Pay (40%). Chinese consumers use their smartphones to scan a simple
QR Code and enter their password to easily make a payment. When travelling,
this habit spills across international borders with 65% of Chinese travellers making
a payment via mobile, compared to just 11% of non-Chinese travellers
(TrekkSoft, 2019). Companies interested in driving more Chinese travel spend are
going along with the trend. Chinese tech leaders are partnering with hotel
brands, retailers, and banks to create data-driven services and changing travel
booking trends and methods. A few examples include:
32• Travel agencies, hotels, and airlines are finding new ways to provide full brand
experience to their customers via WeChat. i.e.: control of hotel room (Caesar
Entertainment), check-in services (China Southern Airline), customer services (Air
France), Loyalty Program (IHG), etc.
• Alipay and WeChat are spreading rapidly throughout the world. The number
of foreign airports, retail stores, hotels, and other service providers accepting
Alipay and WeChat Pay has increased substantially.
Destinations and hotels need to adopt diverse marketing strategies, as well as
using popular Chinese technologies and media channels, to target Chinese
consumers. In addition, it must closely cooperate with Chinese tour operators,
leveraging on their understanding of, and influence in, the local market.
332) HALAL TOURISM
The burgeoning growth of the global Muslim travel population signals an
immense potential for Muslim travel related products and services. According to
the Mastercard-CrescentRating Global Muslim Travel Index 2017 (GMTI 2017),
there were an estimated 121 million Muslim international travellers in 2016, and
this is projected to grow to 156 million by 2020. This market segment has been
acknowledged as the ‘third one billion’ opportunity following the interest in
Indian and Chinese billions (Janmohamed, 2016) and predicted to reach 30% of
the world’s travel population by 2050 (Pew Research Centre, 2017).
Asia and the Pacific is the home to the largest population of Muslims. Of the
world’s 1.6 billion Muslims, an estimated 62% are in Asia, specifically in Indonesia,
(which has the largest number of Islamic adherents in the world with an
approximate 203 million), India, Pakistan, Bangladesh, Iran, China, Malaysia,
Brunei Darussalam, Afghanistan and the Maldives (Pew Research, 2017 ). In
addition, smaller minorities are present in Thailand, Sri Lanka, Philippines,
Cambodia, Singapore and Viet Nam. The growing middle-class of Islamic
countries in Asia and the Pacific with disposable income to travel has led to a
lucrative outbound market of Muslim travellers that has been targeted by many
“non-Muslim” countries in the region.
34FAITH BASED NEEDS OF MUSLIM TRAVELLERS
A total of 9 key faith-based needs that would influence the consumption
behaviour of Muslim travellers which includes (1) Halal Food, (2) Prayer Facilities,
(3) Water-friendly Washrooms, (4) No Islamophobia, (5) Social Causes, (6)
Ramadhan Services, (7) Local Muslim Experiences, (8) Recreational Spaces with
Privacy and (9) No Non-Halal Activities (Mastercard-CrescentRating, 2019).
These factors are grouped under 3 different sections (1) need to have, (2) good
to have and (3) nice to have.
• Need to have
Halal food is the most important factor that a Muslim traveller needs when
travelling. Restaurants that can be easily identified as Halal is the mostly wanted
by Muslims. Next, the availability of prayer facilities with prayer rooms, qibla
directions and ablution friendly washrooms are needed by Muslim travellers.
Thirdly, water-friendly washrooms as water plays an important role in purity and
cleanliness for Muslims. These facilities have become easier now that there is a
widespread availability of hand showers, bidets and Japanese-style toilets.
With increasing hate crimes seen around the world, safety has become a
primary concern for Muslims travellers. In addition, Islamophobic sentiments has
been lingering in some regions and Muslim travellers are not encouraged to
travel to destinations that are perceived to be unwelcoming. Also, with
35increasing hate crimes around the world, safety and security has become a
primary concern for Muslim travellers (Mastercard-CrescentRating, 2019).
• Good to have
Good to have services includes Social Causes, Ramadhan Services and local
Muslim Experience. Driven by faith and global trend towards sustainability,
Muslims are becoming more conscious of being socially responsible during their
travels. Social causes include the ability to improve local living conditions,
various green initiatives to perfect the environment and eco-friendly tourism
practices.
Ramadhan services include the provision of Suhour and Iftaar meals, prayer
facilities, services during the Eid among others, Even though Muslims are most
unlikely to be traveling, there are a few Muslims that wishes to be away from
home during the period. Destinations that wishes to attract Muslim travellers
during this period need to be able to accommodate their special needs during
this month.
Local Muslim experiences which refers to experiences unique to the destination
that allows Muslim travellers to connect with their Muslim identity and heritage.
This could include visiting Islamic heritage sites, interacting with local Muslim
communities at a local mosque or experiencing the country with a Muslim tour
guide (Mastercard-CrescentRating, 2019).
36• Nice to have
The nice to have services include: Recreational Spaces with Privacy and no
Non-Halal Activities. Recreational Spaces with Privacy refers to facilities such as
swimming pools and gyms, beaches, spas and beauty salons that provides
privacy for males and females. This is especially important for females as they
need to have appropriate modesty. No Non-Halal Activities are regarded as
nice to have as some Muslims would prefer to avoid facilities and activities that
serve alcohol or staying in gambling resort.
KEY MARKET SEGMENTS
Within the broader Muslim travel market in the region, two key markets have
been given prominence due to their growth potential, namely the Muslim
women travellers and the Muslim millennial travellers (MMT).
Muslim female travellers usually travel with their friends and family to seek for
new and authentic experiences. The Muslim identity and religious beliefs largely
influence the Muslim women′s tourism experiences, lifestyles and travel patterns
and/or behaviors. With sharing their experiences, they hope that it would be an
inspiration to others. They have a stronger influence in planning their trips
whether they are travelling alone, with their family or friends (Mastercard-
CrescentRating, 2018). Muslim female travellers find it important to have gender-
segregated facilities such as swimming pools, gyms, spas or saunas for privacy
37as it would affect them since they are required to have appropriate modesty
(Razzaq, Hall & Prayag, 2016). They would usually travel for leisure or to distress.
The Muslim millennials The Muslim millennials are tech-savvy, self-empowered
and enthusiastic consumers whose identities proudly encompass both faith and
modernity. Muslim millennial travelers are distinct from their previous generations
and other millennial travelers, with a unique set of values, needs and
expectations in their travel consumption and expenditure patterns. They often
spend more time and effort to conduct comprehensive research before making
travel arrangements.
The Muslim millennial travellers mostly travel for leisure and holidays,
experiencing local culture and heritage, and visiting friends and relatives
(Mastercard-CrescentRating, 2017). On average, they travel 2 to 5 times a year,
and are generally cost conscious. When planning for trips, the top 3 factors that
would influence them were cost of flights and accommodation, safety and
tourism concerns and availability of Halal food (Mastercard-CrescentRating,
2017).
For Muslim millennial travellers, they prioritise affordability, location and free Wi-Fi
when selecting an accommodation. Specifically, for Muslim-friendly services
and facilities, they value availability and proximity of Halal food options,
mosques and prayer facilities and water-friendly facilities. When booking for
flights, ticket pricing, safety records, baggage allowances and Halal meal
38choices were important considerations. They also preferred Halal assured and
certified places but would not mind dining in a seafood-only or vegetarian-only
restaurant. Finally, they love to share their photos during their travels on social
media pages such as Instagram, Facebook and Snapchat (Mastercard-
CrescentRating, 2017).
RANKING OF SOUTH AFRICA AS A MUSLIM FRIENDLY DESTINATION
The global Muslim population is diverse and geographically distributed into
segments in Muslim majority destinations as sizeable minorities in other
destinations. According to the Regional Analysis of GMTI 2017 Scores, Africa is
the third best region that is friendly for Muslim travellers (Mastercard-
CrescentRating, 2017) reflecting the regions concerted efforts in adapting and
improving their services to attract the Muslim travel market.
South Africa is one of the destinations that is ranked well in the Global Muslim
Tourism Index 2019. South Africa is ranked 29 under the GMTI global ranking and
6 under the top 10 Non-OIC destinations. It is evident that South Africa is
becoming more friendly for Muslim tourists. South Africa is also ranked under the
top 10 destinations in terms of ease of communications where there are
outreach initiatives that includes public education, media outreach and Muslim
visitor guidebooks.
Cape Town has a rich Muslim history and heritage, with the Cape Malay
Muslim’s making up around a quarter of the city’s population. It was ranked as
39the 4th best travel destination for Muslim travellers in the 2017 Global Muslim
Travel Index.
Key Drivers in the Muslim Travel Market in South Africa
• Mosques, kramats, and prayer rooms
The Cape Town city offers prayer rooms in major centres and a large number of
mosques found across the province. It is also the home to the oldest mosque in
South Africa, dating back an impressive 200 years. There are also a number of
Kramats, known collectively as the Circle of Saints or the Ring of Kramats.
• Muslim Community
Cape Town is the place for South Africa’s first Muslim settlers and the Cape
Malay Muslim’s make up around a quarter of the city’s population.
• Culture and Heritage
The Bo-Kaap area in Cape Town, which was formally known as the Malay
quarter, is still home for many Muslims. In the area that is popular for its rainbow-
like houses, there are more than seven mosques. The Bo-Kaap museum
highlights the early contribution of Muslim settlers to Cape Town and a major
attraction to Muslim travellers.
Halal food options
Cape Town, renowned for its’ gastronomy, is the food capital of the Western
Cape. Recently, halal restaurants serving these traditional dishes have been
40increasing, making it possible for Muslim travellers to enjoy local food and
observe their faith-based needs.
Muslim friendly hotels
Major chains, such as Hilton, One and Only, have introduced Muslim-friendly rooms.
These rooms include a prayer mat and the Qur’an. The rooms are also free of alcoholic
drinks. All the food that is prepared in the kitchen is made without alcohol and pork. The
Hilton Cape Town City Centre kitchen is completely ‘halal’.
KEY DRIVERS IN THE MUSLIM TRAVEL MARKET IN SOUTH AFRICA
With the increasing growth in the Muslim Travel Market, more businesses and
destinations are now entering the industry to better cater to the needs of the
Muslim travellers by adapting their products and services. The increase in Muslim-
friendly destinations creates a virtuous cycle, creating more opportunities for
Muslim to travel.
IMPLICATIONS FOR SOUTH AFRICA
• Market Outreach
As South Africa is ranked under the top 10 destinations in terms of
communication, South Africa has outreach initiatives which includes public
education, media outreach and Muslim visitor guidebooks. However, to attract
more international clientele, Western Cape could leverage on these initiatives
41as well as use the right channels and the right language medium (e.g. English,
Arabic and Malay) to reach the target market in the Asia Pacific region. A
concerted effort needs to be made to build online content to attract and
improve its overall global Halal destination branding (Mastercard-
CrescentRating, 2018)
• Muslim Visitors Guides (MVG)
More travel information, recommendations and tips for Muslim visitors should be
curated and organised into province-specific Muslim Visitors Guides (MVG).
Besides publishing it in English, the MVG should also be made available in Malay
and Arabic, as these are among the common languages spoken among the
Muslim population (Mastercard-CrescentRating, 2018)
• Halal Tourism Stakeholder Workshops
Western Cape could organise more Halal Tourism workshops to educate tourism
stakeholders with varying degrees. Workshops and discussions should be carried
out for better improvement of the Western Cape’s halal positioning
(Mastercard-CrescentRating, 2018)
• Language courses for tour guides and hospitality workers
English, Malay and Arabic are some of the most widely spoken languages
among the Muslim population in the region. English, Malay and Arabic
language courses and training should be conducted for tour guides and
42employees in the hospitality and tourism sector to better serve the Muslim
travellers
• Improve Wi-Fi Network Coverage
Travellers perceive staying connected as being of high importance when
travelling as it allows them to navigate their travels, search for information and
book tourist services such as lodging, transportation and activities and even
sharing of their travel experiences on their social media platforms to their
personal network. Therefore, improving Wi-Fi network coverage and introducing
Wi-Fi hotspot is important and this is not just limited to airports but other public
areas such as convenient stores, restaurants, hotels and malls (Mastercard-
CrescentRating, 2018)
• Enabling Climate
With the huge potential of Halal Tourism, the Western Cape province should
develop an enabling climate for start-ups and innovation for Halal-related
services to flourish. Many services in the hospitality sector today have been
disrupted by the proliferation of digital technologies. By enabling a vibrant
environment for start-ups, Halal Tourism services and products will be able to
integrate latest technologies and business models (Mastercard-CrescentRating,
2018.
• Championing Sustainability and Community Initiatives
43With its ready beautiful locations that highlight the wonders of nature, Western
Cape could package services around travel themes that promote sustainability
and the care of the environment. This can further attract the Muslim millennials
who are attracted to serving Islam’s message of preserving the environment
while enjoying their travel experiences and travellers in general who value
sustainable tourism.
• Position Halal Benefits for All Guests
Although Halal Tourism mainly target Muslim travellers, the concept can also
have a universal appeal for non-Muslims due to numerous benefits such as
peace and security, family-friendly environments and water-friendly services.
The non-alcoholic nature of some Halal hotels and restaurants can also attract
families who are looking for an overall environment which they perceive to be
family-friendly (Mastercard-CrescentRating, 2018)
• Halal Certification and Rating
Halal certification and rating is necessary as it provides assurance, diminishes
possible scepticism and instils trust and confidence in Muslim consumers
(Mastercard-CrescentRating, 2018). As such, such Halal assurance will also be
valued by Muslim travellers as they look for their idea hotels and restaurants.
44Following this trend for standardisation, global Halal assurance and rating
schemes such as Crescentrating will also assist the country in obtaining better
acceptance from guests around the world.
• Increase in Global Service and Governance Standard
The drive to develop the tourism space represents an opportunity for South
Africa to further strengthen its level of hospitality services and governance
standards (Mastercard-CrescentRating, 2018). Beyond infrastructure and skills
development, adequate and integrated Halal assurance across its service value
chains which communicate both permissibility and high quality is key to
attracting both Muslim and non-Muslim travellers to its destinations. Hotel staff
should be trained and educated about Muslim travellers’ values and teachings
to be able to cater to halal conscious tourists in accordance to Islamic principles
(Mastercard-CrescentRating, 2018). Gender-separated facilities such as
gymnasiums, spas and family entertainment will further enhance its offering for
this market segment.
• Differentiated Destination Strategies
Western Cape can capitalise on its diverse regions to cater to a variety of
Muslim travellers who may have different travelling profiles (Mastercard-
CrescentRating, 2018). Muslim millennials who may be looking for more
authentic experiences can savour its many off beaten tracks while still
connected via WIFI to share their experiences, whereas family travellers may be
45greeted with more warmth and developed service-oriented facilities at resorts.
These differentiated activations of destination-spaces can attract a wider
variety of Muslim travellers from around the world and further improve the
country-branding of Western Cape as a safe and vibrant destination for all
(Mastercard-CrescentRating, 2018).
• Innovative Tourism Products and Experiences
Western Cape con converge with other Islamic economy sectors and bundle
them into innovative tourism products (Mastercard-CrescentRating, 2018). For
example, the province can include Islamic heritage sites and religious travel
experiences with activities pertaining to culture and heritage in a unique and
innovative travel package (Mastercard-CrescentRating, 2018).
• Enhanced Prayer Spaces and Facilities
For Muslim women, the need for proper ablution facilities is high (Mastercard-
CrescentRating, 2018). Most of the ablution areas at mosques or prayer spaces
are in a public area and there is little privacy for Muslim women who are
covered. By providing proper ablution areas and water-friendly facilities and
thus making it convenient for Muslim travellers, it can add value to their travel
experience.
46ASIA PACIFIC OUTBOUND TOURISM TO SOUTH AFRICA Tourists Arrivals South Africa recorded 10.5 million international tourist arrivals in 2018, a +1.8% increase compared to 2017. The Asia Pacific region contributed 442, 330 arrivals in 2018. The top outbound markets were Australia, China, India, Japan and South Korea. International tourism arrivals from this region declined by -2.0% in 2018 to reach a total of 310 982. All major markets except for Japan (+0.5%) declined in 2018. China (-0.2%), India (-4.6%), Malaysia (-19.6%), Singapore (-7.1%) and South Korea (-1.4%). The tourism revenue generated from this region decreased further by -6.4% to a total of R5.3 billion. Tourist arrivals from China decreased by 0.2% in 2018 compared to 2017. For Chinese tourists, South Africa has become more of a VFR (31.1%) and business events (20.0%) destination in 2018. The share of VFR tourists increased from 25.5% in 2017 to 31.1% in 2018 MICE tourists increased from 19.4% in 2017 to 20% in 2018. The holiday travel to South Africa from this market dropped to 29.8% in 2018 from 36.3% in 2017. South Africa experienced a decline in holiday arrivals from China since 2016. However, arrivals have started to improve since April 2018 with the Western Cape recording a positive growth out of this market.
South Africa experienced stiff competition from destinations in the Europe in

luring the Chinese outbound travellers. Improved air connectivity in addition

to the EU-China Tourism year initiative by EU Commission President Jean-

Claude Juncker and the Chinese Premier Li Keqiang in 2018 encouraged

travel and investment between EU countries and China.

Tourist arrivals from India declined by 4.6% in 2018 compared to 2017. The

declines in volume are driven by declines in MICE, holiday and VFR tourists.

Majority of the Indian travellers (1 out of every 2 tourists from India) visit South

Africa as either a business traveller (corporate travel) or a MICE tourist. The

share of business travellers travel increased to 25.4% in 2018 from 18.9%. The

share of first-time travellers to SA increased to 54.5% whereas the repeat

travellers declined.

International tourist arrivals from Australia (a key source market), New

Zealand and the Pacific declined by -1.8% in 2018 to a total of 131 348.

Tourism receipts declined by -4.2% to R2.3 billion. The average nights

increased to 15.8 nights to a total of 1.9 million bed nights. Australian arrivals

declined by -0.4% to 115 846. The share of holiday arrivals dropped from

62.5% to 53.2% while VFR has increased from 24.3% to 27.4%. New Zealand

declined by -11.0% and has been declining for the past 2 years since the

reciprocal introduction of visas in 2017.
International arrivals from Asia Pacific

                                INTERNATIONAL ARRIVALS
                                       2016      2017      2018     % Growth
 Asia                                 327 890   317 181   310 982       -2%
 China (incl. Hong Kong)              116 946   97 069    96 915      -0.20%
 India                                95 377    97 921    93 428      -4.60%
 Japan                                25 802    27 410    27 541      0.50%
 Malaysia                              8 713     9 282     7 460     -19.60%
 Singapore                             8 367    10 964     9 093     -17.10%
 South Korea                          18 840    22 173    21 868      -1.40%
 Other Asia                           327 890   317 181   310 982     -2.00%

 Australasia                          131 856   133 713   131 348    -1.80%
 Australia                            109 146   116 257   115 846    -0.40%
 New Zealand                          22 443    17 094    15 213    -11.00%
 Other Australasia                    131 856   133 713   131 348    -1.80%

Source: South Africa Tourism (2019)
Source: South African Tourism (2019) Provincial Distribution: Western Cape Total number of international tourists that visited Western Cape increased by 0.2% to a total of 1.7 million. Arrivals decreased from the following key source markets: UK, Namibia, Netherlands and Australia. All other source markets recorded increases in arrivals to the province. The city of Cape Town received 2.6 million international visitors in 2018 with a growth of 11.5% in international arrivals at Cape Town International Airport. Outbound travel from Asia Pacific to Western Cape recorded 191919 arrivals and the major source markets being China (57868), Australia (53843), India (31,402), Japan (11665), South Korea (7684) and New Zealand (7252).
INTERNATIONAL TOURIST ARRIVALS- PROVINCAL DISTRIBUTION
                                               2018
                                                                           Nor
                                                                           th
                          Western   Eastern    Kwazulu   Mpuma    Limpop   We    Norther   Free
                Gauteng    Cape      Cape       Natal     langa      o      st   n Cape    State
 Asia           45 196    31 1447      5 442   10 220    5 762    2 250    826    5 439    1 968
 China (incl.
 Hong Kong)     16 688    12 265       2 707    3 080    2 143    1 140    324    2 134    827
 India          13 388     6 321       859      2 479    1 297     255     273    1 798    439
 Japan           3 912     3 237       388      1 165     778      198     44     287      223
 Malaysia        1 149     931         149      149       188       89     15      99       60
 Singapore       1 976     1 777       100      100       361       0      36     236      100
 South Korea     3 037     1 956       396      770       550      439     48     319      242
 Other Asia      5 045     4 659       843      2 477     445      129     86     566       77

 Australasia    17 358    18 257       4 693    4 928    8 793    3 131    456    3 003    690
 Australia      15 515    16 172       4 407    4 427    7 857    2 681    385    2 534    647
 New Zealand     1 823     2 086       286      500       936      449     71     468       43
 Other
 Australasia      20         0          0        0         0        1      0       0        0

Source: South African Tourism (2019)

Source: South African Tourism (2019)
Purpose of Travel
Travellers from Asia Pacific visited South Africa mostly for holiday and for
visiting friends and relatives (VFR). A substantial share of Asian travellers also
visited South Africa for MICE (21%) and Business travel (15%). Medical tourism
and shopping tourism (personal and business) were not popular among the
Asia Pacific travellers.
Purpose of Travel
2018
Shopping Shopping Business Religio
Holiday (personal) (business) traveller MICE Medical VFR n Other
27.7 21.1 0.10 27.7 0.3 7.90
Asia 0% 0.00% 0.20% 15% 0% % 0% 0% %
China (incl. 29.8 12.80 0.00 31.1 0.0 5.70
Hong Kong) 0% 0.00% 0.60% % 20% % 0% 0% %
22.9 25.40 26.4 0.00 11.4 0.6 13.3
India 0% 0.00% 0.00% % 0% % 0% 0% 0%
13.40 21.1 0.00 23.4 0.0 8.10
Japan 34% 0.00% 0.00% % 0% % 0% 0% %
35.4 0.00 15.5 0.0 7.50
Malaysia 34% 0.00% 0.00% 7.50% 0% % 0% 0% %
42.6 23.6 0.00 16.7 0.0 8.30
Singapore 0% 0.00% 0.00% 8.80% 0% % 0% 0% %
27.5 13.0 1.7% 46.2 0.0 5.20
South Korea 0% 0.00% 0.00% 6.40% 0% % %% 0% %
21.0 10.60 15.3 0.00 47.0 1.1 5.10
Other Asia 0% 0.00% 0.00% % 0% % 0% 0% %
52.7 4.10 20.0 28.3 1.0 6.80
Australasia 0% 0.00% 0.00% 6.90% % 0% 0% 0% %
53.2 3.60 20.0 27.4 1.2 7.10
Australia 0% 0.00% 0.00% 7.30% % 0% 0% 0% %
48.6 7.40 0.00 36.0 0.0 4.70
New Zealand 0% 0.00% 0.00% 3.30% % % 0% 0% %
Other 50.0 45.0 0.00 0.00 5.0 0.00
Australasia 0% 0.00% 0.00% 0.00% 0% % % 0% %
Source: South African Tourism (2019)Majority of the Asia Pacific travellers were first time visitors to South Africa, and
a quarter of the visitors have revisited South Africa 2-3 times.
First time and Repeat visitors
2018
First 2-3 4-5 6-9 10 times or
timers times times times more
Asia 48.30% 22.60% 10.70% 9.30% 9.10%
China (incl. Hong
Kong) 45.10% 25.30% 9.40% 10% 10.30%
India 54.50% 19.30% 11.50% 8.50% 6.20%
Japan 47.80% 19.80% 13.20% 10.60% 8.70%
Malaysia 56.20% 7.80% 17.70% 6.90% 11.40%
Singapore 45.10% 21.20% 11.30% 7.20% 15.20%
South Korea 41.50% 27.30% 13.70% 6.20% 11.20%
Other Asia 49.70% 22.30% 9.00% 10.00% 9.00%
Australasia 44.40% 23.40% 12.60% 10.10% 9.50%
Australia 44.80% 22.70% 12.30% 10.60% 9.60%
New Zealand 41.70% 29.10% 14.70% 6.30% 8.20%
Other Australasia 50.00% 0.00% 37.50% 0.00% 12.50%
Asia Pacific Total Foreign Spending
International tourists spent R82.5-billion in 2019 and the average amount
spent by tourists directly in South Africa was R8 200. This declined by - 2.4%
(R100) compared to 2017. Visitor spending in Western Cape amounted to
R16.3 Bn. Cape Town (R1 147.31) and the Western Cape (R1 029.19) as a
whole achieved the highest revenue among all provinces and top cities in
2018.Total foreign direct spending by travellers from Asia and the Pacific totalled R5,338726481 and R2,307 862 394 respectively. The biggest spenders were from China, Australia, India, Japan, New Zealand and South Korea. The New Zealanders spent the highest average amount per traveller (R 21 808), followed by Australians (18 965), Chinese (18 858), Malaysians (17 480) and Singaporeans (16 389). Total Foreign Direct Spending by Travellers Source: South African Tourism (2019)
TOTAL FOREIGN DIRECT SPEND BY COUNTRY
                                2016              2017              2018         % Growth
 Asia                      R 3 522 281 763   R 4 204 171 081   R 5 338 726 481    27.00%
 China (incl. Hong Kong)   R 1 075 909 313   R 1 401 438 043   R 2 371 666 767    69.20%
 India                     R 1 201 670 653   R 1 367 320 414   R 1 299 727 386    -4.90%
 Japan                     R 275 610 924     R 332 493 791     R 390 087 262      17.30%
 Malaysia                  R 145 732 789     R 146 505 728     R 120 927 328     -17.50%
 Singapore                 R 133 478 141     R 152 626 907     R 144 615 552      -5.20%
 South Korea               R 184 941 375     R 253 039 050     R 291 084 240      15.00%
 Other Asia                R 504 938 559     R 550 495 372     R 720 478 269      30.90%

 Australasia               R 2 319 996 930   R 2 408 704 391   R 2 307 862 394    -4.20%
 Australia                 R 1 904 760 939   R 2 408 704 391   R 307 862 394      -4.80%
 New Zealand               R 414 499 389     R 299 299 134     R 301 117 518      0.60%
 Other Australasia           R 736 601         R 823 389         R 376 550       -54.30%

Source: South African Tourism (2019)

Average amount spent per traveller

Source: South African Tourism (2019)
You can also read