Forests and Water in the Sierra Nevada: Sierra Nevada Watershed Ecosystem Enhancement Project
←
→
Page content transcription
If your browser does not render page correctly, please read the page content below
Forests and Water in the Sierra Nevada: Sierra Nevada
Watershed Ecosystem Enhancement Project

Roger C. Bales, John J. Battles, Yihsu Chen, Martha H. Conklin, Eric Holst, Kevin
L. O’Hara, Philip Saksa, William Stewart

November 29, 2011

Sierra Nevada Research Institute,   Center for Forestry,   Environmental Defense
           UC Merced                   UC Berkeley                 Fund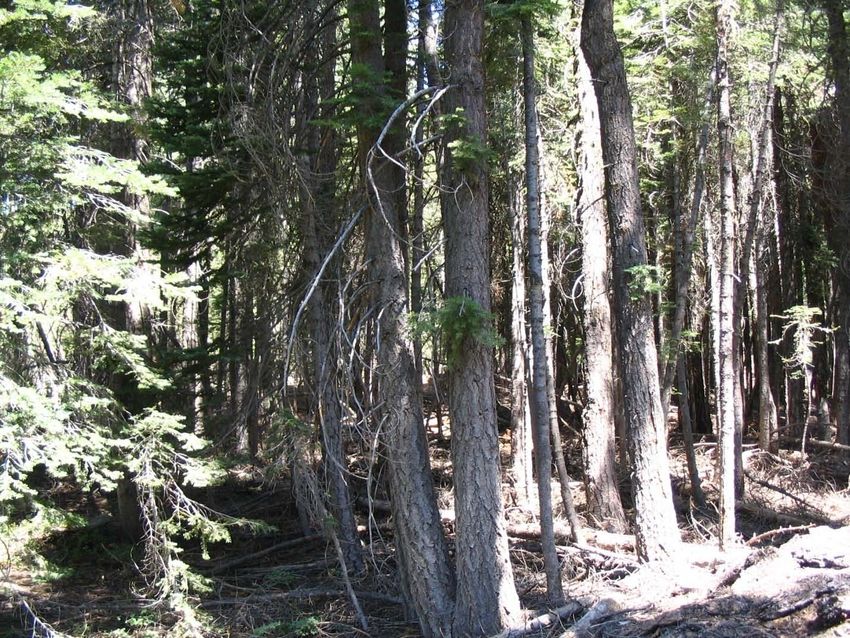
Forests and Water in the Sierra Nevada: Sierra Nevada
Watershed Ecosystem Enhancement Project

Roger C. Balesa, John J. Battlesb, Yihsu Chena, Martha H. Conklina, Eric Holstc, Kevin L.
O’Harab, Philip Saksaa, William Stewartb

November 29, 2011

a
    Sierra Nevada Research Institute, University of California, Merced, 5200 N. Lake
    Road, Merced, CA 95343
b
    Center for Forestry, University of California, Berkeley, 163 Mulford Hall #3114
    Berkeley, CA 94720-3114
c
    Center for Conservation Incentives, Environmental Defense Fund, 1107 9th St, Suite
    1070, Sacramento, CA 95814

Sierra Nevada Research Institute report number 11.1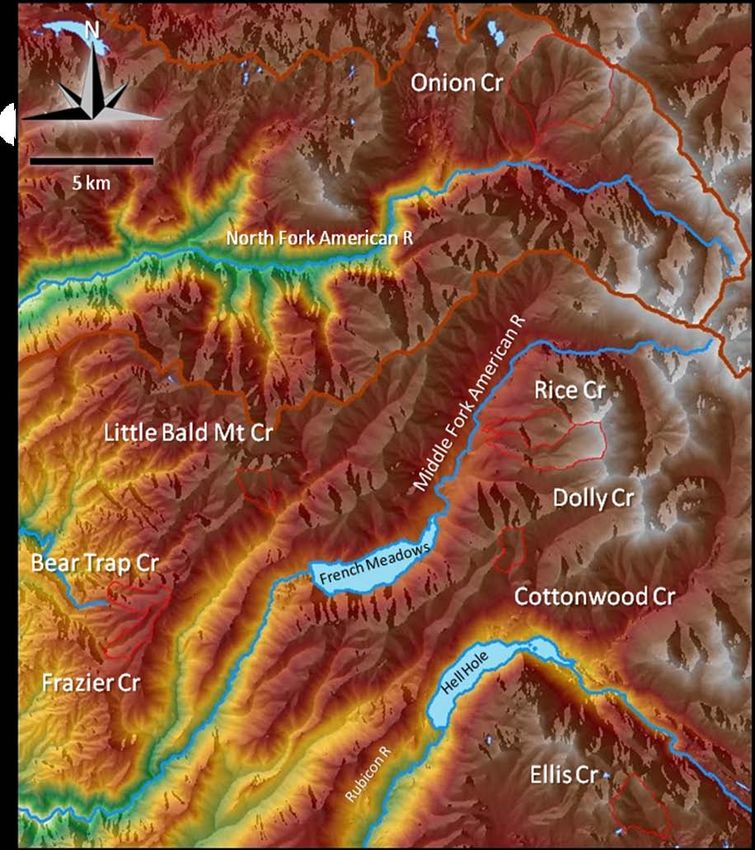
Table of Contents
1. Executive Summary................................................................................................................... 1
2. Introduction .............................................................................................................................. 3
           Sierra Nevada ecosystem services .................................................................................... 3

           Hydropower in the Sierra Nevada .................................................................................... 5

           Climate change and Sierra Nevada water ......................................................................... 6

           Focus of this study ............................................................................................................ 7

3. Background on Forest Hydrology ……………..………..…………………………………… 9
           Water and energy budget in mountain forests .................................................................. 9

           Forest management and water ........................................................................................ 12

           Forest management and snow ......................................................................................... 15

4. Why Forest Management Matters for Water ..……...........................……………………… 19
5. Proposed SWEEP Program and Approach ………….............................…………................ 21
           General watershed features ............................................................................................. 21
           Onion Creek Experimental Forest ................................................................................... 25
           Treatment Plan ................................................................................................................. 28
6. Acknowledgements ……............…………………………………………………………… 33
7. References …………………………………………………………………………………. . 35

                                                                                                                                               iii
1. Executive Summary
     In this white paper on the Sierra Nevada Watershed Ecosystem Enhancement Project
(SWEEP), we make the case that upstream management of Sierra Nevada forests can
significantly increase the value of downstream water resources by shifting water towards higher
value uses and optimizing the timing of runoff. The focus of this paper is on the west-side
mixed-conifer forests at elevations of about 1500-3600 m (5000-12,000 ft), which are highly
productive owing to the availability of sufficient water, predominance of above-freezing
temperatures and presence of other conditions necessary for growth.
     California has a Mediterranean climate, with wet
                                                                    Historically, the unique
winters and dry summers. Precipitation falling as rain on
Sierra Nevada forests enters the soil and is partitioned            character of Sierra
between evapotranspiration and runoff. Much of the rainfall         Nevada forests was
leaves the forest as evapotranspiration, owing to ample water defined by tall trees,
storage in the subsurface and temperatures that allow growth        relatively mild climate
year round. At higher elevations, e.g. above elevations of          and low forest density.
1800-2100 m depending on both latitude and microclimate,
which are dominated by snow rather than rain, the snowpack provides an important seasonal
storage of water that, together with subsurface-water storage, provides the water needed for
forest growth over the summer and fall. Forest thinning to reduce vegetation and thus
evapotranspiration will result in a higher fraction of precipitation, particularly snowmelt, leaving
the mountain forest as runoff.
     Historically, the unique character of Sierra Nevada forests was defined by its tall trees,
relatively mild climate and low forest density. In many areas, current forest densities are much
higher than historical values. Forest thinning can also influence the timing of snowmelt and
runoff. That is, a less-dense canopy can allow snow to reach the ground rather than be held in
the canopy; and strategic spacing of forest openings will limit early season sunlight reaching the
forest floor and retard snowmelt.
     In this paper we review the forest hydrology literature relevant to management of conifer
forests in the Sierra snow zone, as that management affects the timing and amount of snowmelt
runoff. In order to understand the conceptual and practical
                                                                    First-order estimates
challenges, we summarize the key elements of forest energy
budget, with specific reference to the Sierra Nevada, and           based on average
describe several relevant case studies. Although principles         climate suggest that
that govern the mountain water cycle are well known and             reducing forest cover
models of water and energy balance are informed by field            by 40% of maximum
measurements in some areas, there is a severe knowledge             levels across a
gap that limits quantitative predictions of the effects of forest
                                                                    watershed could
thinning on Sierra Nevada water and energy cycles.
Nevertheless, generalizations from reviews of paired                increase water yields
catchment studies carried out elsewhere suggest that Sierra         by about 9%.

                                                                                                   1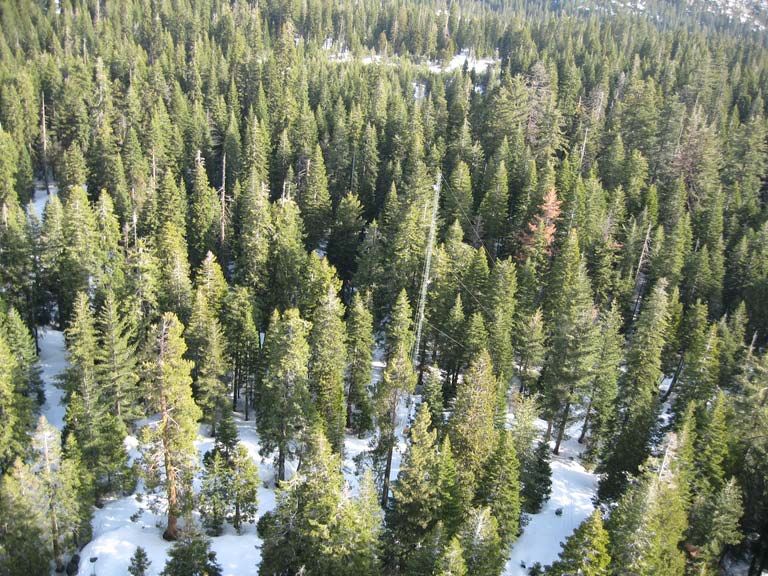
Nevada conifer forests contain ecological attributes with a high potential for water-yield gains.
Historical studies of forest harvesting in the Sierra Nevada have shown increases of between 14
and 34% in snow accumulation. Treatments that increase
                                                                   Sustained, extensive
snow accumulation help increase water yield during low
flows, when water resources’ economic and ecosystem
                                                                   treatments in dense
values are highest.                                                Sierra Nevada forests
     Preliminary estimates based on average climate                could increase water
information suggest that in the Sierra Nevada, treatments          yield by up to 16%.
that would reduce forest cover by 40% of maximum levels
across a watershed could increase water yields by about 9%.
     Note that this white paper focused on forest management effects on the water balance.
Impacts on wildlife habitat, forest health, and fire behavior were not analyzed. The projections
and models reported here are designed to describe the potential for modifying water yield and
timing. Before implementation of any strategy, a wider consideration of the consequences on
forest structure and function would be necessary.
     Because of the potential for water-yield increases and extended snow storage, the SWEEP
project has developed a plan to evaluate forest thinning
related to water yield in representative headwater catchments
                                                                   Even small increases in
in the Sierra Nevada, as a basis for extending these               water yield or
treatments to broader areas of the Sierra Nevada. To that          improvements in the
end, we outline an experiment that could be carried out in         timing of water flow in
the Onion Creek Experimental Forest, Tahoe National                the large area of mixed-
Forest, Placer County, California that could test silvicultural
                                                                   conifer forest are
treatments designed to modify the water balance of mixed-
conifer, snow-dominated catchments. The treatments are
                                                                   important because of
based on a leaf area index (LAI) approach (O’Hara 1998) to         the high value of water
forest management, which is well-suited to water yield and         used by both
timing objectives. Our initial estimates are that treatments       hydroelectric facilities
could increase water yield as much as 16% and extend snow          and downstream users.
storage, i.e. delay snowmelt, by days to weeks.

    2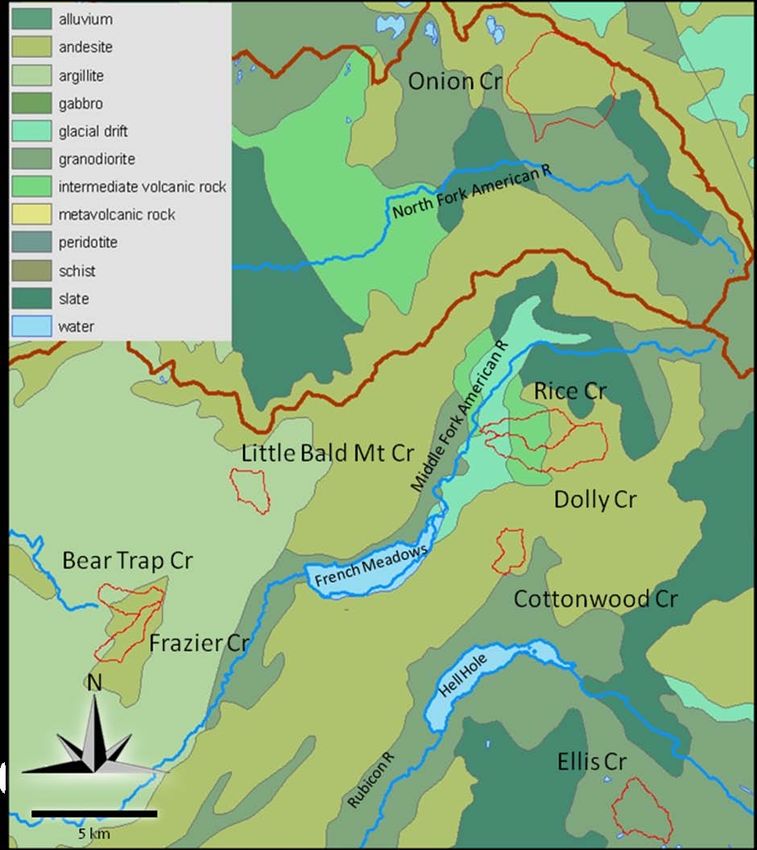
iv
2. Introduction
     The Sierra Nevada contains the headwaters of 24 major river basins, with the majority of the
runoff being on the west side and draining into the Central Valley (Figure 1). Most of these are
east-west trending watersheds that dissect the Sierra into steep canyons. The major vegetation
zones of the Sierra form readily apparent large-scale elevational patterns. A broad conifer zone
begins at 300-900 m (1000-3000 feet) elevation on the west and 900-1500 m (3000 -5000 feet)
on the east side. Under pre-European
conditions, fires and other disturbance events
regularly burned patches of trees, leaving
openings that passed through continuous but
distinctive phases as they aged. This
succession of a forest through time between
major disturbances is important for plants and
animals that use different stages as habitat.
Within the last 100 years, human influence
increased in which resource use was more
regulated and forest and range protection was
emphasized. Suppression of fires became a
primary goal of federal, state and private
efforts (Fites-Kaufmann et al. 2007).
Sierra Nevada ecosystem services. The
forests of the Sierra Nevada deliver important
benefits to the citizens of California and the
rest of the world. With the extensive
exploitation that began with the 1849 gold
rush, the Sierra Nevada has provided
considerable timber, feed for grazing animals,
and irrigation water for local agriculture.
Over the past half century, the development of
water projects for regional irrigation systems
and hydroelectric power surpassed all other
products and services in terms of financial        Figure 1. Satellite image of California showing
                                                   snow-covered Sierra Nevada. Courtesy of NASA
payments (Stewart 1996). Other benefits, or
“ecosystem services” derived from Sierra
Nevada forests include clean air, fresh water, wildlife habitats, nutrient cycling, carbon storage,
and recreational opportunities. The concept of valuing ecosystem services has recently received
considerable attention as a means to ensure investment and management of sustainable
ecosystems (e.g., Millennium Ecosystem Assessment 2003, Collins and Larry 2007, Daily and
Matson 2008, Smail and Lewis 2009). However, there are only a few instances when ecosystem
values have been quantified and mechanisms developed to compensate landowners for providing

                                                                                                  3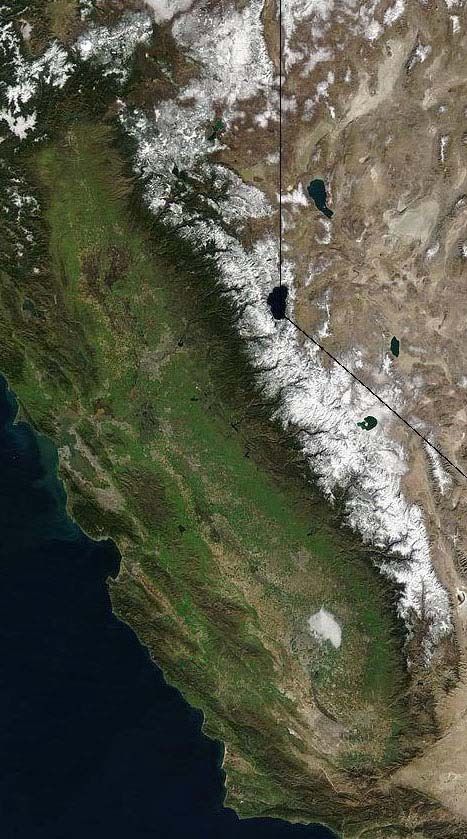
these services. For example in 1996, New York City valued the quality of water delivered from
their primary watershed in the Catskill Mountains to be between $6-8 billion in capital costs and
$300 million in annual operating costs. These estimates were based on the expenses associated
with building and operating a water filtration plant required to meet federal standards for water
quality. New York chose to avoid these costs by investing more than $1.5 billion to maintain the
natural and social integrity of the Catskills and thereby ensure the quality of their water
(Chichilnisky and Heal 1998, Jackson et al. 2001). To date, New York’s watershed investment
program has provided the financial, technical, and political support to reduce non-point pollution
from farms, improve forest management, restore stream corridors, upgrade local sewage
treatment systems, remediate leaky septic fields, and acquire conservation easements of sensitive
ecosystems (www.nyc.gov/dep). Essential to New York’s success was the means to compensate
landowners (individuals and communities) for the ecosystem services their lands deliver.
Without this link, there is limited incentive to protect or improve these services. One of the most
valuable services provided
by Sierra Nevada forests is
the clean water that flows
downhill to fuel
California’s economy and
support freshwater,
estuarine, and terrestrial
ecosystems. About two
thirds of the precipitation
that falls on the Sierra
Nevada is evaporated or
transpired by vegetation
and one third runs out of
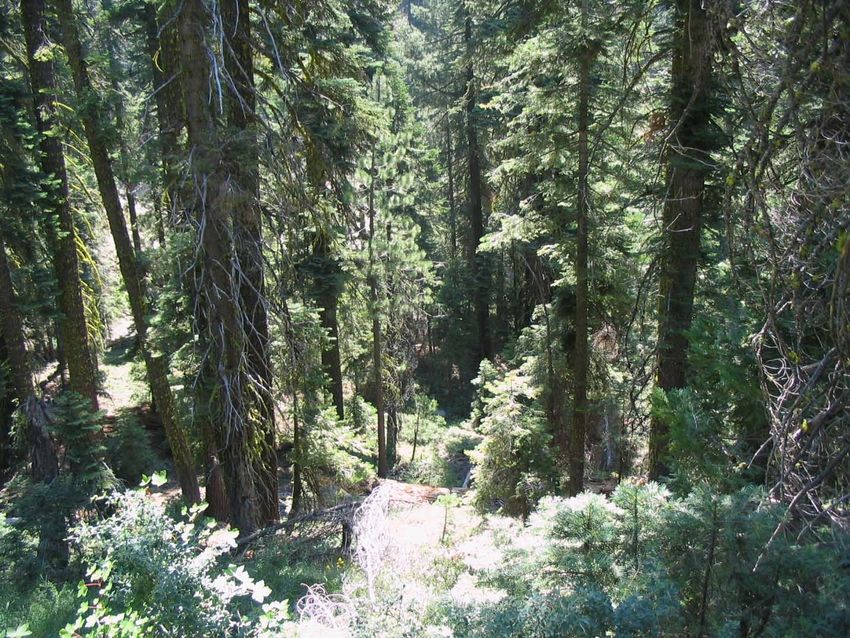
Photo 1. Dense forest in North Fork, American River basin the region in streams and
rivers. In an average year,
the Sierra Nevada receives 27 percent of the state’s annual precipitation and provides more than
60 percent of the state’s consumptive use of water (estimates based on authors’ calculations from
data in Department of Water Resources 2005). Sierra forests do more than just supply water;
they store water and even out the runoff over the spring, summer and fall. Much of the state’s
precipitation falls in the winter as snow and is stored in that form during the wet winter months
(Figure 2). The slow melting of snow in the spring and storage of water in the subsurface
provide the water necessary for vegetation to grow as well as the flows of water for downstream
use, including the generation of hydropower at the Sierra Nevada’s many hydroelectric
generation facilities. Storage of water as snow acts as an upstream reservoir that augments the
capacity of downstream reservoirs. On average, the volume of snowpack storage is estimated to
be greater than the reservoir capacity in either the San Joaquin or Sacramento basins (Figure 2).
4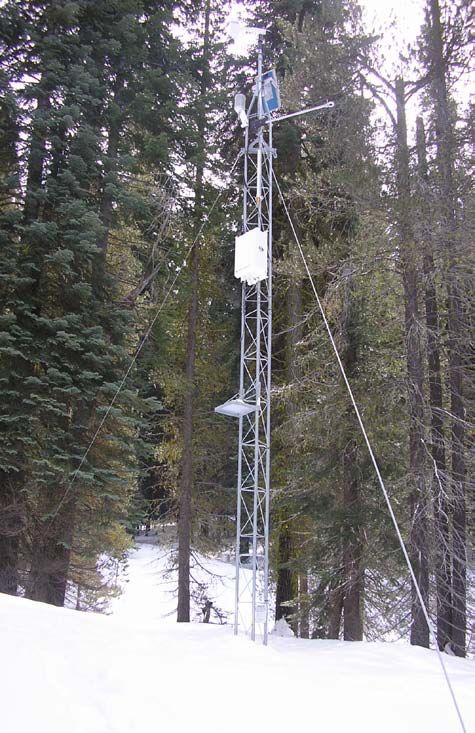
Snowpack retention
is a valuable ecosystem
service, but the forest
landowners who provide
this service derive no
economic return from
this service. As it
becomes increasingly
apparent that runoff in
future decades cannot be
as effectively captured
by a reservoir and canal      Figure 2. Storage capacity of the Sierra Nevada snowpack in comparison
system built in past          to dams and reservoirs. Information from the California Department of
                              Water Resources. MAF = million acre feet of water. Note than 1 million acre
decades (Moser et. al.                             9 3
                              feet equals 1.23 x 10 m .
2009), greater attention
is being paid to strategies towards designing cost-effective adaptation strategies.
Hydropower in the Sierra Nevada. Water from Sierra Nevada forests has significant financial
value to downstream users when it is used to generate “carbon-free” hydroelectric power and
when it is eventually diverted to agricultural and municipal users. In 1996, the economic value of
water from Sierra forests, as indicated by the revenue generated from its use, was as much as $75
per acre-foot (Stewart 1996).Generating electricity from water flowing downhill provides nearly
half of the economic value of water runoff from the Sierra (Table 1). With the probable increase
in the value placed on carbon-free energy and the reduced water that can be diverted out of rivers
and the Delta, the relative value of water runoff may increase substantially.

Table 1. Revenue in dollars per acre-foot of water runoff for three regions of the western slope of the
                                                     3
Sierra Nevada (Stewart 1996). 1 acre-foot = 1233 m .
                               Value of agricultural
Watershed                       and municipal uses      Hydroelectric revenues           Total value
Sacramento                              36                         31                        67
San Joaquin                             39                         36                        75
Tulare Lake                             32                         17                        49
Sierra – West Side                      36                        31                         67

     The hydroelectric revenue from any additional acre-foot of water depends on how much of
the water’s drop in elevation is captured in hydroelectric turbines. Some of the runoff from high
in the Sierra Nevada generates power for hundreds of meters (thousands of feet) of drop at a
series of dams. Runoff from high elevations that goes through a series of turbines can generate
considerably more revenue than the average hydroelectric value of $31 per acre-foot ($0.025 per
m3). Many watersheds along the crest of the Sierra Nevada with values for additional runoff of
$40 per acre-foot ($0.033 per m3) or greater are legally zoned as wilderness or reserves.
However, the North Fork of the Feather River, the American River, and the San Joaquin River

                                                                                                            5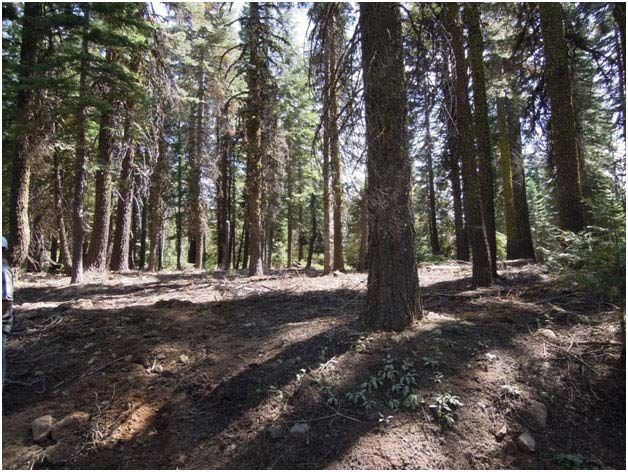
stand out as areas where the potential for additional revenue is significant and where a
considerable fraction of the watersheds are managed for multiple benefits by private and public
entities (Figure 3).
Climate change and Sierra Nevada water. California’s water supply is particularly vulnerable to
the forces of climate change. This vulnerability is due to both the supply of water and the
infrastructure built to
manage this water
(Department of Water
Resources 2010). Global
general circulation models
project generally drier
conditions in California,
particularly in regard to
water supply (Vicuna 2006).
Specifically, they project that
critical water shortages will
become more common
compared to the historical
record. It is worth noting
that the projections of
reduced precipitation are less
certain and less severe than
the predicted temperature
increases (Miller et al. 2009).
By 2050, snowpack storage
is expected to decline by
25% because of a warming
climate (Department of
Water Resources 2008).
Warmer temperatures lead to
more precipitation falling as
rain and an earlier snowmelt
(Kapnick and Hall 2010).
Less precipitation falling as      Figure 3. Average hydroelectric revenue at 2.5 cent per kwh for 122
                                   dams in the Sierra Nevada. From Stewart 1996.
snow means less storage and
a greater potential for high peak flows followed by droughts. This change will lead to the loss of
considerable economic value as less water will be available for irrigating high-value crops and
less hydroelectric power will be available to match high summer electricity demands. The
warming, drying climate will have direct negative effects on supply of water from and storage of
water within Sierra Nevada forests.

    6
One of the few ways that California
can address the negative impacts of
climate change on water yield and
storage in the Sierra Nevada is through
changes to the forest vegetation. At the
most basic level, trees move water from
the soil to the atmosphere, reducing
surface flow and downstream yield. In
the winter, a portion of the snow caught
in branches evaporates or sublimates and
reenters the atmosphere without ever
melting. Reducing the total amount of
evapotranspiration from vegetation
Photo 2. Partially thinned stand with understory,
could potentially increase the amount of North Fork, American River basin
water flowing downstream. Reducing
the current forest canopy cover and related evapotranspiration could also bring forest stands
closer to historic conditions where regular fires across the landscape resulted in much lower
levels of forest canopy cover than we have today (Collins 2011). Regional water budgets
suggest that around 70 percent of total precipitation is evapotranspired by native vegetation in
the Sierra Nevada (Department of Water Resources 2005). The density of trees can also affect
the storage of snow in a forest. In general, overly dense forest stand structures result in a higher
proportion of snowpack in tree canopies rather than on the forest floor, where it is more
protected from solar radiation. Therefore, a relatively open stand structure consisting of fewer,
larger trees where understory vegetation is controlled could enhance snowpack retention. The
impacts of specific forest management prescriptions on water yield and snowpack involve
multiple factors. The need for site-specific analysis of the link between forests and water is the
key motivation for this project.
Focus of this study. Under SWEEP we explore the delivery of ecosystem services by Sierra
Nevada forests, specifically on water yield and water storage. SWEEP tests the contention that
forest management can be optimized to increase total water yield and to extend the spring
snowpack. In short, SWEEP asks: Can Sierra Nevada forests be managed to provide more water
at the right time of year for California?
SWEEP also plans to quantify the economic value of these water-related services (e.g.
snowpack retention, water storage, increased yield, and flow attenuation). The final link will be
to connect the beneficiaries of enhanced water storage and yield with the landowners providing
them through new types of markets. In other words, water users that benefit from changes in
forest management might be willing to pay upstream landowners to provide these services. That
in turn would become a powerful financial incentive for landowners to invest in beneficial
management practices. Ultimately, SWEEP hopes to develop policy and institutional
7mechanisms for an ecosystem services market that maximizes benefits to water users, forest
landowners, and the forest ecosystem.
The SWEEP team is a multidisciplinary group of foresters, ecologists, hydrologists, and
policy experts from University of California Berkeley, University of California Merced and staff
of the Environmental Defense Fund.
83. Background on Forest Hydrology
Water and energy budget in mountain forests. Wet winters and dry summers distinguish the
mountain water cycle in the Sierra Nevada. The seasonal snowpack is a critical component of
this water balance. At lower elevations, the snowpack melts shortly after being deposited by a
cold storm, but at higher elevations the snowpack typically accumulates from December until
March or April andthen melts from April through June or July. The elevation at which
precipitation falls as snow varies from storm to storm and often varies during an individual
storm. In the high Sierra Nevada, total annual precipitation ranges from a low of about 60 cm (24
in) in the south to a high of
more than 200 cm (79 in) in
the north (Figure 4). Across
much of the forested Sierra
Nevada, precipitation is
partitioned between runoff
and evapotranspiration (Box
1).
The energy balance in
the forest determines when
snow melts (Box 2). Snow
melt is driven by temperature
and vapor density gradients
within the snow caused by
heat exchange at the snow
surface and at the snow–soil
interface (Marks et al. 1999;
Pomeroy et al. 1998). Forest
cover reduces the energy Figure 4. Average precipitation and snow water equivalent (SWE) in
the Sierra Nevada (Bales et al, 2006).
from the sun and the
influence of wind on snow melt. The energy balance on sub-canopy snow is dominated by
radiation, with incoming shortwave irradiance modified by the canopy shading and longwave
irradiance increasing from canopy thermal emissions (Link et al., 2004; Sicart et al., 2004;
Pomeroy et al., 2009). Forest cover may also affect sub-canopy shortwave radiation by altering
snow-surface albedo (the fraction of incident sunlight that is reflected) through deposition of
forest litter on snow (Hardy et al., 2000; Melloh et al., 2002).
Snowmelt rates are higher in open areas in near-freezing temperatures, but when the air
warms (i.e., temperatures well above freezing) melt rates are higher under the canopy (Lopez-
Moreno and Latron 2008). This switch in melt rates during warm periods is in part due to
sensible heat exchange and latent heat of evaporation becoming melt drivers, such that the
blocking of incoming solar radiation becomes relatively minor. Additional longwave radiation
emitted by the dense vegetation during the warmer periods also amplifies this effect.
9Conifer canopies intercept Box 1. Forest water balance
a portion of snowfall, and The water balance for the near surface, or zone of interest for trees and other
snow caught in canopies components of the ecosystem, can be written as precipitation (P) being equal
to the sum of evapotranspiration (ET) plus runoff (R), measured as streamflow,
sublimates at higher rates plus groundwater recharge (D) plus the change is soil water storage (∆S):
than ground-level snow P = ET + R + D + ∆S (1)
(Essery et al. 2003). In forest catchments, precipitation, runoff, and evapotranspiration typically
dominate the water balance. Groundwater recharge is often the smallest term
Sublimation rates in areas in the water balance equation; soil water storage is expected to balance over
that have been studied the long-term (5-10 years), if not annually. Thus for our analysis, groundwater
range from 15% to 60% recharge is assumed to be negligible and net soil water storage is assumed to
equal 0. Therefore mean annual water yield is defined as:
of annual snowfall (Hood R = P - ET (2)
et al. 1999, Parviainen and
Pomeroy 2000, Montesi et al. 2004, Troendle and King, 1985; Schmidt et al., 1988; Pomeroy
and Schmidt, 1993; Lundberg and Halldin,1994; Storck et al., 2002). Higher temperatures, lower
humidity, and greater wind speeds can all increase sublimation rates (Montesi et al. 2004).
Data to evaluate differences in sublimation losses in forests similar to those in the Sierra
Nevada are few; however, Ellis et al. (2010) compared accumulation at 4 locations, two of which
have trees over 25 m tall (82 ft) and may be somewhat relevant to the Sierra Nevada (Figure 5).
Both showed significantly more snow water equivalent (SWE) in the open versus under the
canopy, though no differences in melt rates were apparent; differences in melt out date were also
inconclusive. However,
Box 2. Snowcover energy balance
in the warmer Sierra
The energy balance of a snowcover is:
Nevada, canopy snow ΔQ = Rn+ H + LvE + G + M (3)
unloading should be where ΔQ is change in snow cover energy, and Rn , H,L vE, G and M are net
radiative, sensible, latent, conductive, and advective energy fluxes (all terms
higher and thus canopy 2
are in W m ), respectively; Lv is the latent heat of vaporization, or sublimation
sublimation loss lower -1
(J kg ) and E is the mass flux by sublimation from or condensation to the snow
than in the two locations 2 -1
surface (kg m s ). In this context, advected energy M is heat lost or gained
when mass (precipitation) of a specified temperature is added to the snow
shown on Figure 5. In
cover. In thermal equilibrium ΔQ = 0.0; whereas a negative energy balance will
practice, estimating and cool the snow cover, increasing its cold content, while a positive energy
verifying the effects of balance will warm the snowcover. The snow cover cannot be warmer than the
melting temperature Tmelt (0.0°C) and melt cannot occur until the snow, or a
changes in canopy in the
layer within the snow cover, has reached this temperature. Once the snow is
Sierra Nevada on mass isothermal at 0.0°C, positive values of ΔQ must result in melt. While the tools
balance of the snowpack are readily available to calculate energy balance both above and beneath the
canopy, the necessary data are not widely available. Thus in some cases a
involves understanding
simpler temperature-index approach is used, with coefficients developed from
and predicting snow-index sites in the area. In this approach, daily snowmelt is a linear
sublimation and melt, function of degree days (degrees daily average temperature is above zero)
times a degree-day coefficient (Tindex):
both on the ground and in
Melt = Dday × Tindex (4)
the canopy (Box 3). Typically Tindex increases as the season melt season progresses, reflecting the
Because of the generally greater net radiation for snowmelt later in the year. While this
simpler approach indicates the average snowmelt with warmer temperature, a
prevalence of rain at
more-explicit energy-balance approach is needed to describe the effect of
lower elevations and forest thinning on snowmelt.
10snowfall at higher elevations, the
lag between precipitation and
discharge depends on elevation.
For example, the Kings River
Experimental Watersheds
(KREW) and associated Southern
Sierra Critical Zone Observatory
(CZO) are dense, mixed-conifer,
headwater forests that show
about a two-month lag between
precipitation and discharge
(Figure 6). Note that only about
50% of the precipitation fell as
snow in this catchment. Going up
in elevation another 400-500 m
(1,300 to 1,640 ft), we find a lag
of about three months (Hunsaker
et al., 2011). In general, snow
melts out about 20 days later for
each 300 m (1000 ft) higher in
elevation (Rice et al., 2011).
Water yield from these
catchments varies from as little
as 10% of precipitation, in a Figure 5. Time series of observed and simulated SWE at paired
forest and clearing sites. Aptal is in Switzerland, 1185-1220 m
more rain-dominated catchment (3887-4002), 47° 3’N, 3-11° slope and 25-m (82 ft.) spruce and fir in
forested plot. Fraser is in Colorado, 2820 m (9250 ft.), 39° 53’ N,
in a dry year, to more than 60%, 17° slope and ~27-m (89 ft.) spruce and fir in the forested plot.
in a snow-dominated catchment Adapted from Ellis et al. (2010).
in a wet year. Evapotranspiration
accounts for most of the
Box 3. Forest snowcover mass
precipitation not leaving the
A mass balance on snow in a forest, adapted from Ellis et al (2010), can be
catchments as discharge. In expressed as:
the lower-elevation ΔSWE = Ps − (Is − Ul) + Pr −(Ir − Rd ) − M – S (5)
where Ps is snowfall,Pr is rainfall, Is is canopy snowfall interception, Ul is
catchments, at least, trees
canopy snow unloading, Ir is canopy rainfall interception, Rd is canopy rain
transpire year-round, drip, M is melt loss and S is sublimation of snow on the ground. The
drawing water from both soil difference Is – UI is sublimation loss in the canopy and he difference Ir – Rd
is evaporation loss in the canopy. Interception is proportional to LAI. In a
and deeper zones during the
non-forested clearing, the balance is:
dry summer, when ΔSWE = Ps + Pr – Hin – Hout − M – S (6)
evapotranspiration is highest where Hin and Hout are blowing snow into and out of the area of interest.
(Bales et al., 2011). Data to evaluate these differences are few.
11Forest management and water. In
principle, vegetation can be managed
to meet water-resource goals,
particularly in forests where trees
create dense canopies. As net primary
productivity (i.e., plant growth)
increases, evapotranspiration (the
primary cause of water loss) also
increases. Any manipulation that
reduces the productivity (e.g., removes
trees, shrubs or grasses) reduces
evapotranspiration and thus may
increase water availability. Figure 6. Water year basin-average precipitation and
This well-established link between discharge for one headwater catchment at an elevation of
1750-2000 m (5740-6560 ft.). Adapted from Bales et al.
water and forests suggests that forest (2011).
ecosystems can be managed to meet
water resource priorities. Indeed, there is a long history of research in forest hydrology in which
the impacts of various natural and anthropogenic disturbances are evaluated with regard to water
quantity and quality (Bosch and Hewlett 1982, Hornbeck et al. 1993, Sahin and Hall 1996,
Stednick 1996, Brown et al. 2005).
Paired-watershed experiments provide the bulk of the evidence informing conclusions
regarding the effects of vegetation management on forest hydrology. In a paired-watershed
study, stream gages are built at the mouth of two or more watersheds. Ideally the watersheds are
similar in size, soils, vegetation, and land-use history. Streamflow is monitored for several years
to define baseline conditions. Then watersheds are manipulated (e.g., trees cut, shrubs removed,
fire introduced). At least one watershed is left untreated to provide a reference. The differences
in water yield between experimental watersheds and the reference is the measure of the impact of
the treatments. It is an expensive but potentially rigorous approach to watershed science. During
the past 60 years, literally hundreds of experiments have been conducted worldwide, and the
results have been summarized in a sequence of reviews (e.g., Bosch and Hewlett 1982, Hornbeck
et al. 1993, Sahin and Hall 1996, Stednick 1996, Brown et al. 2005). However, no paired-
watershed studies have been conducted in the conifer forest that dominates the west side of the
Sierra Nevada. Thus, when assessing the potential of forest management to influence hydrology
in the Sierra Nevada, inferences must be drawn from an appropriate subset of the literature.
Perhaps the most significant consideration is that most of the paired-watershed studies
impose a treatment once and then allow the forest to regrow (Hornbeck et al. 1997). In reporting
yield effects, runoff is typically measured for five years following the treatment and the effect
reported as the mean during those five years (Brown et al. 2005). However, the recovery of
forest vegetation can be rapid. For example, following a whole-tree harvest in a northern
hardwood forest in New Hampshire, canopy cover returned to preharvest levels in three years, as
12did evapotranspiration and stream runoff
(Hornbeck et al. 1997). Maintenance of
treatment effects is a key consideration in
forest management for water.
Generally, paired-catchment studies
show immediate on-site increases in water
yield, but to propagate the effect far
enough downstream to be meaningful for
end users requires a large portion of the
watershed to be treated. Applying this idea
to Coon Creek, a 1,659 ha (4,100-ac)
watershed in Wyoming, Troendle and
others (2001) found that removing 24% of
vegetation led to a significant water yield
increase of three inches. Yield increases
have been shown to be minimal or
negligible during years with drier-than-
normal precipitation and maximized
during wet years.
A comprehensive project (based at the
Fraser Experimental Forest in Colorado)
used the Fool Creek Watershed to evaluate
the effects of harvesting on water yield, Photo 3. Typical meteorological station supporting
timing, peak discharge, and peak water research in snow-covered southern Sierra Nevada.
equivalent over 28 years (Troendle and
King 1985). Initial studies following harvest (Hoover and Leaf 1967; Leaf 1975) suggested no
change in water balance, attributing changes in water yield to reduced transpiration, with
increases in SWE in forest clearings attributed to aerodynamic redistribution of the snowpack.
However, when Troendle and King (1985) revisited the issue, analyzing 28 years of data, they
were led to the conclusion that increases in water yield (+40%), peak discharge (+23%), and
peak water equivalent (+9%) do exist, along with earlier peak flows (-7.5 days). This study
highlights the need for long-term monitoring of hydrologic research sites, few of which exist in
the Sierra Nevada.
While most of the increase in water yield is concentrated around removal of the trees
themselves, additional factors may also affect the water balance. Royce and Barbour (2001)
found that per unit of biomass, understory shrubs deplete soil moisture faster and consume more
available soil moisture than conifers. This research suggests that understory management may
also be an important factor in modifying transpiration effects on water yield.
Generalizations from reviews of paired-catchment studies suggest that the Sierran conifer
forest has ecological attributes with a high potential for water-yield gains. First, forest
13catchments dominated by
evergreen, needle-leaved
trees consistently show
greater per capita gains in
water yield relative to
fraction of forest cover
removed than any other
forest type. For example,
Bosch and Hewlett (1982)
found per capita water yield
in temperate conifer forests
to be on average 60% greater
than in temperate deciduous
forests. Changes in water Photo 4. Snow-depth sensors in Southern Sierra CZO meadow and
yields depend on the amount adjacent forest.
of precipitation (Zhang et al. 2001). In extremely dry ecosystems (< 500 mm [ 1500 mm [60 in] precipitation
annually), there is limited ability to affect water yield by manipulating the vegetation. In the high
Sierra Nevada, total annual precipitation ranges from a low of about 600 mm (24 in) in the south
to a high of over 2,000 mm (79 in) in the north (Bales et al. 2006). Thus, in terms of input, the
Sierra Nevada spans a range where there is a near-linear increase in water yield with reductions
in forest cover (Zhang et al. 2001). In snow-dominated systems like the Sierra Nevada, there is
clear seasonality in the water yield response to thinning, with the greatest absolute increases
observed during snowmelt (Brown et al. 2005). However, the greatest proportional increases are
generally observed during the dry summer months (Brown et al. 2005). Predicted increases in
yield from the combination of thinning and storage as snow suggest that upstream forest
management can help fill downstream reservoirs in the spring as well as increase crucial flows
during the dry summer months.
An indication of the potential water impacts of forest management can be developed using
data from the Sierra Nevada and models established in the literature (equation 8 in Zhang et al.
2001). Specifically, we used the range of annual precipitation reported for catchments along the
north-south gradient of the Sierra Nevada (Bales et al. 2006). We compared 90% forest cover
(i.e., untreated baseline) to 60% and 30% forest cover. Water-yield gain was calculated using a
simplified water-balance approach, i.e., the difference in evapotranspiration between treated
areas and the untreated baseline for a given precipitation input. There is a steady increase in
evapotranspiration with increasing precipitation for the range of inputs (600-2000 mm; 24-79 in)
observed in the Sierra Nevada (Figure 7).
However, increases do begin to taper around 1400 mm (55 in) of precipitation, suggesting
that in the wettest catchments there is an upper limit to absolute yield gains. On average,
treatments that reduce forest cover from 90% to 60% of the potential maximum across a
14watershed were projected to increase
yields by 85 mm (3 in, 9.0%) (Figure
7). Thus both the qualitative and
quantitative evidence support our
contention that vegetation management
can meaningfully modify forest
hydrology in the Sierra Nevada.
Forest management and snow. One of
the most important impacts that forest
management has on water yield in the
Sierra Nevada is related to snow
accumulation and melt. For example, in
a recent study that included sites
analogous to Sierra forests there was Figure 7. Predicted changes in evapotranspiration for
forested watersheds in the Sierra Nevada as a function of
significantly more snow in the open precipitation inputs and reductions in forest cover.
areas than under the canopy (Ellis et
al., 2010). Golding and Swanson (1978)
found greatest snow storage in clearing
sizes of one tree height in Alberta, Canada.
In the Storck and others (2002) study on
snowpack in the maritime climate of
Oregon, a simple relationship between
under-canopy and open SWE was not
possible, but in general more snow
accumulated in the open areas and snow
melted out of open areas one month later
compared to snow accumulation and
retention under the canopy. The spatial
arrangement of trees also affects snow
accumulation(Woods et al. 2006).
Studies of forest-management impacts
on snow properties in the Sierra Nevada
date from the early 1900s (Church 1912,
Church 1933). Since that time, the issue
has been of interest to the U.S. Forest
Service (USFS) and California Department
of Water Resources (Kittredge 1953, Photo 5. Close up of acoustic snow-depth sensors,
with up-looking and down-looking radiation
Colman 1955, Anderson 1963, McGurk measurements on nearest sensor arm, Southern Sierra
and Berg 1987, MacDonald 1987), though CZO.
forest management for snow retention has
15never been implemented on a large scale. Church (1912) suggested a honeycomb pattern of
forest clearings, stating, “The ideal forest seems to be one filled with glades whose width bears
such proportion to the height of the tress that the wind and the sun cannot reach the bottom.”
However, McGurk and Berk (1987) presumed that this pattern of forest treatments would not be
as economical as strip-cuts (i.e., cutting a line of trees), which were also recommended by
Kittredge (1953). Independent work with group selections from 0.1 to 1 hectares in size (0.25 –
2.5 ac) are increasingly used to increase the regeneration of pines in the Sierra Nevada (York et
al. 2004) and could potentially replicate the honeycomb pattern originally suggested by Church.
Ultimately, the effectiveness of any treatment depends upon individual stand tree height, slope,
and aspect to obtain the right mixture of openings large enough to accumulate additional snow,
yet with enough shading to block direct solar radiation for prolonging ablation (the removal of
snow by evaporation, sublimation, or wind). Data from sites in the southern Sierra Nevada also
show significant differences in snow accumulation between open areas and forest (Figure 8).
However, it must be recognized that, because openings were small, some of the snow falling
from the canopy may have
added to that in the open
areas (Bales et al. 2011).
Within the Sierra
Nevada, the Central Sierra
Snow Lab (CSSL), Onion
Creek Experimental Forest,
Yuba Pass, and Swain
Experimental Forests have
all reported on the
outcomes of efforts to Figure 8. Snow depth relative to canopy, based on 27 continuous
sensors at Southern Sierra Critical Zone Observatory, water year 2009
study forest treatment (Bales et al. 2011).
impacts on snow
accumulation (Table 2). The CSSL found the lowest increases in snow accumulation from
selective cutting of red fir that reduced crown cover to 50%; this resulted in a 5% increase in
SWE (Anderson 1976). The highest percentage increase of SWE, approximately 50%, resulted
from strip cuts implemented in Swain Experimental Forest and Yuba Pass. Results from all other
types of forest harvesting (block cutting, commercial selection, selective cutting, and
clearcutting) increased SWE in the treated areas between 14 and 34% (Table 2). The effects of
forest management on snow accumulation can have a lasting impact. McGurk and Berg (1987)
revisited the strip-cuts at Yuba Pass 20 years after harvest and found sustained increases in SWE
of 25 to 45%.
Increasing temperatures from climate change may actually lead to a decrease in vegetation
water use, as snowmelt occurs earlier and less late-summer moisture is available (Tague et al.
2009). Additionally, not removing slash post-harvest has been shown to hasten snow ablation in
the spring (Anderson and Gleason 1960), which also affects snowmelt timing.
16Table 1. Maximum increases in snow accumulation from different harvest treatments in the Sierra Nevada
Increase
Location Species Harvest treatment % cm
CSSL Red fir Selective (crown cover reduced to 50%) 5 5
CSSL Red fir Commercial selection cut 14 17
a
CSSL Red fir Selective (Crown cover reduced to 35%) 19 24
b
Onion Creek EF Mixed conifer Commercial selection 20 17
a
CSSL Red fir Clearcut 23 27
a
CSSL Red fir Wall-and-step forest 25 47
a
CSSL Red fir East-west strip, 1H wide 26 30
a
CSSL Red fir Block cutting, 1H wide 34 35
c
Yuba Pass Red fir/Lodgepole Strip-cut 1H (40 m), 2H (80 m) wide 46 22
b,d
Swain EF Red/White fir Strip-cut 2H wide (100 m) 52 24
b,d
Swain EF Red/White fir Strip-cut 4H wide (200 m) 58 21
a
from Anderson et al., 1976
b
from Anderson and Gleason, 1960
c
from McGurk and Berg, 1987
d
Averaged from multiple measurements
In forest openings, direct solar radiation reaches the ground, causing earlier snowmelt. As a
result, water passes through the soil prior to peak transpiration use by vegetation (Troendle and
Leaf 1981). This both increases water yield at high flows and augments flow during the period
when water resources’ economic and ecosystem values are lowest. Therefore, a treatment pattern
to not only increase water yield but also extend snow storage by creating forest openings would
be best. Modifying the implementation of treatments towards this goal would be beneficial for
water management and would also provide a direct complement to fire treatments. Reducing the
period of the dry season, when vegetation is extremely susceptible to ignition, is desirable for
protecting both property and timberland from devastating fires. With the advent of climate
change, this process may be more important to help offset earlier snowmelt (Stewart et al. 2004),
as opposed to advancing historical melt-out dates.
1718
4. Why Forest Management Matters for Water
     A recent review by the National Research Council (2008) concluded that “Although in
principle forest harvest can increase water yield, in practice a number of factors make it
impractical to manage forests for increased water.” Similarly, a USFS policy analysis echoed this
conclusion in evaluating the potentials and limitations of augmenting water yield on forested
lands (Sedell et al. 2008): “For a variety of reasons, water yield increases are likely to be
undetectable.” This conclusion was based in part on work in the Sierra Nevada where
Kattelmann et al. (1983) estimated that only a 2 to 6% increase in streamflow could be attained if
“National Forest lands were managed almost exclusively for water production while meeting the
minimum standards of all applicable laws.” The implicit assumption is that limitations on the
removal of vegetation due to wildlife habitat and floral retention standards will severely restrict
any government action. The perspective that forest management for water supply is not worth the
trouble is ingrained in both upstream and downstream resource managers.
     The SWEEP team contends that forest management for water supply is worth the trouble for
four main reasons. First, previous analyses do not consider changes in the value of the water
flow. In the Sierra Nevada, the significant amount of runoff diverted through hydroelectric
turbines more than doubles the economic value of the runoff (Stewart 1996). Forest
management has the potential to enhance revenue for in-forest and downstream water users and
engaging these beneficiaries in paying some of the costs of forest management should be
considered. Second, fires are more common in the Sierra Nevada than the nation as a whole and
upstream fires can deliver large loads of sediment and debris that impair hydroelectric
production. Forest
management can
mitigate wildfires
and lessen sediment
loads. That is, forest
management actions
to mitigate wildfire
and to enhance
runoff are well
aligned. Third, many
of the constraints
regarding forest
management for
water yield are
operational in nature.
In study after study,
reductions in tree
cover have resulted
in measured              Photo 6.Intact forest at Last Chance. View from forest edge (road) looking in. High
                          canopy cover; dense forest.

                                                                                                         19
increases in water yield, but the increases have been short lived because the vegetation has been allowed to regrow. Sustained management of evapotranspiration may be possible. Fourth, climate change is forcing a reconsideration of all options. Not only does a warming climate directly impact water supply and storage, it also aggravates the risks posed by wildfire (Westerling et al. 2006). While concern for the future of the Sierra Nevada is not new—Tom Knudson’s Pulitzer-prize winning series, “The Sierra in Peril,” was published by the Sacramento Bee in 1991—the recent increase in forests impacted by large, catastrophic wildfires has re- focused attention and re-ordered priorities. The latest analysis of land-cover trends by the U.S. Geological Survey (Raumann and Soulard 2007) estimates a nearly tenfold increase during the last decade in the rate at which intact Sierra Nevada forests were converted to an “altered and often unvegetated state” by wildfires. In short, climate change has created an urgent need for managers to intervene in order to continue providing ecosystem services from mountain forests. Photo 7.Intact forest at Last Chance after tractor thinning to approximately 60% canopy cover. 20
5. Proposed SWEEP Program and Approach
     The SWEEP proposes to increase water yield from forests and extend the retention of
snowpack in the spring, both of which will translate into more water at the right time of year for
the rest of California. The SWEEP team will test the hypothesis that forest-management
strategies that reduce fire risk and maintain the historical “mix” of tree species (e.g. more pines
and fewer firs) can also increase water yield and extend the snowpack in the Sierra Nevada. Such
a test requires a catchment where experimental treatments can be implemented and effects
monitored. The aim is to collect the experimental data needed to support the development of
forest treatment and management scenarios through modeling and analysis. Expected outcomes
of the experiment are as follows:
    − SWEEP will develop the quantitative knowledge base needed to stimulate collaborative
         forest-management approaches involving land stewards, water beneficiaries and the range
         of stakeholders with an interest in the ecosystem services provided by Sierra Nevada
         forests.
    − SWEEP will develop a predictive framework for quantitatively assessing the effects of
         forest management on the mountain water cycle, including snow accumulation and melt,
         soil water storage, evapotranspiration, and stream discharge. This predictive ability will
         be based on explicit, measurable characteristics of the forest landscape, including LAI,
         climate, soils, and physiographic features.
    − SWEEP will develop the means to quantitatively measure and value ecosystem services
         that could support potential public and private investments in forest and watershed
         management.
     In June 2008, the SWEEP team visited several candidate headwater catchments for forest
treatments and water-balance studies. The two catchments with the greatest potential, Onion
Creek and Rice/Dolly creeks in the upper American River basin, are described here. The
American River basin was considered a viable location for the next phase of these investigations
in part because of stakeholder interest and in part because of a good base of existing research
infrastructure. Figure 9 shows the locations of the Rice/Dolly and Onion Creek catchments,
along with other catchments considered. Note that the Frazier and Bear Trap catchments are
sites of ongoing forest management and hydrology research.
General watershed features. Geologic characteristics of the upper American River basin show
Cenozoic andesite formations in the headwaters of the basin, underlain by mixed sections of
metamorphic rocks from a much earlier time when the land was covered by water and granitic
bedrock from the subsequent uplift by tectonic forces. Volcanic activity started at the end of the
Eocene, with mud and lava flows blocking river channels and changing flow patterns, leading to
the landscape and soils present today (USDA 1994). Other specific rock types underlying
potential study watersheds include metamorphic argillites, intrusive volcanic granodiorites,
intermediate volcanic rock, and glacial drift (Figure 10). Glaciers were active down to 1450-m
(4700 ft)during the Pleistocene (USDA 1994), which began about 2 million years ago.

                                                                                                21
Figure 9.Locations of the potential study watersheds in the headwaters of the North and Middle Forks of
the American River. Also shown is the watershed boundary of each fork and two high-elevation
reservoirs, French Meadows and Hell Hole. Elevations in this map peak at 2750 m (9020 ft) along the
crest of the Sierra in the east, with the major rivers draining towards the west, exiting the region shown
at about 700-m (2296 ft), flowing down towards the Sacramento Delta.
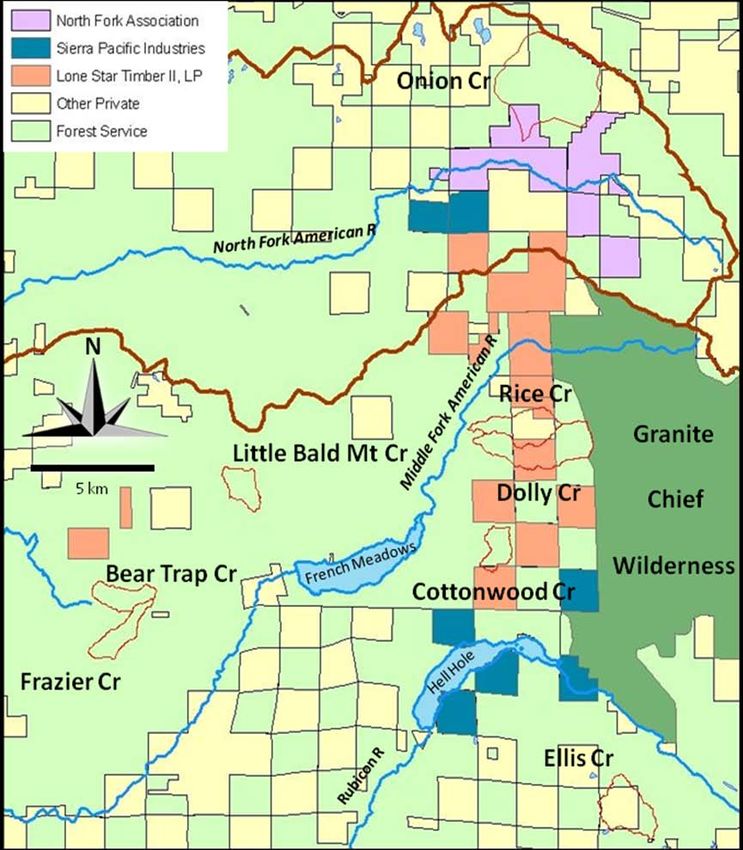
Land ownership includes a mix of USFS and private (Figure 11). Two forestry companies
(Lone Star and Sierra Pacific Industries) and the North Fork Association own a large portion of
the private land in these watersheds.
22Figure 10. Geologic features in the study region. Andesites (volcanic origin) from the Cenzoic period
overlay a mix of older sections of granitic and metamorphic bedrock, with some glacial deposits at the
bottom of higher elevation valleys. The volcanic period at the end of the Eocene created much of the
landscape and soils present today, with glacial influences above 1450 m.
Soils in the headwaters of the American River are primarily made up of two soil series
associations. The Hurlbut-Deadwood-Putt association lies on the ridges and mountainsides of the
23Figure 11.Land ownership in the American River headwaters. Privately held lands of interest around
potential study watersheds are displayed.
American River Basin at 600-1830 m (2000-6100 ft). Formed from meta-sedimentary rocks and
glacial deposits, surface texture ranges from gravelly loam to cobbly sandy loam.
Characteristics of this series range widely, from moderately deep well-drained soils on
almost flat ground, to shallow and extremely well-drained soils on steep slopes. Soils have
moderate water holding capacity and are mainly used in this area for timber operations of
moderate productivity (USDA, 1994). The Frazier and Bear Trap catchments lie in this soil
association. At higher elevations (>1675 m, or 5550 ft), the Tallac-Smokey-Meiss association
soils dominate the landscape. These soils have the same characteristics as the lower elevation
24soils, but may be deeper in some locations. They are not only found on ridges and moraines but
also on outwash terraces and in the valleys. Tallac-Smokey-Meiss association soils have lower
available-water capacity and may be less productive as timberland. Soils in this association are
formed from glacial alluvium, meta-sedimentary rocks, and andesitic tuff breccia. On the
surface, the texture is sandy loam to gravelly loam, having increasing gravel content with depth
until weathered rock or bedrock. The Rice/Dolly and Onion Creek catchments lie in this soil
association. Rock outcroppings are also common in these highest elevations (USDA, 1994).
Although these available soil maps give general characteristics of the region, more detailed and
site-specific investigations of the candidate study catchments will be required to more-accurately
and specifically describe local conditions in the catchments.
Vegetation in this region is dominated by conifer species, giving way to mixed forest and
hardwood species alongside large streams, particularly sunny slopes with a south-southeast
aspect (Figure12). Shrubs tend to grow in recently harvested areas or in shallow soils, (Note their
co-location with barren regions of exposed bedrock on Figure12).
Small holdings of urban and agricultural land use are present in the upper American River
but do not play a major role in the use and cycling of water in this region. Onion Creek has a
mean canopy closure of about 55%, versus 40 and 45% for Dolly and Rice, respectively. One
fourth of Onion Creek has a canopy closure above 65%, versus 55% for Rice/Dolly. These
values are based on general USFS regional maps and should be evaluated further in developing
thinning prescriptions. While there are steep slopes in the upper parts of Onion Creek, these
areas tend to have lower vegetation density. Thus a significant fraction of both Onion Creek and
Rice/Dolly could potentially receive a reduction in vegetation.
Onion Creek Experimental Forest. The USFS established the Onion Creek Experimental Forest
in 1958 to develop techniques for increasing water yields from forested lands in the snow zone of
the Sierra Nevada. Located in the upper reaches of the North Fork of the American River basin,
the experimental forest encompasses about 1,200 ha (2,965 ac), organized into five main sub-
basins dominated by white fir and red fir. Despite the initial intent, forest harvest impacts on
water yield have never been studied at Onion Creek. Thus, harvest disturbance has been minimal
(Adams et al. 2004). The University of California Berkeley currently manages the site, in
cooperation with the USFS.
In November 2008, members of the SWEEP team conducted a forest survey of seven
adjacent watersheds in the upper basin. Three 0.12-ha (0.3-ac) plots were randomly located in
each watershed. In each plot, the diameter of all trees greater than 5 cm (2 in) in diameter at
breast height (1.37 m or 4.5 ft) were measured and identified to species. The height of each
measured tree was estimated. One tree per plot was aged by counting its growth rings.
25Figure 12.General vegetation map of region.
The upper watersheds at Onion Creek are dominated by red fir (49%) and white fir (29%).
The forest is dense, with an average of 500 trees per ha (202 trees per ac) and mean basal area
equal to 89 m2/ha (400 ft2/ac). Average canopy cover is 51%, but ranges by watershed from a
low of 32% to a high of 68%. The average canopy tree height was 18 m (60 ft). The tallest trees
in the watershed exceeded 32 m (105 ft) in height. The average age of a canopy-sized tree was
100 years. By every measure, these forests are typical of a naturally regenerated forest that has
been protected from wildfire impacts of the northern Sierra Nevada (Gonzalez et al. 2010).
26You can also read