Growing a sustainable local grain economy in Arizona: A multidimensional analytical case study of an alternative food network
←
→
Page content transcription
If your browser does not render page correctly, please read the page content below
Journal of Agriculture, Food Systems, and Community Development
                  ISSN: 2152-0801 online
                  https://foodsystemsjournal.org

Growing a sustainable local grain economy in Arizona:
A multidimensional analytical case study of an
alternative food network

Nigel Forrest a * and Arnim Wiek b
Arizona State University

Submitted August 4, 2020 / Revised November 23 and December 17, 2020 / Accepted December 17, 2020 /
Published online April 8, 2021

Citation: Forrest, N., & Wiek, A. (2021). Growing a sustainable local grain economy in Arizona: A
multidimensional analytical case study of an alternative food network. Journal of Agriculture, Food Systems,
and Community Development, 10(2), 507–528. https://doi.org/10.5304/jafscd.2021.102.031

Copyright © 2021 by the Authors. Published by the Lyson Center for Civic Agriculture and Food Systems. Open access under CC-BY license.

Abstract                                                                   issues might undermine its sustainability. The
Local grain economies are being developed in                               insights can inform the further development of the
North America and Europe as alternatives to the                            local grain economy in Arizona and other regions.
global grain economy and its negative externalities.                       The study also provides a framework that, through
Little is known, however, about their size,                                comparative research, allows for creating
structure, and sustainability, in particular as they                       generalized knowledge about local grain economies
evolve. This study offers such insights from a case                        and alternative food networks.
study of the local grain economy in Arizona. The
study uses an analytical framework that combines                           Keywords
quantitative and qualitative data and a number of                          Local Grain Network, Sustainable Local Economy,
analytical methods to construct a multidimensional                         Short Supply Chain, Artisan Mills and Bakeries,
profile of the local grain economy. The findings                           Craft Malt and Beer, Relocalization, Alternative
indicate steady growth of the local grain economy                          Food Network, Analytical Framework
in Arizona—in production quantities, range of
businesses, diversity of products, and local                              Funding Disclosure
economy benefits over a number of developmental                           The authors acknowledge funding for this research through
stages. The findings also suggest that challenges of                      the grant “TRANSFORM: Accelerating Sustainability
                                                                          Entrepreneurship Experiments at the Local Scale,” funded by
consolidation, transparency, and other growth                             the Social Sciences and Humanities Research Council
a*Corresponding author: Nigel Forrest, Postdoctoral Research              (SSHRC) of Canada (Partnership Grant Program), as well as
Associate, School of Sustainability, Sustainable Food                     the grant “Globally and Locally-Sustainable Food-Water-
Economy Lab, Arizona State University; P.O. Box 875502;                   Energy Innovation in Urban Living Labs (GLOCULL),”
Tempe, AZ 85287-5502 USA; nforrest@asu.edu                                funded by the National Science Foundation (Award Number
                                                                          1832196) in coordination with the Belmont Forum and the
b Arnim Wiek, Professor, School of Sustainability, Sustainable            Joint Programming Initiative Urban Europe (Program
Food Economy Lab, Arizona State University; P.O. Box                      “Sustainable Urbanisation Global Initiative—Food-Water-
875502; Tempe, AZ 85287-5502 USA; arnim.wiek@asu.edu                      Energy Nexus, SUGI-FWE Nexus).

Volume 10, Issue 2 / Winter 2020–2021                                                                                             507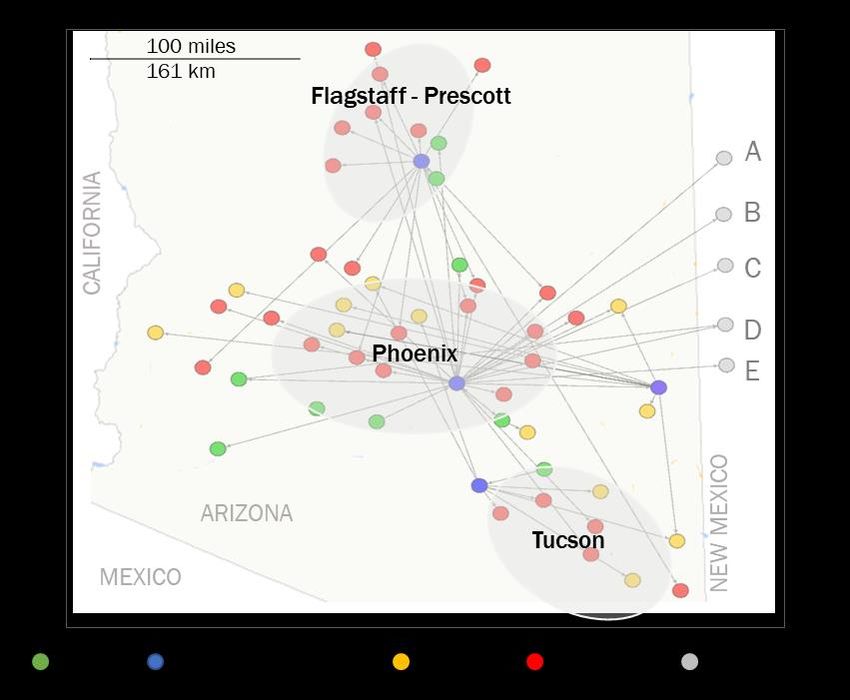
Journal of Agriculture, Food Systems, and Community Development
                                                                                                   ISSN: 2152-0801 online
                                                                                           https://foodsystemsjournal.org

Introduction                                                (Hills, Goldberg, & Jones, 2013b; Milestad et al.,
Many regions of North America and Europe have               2010); demand and supply of local flour among
been re-localizing their grain economy over the last        commercial bakers in western Washington (Hills et
decade (Carlisle, 2019; Halloran, 2015; Smith &             al., 2013a); the embedded social and cultural value
Barling, 2014). Driven by the same social, cultural,        in local grain supply in British Columbia
ecological, and economic concerns as alternative            (Hergesheimer & Wittman, 2012); the social
food networks (Renting, Marsden, & Banks, 2003),            relations in a local organic grain network in Austria
clusters of small grain growers, processors, and            (Milestad et al., 2010); the meaning of local grain to
producers offer alternatives to the commodified             craft brewers in New England (Jones & Harvey,
and centralized grain industry (Carlisle, 2019;             2017); the challenges of marketing ecologically
Halloran, 2015; Hergesheimer & Wittman, 2012;               grown grain in Ontario (Mann, 2016); and local
Hills, Goldberger, & Jones, 2013a; Jones & Harvey,          bread supply chains in the UK (Smith & Barling,
2017; Robinson, 2020; Steavenson, 2019). As the             2014) and Italy (Galli et al., 2015). Yet, in line with
need for sustainable alternatives increases, so does        Tregear’s (2011) and Deller, Lamie, and Stickel’s
the need to better understand them and how they             (2017) observation that alternative food network
might be supported toward achieving their goals.            research lacks quantitative and structural studies,
With this in mind, we investigate the local grain           research on local grain economies to date provides
economy in Arizona through an analysis of its               little evidence of their size, structure, development,
structure and development and a preliminary                 and sustainability. The lack of analysis of the evol-
appraisal of its sustainability.                            ution and properties at the whole network level
     Emerging in the 1990s and gaining momentum             makes it difficult to put the significance of the
since the late 2000s, local grain economies have            phenomenon in context, understand it from a
grown in size and number, often as grassroots initi-        structural perspective, and gain insight into gaps,
atives driven by passionate individuals (Halloran,          shortcomings, trends, and possible futures.
2015; Nabhan, 2018; Sen, 2008; Thomas, 2013).                     Using the case of the local grain economy in
Examples exist in New York (Halloran, 2015),                Arizona, we address the following research
New England (Halloran, 2015; Jones & Harvey,                questions:
2017), Western Washington (Hills et al., 2013a),
British Columbia (Hergesheimer & Wittman,                        1. What is the size of the local grain
2012), England (Steavenson, 2019), Scotland                         economy, and how did it develop?
(Robinson, 2020), Lower Austria (Milestad, Bartel-               2. What is its network structure and
Kratochvil, Leitner, & Axman, 2010), Tuscany                        composition, and how did it evolve?
(Galli et al., 2015), and elsewhere. They typically              3. What are the impacts on the broader local
consist of a network of small farmers, millers,                     economy?
bakers, maltsters, and brewers, sustainably growing              4. How sustainable (economically, environ-
wheat and barley, often of heritage and ancient                     mentally, socially) is it?
varieties, operating within local or regional supply
chains, and committed to quality, craft, identity,               The case study unit of analysis is the economic
and provenance (Halloran, 2015; Hergesheimer &              network of growers, primary processors, and sec-
Wittman, 2012; Hills, Corbin, & Jones, 2011; Jones          ondary processors in Arizona who are producing
& Harvey, 2017; Steavenson, 2019).                          or using small grains in their production for local
     Despite wide popular interest, most recently           or regional human consumption. Due to con-
indicated in a New York Times article (Wu, 2020),           straints in data availability, this scope does not
local grain economies are an under-researched area          include distribution or general retail sectors or the
of alternative food networks, with only a handful           many local restaurants that use small amounts of
of studies, mostly qualitative and descriptive,             local grain products for in-house purposes.
beginning in 2010. Research has explored what                    Arizona is a suitable case for investigation due
“local” means in the context of the grain economy           to the well-established nature of its local grain

508                                                                           Volume 10, Issue 2 / Winter 2020–2021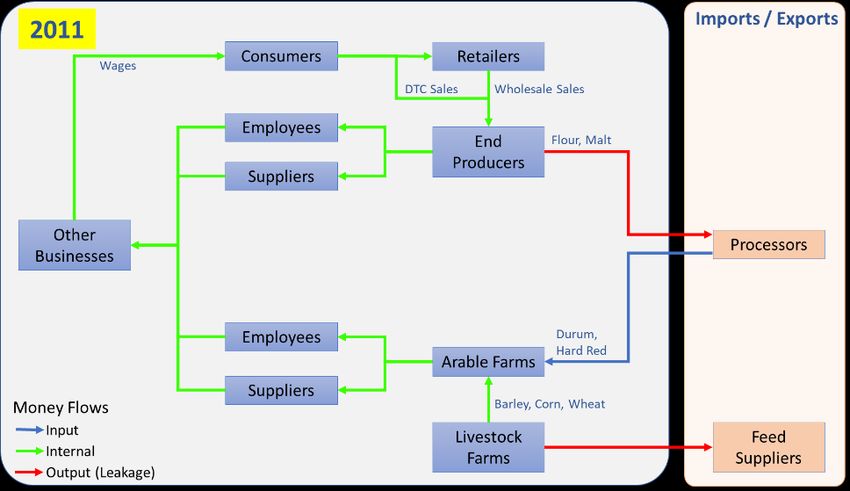
Journal of Agriculture, Food Systems, and Community Development
ISSN: 2152-0801 online
https://foodsystemsjournal.org

economy and its rapid development from 2012 to                    with high-quality products, unique local or regional
2019. As such, this study offers a rich description               attributes, organic production, and artisan crafts
of the structure and evolution of a particular local              (King & Venturini, 2005; Stevenson & Pirog,
grain economy that may provide valuable insights                  2008). Alternative food networks are commonly
to scholars and practitioners for accelerating similar            claimed to create and capture additional economic
efforts in other regions. It also offers a framework              value for producers and processors, and qualitative
for research through a novel analytical approach                  values for all (including consumers) by satisfying
combining qualitative and quantitative data and a                 shared social and environmental interests
number of analytical methods. If adopted by other                 (Stevenson & Pirog, 2008).
researchers, coordinated comparative research may                      Alternative food networks in reality, however,
serve to fill the research gap identified above. In               are more nuanced, contingent, and pragmatic
this article, we focus more on the quantitative                   (Diamond & Barham, 2011; Mount, 2012). There is
aspects, whereas the qualitative results will be                  considerable heterogeneity within and between
reported in more detail in a forthcoming article.                 them and in the degree to which they meet sustain-
                                                                  ability criteria (Mount, 2012; Tregear, 2011). For
Research Design                                                   example, the use of sustainable production meth-
                                                                  ods is not universal among farmers who participate
Analytical Framework                                              in alternative food networks, and neither is the
Development of our analytical framework was in-                   socio-economic inclusivity of alternative food net-
formed by the literature on alternative food net-                 work consumers (P. Allen, 2010; Tregear, 2011).
works. Local grain economies, and related entities                The closeness of connection between producer and
such as local grain networks and short grain supply               consumer is often questionable (Tregear, 2011),
chains, are a type of alternative food network.                   while hybrid food businesses, which participate in
Alternative food networks, and similar concepts of                both an alternative food network and the main-
short food supply chains and values-based supply                  stream food economy, are not uncommon
chains, have arisen over the last 20 or more years in             (Milestad et al., 2010; Mount, 2012).
response to increasing dissatisfaction by both                         Structurally, alternative food networks vary in
consumers and producers with the global, com-                     the number and diversity of participating entities
modified agri-food industry (Renting et al., 2003;                and their connections, ranging from closed, verti-
Stevenson & Pirog, 2008). Dissatisfaction stems                   cally integrated partnerships (e.g., a farmer cooper-
from various concerns, including the decline of                   ative) to large open networks (Renting et al., 2003;
local economies, negative environmental impacts,                  Stevenson & Pirog, 2008). A functional alternative
food safety issues, health and nutrition deficits,                food network results in a range of products making
farmer livelihoods and small farm survival, and                   their way from many varied producers, through
disconnection between consumers and producers                     multiple primary and secondary processors, to
(Renting et al., 2003; Stevenson & Pirog, 2008).                  numerous outlets of varying types. Businesses in
However, defining what alternative food networks                  one sector (e.g., production) may have multiple
are is less straightforward than identifying what                 connections to those in another (e.g., processing).
they are in opposition to (Tregear, 2011).                        Alternative food networks are dynamic, changing
     In theory, alternative food networks are con-                configuration as entities join and leave, making
sidered to be place-based and community-                          different connections, and extending or shortening
connected, economically viable for all participants,              pathways from producers to consumers (e.g., add-
ecologically sound, socially just, and democratic                 ing a processing tier). Along these lines, we sketch
(Feenstra, 1997). They are local or regional in scale,            out the general structure of a local grain economy
composed of micro and small enterprises, and                      in Figure 1.
involve close connections between producers,                           We drew on these alternative food network
processors, and consumers (King & Venturini,                      concepts in developing a framework for the analy-
2005; Renting et al., 2003). They are associated                  sis of Arizona’s local grain economy, which com-

Volume 10, Issue 2 / Winter 2020–2021                                                                              509
Journal of Agriculture, Food Systems, and Community Development
ISSN: 2152-0801 online
https://foodsystemsjournal.org
Figure 1. General Structure of a Local Grain Economy Showing Core Entity Types, Identified as In- or
Out-of-Scope in This Study and Scope Exceptions
prises 14 variables and three categories of sustaina- The main reasons for focusing on production
bility criteria, each consisting of numerous aspects and processing is that data were not readily avail-
(Table 1). For the purposes of this study, we define able for other sectors, and, at the time of this
Arizona’s local grain economy as the network of study, we were not aware of any distributors ori-
businesses involved in production (farms), primary enting their business toward local grain or derived
processing (grain handlers, maltings, mills), and products, while general retailers and most restau-
secondary processing (bread bakeries, pasta mak- rants only use local grain or flour in small quanti-
ers, pizzerias, tortillerias, breweries, distilleries, ties relative to their total output. Some notable
home brew stores) of small grains (wheat, barley, exceptions that we do include, however, are bak-
oats), intermediate products (clean grain, flour, eries with retail operations and pizzerias that use
malt), and end products (bread, beer, or pasta) for significant proportions of local flour (20% or
human consumption within a 150-mile (240-km) more).
radius of central Arizona (approximating to the
state of Arizona).The local grain economy is there- Research Methods
fore distinct from the Arizona mainstream grain The research uses a single case study, combining
economy in which small grains are grown for com- quantitative and qualitative data to explore and gain
modity markets or the local animal feed market explanatory insights into the local grain economy in
(Duval, Kerna, Frisvold, & Avery, 2016). Arizona. While a single case study is generally less
510 Volume 10, Issue 2 / Winter 2020–2021Journal of Agriculture, Food Systems, and Community Development
ISSN: 2152-0801 online
https://foodsystemsjournal.org
valid than a comparative case study, it is justified approximately 10-year history) that has not been
here in that the case is “representative” and “reve- studied before with respect to size, structure, and
latory” (Yin, 2003). It is representative as it appears evolution. The study uses a novel analytical ap-
to share similarities with other local grain econo- proach, which, if adopted by other researchers,
mies, such as its grassroots origins, microscale op- allows for comparisons with other cases, and from
erations, close relations between farmers, bakers, this, generalizing knowledge of local grain econo-
and brewers, and general alignment with the fea- mies and alternative food networks.
tures of alternative food networks (Halloran, 2015; Data collection was primarily guided by the
Hergesheimer & Wittman, 2012; Hills et al., 2011). research questions and analytical framework, and
It is revelatory in that there is something worthy of focused on the businesses, products, production,
study (an established local grain economy with an transactions, and developments of the local grain
Table 1. Analytical Variables and Evaluative Criteria Applied to the Local Grain Economy in Arizona
with Corresponding Results Section
Variables Definition Section
Production Quantity and value of local small grains produced (also compared to the Production
size of the conventional grain economy)
Farm size The size and type of farms producing local small grains (also compared to
the conventional grain economy)
Farming Methods The type of farming methods used
Business Output Output of individual businesses in each sector
Retention Ratio of number of businesses participating in 2019 to the total number of Structure of
businesses that participated in at least one year between 2012 and 2019 the Economic
(value of 0: all businesses dropped out; value of 1: no business dropped Network
out)
Longevity Ratio of the total number of businesses that participated for at least 3 of
the last 4 years to the total number participating in 2019 (value of 0: all
current business are new: value >= 1: all businesses are established
participants)
Network size Number of producers (farms), primary processors (grain handlers, malt-
sters, mills), or secondary processors (bread bakeries, pasta makers,
pizzerias, tortillerias, breweries, distilleries, home brew stores)
Diversity Number of business categories covered and number of products
Geographical clustering Supply chain connections between businesses within a geographical area
(north, central, south)
Network density Number and length of supply chains (links)
Central businesses Businesses (network nodes) with links to many other businesses
Short Supply Chain Connections between supply chain actors and with consumers; place-based
Aspects food culture; food miles.
Local money flow Direct and indirect financial value generation in the region Impacts on the
Local Economy
Local job creation Direct and indirect job generation in the region
Sustainability Criteria
Economic Economic diversity, stability, resilience, local value and job generation, Sustainability
business model innovation Features of the
Local Grain
Environmental Impacts of farming (soil, pollinators), renewable energy, energy efficiency,
Economy
water efficiency, biodiversity
Social Meaningful jobs, craftmanship, culture, ethics, wages, benefits, diversity,
employee ownership
Volume 10, Issue 2 / Winter 2020–2021 511Journal of Agriculture, Food Systems, and Community Development
ISSN: 2152-0801 online
https://foodsystemsjournal.org
economy on an annual basis, as well as basic pro- the data to a set of annual transactions consisting
files and notable practices of businesses involved. of year, source entity, destination entity, product,
We also collected additional qualitative information and quantity, modified for primary production data
on participants’ views on meanings, motivations, to ignore the source and include the area planted.
functions, challenges, and visions of the local grain As data were incomplete, inference, estimates,
economy, but do not fully report on these in this extrapolation, and interpolation were used to fill
article. Data collection consisted of interviews, gaps. Gephi network graphing software (Bastian,
email correspondence, and review of secondary Heymann, & Jacomy, 2009) was used to visually
sources, including reports, media articles, websites, plot and connect supply chain elements in a time
and literature, conducted between January and June sequence.
2020. QDA Miner software (Lite version 2.0.7;
Data were collected from 19 individuals across Provalis Research) was used to code interview tran-
17 businesses and organizations (Table 2). Partici- scripts and notes, email texts, documents, and arti-
pants were recruited by email and follow-up phone cles. Coding was inductive within the predefined
calls. Some participants were known to the re- qualitative data collection categories (meanings,
searchers through prior research. Interviewees were motivations, functions, challenges, and visions) and
selected primarily for their knowledge of the local underwent several iterations of consolidation and
grain economy and its development, and secondar- generalization. While we draw on some of the qual-
ily for representativeness across sectors. The initial itative data collected in the study, particularly in the
selection was of individuals (or businesses) known sustainability appraisal, we report the results more
(e.g., from media reports) to have played a promi- fully in a forthcoming publication.
nent role in the local grain economy, such as in its As already mentioned, the study was limited by
early development or as a central organization. the exclusion of distributors, restaurants, and retail-
Additional participants were selected by snowball- ers, as grain products are rarely the focus of busi-
ing to fill gaps or broaden the representativeness, nesses in these sectors, but also because capturing
with a pragmatic cut-off when additional interviews their contribution is a major methodological obsta-
yielded little new data. Interviews were semistruc- cle beyond the feasibility of this study. We there-
tured, of 30–90 minutes duration, and content was fore capture the core of the local grain economy,
captured through note-taking, recording, and but not its full extent. Another limit is our concen-
transcription. tration on some aspects of the local grain economy
Supply-chain data analysis entailed reducing and not others. In particular, we focused on col-
Table 2. Summary of Interview Participants
Sector Interview Participants Notes
Producers Farmers (3) Two others did not respond to interview request and one other
declined.
Primary Processors Grain handler (1)
Millers (2)
Maltster (1)
Secondary Processors Bakers (4) One other baker cancelled due to scheduling difficulty.
Pasta maker (1)
Pizza maker (1)
Brewers (5)
Developers Entrepreneurs (3)
TOTAL 19 individuals from 17 Two individuals with dual roles.
businesses/organizations
512 Volume 10, Issue 2 / Winter 2020–2021Journal of Agriculture, Food Systems, and Community Development
ISSN: 2152-0801 online
https://foodsystemsjournal.org
lecting basic production data only, and not finan- possible some were missed. Production data may
cial details, such as pricing, costs, and sales, with also be missing due to participants being unwilling
the exception of some primary processor aggregate or unable to participate, non-existent or difficult-
sales data. The sustainability appraisal is also lim- to-access records, and failing memories. Using
ited in scope by the data collected as opposed to multiple sources and talking to key individuals with
aiming for comprehensive coverage of a sustaina- wide knowledge of the local grain economy re-
ble economy. As such, only a little attention was duces these possibilities, but it is quite likely the
paid to critical sustainability issues such as eco- data are incomplete, and the results are underquan-
nomic participation, diversity, and justice (P. Allen, tified. Regarding accuracy, values have been im-
2010). Finally, some limitations of the study pertain puted for some gaps in the data, while data pro-
to data completeness and accuracy. Regarding vided by participants were often an estimate rather
completeness, data collection was not exhaustive in than from detailed records. The data, therefore,
terms of identifying every entity involved in the include a margin of error.
local grain economy in every year, and it is quite
Results
Figure 2. Annual Production Quantities and Area Planted in the
Arizona Local Grain Economy, 2012-2019: Aggregate Total for Production
all Small Grain Types (Top), and Totals For Wheat, Barley and
Rye (Bottom)
Production quantity
The aggregate total area planted and
production quantity of grains grown
for the local grain economy in-
creased from zero in 2011 (prede-
velopment phase) to over 400 acres
(162 ha) and 1.4 million pounds
(635,029 kg) in 2019. The predomi-
nant trend has been year-to-year
growth, but with some flattening-
out in 2017–2019 (Figure 2). The
total number of producing farms in
the local grain economy has been
fairly constant at between five and
seven.
Looking more closely at wheat
production, there is an upward trend
in all categories (White Sonora, hard
red, durum, and other types) from
2012 to 2019 (Figure 3). Production
has been greatest for White Sonora,
due to its local uniqueness and ver-
satility, with hard red (primarily Red
Fife) being next, reflecting demand
by bakers for a local complement to
White Sonora as they learned how
to create the ideal bread-baking
flour mix. Durum production,
mostly Blue Beard, spiked in 2015
and 2016, as growers and processors
Volume 10, Issue 2 / Winter 2020–2021 513Journal of Agriculture, Food Systems, and Community Development
ISSN: 2152-0801 online
https://foodsystemsjournal.org
Figure 3. Wheat Production Quantities in Arizona’s Local Grain Farm size and type
Economy, 2012-2019, for Major Wheat Categories Farms growing for the local grain
economy have ranged in size from
small (one acre, [~0.4 ha]) to medi-
um (4,000 acres [~1,600ha]), and
have included locally focused or-
ganic farms, medium-sized con-
ventional grain and feed-crop fam-
ily farms, Indigenous community
farms, ecovillage farms, and seed-
bank/conservation farms. While
the total number of farms has
remained between five and seven,
the type has shifted from predomi-
nantly smaller, alternative growers
to mostly medium-sized commer-
cial farms of hundreds to a few
were still searching for the right production levels. thousand acres. For the 2019 growers, local grain
Other varieties, such as emmer and einkorn, make production varied from 1% to 25% of their total
up the balance, reflecting their specialty nature. production area.
While there was experimentation with varieties in
the first few years, there has been “convergence Comparison with mainstream production
toward a smaller range” (grain handler and farmer, To put the size of local grain production in con-
personal communication, January 10, 2020) in re- text, we compare it to the mainstream small grain
sponse to demand-side influence from bakers, economy in Arizona. Arizona has long produced
brewers, and others, and as knowledge and experi- sizeable quantities of barley, durum wheat, and to a
ence of growing increased. lesser extent, winter wheat. From 2005 to 2018
(Figure 4), the total
Figure 4. Arizona Small-Grains Production, 2005-2019 acres planted have
ranged from 104,000
to 200,000 acres
(median=134,000)
(42,000-81,000 ha;
54,000 ha) producing
between 9 and 20 mil-
lion bushels (median
14) (317,000-705,000
m3; 493,000 m3) (U.S.
Department of Agri-
culture, National
Agriculture Statistics
Service [USDA
NASS], 2019). How-
ever, a steep decline
since 2017, likely due
to commodity prices
(L. Allen, 2019), has
Source: NASS, 2019. seen the 2019 acres
514 Volume 10, Issue 2 / Winter 2020–2021Journal of Agriculture, Food Systems, and Community Development
ISSN: 2152-0801 online
https://foodsystemsjournal.org
planted plummet to 51,000 (21,000 ha) and just 5 evapotranspiration is higher. So, for example,
million bushels (176,000 m3) harvested, of which switching from corn to malting barley in the Verde
winter wheat production dropped below the re- Valley has reduced water use by 30%.
porting threshold. The majority of Arizona’s main-
stream small-grain production is either exported Business Output and Operations
out of state or sold in-state for animal feed (Duval Local grain farms have outputs of tens to a few
et al., 2016). Small grains are frequently grown for hundred tons, while the primary processors in-
crop rotation reasons, usually every three to four volved (mills and maltings) have similar outputs of
years, and often in combination with high value, low hundreds of tons. Bakers using local flour
nitrogen-fixing alfalfa feed crops (Duval et al., range in outputs from dozens of loaves per day to
2016). several thousand, and most breweries output less
In 2017 to 2019, a slight upward trend is dis- than a few thousand barrels per year. These are, in
cernable in local grain production in proportion to all sectors, two or three orders of magnitude less
mainstream production (Table 3). The overall pro- than mainstream grain industry producers and
portion, however, is still only one percent or less of processors. The small batches involved and the size
both acres planted and production for durum, bar- of available equipment, whether it is for harvesting,
ley, and total, though notably reaching five percent cleaning, milling, malting, or baking, results in sub-
for other wheat production in 2018 and 2019. The optimal water and energy efficiency in operations.
proportional increases observed, however, are Despite their apparent awareness of high water and
more a function of the aforementioned historically energy use, few businesses have introduced
low acres planted by mainstream growers in these resource-efficiency measures such as solar energy
years and the very low 2018 harvest of winter or water reclamation, although there are notable
wheat than increased local grain production. exceptions, such as Grain R&D’s extensive solar
installation.
Farming Methods Regarding future output, we found that many
The seven producing farms in 2019 included two businesses expressed a desire for some growth, pri-
certified organic, one practitioner of natural meth- marily for reasons of business stability. Almost all,
ods, one low-input, two conventional (high-input), however, would like to see the local grain economy
and one unknown. Low-input consists of a single grow through new businesses, again, partly for rea-
herbicide application in early growth. With respect sons of business stability (e.g., supply reliability),
to water consumption, modern small grain varieties but also for the wider benefits provided.
in Arizona use roughly half the water of alfalfa,
which it most commonly replaces (3 versus 6 feet, Structure of the Economic Network
or 900 vs. 1,800 mm), and heritage grains, such as
White Sonora, require half of modern varieties (1.5 Retention and Longevity
feet or 450mm). Part of the lower water use of The network of local businesses that grow, process,
small grains compared to alfalfa or corn is due to and otherwise work with local grains in Arizona
being spring crops rather than summer, when has increased in size from 12 businesses in 4
Table 3. Local Small Grain Production as a Percentage of Mainstream Small Grain Production in Arizona
Year Acres Planted Production Quantity
Durum Other Wheat Barley Total Durum Other Wheat Barley Total
2017Journal of Agriculture, Food Systems, and Community Development
ISSN: 2152-0801 online
https://foodsystemsjournal.org
categories in 2012 to 45 businesses in 11 categories reliably meet that demand. The primary processing
in 2019, or 47 if BKW’s triple farming, grain hand- sector shows high retention (1.0), with no drop-
ling, and milling operations are counted separately outs, and high stability (1.0), with all four partici-
(Table 4). The largest increases are seen in second- pants (five when BKW grain handling and milling
ary processors, with bakeries, pizzerias, and pasta are counted separately) active over the most recent
makers growing from four to 11, and breweries four years. In the secondary processing sector, the
and distilleries from two to 24, while primary artisan bread bakeries show high retention (0.8)
processors have grown to five since the first mill and longevity (0.8), with three of the five partici-
started operating in 2012 (again, noting that BKW’s pating bakeries in 2019 being steady participants
grain handling and milling are counted separately). since at least 2016, the other two being newer en-
In contrast, the number of small-grain growers has trants in 2018, and one other with long-term alt-
changed little, fluctuating between five and seven. hough irregular participation, being out in 2019.
Retention and longevity indices indicate the The overall bakery sector has expanded in the last
turnover and long-term stability of participating two years, adding pizzerias, pasta makers, and tor-
businesses (Table 4). Production exhibits moder- tillerias (indicated by longevity of 0.5), yet remarka-
ately low retention (0.4), with 10 farms no longer bly high retention (0.9), with only one business
participating out of a total of 17 (after excluding dropping in and out over the years. The breweries
two seed-purchasing but nonproducing farms), but and distilleries sector (including homebrew stores)
also moderately high longevity (0.6), with six of the shows moderately high retention (0.7), with 24 of
current seven producing farms being long-term 35 businesses currently participating, but low lon-
participants. This reflects a number of farms that gevity (0.2), with only five long-term participating
experimented, especially in the period 2012–2016, businesses. This is primarily due to a large number
but a hardening of the supply chain in more recent of breweries and distilleries experimenting with
years around market demand and a core group of local grains and malt in the last two years. Over all
growers, mostly larger farms, with the capacity to sectors, retention is moderate-high (0.7), indicating
Table 4. Number and Types of Businesses in the Arizona Local Grain Economy, 2012-2019
Business Type 2012 2013 2014 2015 2016 2017 2018 2019 Total Retention Longevity
Farms 7 8 7 8 7 5 6 7 19 0.4 0.6
Primary Processors 1 1 4 4 5 4 5 5 5 1.0 1.0
Grain Handlers 0 0 2 2 2 2 2 2 2 1.0 1.0
Maltings 0 0 0 0 1 0 1 1 1 1.0 1.0
Mills 1 1 2 2 2 2 2 2 2 1.0 1.0
Bakeries 4 4 5 5 5 5 10 11 12 0.9 0.5
Bread Bakeries 3 3 4 4 4 4 6 5 6 0.8 0.8
Pasta Makers 0 0 0 0 0 0 0 1 1 1.0 0.0
Pizzerias 1 1 1 1 1 1 2 2 2 1.0 0.5
Tortillerias 0 0 0 0 0 0 2 3 3 1.0 0.0
Breweries & Distilleries 0 2 9 4 5 5 15 24 35 0.7 0.2
Breweries 0 2 9 4 5 5 14 18 29 0.6 0.3
Distilleries 0 0 0 0 0 0 1 4 4 1.0 0.0
Home Brew Stores 0 0 0 0 0 0 0 2 2 1.0 0.0
TOTAL 12 15 25 21 22 19 36 47 71 0.7 0.4
Notes: (1) the number of farms counted in 2018 and 2019 includes one in each year that purchased seed but were nonproducing in terms
of output to the network; (2) One business (BKW) has distinct farming, grain handling, and milling operations that are counted separately.
516 Volume 10, Issue 2 / Winter 2020–2021Journal of Agriculture, Food Systems, and Community Development
ISSN: 2152-0801 online
https://foodsystemsjournal.org
considerably more businesses currently participate however, show low diversity. The corporate form
than have dropped out over the eight-year period, of all businesses that have participated in the local
with lower longevity (0.4) reflecting a modest but grain economy is dominated by conventional, for-
stable core and relatively large number of newer profit forms of limited liability companies (67%),
participants. general corporations (20%), and limited liability
partnerships (4%). Two nonprofit corporations
Network Size and Diversity participated in the early years, and one (for-profit)
Diversity of both businesses and products in- benefit corporation is still active. The size of busi-
creased over time (Table 5). In 2012, there were a nesses involved in most sectors is in the micro to
handful of mainly small farms growing primarily very small range, most with fewer than 10 employ-
White Sonora, very limited grain handling facilities, ees and many with fewer than five. The exceptions
a rudimentary milling operation, and three bakeries. are a few larger breweries with restaurant opera-
In 2019, five larger farms were growing around 10 tions that have over 50 staff. Regarding the racial,
varieties of wheat and barley, two dedicated grain ethnic, and gender diversity of people involved in
handling facilities were in operation, two craft mill- the local grain economy, we did not formally col-
ing and one malting business had been established lect data, but from observation we believe it is safe
producing a broad range of value-added and pack- to say it is predominantly white and male. Notable
aged grain products, and almost 40 secondary pro- exceptions though, include two Indigenous com-
cessing businesses were using local grain ingredi- munity producers, a second-generation Asian pro-
ents to produce a wide variety of baked goods, ducer/processor, and Latino bakers, particularly
beers, and spirits. This account does not include since the recent uptake by tortillerias.
the dozens of restaurants, numerous small stores,
and several supermarkets that also regularly use Network Density, Clustering, and Centrality
end products from mills and grain handlers. The current state of the economic network
Some other facets of the local grain economy, (Figure 5) can be described using network metrics
Table 5. Change in Diversity of the Local Grain Economy in Arizona Between 2012 and 2019
Business /
Sector Products 2012 2019
Production Growers 6 micro to small community farms and 8 small to medium family and Indigenous
1 larger family farm, ranging from 1– community farms ranging from 50 to 4,000
700 acres (0.4–283ha) acres (20–1,619ha)
Grain Varieties 3 Wheat: White Sonora, Emmer, Red 6 Wheat: White Sonora, Red Fife, Rouge
Fife Bordeaux, Emmer, Einkorn, Khorasan
2 Durum Wheat: Blue Beard, Desert
3 Barley: Purple Barley, Bronze Barley, Copeland
Primary Businesses 1 micro mill 2 small mills, 1 bakery with an integrated micro
Processing mill
2 grain handlers (cleaning, storage)
1 malting
Ingredient- Small variety of flours (see above) Large variety of flours (see above)
Products One base malt
Secondary Businesses 3 small bakeries, and 1 pizzeria 5 bakeries (1 micro, 3 small, 1 medium)
Processing 2 pizzerias, 3 pasta makers, 3 tortillerias
18 breweries, 4 distilleries, 2 home brew stores
End-Products Bread Bread, Pizza, Pasta, Wheat berries, Tortillas
Beer, Spirits
Volume 10, Issue 2 / Winter 2020–2021 517Journal of Agriculture, Food Systems, and Community Development
ISSN: 2152-0801 online
https://foodsystemsjournal.org
from graph theory. The density (measure of clustered (Figure 5): around Tucson in the south,
connectedness among all nodes or businesses) is Phoenix in the center, and Verde Valley/Flagstaff
very low at 2%, the average degree (number of in the north, indicating that secondary processors
connections of each node) is also low at 1.12, and have some affinity for local processors. Yet, for the
the average path length is short, at 1.79, compared most part, processors supply end-producers all
to the maximum of 3. These numbers express what over the state.
is visually apparent: that most nodes or businesses
have only a single connection and go through two Short Supply Chain Aspects
or three links to connect to other nodes or The possibility of making personal connections
businesses. This is expected, knowing that the grain within the supply chain was given by 25% of inter-
usually goes through the primary processors (grain viewees as a motivation to participate in the local
handlers, mills, maltings) to get to secondary grain economy. This extended to making connec-
processors. There are, however, some instances of tions to consumers in order to build, and be sup-
grain going direct from farm to secondary ported by, community (mentioned by 20% of inter-
processor (one link), such as unmalted White viewees as important functions of the local grain
Sonora being used in wheat beers, or bakers using economy). There was also a strong indication from
whole grains in multigrain loaves. For the most interviewees that creating a culture and identity
part, however, the centralization of the network around local food, particularly heritage grains, was
around four star-shaped nodes is clear, showing of high importance, with significant appreciation
that almost all of the supply-chain paths go for White Sonora’s historical connections. The
through one (or two) of these four nodes, and as extent to which this is shared by customers,
such, they are critical links in the economy. however, is less clear.
There are three supply-
Figure 5. The Local Grain Economic Network in Arizona, 2019
chain types: (i) grower →
secondary processor; (ii) grower Four main business categories are shown in different colors using an adjusted
→ primary processor → geospatial layout in Gephi network analysis tool (Bastian et al., 2009). Nodes are
not in their exact location and the Arizona geographical overlay is indicative only.
secondary processor; and (iii)
Out-of-state entities are: A=Malting, B=Brewery, C=Bakery, D=Mill, E=Farm.
grower → primary processor →
primary processor → secondary
processor. When retailers or
restaurants are appended to
these chains, as outlets for
products such as wholesale
bread, packaged flour, or beer,
supply chains can extend to four
links. There is some local
centrality, meaning that many of
the growers or secondary pro-
cessors connect to only one of
the primary processing centers,
but there are some that connect
to more than one. We see, for
example, some brewers obtain-
ing supplies from both malting
and grain handler, and bakers
obtaining supplies from both
mills. This local centrality is
somewhat geographically
518 Volume 10, Issue 2 / Winter 2020–2021Journal of Agriculture, Food Systems, and Community Development
ISSN: 2152-0801 online
https://foodsystemsjournal.org
Another aspect, seen as important by 20% of wheat previously shipped 1,000 miles (1609 km) or
interviewees, is that the physically short supply more from mills and growers mostly in western
chains reduces food miles. This replaces flour and U.S. states, and malt shipped 2,000 miles (3218 km)
from midwestern maltings
Figure 6. Year-by-Year Development of the Local Grain Economic Network and Canadian growers.
in Arizona, 2012–2019 Due to the relatively low
volumes and logistics
Four main business categories are shown in different colors using an adjusted geo-
spatial layout in Gephi network analysis tool (Bastian et al., 2009). Out-of-state entities
involved in local grain
are: A=Maltster, B=Brewery, C=Bakery, D=Mill, E=Farm. Longitudinal arrows demarcate distribution, however, the
early development, consolidation, and expansion stages. associated greenhouse gas
emissions reductions
might be offset to some
2012 2016
A extent by less-efficient
smaller vehicles and lower
loads.
D
Development of the
Economic Network
We tentatively identified
four stages in the develop-
2013 2017 ment of the economic
A network (Figures 6 and 7),
described below with key
D
activities marked in italics.
Early Development
(2012–2014)
In the first stage, develop-
ment happened around
2014 2018 one central node, the ini-
A
tial mill in Phoenix (Hay-
C den Flour Mill), which
D D provided a first critical
F
link between growers and
bakers. Key activities and
supporting factors in this
stage included: (i) the
formation of a core group of
2015 2019 transformational entrepre-
A
B
neurs, consisting of a mill-
C er, a restaurateur, an arti-
D D san baker, and a farmer;
E
(ii) support from the
Arizona-based seed con-
servation organization,
Native Seed/SEARCH
Farms Primary Processors Bakeries Breweries Out of State (NS/S), with US$50,000
Development Stage: Early Consolidation Expansion USDA funding, who led a
Volume 10, Issue 2 / Winter 2020–2021 519Journal of Agriculture, Food Systems, and Community Development
ISSN: 2152-0801 online
https://foodsystemsjournal.org
Figure 7. Development Stages of the Local Grain Economic Network in Arizona with Key Activities and
Primary Type of Actor Performing Them
supply-chain development project to create an initial con- and demand; (iii) breweries experimenting and begin-
stellation of growers, millers, bakers, and chefs to ning to regularly use (unmalted) White Sonora; (iv)
simultaneously develop the demand and supply a second, unrelated, supply-chain development project to
sides around the startup milling operation; (iii) develop demand and supply sides for malted bar-
collaboration between the aforementioned entrepre- ley, conducted by The Nature Conservancy and a
neurs involving openness, resource and informa- group of transformational entrepreneurs; and (v)
tion sharing, experimenting, and learning tacit skills collaboration and experimentation in a pilot project to
from each other; and (iv) performing training, out- grow barley in Arizona, malt it out of state, trans-
reach, and publicity activities to build capacity in port it back to Arizona, and brew experimental
growers and bakers, and grow the market. beers; and (vi) continued prominent national and
regional publicity.
Consolidation (2014–2017)
Two additional central nodes started in this stage: a Expansion (2017–2019)
Phoenix grain handling operation (Grain R&D) In the third stage, the four processing operations
and an integrated grain handling and milling center were prominent hubs in the network, and the num-
in the Tucson area (BKW). Many supply-chain ber and types of secondary processors significantly
paths now became three links with two primary expanded. Key activities and events were: (i) major
processing steps (producer → primary processor investment in infrastructure, including US$2M in grain
→ primary processor → secondary processor). A handling and milling facilities by Grain R&D and
fourth central node, the Sinagua Malt malting in Hayden Flour Mill, and US$0.8M for Sinagua
the Verde Valley, 90 miles (146 km) north of Malt’s malting facility; and (ii) significant uptake of
Phoenix, also began to emerge. Key events and local grain by existing businesses, particularly brew-
activities in this phase included: (i) business develop- eries and distilleries, and new businesses (bakeries,
ment of Hayden Flour Mill (including online retail) tortillerias, pizzerias, pasta makers) forming around
and Barrio Bread, an artisan bakery in Tucson, the use of local grains as a core feature.
funded by separate USDA grants of US$100,000
each; (ii) experimenting with new varieties requested Predevelopment (pre-2012)
by bakers and brewers, leading to stabilization of Predevelopment and contextual aspects were also
products (e.g., grain varieties, flour mixes), and, important in the network development. Contextu-
with some production coordination among growers by ally, Arizona’s hot desert climate and the availabil-
Grain R&D, finding an equilibrium between supply ity of irrigated water makes it suitable for growing
520 Volume 10, Issue 2 / Winter 2020–2021Journal of Agriculture, Food Systems, and Community Development
ISSN: 2152-0801 online
https://foodsystemsjournal.org
specialty wheats, like khorasan, that originated in a essential for the development of the local grain
similar climate, while White Sonora is a uniquely economy in Arizona. Another is the rise in interest
desert-adapted variety with a 400-year history in and demand for artisan bread and craft beer which cre-
the region. Large areas of agricultural land in prox- ated a market for the local grain products while
imity to two large cities (Phoenix and Tucson) with driving development of the network through par-
strong local food cultures and direct sales channels ticipation of passionate, curious, and skilled bakers
are enabling factors for the local grain economy in and brewers. A third early factor, out of which
particular and for alternative food networks in Sinagua Malt grew, were the several years of
general (Hills et al., 2013b). groundwork by The Nature Conservancy in Cen-
Important predevelopments include the exten- tral Arizona to find innovative, multistakeholder,
sive work of seed conservationists and revivalists, Glenn entrepreneurial solutions to water conservation.
Roberts (Anson Mills) and Gary Nabhan (NS/S),
whose knowledge, experience, and seed bank were Impacts on the Local Economy
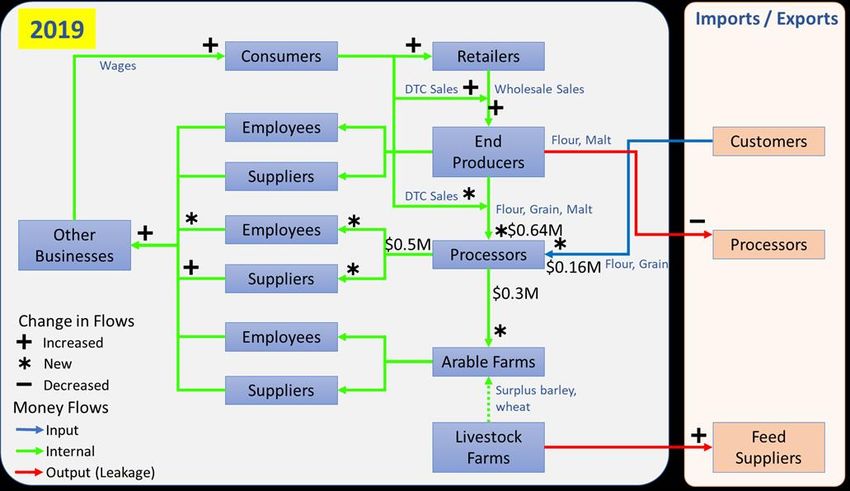
Figure 8. Changes in Money Flows in the Local Grain Economy in Arizona, Local money flow and job
Pre-2012 and 2019 (DTC=Direct to Consumer) creation
With the growth of the
local grain economy, sec-
ondary processors and
direct consumers have
redirected some expendi-
tures on grain, flour, and
malt to the new primary
processors (grain hand-
lers, mills, maltings),
which also receive reve-
nue from out-of-state
sales (Figure 8). The pro-
cessors’ aggregate total
revenue in 2019 is esti-
mated at US$800,000,
of which 20% is from
exports. Thus,
US$640,000 is money that
would have left the state,
and US$160,000 is new
money coming into the
state. The processors
spend that income on
grain from local farms,
other suppliers, employee
costs, and taxes. We
estimate that US$300,000
is paid to farmers, replac-
ing income they would re-
ceive from local livestock
farms for feed barley or
corn, or from conven-
Volume 10, Issue 2 / Winter 2020–2021 521Journal of Agriculture, Food Systems, and Community Development
ISSN: 2152-0801 online
https://foodsystemsjournal.org
tional durum wheat exports, in the absence of de- to apply Duval et al.’s (2016) multiplier effects to
mand for sustainably grown heritage grains and the local grain economy in Arizona as a first-order
malted barley (farmer, personnel communication, approximation. Doing so suggests that the local
February 10, 2020). This is not new money for grain economy has boosted sales by US$1M (2.0 *
these farms; it is replacing their previous earnings US$500,000) and jobs by 18 (1.8 * 10) in total
from livestock farmers, who, we assume, are now across all sectors.
increasing imports of feed by the same amount Numerous additional indirect jobs may have
(although some of the demand may have switched been created as bakeries and breweries have ex-
to other in-state farms). The processors are as- panded and new ones have started. While local
sumed to spend the US$500,000 balance on local breweries, bakeries, and restaurants clearly drive
supplies, wages, and taxes. This is new money be- demand for local grain, it is not clear the extent to
ing kept in the state. Secondary and tertiary trans- which local grain supply is driving growth in these
actions by suppliers and their employees keep secondary processing businesses: they may have
some percent of this new money in-state as well, grown or have been started whether they use local
including some of it being spent on local grain end- grain or not. However, some of the businesses
products (beer, bread, pizza, etc.). Thus, there is a make local grain a prominent “unique selling prop-
boost to the overall Arizona economy, and even to osition.” All the businesses, whether explicit or not
the local grain economy, however small, from the in their marketing, may benefit from producing
increased money circulation in the state. unique and quality products made possible by local
Similar to the money flow, it is the jobs created grains. Local grains therefore may also be credited
by the primary processors that can be considered with contributing to the growth of secondary
new jobs. For farms, the labor demand was un- processing businesses.
changed: farms are still growing crops, albeit differ- Interviewees clearly see contributing to the
ent ones. Secondary processors (bakeries, brewer- local economy as an important part of what they
ies, etc.) have the same labor demand: they are still do, with 25% mentioning it as a key characteristic
baking bread or brewing beer, albeit with different of the local grain economy and 40% stating it as a
flour or malt. We estimate a total of 10 jobs have reason why they choose to grow or use local grain.
been directly created by 2019. Some are minimum Keeping money in the local economy was the com-
wage, a few tend toward “unskilled” labor, while mon refrain, with a concern for farmer livelihoods
several are skilled craft jobs (millers, maltsters), and and a desire to see money more evenly distributed
all require learning much about the new grain econ- across the supply chain also frequently mentioned.
omy. There is also some augmentation with free However, there was little mention of the job-
labor by entrepreneurs. creation aspects and no mention of improving
Duval et al. (2016) put the total value of con- employment conditions for farm workers or other
ventional Arizona small grains agriculture sales in minimum-wage workers in the food sector.
2014 at US$104 million and estimated a multiplier
effect for the mainstream small-grain economy Sustainability Features of the Local Grain Economy
through economic input/output analysis of 2.0, or The local grain economy seems now well estab-
a total of US$206 million of sales in the state in- lished in Arizona, with hundreds of acres under
cluding indirect and induced expenditure. They production, yielding hundreds of tons of well-
also estimated a jobs multiplier of 1.8 (814 direct adapted grain varieties and involving dozens of
jobs and 671 secondary). There are significant dif- well-connected small businesses that produce a
ferences between the mainstream small-grain pro- variety of quality local products for a growing con-
ducers of Duval et al.’s (2016) study and the local sumer base. Below, we synthesize the results pre-
grain processors of our study, including being in sented in the sections above to offer an initial,
different supply-chain sectors, and therefore, sig- though limited, appraisal of the local grain econ-
nificant differences in multiplier effects are likely. omy’s sustainability (Table 6).
Notwithstanding such differences, it is still useful To summarize, it seems the local grain econ-
522 Volume 10, Issue 2 / Winter 2020–2021Journal of Agriculture, Food Systems, and Community Development
ISSN: 2152-0801 online
https://foodsystemsjournal.org
omy in Arizona is having positive sustainability im- are of relevance to the development of local grain
pacts, with some clear economic, environmental, economies in other regions, too.
and social benefits, although there is room for
improvement. Impact. The total local grain production, and in
most grain categories, is currently (2019) less than
Discussion one percent of total grain production in Arizona,
While the local grain economy in Arizona has even though conventional production is at its low-
grown in size, diversity, and sustainability efforts est level in 15 years. Clearly, the impact compared
since its inception in 2012, there are a number of to conventional grain economy outputs is small.
critical issues that warrant closer scrutiny as they Yet, it would be misleading to gauge the impact of
Table 6. Sustainability of the Local Grain Economy in Arizona, 2019
Economic Features Environmental Features Social Features
45 local businesses (partially) Most farmers practice organic, Meaningful skilled jobs created in
build their operations around local natural, or low-input farming. For primary and secondary processing
grain, covering all sectors and some, the switch to local grain businesses.
business categories. reduced pesticide and herbicide
use. Revival of artisan crafts in the food
Many businesses, particularly in economy.
production, processing, and baking Local grains need less water than
sectors show stability over the last the crops they replaced (e.g., White Strengthening of social relations
four years. Sonora needs only 50% of the among supply chain participants
water than conventional wheat). and consumers.
Achievements
Ca. $0.5M annually added to the
Arizona economy with another Switching to barley in the Verde Development of a strong culture
$0.5M added through local Valley has helped restore Verde around local grains as well as
multiplier effects. River flows. rebuilding historical ties (e.g.,
White Sonora).
10 jobs directly created in Re-establishing (locally extinct)
processing sector, with an heritage grains increases Appreciation for the ethical trade
estimated 8 more created in the agricultural biodiversity. aspects of the network, making
wider Arizona economy. sure that farmers are adequately
Food miles have been vastly supported.
Numerous additional indirect jobs reduced from thousands to mostly
may have been created through less than one hundred.
expansions and start-ups of
bakeries and breweries.
Many businesses are micro or Some grow heritage grain only as There is less concern for
small in scale making them very rotational crop every 3-4 years to supporting farm workers and other
vulnerable to shocks (sickness, augment growing alfalfa for the assisting jobs in the grain economy
turnover, pandemic, etc.). meat and dairy industry—with to ensure living wages and
negative impacts. benefits.
Diversity of corporate forms is low
(very few cooperative businesses, Conventional road transport and The racial, ethnic and gender
benefit corporations, or social logistical challenges (relatively diversity of people involved in the
enterprises). small volumes) create local grain economy is limited.
Challenges
inefficiencies and associated GHG
emissions. Employee ownership is low.
Small-scale harvesting, cleaning,
milling, malting, baking, and
brewing operations are less energy
efficient than large-scale
centralized ones.
Only a minority of businesses use
solar energy or energy-efficient
operations.
Volume 10, Issue 2 / Winter 2020–2021 523Journal of Agriculture, Food Systems, and Community Development
ISSN: 2152-0801 online
https://foodsystemsjournal.org
the local grain economy by a narrow comparison Supply-Chain Transparency. As the local grain
against the conventional grain economy, which is economy in Arizona developed and became more
focused on livestock feed, oriented toward ex- differentiated in its operations, the network has
ports, and driven by profit maximization. By added nodes and links. The result is that grain sup-
contrast, the local grain economy focuses on food ply chains may not be so “short,” taking up to four
products for human consumption, generates value links (farm → handler → mill → bakery → con-
in the region, and balances economic viability with sumer), or five if restaurants or retailers are in-
environmental and social benefits. A meaningful serted as the consumer point. This is stretching one
reference is therefore not the conventional grain of the key tenets of alternative food networks: the
economy, but the local economy. With focus on direct connection between producer and consumer,
economic indicators, when consumers and busi- although the strength and validity of such connec-
nesses shift spending to businesses that are locally tions has been called into question (Mount, 2012).
owned and operated, it increases the multiplier It is observable in the marketing and sales of local
effect, keeping money circulating locally for grain products that the further up the chain the
longer, increasing output, jobs, and income, and supply-chain actors are, the less visible and known
expanding the total value of the local economy they are to consumers. While the bakeries and
(Benedek, Fertő, & Szente, 2020). This is what the breweries are well known (maybe even for using
local grain economy in Arizona has been demo- local grain), the processors might be somewhat
nstrating over the past several years. It might be of known, but the farmers are often invisible. Addi-
interest to economic development organizations, tional marketing efforts in the local grain economy
in particular as they consider the wider scope of with support from local food advocacy groups
sustainability, that businesses in the local grain (such as Local First Arizona) could help address
economy have a significant local economic impact this issue to avoid falling back into one of the key
in addition to their social and environmental challenges of conventional food chains, namely,
benefits. that people do not know where their food comes
from.
Growth. On the surface, local grain businesses’
desire for growth seems to follow the dominant Consolidation. In the initial few years of supply-
neoliberal economic growth paradigm. Yet, the chain development in the local grain economy in
shared objective also seems to be the growth of the Arizona, the growers were diverse: they included
local grain economy (the economic network) in micro community organizations, small ecovillage
Arizona rather than the individual businesses. The farms and independent growers, and a couple of
vision is not for any individual business to outcom- larger established farms looking to transition from
pete the others and dominate the local market; in- conventional grain production. As the network
stead, it is about adding more nodes and links to evolved, there has been some consolidation toward
increase the overall impact. And there is a lot of a smaller number of the larger, conventional farms.
potential for the local grain economy in Arizona to In order to develop stability and reliable supply,
grow: for example, a fourfold growth in local grain contracts from mills to grain handlers to farms
production would only result in meeting 3% of have been growing in volume and value. This is a
flour consumption in the state, or a fourfold consequence of financial investments and estab-
growth in local malting production would still only lishment of privately owned grain hubs that need a
supply around 10 of the over 100 craft breweries. reliable network of growers to maintain quality and
While there is considerable diversity in perspectives quantity standards. There is some concern that
among the businesses engaged in the local grain there are not enough farms and that this is a vul-
economy, the common departure from the con- nerability for downstream businesses should, for
ventional growth paradigm aligns with the collabo- example, one of the farms drop out suddenly.
rative and cooperative nature of alternative food There is also the possibility of unhealthy concen-
networks (Renting et al., 2003). tration, which would counter the overall alternative
524 Volume 10, Issue 2 / Winter 2020–2021You can also read