Modeling and Control of EGR on Marine Two-Stroke Diesel Engines - Xavier Llamas - Department of Electrical Engineering
←
→
Page content transcription
If your browser does not render page correctly, please read the page content below
Linköping Studies in Science and Technology
                Dissertations, No. 1904

Modeling and Control of EGR on
  Marine Two-Stroke Diesel
           Engines

                   Xavier Llamas

      Department of Electrical Engineering
             Linköping University
        SE–581 83 Linköping, Sweden
                  Linköping 2018
Linköping studies in science and technology. Dissertations, No. 1904

Modeling and Control of EGR on Marine Two-Stroke Diesel Engines
   Xavier Llamas
   ISBN 978-91-7685-368-9
   ISSN 0345-7524

© 2018 Xavier Llamas, unless otherwise noted. All rights reserved.
   Xavier Llamas
   xavier.llamas.comellas@liu.se
   www.vehicular.isy.liu.se
   Division of Vehicular Systems
   Department of Electrical Engineering
   Linköping University
   SE–581 83 Linköping
   Sweden

The cover: The photo in the background shows several merchant ships arriving and
leaving the Port of Barcelona. Several pictures were used to create the cover photo.
All these images were taken by the author of the dissertation on board of a plane,
seconds before landing at Barcelona Airport in May 2016. The author would like to
thank Albert Escànez for doing an excellent job editing the images and designing the
cover.

Typeset with LATEX 2ε
Printed by LiU-Tryck, Linköping, Sweden 2018
i

Abstract
The international marine shipping industry is responsible for the transport of
around 90% of the total world trade. Low-speed two-stroke diesel engines usually
propel the largest trading ships. This engine type choice is mainly motivated
by its high fuel efficiency and the capacity to burn cheap low-quality fuels.
To reduce the marine freight impact on the environment, the International
Maritime Organization (IMO) has introduced stricter limits on the engine
pollutant emissions. One of these new restrictions, named Tier III, sets the
maximum NOx emissions permitted. New emission reduction technologies have
to be developed to fulfill the Tier III limits on two-stroke engines since adjusting
the engine combustion alone is not sufficient. There are several promising
technologies to achieve the required NOx reductions, Exhaust Gas Recirculation
(EGR) is one of them. For automotive applications, EGR is a mature technology,
and many of the research findings can be used directly in marine applications.
However, there are some differences in marine two-stroke engines, which require
further development to apply and control EGR.
    The number of available engines for testing EGR controllers on ships and
test beds is low due to the recent introduction of EGR. Hence, engine simulation
models are a good alternative for developing controllers, and many different
engine loading scenarios can be simulated without the high costs of running real
engine tests. The primary focus of this thesis is the development and validation
of models for two-stroke marine engines with EGR. The modeling follows a
Mean Value Engine Model (MVEM) approach, which has a low computational
complexity and permits faster than real-time simulations suitable for controller
testing. A parameterization process that deals with the low measurement data
availability, compared to the available data on automotive engines, is also inves-
tigated and described. As a result, the proposed model is parameterized to two
different two-stroke engines showing a good agreement with the measurements
in both stationary and dynamic conditions.
    Several engine components have been developed. One of these is a new
analytic in-cylinder pressure model that captures the influence of the injection
and exhaust valve timings without increasing the simulation time. A new
compressor model that can extrapolate to low speeds and pressure ratios in a
physically sound way is also described. This compressor model is a requirement
to be able to simulate low engine loads. Moreover, a novel parameterization
algorithm is shown to handle well the model nonlinearities and to obtain a good
model agreement with a large number of tested compressor maps. Furthermore,
the engine model is complemented with dynamic models for ship and propeller
to be able to simulate transient sailing scenarios, where good EGR controller
performance is crucial. The model is used to identify the low load area as
the most challenging for the controller performance, due to the slower engine
air path dynamics. Further low load simulations indicate that sensor bias can
be problematic and lead to an undesired black smoke formation, while errors
in the parameters of the controller flow estimators are not as critical. This
result is valuable because for a newly built engine a proper sensor setup is more
straightforward to verify than to get the right parameters for the flow estimators.
ii
iii

Populärvetenskaplig sammanfattning
I större delen av världen stiger konsumtionen av produkter varje år. Ofta till-
verkas dessa produkter inte lokalt, utan måste transporteras långa avstånd för
att nå sin slutdestination. Behovet av att förflytta gods täcks främst genom
transporter till havs, med stora fraktfartyg som drivs av förbränningsmotorer.
De större fraktfartygen drivs av tvåtaktsmotorer, vilka har flera grundläggande
skillnader mot den typiska fyrtaktsmotorn som används i bilar. Tyvärr produ-
cerar dessa enorma förbränningsmotorer stora mängder skadliga utsläpp som
förorenar miljön. Detta påverkar inte endast vår hälsa utan även den hos alla
andra levande varelser bosatta på jorden. Därav är den slutgiltiga frågan: hur
kan vi minska den negativa påverkan som förbränningsmotorer i stora fraktfartyg
har på vår miljö? Internationella organisationer som ansvarar för att reglera
transporter till havs har nyligen tagit tag i denna fråga genom att ytterligare
minska mängden tillåtna skadliga utsläpp från fartygsmotorer. Detta görs med
avsikten att få utvecklare och tillverkare av fartygsmotorer att sträva efter mer
miljövänliga förbränningsmotorer, på samma sätt som det gjort för bilindustrin.
Nuvarande tekniker för att minska föroreningar är välutvecklade för användning
på bilmotorer, men för de större motorerna som används i fartyg är utvecklingen
efter. Denna avhandling siktar på att minska detta gap genom att utveckla
användbara verktyg för ingenjörer som utvecklar motorer med föroreningssän-
kande egenskaper. Det finns flera olika tekniker för att sänka mängden utsläppta
föroreningar, denna avhandling fokuserar på Exhaust Gas Recirculation (EGR),
vilket främst reducerar farliga utsläpp genom att låta en del av motorns avgaser
pumpas tillbaka in i motorn för att förbrännas igen.
    De framtagna verktygen består av matematiska simulationsmodeller av mo-
torkomponenter, dessa kopplas ihop för att tillsammans forma en virtuell motor
som kan användas med en vanlig dator. Därutöver kombineras motormodellen
med en fullständig fartygsmodell, så att realistiska simuleringar av motorn bete-
ende under fartygsmanövrar kan utföras. Möjligheten att kunna testa koncept
på förhand via simuleringar är väldigt användbart för ingenjörer och är billigt i
jämförelse med att testa direkt på stora fartygsmotorer som förbränner stora
mängder dyrbart bränsle. De beskrivna modellerna i avhandlingen är justerade
för att beskriva två olika fartygsmotorer med hjälp av riktig motormätdata.
Modellerna visas stämma väl överens med motorkaraktäristiken vid olika last.
Särskild uppmärksamhet har dock givits till att få extra hög noggrannheten
hos modellen när motorn arbetar vid låg last. Motorn arbetar typiskt vid låg
last när ett fartyg förflyttar sig nära en hamn. Hamnar och kustlinjer är nära
befolkade områden där utsläppsgränser är hårdare, därför måste tekniker för att
minska utsläpp fungera på topp i dessa områden. Ett originellt reglerkoncept
som undviker bildning av sot när ett fartyg accelererar testas med den utveckla-
de simuleringsmodellen och användbara förbättringsförslag beskrivs. Som ett
resultat kommer kunskapen given i denna avhandling skynda på arbetet hos
andra ingenjörer med målet att utveckla miljövänligare motorer, för ett mindre
skadligt transportsystem inom en nära framtid.
iv
v

Acknowledgment
At the start of my Ph.D. studies, writing a dissertation felt like a very distant
goal. Now, thanks to the contribution of many people in very different ways, I
have reached this objective. Therefore, it is time to thank appropriately everyone
who has helped me during the process.
    I would like to start by thanking Lars Nielsen for letting me join the division
of Vehicular Systems to pursue a doctoral degree. My supervisor, Lars Eriksson,
deserves my most sincere gratitude for guiding me through the tortuous path of
the Ph.D. studies. I have always received excellent advice from him, and I believe
that he has transmitted me at least some of his huge passion for automotive
systems research. I would like to say a special thank you to Vaheed Nezhadali for
being a great colleague and for many football evenings, to Kristoffer Lundahl for
the friendly atmosphere at the L-building and the funny moments during trips
(and planning trips), and to Martin Sivertsson for his endless discussions about
practically any topic. Moreover, it has been a pleasure to work with Christofer
Sundström, Andreas Thomasson, Kristoffer Ekberg, and Viktor Leek in different
publications. I would also like to thank Pavel Anistratov, Jordi Loureiro and
Robin Holmbom for proofreading parts of this thesis, and Victor Fors for helping
me with the Swedish language in this dissertation. Finally, I am very thankful
to all current and former colleagues at the division for creating a great working
environment at the office and during teaching sessions, and for many enjoyable
situations during “fika” breaks and conference trips.
    The financial support from the European Union’s Hercules 2 project, and
from the Vinnova’s Industry Excellence Center LINK-SIC is much appreciated.
I would also like to express my gratitude to everyone at MAN Diesel & Turbo
involved with the project. Special thanks to Morten Vejlgaard-Laursen and
Casper Hededal Svendsen for managing the project from the industrial side. It
has also been a pleasure to collaborate with Guillem Alegret regarding marine
engine modeling, and share with him many good dinners every occasion that I
was in Copenhagen. Kræn Vodder Busk is also much appreciated for helping
out every time that I asked for more engine data, and for his valuable input on
modeling and control of marine two-stroke engines.
    I would also like to thank all my lifelong friends for their genuine friendship.
I have been far away from them during these years, but we have shared plenty
of fun moments during every visit and trip back home. My very international
friends in Sweden are also much appreciated for many enjoyable pub nights,
and for all the beer brewing sessions. I am very thankful to my sisters for,
among many other reasons, always being available to help me out and share
some laughs, to my mother for convincing me that I could do anything, and to
my father for teaching me many useful things and even more for showing interest
in my publications. I cannot mention here the rest of my family, but I am very
grateful to them for their love and support. Last but not least, I would like to
thank Marta for being in my life. Her daily smile and love mean a lot to me.

                                                                Xavier Llamas
                                                         Linköping, January 2018
vi
Contents

1 Introduction                                                                                                       3
  1.1 Thesis Outline . . . . . . . . . . . . . . . . . . . . . . . . . . . . . . .                                   6

2 Marine Two-Stroke Diesel Engines                                                                                   7
  2.1 Characteristics of Marine Two-Stroke Engines          .   .   .   .   .   .   .   .   .   .   .   .   .   .    7
  2.2 Turbocharging and Turbocharger Models . .             .   .   .   .   .   .   .   .   .   .   .   .   .   .   13
  2.3 The Exhaust Gas Recirculation System . . .            .   .   .   .   .   .   .   .   .   .   .   .   .   .   14
  2.4 Measurement Availability . . . . . . . . . . .        .   .   .   .   .   .   .   .   .   .   .   .   .   .   17

3 Publications and Main Contributions                                                                               21
  3.1 Summary and Contributions of the Papers Included in the Thesis . . .                                          21
  3.2 Other Publications by the Author . . . . . . . . . . . . . . . . . . . . .                                    24

References                                                                                                          27

Papers                                                                                                              37
1 Parameterizing Compact and Extensible Compressor Models                                               Using
  Orthogonal Distance Minimization                                                                                  39
  1    Introduction . . . . . . . . . . . . . . . . . . . . . . . . . . . . . .                         .   .   .   40
  2    Compressor Maps . . . . . . . . . . . . . . . . . . . . . . . . . . .                            .   .   .   41
  3    Experimental Data . . . . . . . . . . . . . . . . . . . . . . . . . .                            .   .   .   43
  4    Compressor Model . . . . . . . . . . . . . . . . . . . . . . . . . .                             .   .   .   43
  5    Compressor Model Parametrization . . . . . . . . . . . . . . . . .                               .   .   .   50
  6    Model Validation . . . . . . . . . . . . . . . . . . . . . . . . . . .                           .   .   .   55
  7    Conclusions . . . . . . . . . . . . . . . . . . . . . . . . . . . . . .                          .   .   .   58
  References . . . . . . . . . . . . . . . . . . . . . . . . . . . . . . . . . .                        .   .   .   64

                                            vii
viii 2 Control-Oriented Compressor Model with Adiabatic Efficiency Ex- trapolation 67 1 Introduction . . . . . . . . . . . . . . . . . . . . . . . . . . . . . . . . . 69 2 Compressor Performance . . . . . . . . . . . . . . . . . . . . . . . . . . 70 3 Experimental Data . . . . . . . . . . . . . . . . . . . . . . . . . . . . . 73 4 Compressor Model . . . . . . . . . . . . . . . . . . . . . . . . . . . . . 74 5 Model Parameterization . . . . . . . . . . . . . . . . . . . . . . . . . . 80 6 Model Validation . . . . . . . . . . . . . . . . . . . . . . . . . . . . . . 86 7 Conclusions . . . . . . . . . . . . . . . . . . . . . . . . . . . . . . . . . 93 References . . . . . . . . . . . . . . . . . . . . . . . . . . . . . . . . . . . . . 96 3 Modeling of a Large Marine Two-Stroke Diesel Engine with Cylinder Bypass Valve and EGR System 99 1 Introduction . . . . . . . . . . . . . . . . . . . . . . . . . . . . . . . . . 100 2 Modeling . . . . . . . . . . . . . . . . . . . . . . . . . . . . . . . . . . 100 3 Experimental data and tuning procedure . . . . . . . . . . . . . . . . . 107 4 Model Validation . . . . . . . . . . . . . . . . . . . . . . . . . . . . . . 109 5 Conclusions . . . . . . . . . . . . . . . . . . . . . . . . . . . . . . . . . 109 References . . . . . . . . . . . . . . . . . . . . . . . . . . . . . . . . . . . . . 114 4 A Model of a Marine Two-Stroke Diesel Engine with EGR for Low Load Simulation 117 1 Introduction . . . . . . . . . . . . . . . . . . . . . . . . . . . . . . . . . 118 2 Experimental data . . . . . . . . . . . . . . . . . . . . . . . . . . . . . 119 3 Modeling . . . . . . . . . . . . . . . . . . . . . . . . . . . . . . . . . . 119 4 Parameterization Procedure . . . . . . . . . . . . . . . . . . . . . . . . 125 5 Model Validation . . . . . . . . . . . . . . . . . . . . . . . . . . . . . . 126 6 Conclusions . . . . . . . . . . . . . . . . . . . . . . . . . . . . . . . . . 127 References . . . . . . . . . . . . . . . . . . . . . . . . . . . . . . . . . . . . . 132 5 Control-Oriented Modeling of Two-Stroke Diesel Engines with EGR for Marine Applications 135 1 Introduction . . . . . . . . . . . . . . . . . . . . . . . . . . . . . . . . . 137 2 Experimental Data . . . . . . . . . . . . . . . . . . . . . . . . . . . . . 140 3 Engine Modeling . . . . . . . . . . . . . . . . . . . . . . . . . . . . . . 141 4 Model Parameterization . . . . . . . . . . . . . . . . . . . . . . . . . . 158 5 Model Validation . . . . . . . . . . . . . . . . . . . . . . . . . . . . . . 161 6 Guidelines for Future Engine Measurements . . . . . . . . . . . . . . . 166 7 Propeller and Ship Resistance Models . . . . . . . . . . . . . . . . . . 166 8 Conclusions . . . . . . . . . . . . . . . . . . . . . . . . . . . . . . . . . 173 References . . . . . . . . . . . . . . . . . . . . . . . . . . . . . . . . . . . . . 179 6 Robustness Analysis of the Next Generation of EGR Controllers in Marine Two-Stroke Diesel Engines 183 1 Introduction . . . . . . . . . . . . . . . . . . . . . . . . . . . . . . . . . 185 2 Engine and Ship Models . . . . . . . . . . . . . . . . . . . . . . . . . . 186 3 Engine Controller . . . . . . . . . . . . . . . . . . . . . . . . . . . . . . 186 4 Results . . . . . . . . . . . . . . . . . . . . . . . . . . . . . . . . . . . . 190 5 Conclusions . . . . . . . . . . . . . . . . . . . . . . . . . . . . . . . . . 195 References . . . . . . . . . . . . . . . . . . . . . . . . . . . . . . . . . . . . . 199
Introduction
1
                                                    Introduction

The transportation sector is responsible for an enormous amount of energy con-
sumption, which continues to grow every year. Despite the increase in renewable
energy consumption seen in the last years, this sector is still overwhelmingly
based on petroleum consumption, see U.S. Energy Information Administration
[1]. Internal Combustion Engines (ICEs) of the reciprocating type, are used
as prime movers in a wide variety of vehicle types, from small motorcycles to
massive cargo ships. This kind of engines can use alternative fuels, but in general,
they are consumers of petroleum-based fuels.
    For the particular case of the largest marine vessels, like container ships and
bulk carriers, the most common engine choice is the low-speed two-stroke diesel
engine. One of the main reasons for this selection is the high fuel efficiency of
this type of engine. However, two-stroke diesel engines are also responsible for
a significant amount of pollutant emissions due to, among other reasons, the
usual low-quality fuel that they burn.
    The last decades have also seen an increased interest in reducing the envi-
ronmental impact that the ICEs have on Earth’s ecosystems. Governments and
governmental institutions, following the scientific progress and societal demands,
have gradually introduced more strict pollutant emission limits on the ICEs
exhaust gases. These regulations have forced the engine manufacturers to invest
in research for new technologies that mitigate the amount of different harmful
pollutants produced, and thus, progressively reduce the impact that the ICEs
have on our environment.

Emission Regulations on Marine Engines
The International Maritime Organization (IMO) is the United Nations agency
responsible for setting the emission limits in the marine freight sector. While

                                         3
4 Chapter 1. Introduction
road vehicles have been at the vanguard of emission reduction regulations, the
maritime transport started to be regulated several years later. For the case of
nitrogen oxides (NOx ) emissions, the first limitation was named Tier I and it
was introduced in the year 2000. More recently, the stricter Tier III emission
limits have been introduced [2], and constitute an essential step towards a
more environmentally friendly maritime transport. Tier III limits only apply
to specific NOx Emission Control Areas (NECAs). Outside the NECAs, sailing
ships have to respect the less strict Tier II NOx emission limits. Currently, the
North American, Puerto Rico and Hawaii coasts are NECAs, and it is important
to mention that the restrictions are applied only to vessels built on or after the
1st of January 2016. Recently, the North Sea and the Baltic Sea have been
formally designated NECAs by IMO [3], and the Tier III NOx limits will have
to be fulfilled by vessels constructed on or after the 1st of January 2021.
IMO also regulates sulfur oxides (SOx ) and particulate matter (PM), which
apply to all vessels regardless of the construction date. Similar to the NOx case,
more strict limits are defined in particular SOx Emission Control Areas (SECAs),
and currently, the NECAs mentioned above are also SECAs, see IMO [4] for
further details. Furthermore, IMO has also envisioned an important reduction
of carbon dioxide (CO2 ) emissions from the international shipping. This path
has started by enforcing mandatory increases of engine efficiency through the
Energy Efficiency Design Index (EEDI) introduced in 2013, see IMO [5].
Emission Abatement Technologies for Marine Engines
In marine two-stroke engines, sulfur oxide limits are usually fulfilled by using a
better quality heavy fuel oil with less sulfur content, or with the help of scrubbers
to clean the exhaust gases from SOx . For the case of particulate matter, also
better quality fuel, scrubbers and diesel particulate filters are suitable solutions,
see Lack et al. [6].
Reaching the stricter NOx Tier III emission limits on marine two-stroke
engines is a more complicated task. Decreasing the NOx emissions can be
achieved by adjusting the combustion process using different fuel injection
timings or pilot injections, see Andreadis et al. [7], Liu et al. [8], and Hountalas
et al. [9]. Miller timing is also a suitable technique to reduce NOx at a price of an
increased specific fuel oil consumption (SFOC), as discussed in Feng et al. [10].
Moreover, water addition techniques have an even more significant potential to
reach the Tier III limits, but they are associated with substantial increases on
soot emissions and SFOC, see Henningsen [11], Tanner et al. [12], and Chryssakis
et al. [13]. As a result, more complex technologies have to be adopted by marine
ICE designers since the techniques mentioned above are not sufficient to reach
the Tier III target alone. One of the possibilities is to design engines capable
of running on gas or dual-fuels, see Ott et al. [14] and Unseki [15]. Other
two promising technologies considered by the engine designers to achieve such
reduction are the Selective Catalytic Reduction (SCR) and the Exhaust Gas
Recirculation (EGR). The different NOx abatement technologies have distinct
advantages and disadvantages, and currently, there is no clear trend of which
one will dominate the market in the future.5
SCR is based on an after-treatment chemical process that removes the formed
NOx by injecting a reacting agent in the catalytic converter. There are two
primary SCR architectures: high pressure and low pressure, depending on the
position of the SCR reactor relative to the engine’s turbine, e.g., Sandelin and
Peitz [16] and Ryu et al. [17].
On the other hand, EGR is a technology that aims at reducing the amount
of formed NOx during the combustion. This reduction is achieved by increasing
the heat capacity of the gas in the combustion chamber by diluting the air with
recirculated burned gases, which also lowers the O2 availability. With a higher
heat capacity, the cylinder temperatures are lower which directly reduces the
amount of thermal NOx production, Heywood [18]. Furthermore, EGR can be
combined with injection control strategies, water injection and Miller timing
to adjust even more the trade-offs between SFOC, soot formation, and NOx
emissions, e.g., Feng et al. [10], Liu et al. [19], Wang et al. [20], and Sun et al.
[21]. It is important to recall that the highest NOx decrease has to be achieved
in the coastal NECAs where certain harbors are located. This issue complicates
the EGR control problem since the ship has to be able to maneuver at low
engine loads while keeping a high EGR rate. Therefore, extending the simulation
models to low load operation is crucial for using them to design and test better
controllers.
Thesis Motivation
EGR systems on low-speed two-stroke diesel engines are relatively new. By
reducing the oxygen concentration of the fresh air used in the combustion, the
produced NOx can be reduced substantially. See the following test results for
a low-pressure EGR: Okabe et al. [22] and Hiraoka et al. [23]. Controlling a
specified oxygen level setpoint is a relatively simple task by using feedback
control during slow transients. However, the feedback controller has a poor
performance during fast transients. This bad performance is mainly due to the
inherent delays in the scavenging oxygen sensor signal, together with the direct
coupling between oxygen concentration and maximum fuel burning capacity
during accelerations, see Nielsen [24]. Thus, more advanced control algorithms
are necessary to avoid undesirable black smoke from incomplete combustion, as
proposed in Nielsen et al. [25, 26].
During the investigation and practical implementation of more advanced
control strategies, engine testing time is needed, which is not an abundant
resource. The first reason is that there are not many EGR engines available
yet, and testing them requires agreements with the engine owners. Test beds
exist, but not in as large numbers as in the automotive industry. So the overall
availability is very limited, and the high cost of running these engines is also a
motive for finding alternatives. Hence, having an accurate and fast simulation
model that can be used for controller design and evaluation is a great asset to
speed up the development, and also to save money by doing only the minimum
amount of real engine tests.
The work presented in this thesis is dedicated to the development, param-
eterization, and validation of low-speed two-stroke engine models for EGR6 Chapter 1. Introduction control applications. The model has been applied to two different two-stroke diesel engines with EGR, showing its generality. Several engine components are investigated in more detail, in particular, a compressor model capable of extrapolating to low speeds, which is a requirement to be able to simulate low load operation with the engine model. Furthermore, a dynamic model of the ship surge movement is included to be able to simulate ship sailing scenarios. The ship simulation platform has been used to test the next generation of EGR controllers, to demonstrate the usefulness and applicability of the developed models. The results identify the low load area as the most challenging for the EGR controller performance due to the engine slower air path dynamics. The results also show that sensor bias in the EGR controller inputs could lead to black smoke formation while errors in the parameters of controller flow estimators are not as problematic. This work has been carried out in collaboration with MAN Diesel & Turbo, based in Copenhagen, and under the financial support of the Hercules-2 European project [27]. Part of the work has been co-funded by the Vinnova’s Industry Excellence Center LINK-SIC [28]. 1.1 Thesis Outline The next chapter is dedicated to introducing the particularities of the marine low-speed two-stroke engines studied in this thesis. Further details about the turbochargers, the EGR system, and the available measurements on those engines are also discussed with the purpose to serve as an introduction to the papers. The main contributions to the research field of the papers that constitute this thesis are summarized in the third chapter. Moreover, this third chapter also contains other publications by the author during this period, mentioning the author’s particular contributions in each of them. All the modeling details and specific contributions are included in the six appended papers. The appended papers are often referenced in Chapter 2 using its order number, which can be consulted in Section 3.1.
2
                  Marine Two-Stroke Diesel
                                  Engines

This chapter is intended to give a brief introduction to the main characteristics
of large marine two-stroke diesel engines used nowadays in ship propulsion. This
chapter also covers turbocharging and EGR systems applied to this kind of
engine. Finally, the chapter includes a description of the type of measurements
available for development of the thesis models, with focus on the limitations
and differences that exist compared to the kind of measurements available on
smaller automotive-size engines.

2.1     Characteristics of Marine Two-Stroke En-
        gines
Low-speed two-stroke diesel engines are the preferred engine type for propulsion
of large merchant ships. For instance, container ships, oil and gas tankers and
bulk carriers are usually propelled by large two-stroke engines. This choice
is a consequence of several important factors, as described in Xiros [29], and
Woodyard [30]. First, these engines have a high thermal efficiency, with numbers
reaching approximately 50%. Waste heat recovery systems can be installed in
the engine to obtain even higher efficiencies from the hot exhaust gases, see
Shu et al. [31]. Moreover, they are capable of burning cheap low-quality fuels
like heavy fuel oil. Two-stroke engines operate at low-speeds and are capable
of reversing its rotation, which avoids the need of gearboxes by connecting the
engine shaft directly to the propeller. Furthermore, they are simpler, more
reliable and have a higher power to weight ratio compared to four-stroke engines.
    Nowadays, only three engine designers remain in the low-speed two-stroke
engine business: MAN Diesel & Turbo, Mitsubishi Heavy Industries, and Win-
terthur Gas & Diesel. The three of them design low-speed two-stroke engines

                                       7
8 Chapter 2. Marine Two-Stroke Diesel Engines
Exhaust Exhaust
Receiver Valve
Piston
Turbocharger
Piston
Scavenge Rod
Receiver
Intake
Ports
Stuffing
Scavenge Box
Air Cooler
Connnecting
Rod Crosshead
Crankcase “A” Frame
Crankshaft
Bedplate
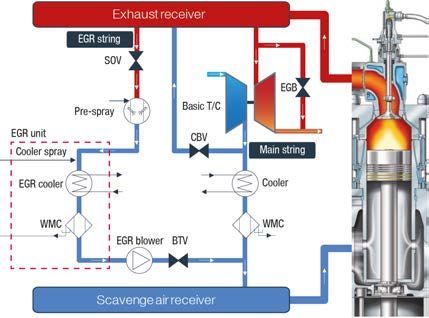
Figure 2.1: Cross section of a MAN Diesel & Turbo G95ME-C engine with
indications of the main engine components. The engine size can be estimated
with the help of the human drawing included. (The original picture belongs to
MAN Diesel & Turbo, it is edited and reproduced here with permission.)
following similar principles: crosshead, constant pressure turbocharged and uni-
flow scavenged with a single exhaust valve in the cylinder head, see Woodyard
[30] for more details. Figure 2.1 contains an annotated picture of one such engine
with indications of the main engine components. An important characteristic is
that the piston and the scavenging receiver are separated from the crankcase by
the stuffing box. This separation prevents the crankcase and cylinder oils from
mixing, which is undesirable due to the sulfur products from the combustion
usually present in the cylinder oil. The crosshead pin that joins the piston and
connecting rods travels inside the vertical crosshead guides mounted in the “A”
frame. These guides ensure the alignment of the piston with the cylinder liner
and absorb any side forces from the crankshaft. Moreover, it allows the use of
very long strokes, which improve overall ship efficiency by reducing, even more,
the engine speeds for the same power output, see Woodyard [30]. Figure 2.1 also
shows the bedplate of the engine, which is the rigid structure that supports the
crankshaft and the rest of the engine components.
Large crosshead two-stroke engines are available in a variety of sizes, speeds,
and power outputs. Before the introduction of the IMO EEDI index to reduce
CO2 emissions, these engines used to be bigger, but nowadays there is a trend
for downsizing. The piston bores are in the range of 300 to 950 mm, and
strokes from 1.3 to 3.7 m. The number of engine cylinders is between 5 to 12,2.1. Characteristics of Marine Two-Stroke Engines 9
depending on the configuration. The maximum continuous rating (MCR) speeds
are between 60 to 250 revolutions per minute, with corresponding power outputs
in the range from 2000 kW to 82 MW. See Winterthur Gas & Diesel [32], MAN
Diesel & Turbo [33], and Mitsubishi Heavy Industries [34] for examples of specific
two-stroke engine designs.
2.1.1 The Two-Stroke Cycle
The two-stroke cycle has some notable differences compared to the four-stroke
cycle widely used in automotive combustion engines. The most important
difference is that the complete thermodynamic cycle is performed with only one
crankshaft revolution compared to the two revolutions required for the four-
stroke engines. This shorter cycle implies that the cylinders fire each revolution,
which theoretically means that they can provide two times more power than a
four-stroke engine of the same size, see Heywood [18]. On the other hand, the
cylinder gas exchange process has to be done within this single revolution. The
crosshead engines rely on the efficient uniflow scavenging method to remove the
burned gases from the cylinder and fill it with fresh air from the scavenging
box, see Blair [35], Heywood and Sher [36], and Woodyard [30] for more details.
Uniflow engines have a single exhaust valve per cylinder, which is mounted in
the center of the cylinder head. For the modern electronically controlled engines,
the exhaust valve opening and closing angles can be freely chosen by the control
system, which introduces flexibility to control the desired cylinder pressure.
Figure 2.2 shows a diagram of the two-stroke cycle with the main events.
The intake port opening and closing (IPO and IPC respectively) angles are
geometrically fixed based on the piston movement. As discussed previously,
the exhaust valve opening and closing angles (EVO and EVC respectively) are
determined by the control system and change depending on the engine load and
operating mode. The angle where the fuel injection starts (αinj ) is also variable,
and it is used to control the combustion phase.
Figure 2.3 shows an example of the measured cylinder pressure plotted
against the corresponding cylinder volume. The cylinder compression pressure
pcyl,comp depends strongly on the exhaust valve closing since it defines the
start of the compression process. For a fixed fuel mass, the maximum cylinder
pressure (pcyl,max ) is influenced by the fuel injection starting angle and the
current cylinder pressure at that angle. The exhaust valve opening has a direct
effect on the power produced by the cylinders since it defines the expansion
phase duration. Moreover, it also affects the outlet gas temperature. Both
opening and closing angles of the exhaust valve have a significant influence on
the cylinder scavenging process.
In the recent years, many authors have investigated two-stroke cylinder
pressure models, due to the need to research new technologies to reduce the
emissions of these engines. Investigations of the NOx reduction potential with
EGR dilution have been performed with zero-dimensional models, e.g., Scappin
et al. [37], or with more complex multi-zone models, see Hountalas et al. [9], and
Raptotasios et al. [38]. More time consuming Computational Fluid Dynamics
(CFD) codes of the cylinder and the combustion chamber have been used to in-10 Chapter 2. Marine Two-Stroke Diesel Engines
TDC
αinj
C n
om io
pr u st
es b
sio om nd
n C a
nsion
g
en
Expa
ω
ut B
lo
EVC
O w
h
us do
Scavenging
P w
n
O
EV
IP O
C IP
BDC
Figure 2.2: Uniflow two-stroke engine timing diagram. The principal cylinder
events and phase names are depicted, together with the forward rotation of the
engine. The upper and lower points correspond to the piston top and bottom
dead center (TDC and BDC respectively).2.1. Characteristics of Marine Two-Stroke Engines 11 Figure 2.3: Pressure vs. volume diagram of a low-speed marine two-stroke engine. Approximate corresponding volumes where the intake ports and the exhaust valve open and close are depicted in the diagram. The diagram also indicates the maximum cylinder pressure and the cylinder pressure after the compression process. vestigate several combustion related issues. Potential NOx reductions depending on EGR rate and injection timing are analyzed in Sun et al. [21], and Wang et al. [20]. Other examples of investigated topics with CFD models are heavy fuel oil evaporation in Stamoudis et al. [39], the impact of alternative fuels on the combustion and emission products in Sun et al. [40], and sensitivity analysis of different fuel characteristics and operating conditions on the combustion in Zhou et al. [41]. A computationally faster approach is taken in Sui et al. [42], using a Seiliger cycle to model the in-cylinder pressure of a medium speed marine diesel engine. Paper 5 [43] of the thesis contributes with an algebraic in-cylinder pressure model that captures the effects of the ordered exhaust valve and fuel injection angles on the cylinder pressure. Cylinder pressure measurements are used to validate the proposed analytic model based on an adaptation of the work described in Eriksson and Andersson [44], from automotive four-stroke engines to marine two-stroke applications. Furthermore, the proposed approach models the thermodynamic gas properties as a function of the temperature and the gas composition, which is identified as an important factor in Murphy et al. [45] for accurate temperature prediction in marine applications. Accurate modeling of the uniflow engine scavenging process is also important when developing cylinder pressure models. The simpler single-zone models with single or multiple phases can be a good start and are suitable for MVEM approaches. Examples can be found in Merker and Gerstle [46], and Heywood and Sher [36], where different models for different scavenging architectures are
12                               Chapter 2. Marine Two-Stroke Diesel Engines

gathered. A collection of more complex multi-zone models is also included in
[46, 36]. If a deeper analysis is required, CFD models are the usual choice due
to the complicated flow interactions involved. Some examples of scavenging
CFD studies are Haider [47], Sigurdsson et al. [48], and Lamas and Vidal [49].
CFD results can be used to validate and develop simpler algebraic models. This
strategy is carried out in Andersen [50], where an algebraic model is proposed for
modeling the scavenging process of a crosshead uniflow engine. Algebraic models
are well suited for control application models since they have low computational
requirements. Hence, the original model from Andersen [50] is used in Paper
5 [43] of the thesis, but the model is adapted to a larger engine than the one
studied in the original publication.

2.1.2    Models of Marine Two-Stroke Diesel Engines
Modeling of marine crosshead two-stroke engines has not received the same
attention in the research literature as the case of automotive four-stroke engines.
Nevertheless, several authors have studied different modeling strategies for this
type of engine. With the purpose of improving the engine governor design,
two-stroke engine models started to be developed at the beginning of 1980’s.
In Woodward and Latorre [51], a complete two-stroke model that captures
the transient behavior of the engine is described in detail. The importance
of the turbocharger dynamics for the transient response of the engine shaft
speed is investigated in Blanke and Anderson [52]. Further investigations of
the significance of the turbocharger dynamics are carried out in Hendricks [53].
This latter paper introduced the mean value engine model (MVEM) terminology,
which refers to models with averaged signals over one or several engine cycles,
see Eriksson and Nielsen [54] and Guzzella and Onder [55].
    Further development of two-stroke MVEMs is done in Theotokatos [56], where
two different MVEM approaches are shown to give good stationary and dynamic
results compared with a more accurate crank angle based zero-dimensional
model of the engine. Engine control development has been supported with the
previous mentioned two-stroke MVEM, e.g., Xiros and Theotokatos [57]. The
low load operation of the engine is studied in Guan et al. [58], with a dedicated
compressor model for low load simulation integrated into a two-stroke MVEM.
In Theotokatos and Tzelepis [59], the MVEM is integrated with a complete ship
model which is used to investigate performance and emissions under different
loading scenarios. Furthermore, other authors have also investigated the use
and accuracy of MVEM for two-stroke engines. Some examples are Karlsen
[60], Tian et al. [61], and Zhu [62]. A simpler approach than an MVEM is to use
black-box modeling based on dynamic transfer functions, as proposed in Xiros
[29].
    More accurate and computationally demanding zero-dimensional models
of the cylinder processes have also been used in the development of complete
two-stroke engine models. This kind of models have a crank angle resolved
formulation of the in-cylinder processes, and thus are capable of including more
complex modeling of the combustion and the scavenging processes. In Kyrtatos
et al. [63, 64], such model is validated and shown to reproduce accurately
2.2. Turbocharging and Turbocharger Models 13
the measurements taken on board of a container ship. The modeling papers
mentioned above are developed with the general thermodynamics code described
in Kyrtatos [65]. Another example of the usage of this engine thermodynamics
code is shown in Livanos et al. [66], where it is used to model and simulate a
large two-stroke diesel engine during a fire in the scavenging receiver. More
recent work is carried out in Guan et al. [67], where a previous MVEM model
is extended with a zero-dimensional combustion model and used to investigate
the effects of turbocharger cut-out and auxiliary blower activation. The same
zero-dimensional model is used in Theotokatos et al. [68] to map different engine
parameters and use the results to develop functional extensions to a two-stroke
diesel MVEM. The fundamental purpose of this is to obtain a fast execution
time MVEM that captures the effects of changes in the combustion input signals,
e.g., fuel injection start. In Yum et al. [69], a complete ship propulsion system
with a crank angle based cylinder model is used to investigate the effect of sea
waves on the engine operation. Another interesting approach is presented in
Mavrelos and Theotokatos [70, 71], where the commercial software GT-power
is used to model a dual-fuel two-stroke engine. Finally, a distinct method is
described in Tang et al. [72], where the zero-dimensional cylinder model and the
rest of the MVEM are integrated based on asynchronous calculations to achieve
a real-time simulation model.
Complete control-oriented two-stroke diesel engine models capable of simu-
lating EGR are a relatively new topic in the research literature. Hence, the main
contributions of this thesis concerning the general two-stroke engine modeling
work are to incorporate many of the modeling ideas into new models capa-
ble of simulating EGR operation. More information about the thesis specific
contributions in the field of marine EGR modeling is included in Section 2.3.
2.2 Turbocharging and Turbocharger Models
One critical drawback of the two-stroke engine is that it is neither a self-aspirating
nor a self-exhausting engine, see Watson and Janota [73]. On the contrary, the
dedicated intake and exhaust strokes in the four-stroke cycle ensure that, by the
piston movement, the burned charge is expelled and the fresh gas is introduced
into the cylinders. For the scavenging process to work on two-stroke engines, the
scavenging receiver requires air at pressures above the atmospheric level. This
pressure rise can be achieved by several technical solutions like supercharging
or using the crankcase and the piston movement. However, the usual approach
for crosshead two-stroke engines is to use one or several turbocharger units,
together with auxiliary blowers to ensure that there is enough pressure for the
scavenging process at low loads where the turbocharger efficiency usually drops.
The auxiliary blowers are operated at a constant speed using electric motors
and started or stopped depending on the current measured scavenging pressure.
Another benefit of turbocharging is that it increases the power output of a
given engine. This increase is a consequence of a higher fuel burning capacity
due to more mass of fresh air trapped in the cylinders at higher pressures. This
power increase provided by the compressor side of the turbocharger is powered14 Chapter 2. Marine Two-Stroke Diesel Engines
using a turbine that extracts the energy available from the hot pressurized
exhaust gases. Careful matching of the turbocharger to the designed engine is
crucial to ensure a positive pressure difference between scavenging and exhaust
receivers, see Meier [74]. Otherwise during the period when the intake ports and
the exhaust valve are simultaneously open, see Figure 2.2, issues with too much
scavenging flow or even undesired burned gases flowing back to the scavenge
receiver might occur. This positive pressure difference between scavenging and
exhaust receivers has practical implications for the design of the EGR system as
will be discussed in the following section.
Turbines on two-stroke engine turbochargers can be either radial or axial ma-
chines, depending on the power output and the required size of the turbocharger.
The axial turbines are better solutions for the largest turbochargers due to higher
operating efficiency and a less complicated manufacturing process, see Watson
and Janota [73]. Suitable zero-dimensional models that can represent well the
measured turbine maps of axial and radial turbines can be found in Serrano et al.
[75], Stricker et al. [76], Sidorow et al. [77], and Eriksson [78] among others.
Radial compressors with vaned diffusers are usually the preferred choice for
low-speed two-stroke engine turbochargers. Radial compressors have a wide
operating range in mass flow values, and the vaned diffuser helps in providing
higher efficiencies and pressure ratios, see Watson and Janota [73] for more
details. The left side of Figure 2.4 contains a measured compressor map of a
typical vaned radial compressor used for charging this kind of engines. The
measured lowest speed line corresponds to approximately 44% of the maximum
allowed compressor speed, and there are no measurements available for pressure
ratios between 1 and 1.4. This lack of low-speed measurements is common in
compressor performance maps. This unmeasured area introduces limitations
on the complete turbocharged two-stroke simulation models since, at low loads,
the compressor is usually operating outside of the measured area, see Figures 2
and 3 from Paper 4 [79] of this thesis for a graphical illustration. Hence, models
that can extrapolate the compressor performance at low-speeds are required,
as identified in Guan et al. [58], and Mizythras et al. [80], where a compressor
model extrapolation method is described. Papers 1 and 2 [81, 82] are dedicated
to the development of an extrapolation capable compressor model for both mass
flow and efficiency prediction. The proposed model is based on previous work
developed by Leufvén and Eriksson [83] and Martin et al. [84], which is further
extended in this thesis together with a dedicated parameterization method. The
right side of Figure 2.4 contains the proposed compressor model parameterized
to the left map, as can be seen, the operating area of the model is broader and
includes the desired low load performance.
2.3 The Exhaust Gas Recirculation System
EGR is a mature technology for reducing NOx on automotive four-stroke engines.
Different EGR architectures exist; there are high and low-pressure systems, with
and without cooling devices that have distinct advantages and disadvantages,
see Eriksson and Nielsen [54]. In four-stroke engines, a valve usually controls the2.3. The Exhaust Gas Recirculation System 15
75
0.
7
0.
4 4
0.7.77
9
5
0.7
0
75
0.6 0.7
0.
0.8
5
7
75
0.
0.6
0.
8
3 3
0.
0.8
7
9 77
1
0.
0.7 0. .75
0 .8
81 0
75
0. 1
0.7 0. 0.8 0.8
6
0.
5
0.6
5 0.7
7
0.8
0.
0.8 0.7
0.6
9 7 1
0.7 00.7.75 8 0.8
2 0.8
1
0.7 .65 2 0.
5 0.6
0.4
81
0 0.7
75
0.
0.8 0.7
0.
0.8
0.79 0.7.775 0.6 0.4
7
0 .7 5
0.
0 0.60.6
0.75
0.7 0.4
0.6
0.1
0.4
0.6 0.1
1 1 0.40.1 0.1
0 0
0 2 4 6 0 2 4 6
Figure 2.4: Left: Measured compressor map speed lines in the pressure ratio
vs. corrected mass flow plane in blue crosses connected with solid blue lines.
The measured efficiency is plotted as contour lines. Right: Modeled compressor
in dashed red lines together with the modeled efficiency as contour lines. The
measured speed lines are depicted as blue crosses connected with solid blue lines.
EGR flow, provided that there is sufficient pressure difference for the gas to flow
from the exhaust to the intake manifold. In some cases, a Variable Geometry
Turbine (VGT) is included, which enables new ways to control the EGR flow
by actuating the turbine vanes. These vanes can influence directly the exhaust
pressure as well as indirectly the intake pressure of the engine. For example, the
interesting and complex EGR-VGT control problem on a four-stroke heavy-duty
diesel engine is treated in Wahlström et al. [85].
EGR systems on low-speed two-stroke diesel engines are much more recent.
For instance, a high-pressure EGR system was first installed on the test engine at
the Diesel Research Centre in Copenhagen in 2009, see Nielsen [24]. Since then,
more EGR systems have been installed on newly built ships, and more EGR
engines are currently under construction to fulfill the IMO Tier III emission limits.
MAN Diesel & Turbo has adopted a high-pressure EGR solution, see Kaltoft
and Preem [86], which is the modeled approach in this thesis, but low-pressure
architectures have also been tested successfully by other engine designers, e.g.,
Hiraoka et al. [23].
Low-speed two-stroke engines have additional challenges compared to four-
stroke engines when designing EGR systems. Due to the sulfur content of the
heavy fuel oil used in the engine, the burned gases have to be cleaned of corrosive
components before reintroducing them into the cylinders. Moreover, due to the
essential positive pressure difference between scavenging and exhaust receivers
described in the previous section, the EGR flow has to be mechanically forced.
Thus, the desired mass flow is achieved using a blower, which increases the
system complexity compared to the valve system used in four-stroke engines.
These blowers are radial compressors, controlled using the speed of the electric
motors used to drive them. A diagram of the MAN Diesel & Turbo high-pressure
EGR system applied to an engine is shown in Figure 2.5. As can be seen, the16 Chapter 2. Marine Two-Stroke Diesel Engines
Figure 2.5: Diagram of the engine with a high-pressure EGR system gas path
from MAN Diesel & Turbo. The EGR flow is cleaned (water sprays) and cooled
before being pumped to the scavenging pressure by the EGR blower. The Water
Mist Catcher (WMC) ensures that the condensed water in the gas is removed.
The Exhaust Gas Bypass (EGB) valve and Cylinder Bypass Valve (CBV) shown
in the diagram are used to match the turbocharger (T/C) operation at different
loads with and without EGR operation. The picture is reproduced from [87]
with permission from MAN Diesel & Turbo.
EGR string takes burned gases from the exhaust receiver. The gas flow is then
cleaned and cooled before being pressurized and mixed with the fresh air going
to the scavenge air receiver. For bigger engines, a similar configuration but
with parallel turbochargers is used, more details can be found in MAN Diesel &
Turbo [87].
Due to its recent introduction, the research literature does not contain much
modeling work of two-stroke engines with EGR. However, some ideas from
the abundant four-stroke EGR modeling and control literature can be used
when modeling EGR systems for low-speed two-stroke engines. This strategy
is followed in the modeling work from Hansen et al. [88], where some of the
modeling ideas developed for automotive four-stroke engines in Wahlström and
Eriksson [89] are adapted to the two-stroke case. Further modeling work is
carried out in Nielsen et al. [26], where the model described in Paper 3 [90] of
this thesis is modified to work with molar flows and adapted to another engine.
Moreover, in the same publication, several simplifications are done to the original
MVEM to obtain a dynamically simplified model that is shown to capture the
oxygen dynamics well. More recently, a one-dimensional model of a two-stroke2.4. Measurement Availability 17
EGR engine implemented in the commercial software GT-power was used to
investigate EGR operation with exhaust gas bypass (EGB), and cylinder bypass
(CB), see Wang et al. [91, 92]. Furthermore, a waste heat recovery system to
extract energy from the hot EGR gas is modeled and optimized in Kyriakidis
et al. [93].
The main purpose of this thesis is to develop and validate a control-oriented
modeling approach for marine two-stroke engines with EGR, for low to high
engine loads and different operating modes. Its primary application is to assist
in the development of EGR controllers during transient operation. To the author
knowledge, this kind of model has not been investigated in the research literature.
Paper 3 [90], started this task, and presented a model for medium to high load
simulations. Paper 4 [79] extends the load range to low loads by including
the auxiliary blower and a compressor model capable of extrapolating to low
speeds. The compressor model is described in Papers 1 and 2 [81, 82]. A more
detailed MVEM is introduced in Paper 5 [43], where the generality of the model
approach is shown by modeling another engine with EGR. The MVEM from
Paper 5 proposes improvements on several components and includes models for
the propeller and the ship surge dynamics to have a complete ship propulsion
model. One of the possible applications is shown in Paper 6, where the model is
used to analyze the performance and robustness during acceleration scenarios of
the adaptive EGR controller described in Nielsen et al. [25, 26].
2.4 Measurement Availability
Measurement data of the engine at different operating points is required to
develop, parameterize and validate models. In automotive engines, stationary
data is typically collected in engine test beds by measuring different combinations
of the engine control inputs. For instance, the torque-speed operating region of
a diesel engine is usually gridded to collect a range from one to several hundred
different operating points, this set of measurements is usually called “engine
map”. This large quantity of data is valuable to develop and parameterize models
that can work in a broad operating region of the engine. For the case of marine
two-stroke engines, the number of measurements has to be drastically reduced
due to the longer stabilization time and the high fuel costs of running these
engines. Moreover, the lower test bed availability compared to the automotive
industry is also an issue, and performing measurements has to be extensively
planned.
When the manufacturing process of a new engine is finalized, its performance
is tested and recorded during the shop test to ensure that it works well and it
is capable of delivering the designed power output. This set of measurements
usually contains less than ten different stationary points. For the case of EGR
engines, about the double of points are taken since the engine has more operating
modes with EGR enabled. Moreover, the lowest measured load point is usually
25% of the maximum engine load, which is a higher load value than the usual
engine loads during harbor maneuvering. These unmeasured loads make the
shop test data unsuitable for developing the low load capable engine model.18 Chapter 2. Marine Two-Stroke Diesel Engines
Hence, the continuous data recordings of the engine sensors provided by MAN
Diesel & Turbo have been used to identify stationary operating points off-line
by post-processing the data. This approach results in a higher number of
available stationary points with a wider load span, and also includes necessary
measurements that were unavailable in the shop test data, e.g., the injection
angle.
For the case of Paper 5 [43], the data sources are the continuous recordings of
the installed sensors on the ship engine during normal sailing operation. Figure
2.6 shows an example of several measured signals from the sailing vessel with an
identified stationary point highlighted. Sailing measurements of approximately
ten months were used to find as many different operating points as possible
of the modeled engine. In Papers 3 and 4 [90, 79], the model is based on
the Diesel Research Center test engine, and a similar approach is followed to
obtain stationary data. However, collecting data from the same engine layout
is more difficult since very often this test engine is rebuilt to change and test
new engine components, e.g., turbochargers or EGR blowers. Moreover, the
continuous sensor recordings correspond to experiments done for other projects
and purposes, so the data was reused.
During the parameterization of MVEMs for automotive engines, the usual
strategy is to start with the stationary data to estimate the stationary outputs of
the different engine component models separately. See Guzzella and Onder [55],
and Eriksson and Nielsen [54] for more information about the parameterization
and measurement process, and Wahlström and Eriksson [89] for an application
example. This strategy helps in dealing with the model large number of unknown
parameters. However, air mass flow has to be measured, which is a complicated
measurement in large marine two-stroke engines and it has not been possible
to measure during this project. Hence, the stationary parameterization of the
marine engine model has to be done at once, which increases its complexity
substantially. In Paper 5 [43] of this thesis, a different approach to obtain an
estimate of the air mass flow when EGR is disabled is described, using the
compressor model from Papers 1 and 2 [81, 82]. This method simplifies the
parameterization process but requires measurements of turbocharger speed,
compressor inlet temperature and pressure, and compressor outlet pressure.
Dynamic data is also required to parameterize and validate the models under
transient operation, see Guzzella and Onder [55], Eriksson and Nielsen [54],
and Wahlström and Eriksson [89]. When the data comes from normal ship
sailing operation, most of the time the engine is at constant load without many
transients. However, there are still interesting load steps or input signal changes
that can be used. For instance, between 1000 and 1600 seconds in the dataset
shown in Figure 2.6. This kind of dynamic data is extracted from the available
measurements and used in the estimation and validation of the engine models.
To sum up, obtaining a wide range of measured operating points from marine
two-stroke diesel engines is often complicated. Nevertheless, the proposed MVEM
can still be parameterized and validated with the available data as shown in
Papers 3, 4 and 5 [90, 79, 43] of the thesis. Paper 5 [43], also contains guidelines
of important signals to be included in the engine shop test measurements, with
the purpose to simplify the parameterization procedure. Furthermore, if onlyYou can also read