Diffusion Tensor Imaging Biomarkers to Predict Motor Outcomes in Stroke: A Narrative Review - Frontiers
←
→
Page content transcription
If your browser does not render page correctly, please read the page content below
REVIEW
                                                                                                                                                 published: 08 May 2019
                                                                                                                                          doi: 10.3389/fneur.2019.00445

                                               Diffusion Tensor Imaging Biomarkers
                                               to Predict Motor Outcomes in Stroke:
                                               A Narrative Review
                                               Luciana M. Moura 1*, Rafael Luccas 1 , Joselisa P. Q. de Paiva 2 , Edson Amaro Jr. 2,3 ,
                                               Alexander Leemans 4 , Claudia da C. Leite 3 , Maria C. G. Otaduy 3 and
                                               Adriana B. Conforto 1,2*
                                               1
                                                Neurostimulation Laboratory, Neurology Department, Hospital das Clínicas/São Paulo University, São Paulo, Brazil,
                                               2
                                                Hospital Israelita Albert Einstein, São Paulo, Brazil, 3 Lim 44, Department of Radiology and Oncology, Faculdade de
                                               Medicina, Hospital das Clínicas/São Paulo University, São Paulo, Brazil, 4 PROVIDI Lab, Image Sciences Institute, UMC
                                               Utrecht, Utrecht, Netherlands

                                               Stroke is a leading cause of disability worldwide. Motor impairments occur in most of
                                               the patients with stroke in the acute phase and contribute substantially to disability.
                           Edited by:
                         Thomas Platz,         Diffusion tensor imaging (DTI) biomarkers such as fractional anisotropy (FA) measured
    University of Greifswald, Germany          at an early phase after stroke have emerged as potential predictors of motor recovery. In
                       Reviewed by:            this narrative review, we: (1) review key concepts of diffusion MRI (dMRI); (2) present
                       Robert Schulz,
           University Medical Center           an overview of state-of-art methodological aspects of data collection, analysis and
       Hamburg-Eppendorf, Germany              reporting; and (3) critically review challenges of DTI in stroke as well as results of
                     Raffaella Valenti,
                                               studies that investigated the correlation between DTI metrics within the corticospinal
          University of Florence, Italy
                                               tract and motor outcomes at different stages after stroke. We reviewed studies published
                  *Correspondence:
                    Luciana M. Moura           between January, 2008 and December, 2018, that reported correlations between DTI
               lummoura@gmail.com              metrics collected within the first 24 h (hyperacute), 2–7 days (acute), and >7–90 days
                  Adriana B. Conforto
      adriana.conforto@hc.fm.usp.br;           (early subacute) after stroke. Nineteen studies were included. Our review shows that
             lab.neuro@hc.fm.usp.br;           there is no consensus about gold standards for DTI data collection or processing.
         adriana.conforto@einstein.br
                                               We found great methodological differences across studies that evaluated DTI metrics
                    Specialty section:
                                               within the corticospinal tract. Despite heterogeneity in stroke lesions and analysis
          This article was submitted to        approaches, the majority of studies reported significant correlations between DTI
                                Stroke,
                                               biomarkers and motor impairments. It remains to be determined whether DTI results
                a section of the journal
                 Frontiers in Neurology        could enhance the predictive value of motor disability models based on clinical and
       Received: 21 December 2018              neurophysiological variables.
           Accepted: 12 April 2019
                                               Keywords: diffusion MRI (dMRI), diffusion tensor imaging (DTI), corticospinal tract (CST), motor stroke, stroke
           Published: 08 May 2019
                                               recovery, white matter (WM)
                             Citation:
   Moura LM, Luccas R, Paiva JPQd,
  Amaro E Jr, Leemans A, Leite CdC,
Otaduy MCG and Conforto AB (2019)
                                               INTRODUCTION
 Diffusion Tensor Imaging Biomarkers
to Predict Motor Outcomes in Stroke:
                                               Stroke is the second cause of death and the third leading cause of loss of DALYs (Disability-Adjusted
                   A Narrative Review.         Life Years) worldwide. Despite substantial advances in prevention and treatment, the global burden
                Front. Neurol. 10:445.         of this condition remains massive (1). In ischemic stroke (IS; 80–85% of the cases), hypoperfusion
       doi: 10.3389/fneur.2019.00445           leads to cell death and tissue loss while in hemorrhagic stroke (HS), primary injury derives from

Frontiers in Neurology | www.frontiersin.org                                         1                                                 May 2019 | Volume 10 | Article 445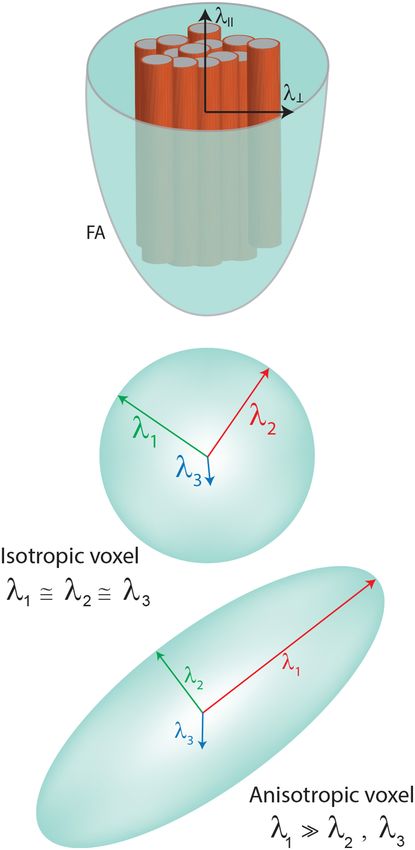
Moura et al.                                                                                                       Diffusion Tensor Imaging in Stroke

hematoma formation and secondary injury, from a cascade                    CONCEPTS OF DIFFUSION MRI
of events resulting in edema and cellular death (2). In IS,
cytotoxic edema is a result of glucose and oxygen deprivation,             Different MRI paradigms address WM qualitatively and
leading to a failure of ion pumps in the cell membranes and                quantitatively (i.e., volume, contrast as signal hyperintensities),
consequently to collapse of osmotic regulation, when water shifts          but only dMRI allows indirect inferences about WM
from the extracellular to the intracellular compartment (3). In            microstructure by providing information about the underlying
HS, heme degradation products are the primary cytotoxic event              organization of the tissue. In regions of little restriction of water
and secondarily, an inflammatory process based on degradation              displacement (such as the ventricles), water molecules tend
of the hematoma takes place (4).                                           to move almost freely (randomly). On the other hand, within
    Diffusion MRI (dMRI) is a powerful diagnostic tool in                  tracts, the environment tends to be organized within sets of
acute IS (5) and is widely used in clinical practice (6). dMRI             axons aligned in parallel orientation. Water movement usually
sequences are sensitive to water displacement. Acute infarcts              follows a specific orientation near axons compactly organized
appear hyperintense on diffusion-weighted imaging (DWI)                    and constrained by the myelin packing (21).
reflecting the decrease in the apparent diffusion coefficient                  The diffusion tensor is the most commonly used mathematical
of water molecules. DWI can be acquired and interpreted                    modeling of the diffusion signal and can be decomposed into
over a few minutes. It provides key information for eligibility            its eigenvalues (λ) and eigenvectors (ε), required to characterize
to reperfusion therapies from 6 to 24 h after onset of                     the signal of water displacement within a voxel. Each eigenvector
symptoms (DAWN study) (7) and in wake-up strokes (8). A                    represents an axis of dominant diffusion with the magnitude of
search on MEDLINE using the terms “stroke” and “diffusion                  diffusion determined by the corresponding eigenvalues. If the
MRI” yielded 1 article in 1991 and 279, in 2018. Diffusion                 diffusion is isotropic (the same along each orientation), then the
tensor imaging (DTI) involves more complex post-processing,                eigenvalues have approximately the same magnitude (λ1 ≈ λ2 ≈
mathematical modeling of the DW signal (9) and provides                    λ3 ), which can be depicted by a sphere. By contrast, if there is a
measures associated with white matter (WM) microstructural                 preferential orientation of the diffusion, then the first eigenvalue
properties (10).                                                           is bigger than the other two, which can be visualized typically by
    Stroke can directly injure WM tracts and also lead to                  an ellipsoid (λ1 >> λ2, λ3 ) (Figure 1).
Wallerian degeneration, the anterograde distal degeneration of                 Hence, the tensor calculation is typically based on a 3 × 3
injured axons accompanied by demyelination (11). DTI metrics               symmetric matrix, in which the eigenvalues derived from each
have been studied as biomarkers of recovery or responsiveness              combination of directions provide different metrics. At least
to rehabilitation interventions (12–14). The bulk of DTI studies           one b0 (non-diffusion-weighted) and 6 non-collinear directions
addressed specifically the corticospinal tract (CST), crucial for          of diffusion-weighted acquisitions are required to minimally
motor performance or recovery (12, 15), and frequently affected            describe water displacement with DTI (10). Generally, the more
by stroke lesions. Paresis occurs in the majority of the subjects in       directions, the better.
the acute phase and contributes substantially to disability (16). It           The most widely used DTI metrics are: fractional anisotropy
is thus understandable that the CST is in the spotlight of research        (FA), mean diffusivity (MD), radial diffusivity (RD), and
in the field.                                                              axial diffusivity (AD). FA describes the degree of anisotropy
    Two meta-analyses included from six to eight studies and               (represented as an ellipsoid), a value between 0 (isotropic) and
reported strong correlations between DTI metrics and upper-                1 (the most anisotropic). Anisotropy tends to increase in the
limb motor recovery in IS and HS (17, 18). In both meta-                   presence of highly oriented fibers (Figure 1). The biggest value is
analyses, heterogeneity between the studies was moderate. In               supposed to be found in the center of the tracts. In particular, for
addition, the quality of the evidence of DTI as a predictor of             CST analysis in stroke or other focal brain lesions, FA results can
motor recovery was considered only moderate by a systematic                be reported as ratios between FA extracted from the ipsilesional
review of potential biomarkers (19). The main limitations                  and the contralesional hemispheres (rFA = FA ipsilesional/FA
of the reviewed studies were the lack of cross-validation                  contralesional). Alternatively, asymmetry in FA can be described
and evaluation of minimal clinically important differences                 (aFA = (FA ipsilesional – FA contralesional)/(FA ipsilesional +
for motor outcomes as well as the small sample sizes.                      FA contralesional).
Heterogeneity in DTI data collection and analysis strategies                   MD describes the magnitude of diffusion and the biggest value
may also contribute to inconsistencies and hinder comparisons              is supposed to be found in the ventricles. RD represents the
between studies.                                                           average diffusivity perpendicular to the first eigenvector and AD
    In this narrative review, first we review the key                      is the first eigenvalue (λ1) representing the diffusivity along the
concepts of dMRI. Second, we present an overview of                        dominant diffusion direction.
state-of-art methodological practices in DTI processing.                       Many studies have focused exclusively on FA. The proper
Third, we critically review challenges of DTI in stroke                    interpretation of FA often demands knowledge about results
and results of studies that investigated the correlation                   of the other three DTI metrics (22). Changes in anisotropy
between DTI metrics in the CST and motor outcomes at                       may reflect several biological underpinnings, such as axonal
different stages after stroke, according to recommendations                packing density, axonal diameter, myelinization, neurite density,
of the Stroke Recovery and Rehabilitation Roundtable                       and orientation distribution (21, 23). FA can be decreased in
taskforce (20).                                                            conditions that injure the WM but also when multiple crossing

Frontiers in Neurology | www.frontiersin.org                           2                                          May 2019 | Volume 10 | Article 445
Moura et al. Diffusion Tensor Imaging in Stroke
diffusion signal are available. Choices directly impact accuracy,
reliability, and validity of the results (27).
dMRI acquisitions and analytical strategies are based on the
goal of the study, balancing the pros (i.e., greater reliability
of signal reconstruction) and cons (i.e., time-consuming
acquisition). In addition to constraints related to the number of
subjects with stroke in the studies, criteria to perform a reliable
protocol should be weighted prior to data collection [for a review,
see Price et al. (28)].
Diffusion images are typically acquired with sequences based
on echo planar imaging (EPI) acquisitions. Two high-amplitude
magnetic gradients are applied. The b-value is a scalar that reflects
the degree of diffusion, influenced by the duration, amplitude,
and interval between the gradients. B-values are comparable to
an inverse zoom factor: the higher they are (“high” b-values are
usually above 1,000 s/mm2 ), the smaller the sampled space (29).
EPI acquisitions are prone to many unexpected distortions
(30), therefore care should be taken during data collection. For
tensor modeling, some suggestions are: parameters to minimize
EPI artifacts; coverage of the entire brain; isotropic voxels;
appropriate number of directions and b0s; to acquire at least
one low b-value (b0 for example), for every 5–6 volumes
with high b-value and leave it interspersed with those with
high values; optimal sampling schemes of the directions in the
sphere of distribution and gradient ordering (28, 31). Optimized
distribution of gradients can be obtained, for example, with
MRtrix software (http://www.mrtrix.org/) or ExploreDTI (http://
www.exploredti.com).
Off-resonance artifacts such as eddy currents and magnetic
field inhomogeneities are intrinsic to EPI acquisitions and
interfere in the expected signal, causing susceptibility-induced
distortions (32). Acquisition parameters tailored to prevent and
mitigate these artifacts include: parallel imaging; field maps;
phase encoding with opposed gradients to correct a geometrical
mismatch in the antero-posterior axis; multiple b0s (33). These
alternatives demand extra data collection and prolonged scan
time (34). In accordance with the chosen acquisition parameters,
a posteriori corrections are performed in the pre-processing step.
In stroke studies, the duration of scans should be planned
by pondering the risk of fatigue and increased head motion
in patients with neurologic impairments. These impairments
are often not restricted to motor deficits and may involve
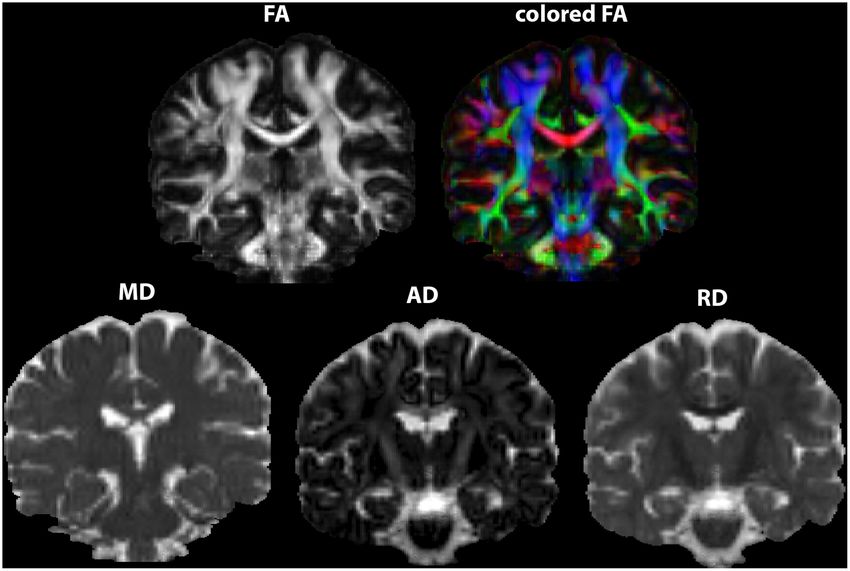
FIGURE 1 | Model of the tensor showing the eingenvalues. Diffusivities are executive dysfunction or anxiety that contribute to increase head
depicted in FA representation (λll —parallel or axial diffusivity—AD, motion and hence, artifacts. Again, trade-offs between “optimal”
λ⊥ perpendicular or radial diffusivity—RD).
acquisition parameters, feasibility and noise must be weighted
during study design.
Software embedded in the MRI scanner can perform tensor
calculations but advanced a posteriori processing is strongly
fibers are present in the voxel. In case of partial volume effects, recommended. The most appropriate choice heavily depends on
both FA and MD may be altered (24, 25). the objectives of the study and on acquisition limitations such
as: the number of diffusion directions; image resolution; b-values;
number of b-values; number of averages, repetitions to improve
dMRI Acquisition and Processing signal in relation to noise and tensor estimation (the number of
DWI is a noise-sensitive and artifact-prone sequence, excitations, NEX) (31, 35).
emphasizing the need for robust acquisitions and processing Many open-source softwares and pipelines are available to
handling to avoid bias (26). Several dMRI sequences and process diffusion images, each of them showing particular
subsequent post-processing mathematical modeling of the strengths—a helpful overview can be found in Soares et al. (35).
Frontiers in Neurology | www.frontiersin.org 3 May 2019 | Volume 10 | Article 445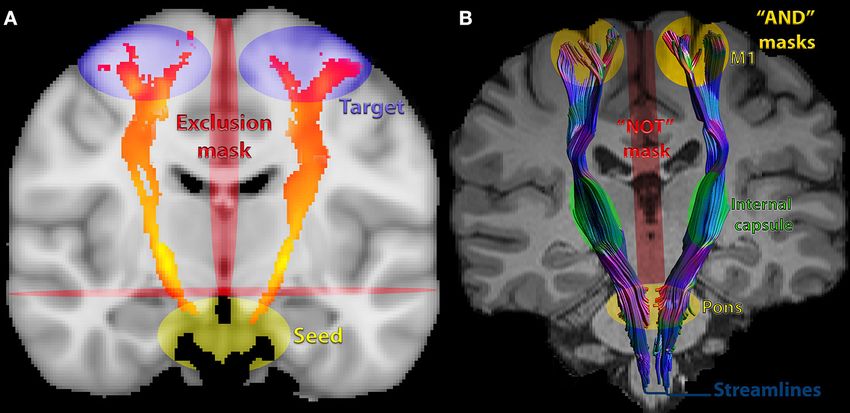
Moura et al.                                                                                                      Diffusion Tensor Imaging in Stroke

A list of softwares is available on the Neuroimaging Informatics           6. Tensor estimation in each voxel and generation of maps of FA,
Tools and Resources Clearinghouse (www.nitrc.org). There is                   MD, RD, and AD (Figure 2). This estimation can be based
no consensus but some agreement about diffusion imaging                       on different methods and a variety of softwares can perform
processing. One can decide to use a mix of softwares to process               this calculation but visual inspection of tensor orientation is
the data, as long as key steps are completed and a detailed                   highly recommended (42–44). If distortions of the expected
methodological report is made. Documentation is invariably                    orientation occur, it is necessary to modify the gradient table,
available on-line and discussion forums can provide additional                perform reorientation and re-processing, starting over from
support. It is desirable, to allow reproducibility and comparisons            the first steps (35).
across studies, to transparently report analytical procedures when
in-house pipelines are employed (36).                                      Post-processing
   Here, we will briefly cite some suggestions for processing              DTI maps generated in the native space for each subject can be
practices, considering an ordinary single-shell acquisition (when          co-registered so that group-wise comparisons can be performed.
only one single b-value, in addition to the b0 is acquired) with a         Co-registration refers to intra or inter-subject spatial alignment
b value around 1,000 s/mm2 , with subsequent tensor modeling.              of images within or between MRI sequences. Decisions about
                                                                           co-registration tools must consider the paradigm of study,
Pre-processing                                                             assumptions and specific steps of image processing (45–47).
Images must be checked for artifacts, such as susceptibility effects       Typical steps of post processing pipeline are highly dependent
(signal loss and geometric distortions), eddy currents-induced             on the chosen software, but in general, images are co-registered
distortions and subject motion (31, 37), so that corrections or            and normalized. Normalization of images to a standard space is a
exclusions of subjects, volumes or slices are made accordingly.            fundamental step to perform comparisons, which is particularly
Preferably, automated, quantitative, and not exclusively visual            challenging for diffusion images, since they are highly directional
inspection should be performed. Soares et al. (35) provide                 and topological (35, 48, 49). After that, group-wise statistics can
useful guidelines and a comprehensive list of softwares for                be performed.
quality control.                                                              We will review the types of analyses more frequently applied
   A gold-standard pre-processing pipeline does not exist. Pre-            in DTI studies in stroke: ROI-based analysis, tractography, and
processing is intrinsically dependent on the chosen software.              whole-brain analysis.
Users can employ different softwares to perform a miscellaneous
of corrections, but it is mandatory to follow the basic steps              Region-Specific Analysis
recommended by each developer. Steps of a typical preprocessing            ROI Analysis
pipeline might be:                                                         ROIs can be drawn on T1, T2, FA, or ADC images. They can
                                                                           be placed on the abnormal/lesion regions or on predetermined
1. A procedure frequently required, DICOM or PAR/REC
                                                                           anatomic regions. In the WM, the homogenous signal and EPI
   conversion to NIfTI format (most diffusion processing
                                                                           distortions might impair robust anatomical delimitation of ROI
   softwares use this format).
                                                                           and reproducibility.
2. Inspection of DWI images for motion, artifacts (e.g., Gibbs
                                                                              Basic steps of ROI processing are:
   ringing or signal drift) (38, 39) and structural abnormalities:
   different softwares provide visual and quantitative inspection          1. Registration to improve delineation and to align
   procedures. It is also important to inspect anatomical images              corresponding voxels in different datasets.
   such as T1, T2, and FLAIR.                                              2. Normalization to allow standardized localization and
3. B-matrix rotation: this notion was first introduced by                     comparisons between subjects within a study. For instance,
   Leemans and Jones (40). The rotation involved in registration              data from each subject can be transferred to standard space,
   of the image must be also applied to the encoding vectors.                 using a validated template or atlas (such as MNI or Talairach,
   Neglecting this step may lead to biases in the estimation                  among others) (34). The choice of the atlas involves checking
   of the principal vector, affecting all the metrics and                     whether characteristics of the subjects in a given study
   tract reconstruction.                                                      (i.e., elderly people) are comparable to those of the subjects
4. Brain extraction: an automated segmentation method to                      scanned to build the template (50).
   delete non-brain tissue from the whole-head. This optional              3. Definition of the ROI, manually or semi-automatically.
   but frequently performed procedure improves registration                   Manual delineation can be achieved by free-hand drawing,
   and normalization.                                                         by placement of basic shapes such as circles/squares or by
5. Eddy currents and EPI distortions correction: off-resonance                drawing of the region. In the former, ROI size differs between
   artifacts (as detailed previously) must be corrected. Tools are            subjects while in the latter, it remains constant. Small ROIs
   available, for example, in the ExploreDTI software and in                  may be more specific, but also more prone to errors while
   the FSL platform (Topup and Eddy). Further details on how                  large ROIs may be less specific for definition of particular
   to acquire data and how to perform corrections can be also                 structures and more prone to partial volume effects (inclusion
   found at https://fsl.fmrib.ox.ac.uk/fsl/fslwiki/FSL. It must be            of structures other than the target area) (34).
   emphasized that an adequate acquisition is required in order            4. Manual segmentation has high precision but has
   to be able to perform such corrections (41).                               disadvantages such as the risk of low reproducibility

Frontiers in Neurology | www.frontiersin.org                           4                                         May 2019 | Volume 10 | Article 445
Moura et al. Diffusion Tensor Imaging in Stroke
FIGURE 2 | DTI maps generated as output of tensor estimation. FA maps in two versions, the second depicted in RGB colors. Maps were generated in ExploreDTI.
due to dependence on prior knowledge of the researcher 1. Deterministic, following the best-fit pathway (the main
and the lack of feasibility of use in large datasets (51). eigenvector λ1), the principal axis of the tensor aligning with
Semi-automated delimitation can be a useful alternative by the principal direction of the fibers. It estimates the most
combining the automated identification of the ROI with a likely fiber orientation in each voxel. This method tends to
manual, interactive selection and modification by the user show the best valid/invalid connection trade-offs, but presents
(52). Although fully automated delimitation is promising, low spatial bundle coverage in comparison to the probabilistic
such as reported by Koyama et al. (53, 54), more studies with method (61).
large datasets in different phases of stroke are advisable to 2. Probabilistic, based on the estimation of uncertainty in fiber
create a state-of-art automatic method (28, 50–52, 55). orientation (60, 62). It is frequently considered more robust
5. Quality control involves: assessment of accuracy of and deals better with partial volume averaging effects, crossing
segmentation and registration; report of intra- and inter-rater fibers, as well as noise (63). Yet, it is faced with pitfalls, is more
reliabilities of ROI delineation; clarity of criteria for the time-consuming and computationally expensive.
location of the ROI (such as anatomical location) - for details,
Noise and artifacts affect reconstructions. There is no “ground-
refer to Froeling et al. (34).
truth” solution to validate tracking results (64). Several efforts are
6. Extraction of DTI metrics from the ROI, as absolute values
in progress to investigate the ground-truth of diffusion and tracts
from the ipsilesional/contralesional site or ratios between
trajectory by using phantoms, post-mortem, and histological
both (56).
information. The trajectory from the initial (“seed”) voxel to the
7. When more than one ROI is chosen, the correction for
end point can be represented by a streamline. A streamline refers
multiple comparisons is recommended to reduce false
to the unitary path of reconstruction within a tract and does not
positives—for details, refer to Froeling et al. (34).
indicate an actual nerve fiber or tract (64). Streamlines can vary
in different subjects and across experimental paradigms.
Path reconstruction can be constrained by three main steps:
Tractography seeding, propagation and termination (35). Usually, streamline
Tractography corresponds to the mathematical reconstruction of tractography is based on the placement of multiple ROIs: starting
tracts (57, 58). By following the preferred direction of water voxel from seed points using a predefined ROI, guiding the path
by voxel, it is possible to trace the tracts tree-dimensionally and reconstruction by preserving only streamlines passing through or
non-invasively (59, 60). This represents an advantage over ROIs, touching other predefined ROIs; full brain tractography keeping
allowing qualitative and quantitative investigation along of the the streamlines accordingly with conjunctions, disjunctions, or
entire tract of interest. DTI metrics can be extracted from the exclusions ROIs (65). The seeding strategy can also be performed
entire reconstructed tract or from a segment (ROI) of the tract. on a voxel-wise level across the brain, running a whole-brain
There are two main approaches for path reconstruction: tractography (e.g., Probtrackx or ExploreDTI).
Frontiers in Neurology | www.frontiersin.org 5 May 2019 | Volume 10 | Article 445Moura et al. Diffusion Tensor Imaging in Stroke
Termination of streamlines is usually guided by a set of within the sensorimotor cortex, whereas DTI-based tractography
parameters: FA threshold (between 0.1 and 0.3 for adult does not (75). Excellent inter-rater and test-retest reliability were
brain), turning angle threshold (depending on the considered reported for FA extracted from CSD-based reconstructions of the
tract anatomy—typically between 40 and 70◦ ) to avoid CST (76).
streamlines propagating voxels of high uncertainty, such as the
cerebrospinal fluid (CSF) and gray matter (35). Fully automated Whole-Brain Analysis
clustering methods can be alternatives to manual ROI-based Whole-brain analysis is an exploratory approach that can be
approaches (65). applied to investigate global WM changes or whether such
Several methods of CST reconstruction are available with changes are heterogeneous across patients within a study.
no consensus. For instance, DTI metrics can be extracted Analyses can be performed and measures can be extracted using
from the entire tract or from ROIs within these tracts, as different approaches, such as:
absolute values from the ipsilesional/contralesional site or as
1. Histogram analysis of all voxels in the brain. Histograms that
a ratio between both (56). Recently, a DTI challenge of CST
express the frequencies of voxels with a specific value for a
reconstruction with tractography demonstrated a consistent
DTI metric such as FA can be built. Median, mean, peak
presence of false-negative and false-positive pathways. Most of
height, and peak location of DTI metrics can thus be estimated
these reconstructions were limited to the medial portion of the
(59, 77).
motor strip and few were able to trace lateral projections (such as
2. Brain or WM voxels defined by a mask created from either
hand-related). Generally, improved results depend on strategies,
segmentation of an anatomical MRI or by whole brain
such as: method of reconstruction, improved signal; sharp
tractography. If the former strategy is chosen, DTI values in
estimations of fiber distribution; priors on spatial smoothness;
the voxels can be extracted after registration of anatomical
seeding strategies. Anatomically, there are a variety of possible
MRI to the non-diffusion weighted image by means of
reconstructions, for instance, defined as the pathways coursing
an affine transformation. If whole-brain tractography is
through the cerebral peduncles to the pre- and post-central gyrus
performed, then DTI measures can be extracted from voxels
(61). Park et al. (56) provide detailed information about how to
that are part of the streamlines.
seed and how to confine fibers. Figure 3A shows an example of a
3. The most popular approach is voxel-based analysis (VBA)
probabilistic and Figure 3B, of a deterministic CST tractography.
and compares DTI metrics in every voxel of the brain
One of the weaknesses of tensor-based tractography is the
(59). This strategy has high reproducibility, is time-efficient
assumption that the diffusion related to fibers within a voxel
and provides excellent spatially localized information, based
follows a Gaussian distribution, represented by a single direction.
on the atlases coordinates (78). It provides conservative
This assumption is violated by the presence of crossing fibers and
corrections for multiple comparisons throughout all voxels in
multiple axonal orientations (estimated as ∼90% of WM voxels)
the brain, enhancing type II error. Still, it is recommended
(66) (Figure 4A). It was hypothesized that increasing the number
that corrected results be presented. An alternative is running
of directions in the MRI acquisition (such as at least 28 directions
a cluster-based analysis and correcting them instead of
in low b-values - b ∼1,000 mm/s2 ) would solve this problem
correcting voxel-by-voxel. In addition, novel cluster-based
(26, 67). However, it became clear that more advanced models
approaches are available to avoid the arbitrary choice of a
were needed (26, 66).
threshold. TFCE (Threshold-Free Cluster Enhancement) (79)
embedded in the tract-based spatial statistics (TBSS - FSL),
Beyond DTI-Based Tractography: HARDI Models
offers a more robust approach to find significant clusters.
High angular resolution diffusion imaging (HARDI) uses a larger
TBSS overcomes issues about alignment and smoothing in
number of diffusion gradient directions, often in combination
voxel-based analysis by focusing registration and statistical
with multiple b-values, to measure the diffusion signal (68).
testing exclusively on the center of the tracts (80). TBSS
By doing so, a more reliable reconstruction of the underlying
reduces type II error, at the expense of ignoring findings in the
diffusion and fiber orientation distribution can be obtained,
periphery of the tracts. However, TBSS is known to suffer from
overcoming pitfalls such as crossing fibers (Figure 4B). To reach
several methodological limitations that complicate outcome
a deeper understanding of the evolution of HARDI models, we
interpretation [for details, see Bach et al. (81)].
refer to Daducci et al. and to Descoteaux et al. (29, 69). HARDI
models are superior to DTI to reconstruct the CST (70, 71).
However, the higher angular resolution in combination with CHALLENGES OF DTI IN STROKE
higher b-values is frequently more time-costly and noisy.
Another approach to model the fiber orientation distribution Major Challenge: Heterogeneity of Lesions
is Constrained Spherical Deconvolution (CSD) (Figure 4B), The main challenge of DTI in stroke is heterogeneity of lesions—
typically relying on a single-shell HARDI acquisition and even for a review, see de Haan and Karnath (50). Lesion location and
“low” b values in the range of 1,000 s/mm2 (72, 73). CSD size vary across subjects and large lesions often disrupt tracts (80)
has medium requirements of acquisition and computation as or promote shifts that impact registration and normalization. In
well as has higher accuracy in fiber orientation estimates the chronic phase after stroke, loss of brain tissue and secondary
than DTI (74). It has been demonstrated that CSD-based dilation of CSF-filled spaces represent an extra-challenge for
tractography consistently reconstructs the fan-shaped CST normalization (82). Special care is advised when inferences are
Frontiers in Neurology | www.frontiersin.org 6 May 2019 | Volume 10 | Article 445Moura et al. Diffusion Tensor Imaging in Stroke
FIGURE 3 | Commonly used seeds, inclusion and exclusions masks for corticospinal tract (CST) DTI-based tractography: (A) probabilistic of corticospinal tract (CST)
showing commonly chosen masks/ROIs. (B) deterministic, showing streamlines. The pons was an inclusion mask in this example. Extraction of metrics can also be
performed from this ROI in the pons, in the internal capsule, the entire CST or other parts of the tract.
FIGURE 4 | (A) Tensor in a region of crossing fibers, when two populations of fibers cross (in this particularly case, at 90 degrees), the tensor fails in the
interpretation of the diffusion signal, suggesting low FA (approximately isotropic diffusion). (B) Crossing fibers at the centrum semiovale, the ‘ground truth’ signal within
a voxel. Constrained Spherical Deconvolution (CSD) depicts two populations of fibers while DTI depicts a single population of fibers.
based on large lesions (28). Lesions influence eligibility criteria obtaining binary images (zero-one intensity). Lesion masks can
(so that reliable statistical comparisons between subjects can be be manually drawn [for details, see Liew et al. (51)], but several
made) and impact image processing, demanding a variety of efforts are in course to improve machine-learning algorithms for
techniques to overcome distortions of the typical anatomy. automatically and accurately segment lesions. Recently, the large
The mismatch between images from patients and templates open-source T1-weighted dataset ATLAS (Anatomical Tracings
in atlases based on brains from healthy subjects affects of Lesions After Stroke) was released (51). Also, PALS (Pipeline
normalization (50). Two possible solutions to overcome this for Analyzing Lesions after Stroke) was developed as a specific
mismatch are cost function masking and enantiomorphic tool to improve similarity between manually delimitated lesions.
normalization. The first approach, which involves masking out It consists of image reorientation, lesion correction for WM
voxels of the lesions, may be more useful for small and bilateral voxels and load calculation, as well as visual inspection of the
lesions. The second approach “replaces” the lesion with brain automated output (84).
homolog tissue from the contralesional hemisphere, being useful Masking out lesions may require large deformations,
for large and unilateral lesions placed in symmetric regions, for particularly in WM regions adjacent to gray matter and
example as performed by Moulton et al. (83). cerebrospinal fluid. An interesting approach to deal with
Lesion masks can be created by changing the intensity this problem is DR-TAMAS (Diffeomorphic Registration for
of pixels inside or outside the segmented lesion and hence, Tensor Accurate alignMent of Anatomical Structures) (85) that
Frontiers in Neurology | www.frontiersin.org 7 May 2019 | Volume 10 | Article 445Moura et al. Diffusion Tensor Imaging in Stroke
optimizes normalization by including information not only of Challenges for Replicability
FA maps, but of anatomical T1 and T2 images. DR-TAMAS Results are dependent on the adoption of good practices
allows creation of atlases based on the diffusion tensor or regarding acquisition parameters, pre and post-processing.
anatomical images provided by the user. Recently, group-wise Researchers may tend to use their own tools or manual methods
registrations without masking lesions were reliably performed (84), but guidelines to improve repeatability and reproducibility
on fiber-oriented distribution (FOD)-based algorithms that are available, such as those made available by the Quantitative
exclusively rely on diffusion images (CSD-based acquisitions) Imaging Biomarkers Alliance (QIBA) http://qibawiki.rsna.org/
(83). This approach increased sensitivity to capture FA changes index.php/Main_Page. Also, it is crucial to use the same package
in the CST. and software version within the same study and while processing
longitudinal datasets. Whenever possible, the most updated
Challenges for ROI-Based Analysis version should be chosen (64).
The low resolution of DTI images can hinder delineation of
the ROI. Registration of the DTI dataset to anatomical T1/T2
images can improve spatial resolution and facilitate ROI drawing.
However, misregistration/misalignment can occur, mainly driven dMRI AS A BIOMARKER OF RECOVERY IN
by the different distortions in the two types of images and the STROKE
lower resolution of DTI images resulting in partial volume effects
(34, 78). Slight shifts could lead to extraction of metrics from In this section, we review studies that assessed correlations
different anatomic regions other than the ROI. between DTI measures on the CST to predict motor recovery.
Furthermore, the best choice for ROI placement within the LMM and RL searched MEDLINE (Medical Literature
CST remains an open question. According to Koyama et al. (53), Analysis and Retrieval System Online; through the PubMed
outcome prediction is more accurate when fully automated ROIs interface) and Web of Science, using the following keywords:
are placed in the cerebral peduncle. According to Park et al. motor (stroke or infarct or infarction or hemorrhage) and
(56), the extraction of DTI measures from the posterior limb of corticospinal tract and diffusion (imaging or tensor imaging). A
internal capsule (PLIC) is reliable. Tang et al. (86) reported that complementary search was made using the first two keywords
ROIs in the brain stem are more subjected to partial volumes combination and tractography or FA. Studies were selected
problems (caused by the proximity with CSF) than at the PLIC. according to the following criteria.
Inclusion criteria: evaluation of patients with IS or HS;
publication from January, 2008 until December 5th, 2018;
Challenges for Tractography collection of MRI data for DTI metrics in the hyperacute
In stroke, tractography may be used to reconstruct a tract (Moura et al. Diffusion Tensor Imaging in Stroke
stroke); motor outcome; whether DTI correlated with outcome
NS, not specified; IS, ischemic stroke; HS, hemorrhagic stroke; CST, corticospinal tract; r, ratio between ipisilesional/contralesional; ROI, region of interest; CP, cerebra peduncle; FA, fractional anisotropy; MD, mean diffusivity; PG,
PG, r = −0.767
correlate with
Outcome Did CST DTI
and correlation coefficients.
outcomes?
r = −0.926
mRS, r =
A total of 425 manuscripts were retrieved and 354 were
metrics
rFA: yes
−0.676
FA: yes
BI: no
excluded based on the title or abstract (Supplementary File
No
and Supplementary Figure); 71 manuscripts were read, 52
NIHSSm
NIHSSm
were excluded and 19, included in the review. The results
mRS
PG
are summarized according to the phase after stroke in which
BI
MRIs were performed: hyperacute (7–90 days, Table 3). One
study (Puig et al., n = 60) (93) performed measures in the
√
hyperacute and acute, and two—Groisser et al., n = 10 (94);
Wang et al., n = 27 (95) in the acute and subacute phases.
(months after
A total of 570 subjects were included in the selected studies:
evaluation
Time of
stroke)
three (n = 101) in hyperacute, six (n = 172) in the acute and
nine (n = 297), in the early subacute phase after stroke. A
3
1
1
total of 667 scans were performed. Ages ranged from 19 to
Contralateral
99 years and 56.5% of the patients were men. 62.8% of the
TABLE 1 | Studies that correlated DTI metrics on the CST in the hyperacute phase (first 24 h) and motor outcomes assessed at least 4 weeks after stroke.
patients had IS and 37.2%, HS. 36.8% of the studies reported
√
√
CST
that patients received rehabilitation during the time between
the MRI scan and the evaluation of motor outcomes. All of
Ipsilateral
the studies reported at least one metric of body structure and
function and 47.4%, at least one metric of activity according to the
√
√
√
Mentioned
ICF. The Motricity Index, an ordinal measure of limb strength
lesion
mask
(1–100) (96), was the most widely used scales for assessment of
motor performance.
MRI scans were performed on 3T scanners in 57.9% of the
Volume-One,
ROI: anterior
Technique/
FA, MD, rFA
DTIWeb 2.0
ROI: rostral
ipsilesional
software/
studies. The number of directions during diffusion acquisitions
metrics
ROI: CP
SPM99
FA, rFA
ranged from 6 to 64 and the number of b0, from 1 to 10. 83.3% of
pons
dTV
CP
FA
the studies used b values of 1,000 s/mm2 .
(s/mm²)
Only 15.8% of the studies explicitly mentioned lesion
Directions/b0 b value
1,000
1,000
1,000
masks during pre-processing and 18 different softwares
Details of acquisition
were used for data analysis. 52.6% measured DTI metrics
according to ROI-based methods, 36.8%, according to ROI in
tractographies, and 10.5% within the entire CST according to
15/NS
6/NS
6/NS
tractography; 10.5% extracted the entire CST as a ROI based
in whole-brain processing in TBSS (97). The most commonly
field (T)
chosen ROIs were the cerebral peduncle (61%) and the
MRI
1.5
3.0
1.5
pons (33%).
Despite great heterogeneity in methods of collecting and
68 (13)
Mean
54 (9)
(16.2)
(SD)
67.8
range age
analyzing the data, the majority of studies reported statistically
Demographics
significant correlations between DTI biomarkers and motor
Gender Age
34–
30–
45–
outcomes: 66.7% in the hyperacute, 83.3% in the acute,
67
99
85
and 92.3% in the early subacute phases after stroke. Motor
38/22
15/8
11/7
M/F
impairments were evaluated from 4 weeks to up to 6 months
later in the hyperacute/acute studies, and up to 2 years in
18*
23
60
the subacute studies. DTI results closer to normal, from the
n
1 day up to 3 months after stroke, were correlated with less
Middle Cerebral
Lesion site or
territory if IS
Basal ganglia
severe impairments.
Lesion characteristics
Thalamus,
putamen
arterial
FA, rFA, or aFA were measured in 100% of the studies. At
Artery
least one of these metrics was significantly correlated with motor
outcomes in 66.7% of hyperacute or acute, and in 92.3% of
HS
early subacute studies. FA values vary across subjects and are
√
√
Type
influenced not only by the stroke, but also by subclinical white
IS
matter lesions that are frequent in patients with vascular disease
√
in the ipsilesional as well as in the contralesional hemisphere
Puig et al.
et al. (92)
Ma et al.
Kusano
(98, 99). However, the changes in FA values in the CST due
Study
(91)
(93)
to chronic white matter lesions is expected to be less severe
Frontiers in Neurology | www.frontiersin.org 9 May 2019 | Volume 10 | Article 445Moura et al. Diffusion Tensor Imaging in Stroke
than those caused by stroke. None of the identified studies that lack of a significant difference in the directionality of
reported discrepant results in regard to correlations between the residual CST at this level may have contributed to this
clinical outcomes and FA metrics (for instance, correlation of finding (100).
outcomes with rFA but not with FA). Two studies (93, 100) Few of the selected studies measured AD, MD, and RD (83,
reported absences of correlations between clinical outcomes and 111, 112). FA is a highly sensitive, but quite non-specific measure
FA or rFA. Other studies that described correlations between (22, 113). Nevertheless, the results of this narrative review suggest
rFA or aFA and motor outcomes did not mention whether a consistent relation between FA measured in the CST at early
correlations were also present between ipsilesional FA and stages after stroke, and motor impairments, in line with results of
outcomes (Tables 1–3). Therefore, it is not possible to define meta-analyses (17–19). However, studies included in this review
whether measures of asymmetry are more strongly correlated predominantly assessed motor impairments, rather than activity
to motor outcomes, when compared to absolute ipsilesional (disability) according to the ICF. It remains to be clarified if
FA values. DTI measures within the first hours to 3 months after stroke can
Puig et al., Groisser et al., and Jang et al. did not find significant predict long-term disability.
correlations between FA metrics and motor outcomes at some of A key question is whether DTI results enhance the predictive
the stages (93, 94, 100). value of models of motor disability based on clinical information
Puig et al. (93) assessed FA and did not find a significant such as age and motor impairments, and neurophysiological
correlation between this measure 1/3 different variables on upper limb motor outcomes, large samples
middle cerebral artery territory) (94). DTI analysis can be of subjects are required.
challenging in subjects with large lesions, especially in the The analysis of large sets of data, such as the ongoing
acute phase when edema and MD reduction are at a peak ENIGMA project (http://enigma.ini.usc.edu/ongoing/
(3). Only another study included patients with MCA infarcts enigma-stroke-recovery/) is expected to help in closing
at this stage (103): 58 subjects were tested, with a mean the gap in knowledge about the relevance of DTI
infarct volume of 39 ml, and a significant correlation was found biomarkers in research and clinical practice, to define
between FA asymmetry measured at 2 days and the Fugl-Meyer motor prognosis. At the moment, DTI is not routinely
Motor Assessment measured at 3 months, when measurements performed in clinical practice for motor prognostication
were made at the nearest-5-slices ROI, but not at the in stroke.
cerebral peduncle. This study has some limitations. First, for the purpose of the
On the other hand, Groisser et al. found that changes in FA review, we excluded studies not reporting metrics, such as: myelin
measured at a later stage (1–2 months) correlated with hand grip, quantification, apparent diffusion coefficients, WM volume or
Motricity Index and nine-hole peg test measured at 6 months, qualitative tractography-based information. We also excluded
in line with other studies that assessed DTI at the early subacute studies not based on the tensor, such as kurtosis or HARDI
phase post-stroke (94). modeling, as well as microstructural-directed sequences, such as
Jang et al. were the only authors who did not report CHARMED/NODDI. All of them may convey complementary,
correlations between FA or rFA at the early subacute phase, and critical information about the underlying WM alterations in
motor impairments. Only subjects with pontine infarcts were the CST in stroke. Second, the choice of keywords may have
included, and measures were made at the pons, from 7 to 28 days led to non-inclusion of studies that addressed the aims of
post-stroke, according to tractography. The authors hypothesized this review.
Frontiers in Neurology | www.frontiersin.org 10 May 2019 | Volume 10 | Article 445TABLE 2 | Studies that correlated DTI metrics on the CST in the acute phase (days 2–7 post-stroke) with motor outcomes assessed at least 4 weeks after stroke.
Study Lesion characteristics Demographics Details of acquisition Technique/ Mentioned CST Time of Reported Outcome Did CST DTI
Moura et al.
software/ lesion evaluation rehabilitation metrics
metrics mask (months correlate with
after stroke) outcomes?
Type Time period Lesion n Gender Age Mean MRI Directions/ b value Ipsilateral Contralateral
after stroke for site or M/F range age field (T) b0 (s/mm²)
DTI acquisition arterial (SD)
(days) territory
if IS
IS HS
Yoshioka 2–5 Thalamus, 17 12/5 49–74 61.8 1.5 13/NS 1,000 Tractography (NS) 3 MMT rFA: yes
√ √ √
Frontiers in Neurology | www.frontiersin.org
et al. (101) putamen (NS) r = 0.55
dTV II and p < 0.05
VOLUME ONE
ROI: CP to
precentral gyrus
FA, rFA
Puig et al. 3 Middle 60 38/22 45–85 68.2 1.5 15/NS 1,000 ROI: rostral pons 1 No
√ √ √
NIHSSm
(93) cerebral (13.6) DTIWeb 2.0
artery FA, rFA
Kuzu et al. 3 Thalamus, 23 12/11 44–85 65 (13) 3.0 6/1 800 ROI: CP 3 FA: yes (CC not
√ √ √
NIHSSm
(102) putamen Functoll (GE) (3 m) given; p =
FA 0.006)
Wang et al. 3 Thalamus, 27 14/13 42–77 60.2 1.5 15/NS 1,000 ROI: CP 6 PG (6 m) rFA: yes
√ √ √
(95) putamen (10.5) SPM99 mRS PG, r = −0.642
rFA, rMD (17 m)
FIM (17 m) mRS, r =
11
−0.549
FIM, r = 0.532
Groisser 3–7 Middle 10 5/5 19–67 53 (13) 3.0 60/10 700 Tractography (NS) 6 Hand grip rAD: yes
√ √ √ √
et al. (94) cerebral MI Hand grip, rs =
artery ROI: 10 voxels NHPT 0.85
with highest MI, rs = 0.97
density NHPT: no
Trackvis rFA and rRD: no
r (FA, AD, RD)
Doughty 2 Cerebral 58 24/34 NS 61.3 1.5 30/1 1,000 ROI: CP and N5S 3 FMA aFA, N5S: yes
√ √ √ √ √
et al. (103) hemisphere (14.2) SPM and MRIcro, aFA, CP: no
aFA
NS, not specified; IS, ischemic stroke; HS, hemorrhagic stroke; CST, corticospinal tract; r, ratio between ipisilesional/contralesional; FA, fractional anisotropy; aFA, asymmetry between (contralesional-
ipsilesional)/(contralesional+ipsilesional) fractional anisotropy; MD, mean diffusivity; AD, axial diffusivity; RD, radial diffusivity; CC, correlation coefficient; ROI, region of interest; CP, cerebra peduncle; PLIC, Posterior Limb of
the internal capsules; N5S, nearest 5 slices; aFA, FA asymmetry; PG, Paresis Grading; MMT, Manual Muscle Test; NIHSSm, National Institutes of Health Stroke Scale; mRS, Modified Rankin Scale; NHPT, Nine Hole Peg Test; FIM,
Functional Independence Measures; FMA, Fugl-Meyer Motor Assessment; MMT, Manual Muscle Testing.
Diffusion Tensor Imaging in Stroke
May 2019 | Volume 10 | Article 445TABLE 3 | Studies that correlated DTI metrics within the corticospinal tract (CST) in the early subacute phase (7–90 days post-stroke) with motor outcomes assessed at least 4 weeks after stroke.
Moura et al.
Study Lesion characteristics Demographics Details of acquisition Technique/ Mentioned CST Time of Reported Outcome Did CST DTI
software/ lesion evaluation rehabilitation metrics
metrics mask (months correlate with
after stroke) outcomes?
Type Time period Lesion n Gender Age Mean MRI Directions/ b value Ipsilateral Contralateral
after stroke for site or M/F range age field (T) b0 (s/mm²)
DTI acquisition arterial (SD)
(days) territory
if IS
IS HS
Frontiers in Neurology | www.frontiersin.org
Radlinska 12 Included 18 5/13 42–86 73.0 3.0 64/NS 1,000 Tractography (NS) 6 RMFT rFA: yes
√ √ √
et al. (104) white (12.9) MINC suite tools r = 0.87
matter rFA
Koyama 14–18 Thalamus, 15 6/9 31–85 51 (NS) 3.0 12/1 1,000 ROI: CP 1 MRC rFA:yes
√ √ √ √
et al. (105) putamen Customized code (1 m) r 2 = 0.272
or both IDL software
rFA
Wang et al. 14 Thalamus, 27 14/13 42–77 60.2 1.5 15/NS 1,000 ROI: CP 6 rFA: yes
√ √ √
NIHSSm
(95) putamen (10.5) SPM99 (6 m) NIHSSm , rs =
FA, MD mRS −0.7
(17 m) mRS, rs =
FIM (17 m) −0.653
FIM, rs = 0.661
Kim et al. 7–30 Middle 37 28/9 27–81 57.4 1.5 32/NS 1,000 Tractography (NS) 6 MI rFA: yes
√ √
(106) cerebral (15.2) MBC MI, r = 0.517
12
artery FSL, DTI-Studio MBC, r = 0.473
ROI: anterior p=0.003
mid-pons to
anterior lower
pons
rFA
Koyama 14–18 Thalamus, 32 16/16 31–88 NS 3.0 12/1 1,000 ROI: CR/IC and 1 MRC rFA: yes
√ √ √ √
et al. (53) putamen CP mRS CP, MRC, r 2 =
FSLutils (1 m) 0.271
rFA CP, MRS, r 2 =
0.239
CR/IC,MRC, r 2 =
0.085
CR/IC, MRS, r 2
= 0.057
Puig et al. 30 Middle 70 42/28 NS 72 (12) 1.5 15/NS 1,000 ROI: pons 24 MI rFA: yes
√ √ √
(12) cerebral NeuroScape 2.0 (2 y) (OR = 1.6)
artery MR Stroke Edition
rFA
Groisser 30–60 Middle 10 5/5 19–67 53 (13) 3.0 60/10 700 Tractography (NS) 6 Hand grip rFA: yes
√ √ √ √
et al. (94) cerebral MI Hand grip, rs =
artery ROI: 10 voxels NHPT 0.7
with highest (6–7 m) MI, rs = 0.87
density NHPT, rs = 0.79
Trackvis rAD and rRD: No
r (FA, AD, RD)
(Continued)
Diffusion Tensor Imaging in Stroke
May 2019 | Volume 10 | Article 445TABLE 3 | Continued
Study Lesion characteristics Demographics Details of acquisition Technique/ Mentioned CST Time of Reported Outcome Did CST DTI
software/ lesion evaluation rehabilitation metrics
Moura et al.
metrics mask (months correlate with
after stroke) outcomes?
Type Time period Lesion n Gender Age Mean MRI Directions/ b value Ipsilateral Contralateral
after stroke for site or M/F range age field (T) b0 (s/mm²)
DTI acquisition arterial (SD)
(days) territory
if IS
IS HS
Koyama 14–18 Cortex ± 16 11/5 47–80 70 (NS) 3.0 12/1 1,200 Whole-brain ∼3 BRS rFA and BRS: yes
√ √ √ √
et al. (97) corona voxel-wise FIM Proximal, rs=
Frontiers in Neurology | www.frontiersin.org
radiata or analysis (5–7 m) 0.687
PLIC TBSS, ROI=CST Distal, rs = 0.579
FSL rFA and FIM: No
FSLutils of CST
FA, rFA
Cheng 14 Thalamus, 48 31/17 NS 62 (14) 3.0 30/NS 1,000 Tractography (NS) 3 MI rFA at CR after 1
√ √ √ √
et al. (107) putamen and 3 months:
ROI: yes
CR, CP, pons, PH MI at 1 m,
Neuro 3D rs = 0.433
software MI at 3 m,
FA, rFA rs = 0.405
CP, pons, PH: No
Imura et al. 10 NS 25 14/11 NS 71.5 (11) 3.0 16/NS 1,000 Tractography (NS) 1 MI FA, CST: Yes
√ √ √ √
(108) BRS MI-UE, rs = 0.65
FiberTrak BRS-UE, rs =
13
FA 0.61
MI-LE, rs = 0.60
BRS-LE, rs
= 0.69
Zhang 14 Pons 17 12/5 34–73 58.3 3.0 64/1 700 4 ROIs (medulla, 6 FMA rFA, ROIs CP,
√ √ √
et al. (109) (NS) CP, IC, CS) mRS IC,CS: yes
DT imaging studio (3 m, 6 m) 3m
FM, r = 0.771
rFA rFA, mRS, r =
−0.569
6m
FM, r = 0.73
mRS, r = −0.498
ROI medulla: No
Buch et al. 14 Middle 25 14/11 37–83 61 (NS) 3.0 30/1 1,000 Whole-brain 3 FMA Yes
√ √ √ √
(110) and/or voxel-wise rs < −0.8
anterior analysis p < 0.0001
cerebral TORTOISE,
artery DTI-TK, MRIcro
aFA
Jang et al. 7–28 Pons 31 12/19 36–79 64.76 1.5 32/NS 1,000 Tractography 6 MI FA, rFA: no
√ √ √ √
(100) (10.76) (deterministic) BRS
ROI: pons
DTI studio
FA, rFA
NS, not specified; IS, ischemic stroke; HS, hemorrhagic stroke; M, male; F, female; SD, standard deviation; T, Tesla; CST (corticospinal tract); UE, upper extremity; LE, lower extremity; FA, fractional anisotropy; rFA, ratio between
ipisilesional/contralesional fractional anisotropy; aFA, asymmetry between (contralesional-ipsilesional)/(contralesional+ipsilesional) fractional anisotropy; CS, centrum semiovale; ROI, region of interest; CR, corona radiata; IC, internal
capsule; CP, cerebra peduncle; TBSS, tract-based spatial statistics; PH, parihoematomal edema; MBC, Modified Brunnstrom classification; BRS, Brunnstrom Recovery Scale; MRC, Medical Research Council; r, Pearson correlation
coefficient; rs, Spearman correlation coefficient; OR, odds ratio; NIHSSm, Motor score (upper and lower limb); mRS, Modified Rankin Scale; NHPT, Nine Hole Peg Test; MI, Motricity Index; FIM, Functional Independence Measures;
FMA, Fugl-Meyer Motor Assessment.
Diffusion Tensor Imaging in Stroke
May 2019 | Volume 10 | Article 445Moura et al. Diffusion Tensor Imaging in Stroke
CONCLUSIONS AND FUTURE Finally, in the revised studies, the goal was not to test
DIRECTIONS comprehensive predictive models that included DTI results.
In order to determine whether DTI will have a role on
FA in the CST, measured within the first hours to 3 months prediction of motor recovery after stroke, it is necessary to
after stroke, has emerged as a potential DTI biomarker of motor test different models in large sets of data. DTI may reach a
recovery. Further research about its relevance, involving analysis place in clinical practice if accuracy of a model is enhanced
of large sets of data from multiple centers, will benefit from by this imaging tool, compared to models that only include
definition of minimal standards and optimal pipelines for data variables that can be quickly and easily obtained such as bedside
acquisition, analysis, and reporting. clinical evaluation.
To perform whole-brain voxel wise and ROI analysis,
according to the published studies in the field, it is suggested to: AUTHOR CONTRIBUTIONS
(1) acquire at least 30 non-collinear directions, as more accurate
sampling reduces orientational dependence and enhances AC and LM contributed to the conception and design of the
accuracy and precision of DTI metrics (10); (2) use at least 6 study. LM wrote the first draft of the manuscript. All authors
interspersed low b-value images (such as zero), reducing the risk contributed to manuscript revision, read, and approved the
of systematic errors due to subject motion (10); (3) use an optimal submitted version.
b-value (around 1,000 s/mm2 ), depending on the other physical
parameters (28, 31, 33); (4) report parameters of acquisition FUNDING
employed for correction of EPI distortions (31, 115, 116); (5)
whenever possible, opt for a HARDI protocol if the goal is AC, RL, and LM received scholarship from Grant R01NS076348-
to perform tractography. The suggested steps of pre and post- 01 (National Institutes of Health). Funds for publication fees
processing discussed in this review should take into consideration were paid by this grant. JPP received a scholarship from
the limitations of the acquisition. Clear information about CAPES (Coordenação de Aperfeiçoamento de Pessoal de Nível
acquisition parameters and methodological choices of processing Superior). The funders had no role in study design, data
strategies should be provided—if necessary, due to limits in the collection and analysis, decision to publish, or preparation of
number of words according to guidelines of different journals, as the manuscript.
on-line supplemental material.
The decrease in methodological heterogeneity and SUPPLEMENTARY MATERIAL
enhancement of reproducibility will advance the field by
setting the stage for large studies with good-quality data in order The Supplementary Material for this article can be found
to define the clinical relevance of DTI in prediction of motor online at: https://www.frontiersin.org/articles/10.3389/fneur.
disability from stroke. 2019.00445/full#supplementary-material
REFERENCES 8. Thomalla G, Simonsen CZ, Boutitie F, Andersen G, Berthezene Y, Cheng B,
et al. MRI-guided thrombolysis for stroke with unknown time of onset. N
1. Hankey GJ. Stroke. Lancet. (2017) 389:641–54. doi: 10.1016/S0140- Engl J Med. (2018) 379:611–22. doi: 10.1056/NEJMoa1804355
6736(16)30962-X 9. Basser PJ, Mattiello J, LeBihan D. MR diffusion tensor spectroscopy and
2. Grotta J, Albers G, Broderick JP, Kasner SK, Lo E, Sacco R. imaging. Biophys J. (1994) 66:259–67. doi: 10.1016/S0006-3495(94)80775-1
Stroke: Pathophysiology, Diagnosis, and Management. Elsevier Health 10. Le Bihan D, Mangin J-F, Poupon C, Clark CA, Pappata S, Molko N, et al.
Sciences (2016). Diffusion tensor imaging: concepts and applications. J Magn Reson Imaging.
3. Baron CA, Kate M, Gioia L, Butcher K, Emery D, Budde M, (2001) 13:534–46. doi: 10.1002/jmri.1076
et al. Reduction of diffusion-weighted imaging contrast of acute 11. Chen YJ, Nabavizadeh SA, Vossough A, Kumar S, Loevner LA, Mohan S.
ischemic stroke at short diffusion times. Stroke. (2015) 46:2136–41. Wallerian degeneration beyond the corticospinal tracts: conventional
doi: 10.1161/STROKEAHA.115.008815 and advanced MRI findings. J Neuroimaging. (2017) 27:272–80.
4. Chaudhary N, Pandey AS, Gemmete JJ, Hua Y, Huang Y, Gu Y, et al. doi: 10.1111/jon.12404
Diffusion tensor imaging in hemorrhagic stroke. Exp Neurol. (2015) 272:88– 12. Puig J, Blasco G, Daunis-I-Estadella J, Thomalla G, Castellanos M,
96. doi: 10.1016/j.expneurol.2015.05.011 Figueras J, et al. Decreased corticospinal tract fractional anisotropy
5. Adams HP, Adams RJ, Brott T, del Zoppo GJ, Furlan A, Goldstein predicts long-term motor outcome after stroke. Stroke. (2013) 44:2016–8.
LB, et al. Guidelines for the early management of patients with doi: 10.1161/STROKEAHA.111.000382
ischemic stroke: a scientific statement from the Stroke Council 13. Maeshima S, Osawa A, Nishio D, Hirano Y, Kigawa H, Takeda H. Diffusion
of the American Stroke Association. Stroke. (2003) 34:1056–83. tensor MR imaging of the pyramidal tract can predict the need for orthosis in
doi: 10.1161/01.STR.0000064841.47697.22 hemiplegic patients with hemorrhagic stroke. Neurol Sci. (2013) 34:1765–70.
6. Beauchamp NJ, Ulug AM, Passe TJ, van Zijl PC. MR diffusion imaging doi: 10.1007/s10072-013-1330-z
in stroke: review and controversies. Radiographics. (1998) 18:1265–9. 14. Song J, Nair VA, Young BM, Walton LM, Nigogosyan Z,
doi: 10.1148/radiographics.18.5.9747619 Remsik A, et al. DTI measures track and predict motor function
7. Nogueira RG, Jadhav AP, Haussen DC, Bonafe A, Budzik RF, Bhuva P, et al. outcomes in stroke rehabilitation utilizing BCI technology.
Thrombectomy 6 to 24 hours after stroke with a mismatch between deficit Front Hum Neurosci. (2015) 9:195. doi: 10.3389/fnhum.2015.
and infarct. N Engl J Med. (2018) 378:11–21. doi: 10.1056/NEJMoa1706442 00195
Frontiers in Neurology | www.frontiersin.org 14 May 2019 | Volume 10 | Article 445You can also read