A revised image of the instrumental seismicity in the Lodi area (Po Plain, Italy)
←
→
Page content transcription
If your browser does not render page correctly, please read the page content below
Solid Earth, 12, 2021–2039, 2021
https://doi.org/10.5194/se-12-2021-2021
© Author(s) 2021. This work is distributed under
the Creative Commons Attribution 4.0 License.

A revised image of the instrumental seismicity in the
Lodi area (Po Plain, Italy)
Laura Peruzza1 , Alessandra Schibuola1,2 , Maria Adelaide Romano1 , Marco Garbin1 , Mariangela Guidarelli1 ,
Denis Sandron1 , and Enrico Priolo1
1 OGS   – Istituto Nazionale di Oceanografia e di Geofisica Sperimentale, Sgonico (TS), 34010, Italy
2 Dipartimento   di Matematica e Geoscienze, Università degli Studi di Trieste, Trieste, 34100, Italy

Correspondence: Laura Peruzza (lperuzza@inogs.it)

Received: 31 March 2021 – Discussion started: 15 April 2021
Revised: 5 July 2021 – Accepted: 11 July 2021 – Published: 8 September 2021

Abstract. We analysed the instrumental seismicity in a sec-         the geological structures that generate earthquakes appears
tor of the Po Plain (Italy) to define the baseline for seis-        uncertain. Our results are a preliminary benchmark for the
mic monitoring of a new underground gas storage plant               definition of seismogenic zones in the Lodi area, whose defi-
that will use the depleted gas reservoir of Cornegliano Lau-        nition can be improved with the existing observational capa-
dense, near Lodi. The target area – a square approximately          bilities now available in the surroundings.
80 km × 80 km wide – is commonly considered aseismic.
The analysed period, 1951–2019, includes all available in-
strumental data. We gathered the P- and S-phase readings
collected by various agencies for more than 300 events, ap-         1   Introduction
proximately located inside the target area. We processed the
earthquakes uniformly, using absolute location algorithms           The Po Plain is one of the most strategic areas of Italy with
and velocity models adopted by the regional and national            the highest concentration of inhabitants and economic ac-
monitoring networks. The relocated earthquake dataset de-           tivities. It runs through northern Italy almost east–west for
picts an image of weak and deep seismicity for this central         about 300 km, hosting cities of historical value (e.g. Milan)
sector of the Po Plain, which is quite different from the initial   and large industrial districts.
one derived from the existing earthquake catalogues. Within            The Po Plain is a foredeep basin, bounded by two moun-
a distance of approximately 30 km from Lodi, earthquakes            tain chains, the Northern Apennines southwards, and the
are extremely rare (on average 0.5 earthquakes per year, as-        Southern Alps northwards, with opposite vergence (Fig. 1).
suming a completeness magnitude Mc = 2.7 from the 1980s);           It is characterized by a thick cover of alluvial sediments, de-
only two weak events fall at less than 15 km distance from          posited by the Po river and its tributaries (Ogniben et al.,
the reservoir in the whole period 1951–2019. The strongest          1975; Bigi et al., 1990). Due to the origin of its deposits,
events instrumentally recorded are related to the seismic se-       the Po Plain hosts several natural gas (i.e. methane) reser-
quence of Caviaga in 1951 that represent the first instru-          voirs that are mostly located at depths ranging on average
mental recordings for that area. Confirming the hypocentral         between 1.1 and 1.8 km; the reservoir and sealing rocks are
depths recently proposed by Caciagli et al. (2015), the events      usually Pliocene sands and Lower Pleistocene clays, respec-
are far from the gas reservoir; we suggest common tectonic          tively (Fantoni and Franciosi, 2010; Boccaletti et al., 2011).
stress of the main shock of 1951 and the M4.2 earthquake            The Po Plain is also one of the less seismically hazardous ar-
of 17 December 2020, based on the similarities in depth, lo-        eas of Italy (Pagani et al., 2018), but the seismic risk is not
cation, and focal mechanism. While it is clear that the deep        negligible (Silva et al., 2018). In addition to the great expo-
seismicity corresponds to the collision between the North-          sure values, the vulnerability can also be high, since seismic
ern Apennines and the Southern Alps, the characterization of        provisions in this area have become mandatory only in the
                                                                    last decade (e.g. DGR, 2014; Peruzza and Pessina, 2016),

Published by Copernicus Publications on behalf of the European Geosciences Union.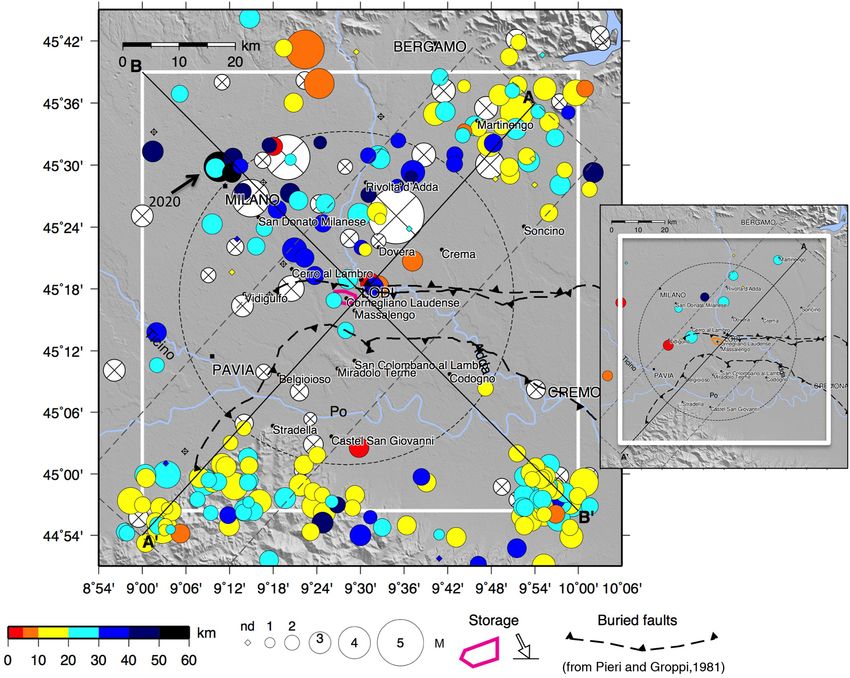
2022                                                             L. Peruzza et al.: A revised image of the instrumental seismicity

Figure 1. Sketch of northern Italy with the opposite verging mountain systems that surround the Po Plain. Main panel: structural map modified
after Vannoli et al. (2015). Black lines: main tectonic elements; white lines: inherited faults; horizontal grey shading: platform of Trento;
grey thin traits: seismic profiles. The red and green dashed lines indicate the outermost fronts and arcs of the Southern Alps (SAMF, SAOA)
and Northern Apennines (NAOA), respectively; the yellow line is approximately the trace of the profiles shown in Fig. 2. Other acronyms
are as follows: SVL: Schio-Vicenza fault; GS: Giudicarie System; MA: Monferrato arc; EA: Emilian Arc; FRA: Ferrarese-Romagnolo arc;
PTF: foothills of the Apennines. Coloured arrows show the approximate direction of convergence linked respectively to the Eurasia (red),
Africa (green), and Adria plates (blue). In the inset, a blow-up of the study area, with the location of the Cornegliano Laudense USG (pink
area), and a 30 km distance frame (OD domain, black dashed circle) (© OpenStreetMap contributors, 2021. Distributed under the Open Data
Commons Open Database License (ODbL) v1.0.

and earthquakes in the magnitude range 5–6 can be devastat-              the Italian guidelines for monitoring underground activities
ing, as shown by the 2012 Emilia sequence (Liberatore et al.,            (MiSE-UNMIG, 2014), the company decided to implement
2013; Centro Studi, 2014).                                               an integrated seismic and geodetic monitoring voluntarily.
    The largest gas reservoirs of the Po Plain were discovered           The design and management of the monitoring system were
in the 1940s by the Italian public company AGIP and have                 commissioned to two Italian public research institutes, i.e.
extensively been used for gas production since the 1950s                 OGS-CRS (National Institute of Oceanography and Applied
(Dami, 1952; Bencini et al., 1999). They were the first large            Geophysics – Centre of Seismological Research) and CNR-
gas deposits discovered in Europe: for instance, the reservoir           IREA (National Council of Research – Institute for Electro-
of Caviaga, with about 12 billion scm (standard cubic metre)             magnetic Sensing of the Environment). OGS-CRS is respon-
of gas, was considered a giant reservoir for the time. Once              sible for seismic monitoring (operational since 2017) and co-
depleted after production, several reservoirs have been re-              ordinates all monitoring activities, while CNR-IREA is re-
utilized as underground gas storage (UGS) to hold the natural            sponsible for geodetic monitoring. As recommended by the
gas imported from other sites or countries. At present (2021),           ministry guidelines, the seismic activity must be analysed, if
the Po Plain hosts 11 UGS sites of the 15 in operation in                possible, before the start of the storage operations, to define
Italy; their storage capacity represents more than 60 % of the           a baseline for the natural seismicity.
total UGS capacity of the country (17.6 billion scm; SNAM,                  We describe the results of the analysis aimed at establish-
2018).                                                                   ing the seismic baseline before the start of the storage op-
    One of the most recent UGS facilities developed in Italy             erations. The study area is defined according to the need to
is “Cornegliano Stoccaggio”, located in Cornegliano Lau-                 analyse the background seismicity in the volume surrounding
dense, a small village near Lodi, about 30 km south of Milan;            the underground reservoir. Following the Italian guidelines
it is managed by Ital Gas Storage S.p.A. and it re-utilizes the          (MiSE-UNMIG, 2014), two reference domains are identified
homonymous reservoir discovered in 1951, used for gas pro-               for seismic monitoring (Fig. 2). The inner domain (ID) is the
duction until depletion in 1997. The reservoir is located at a           volume surrounding the reservoir up to a distance of 3 km
depth of 1.3–1.4 km and the concession extends over an area              from its outer edges, with a conventional reservoir depth of
of approximately 24 km2 (MiSE-DGISSEG-UNMIG, 2021).                      1.4 km; the volume extends upwards to the surface. The ex-
The storage activity started in December 2018. Following                 tended domain (ED) is a spherical volume with a 15 km ra-

Solid Earth, 12, 2021–2039, 2021                                                              https://doi.org/10.5194/se-12-2021-2021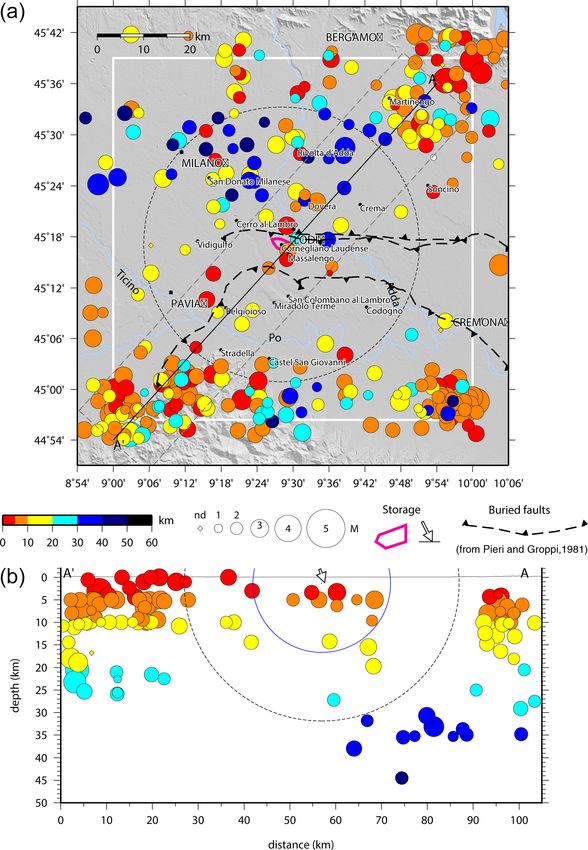
L. Peruzza et al.: A revised image of the instrumental seismicity                                                                2023

Figure 2. Geological NNE–SSW cross sections in the Po Plain, modified after Martelli et al. (2016). The contour lines of the monitoring
domains are represented by red circles. ID: inner domain; ED: extended domain; OD: outer domain. Light blue segment: UGS reservoir of
Cornegliano Laudense. See text for more details.

dius centred on the main location of the UGS facility (the so-        we have also included a brief analysis of the most recent,
called Cluster A) at the reservoir depth. Since our study area        deep M ∼ 4 earthquake that occurred on 17 December 2020,
features rare and deep events, we introduce an additional do-         near Milan. This study is also intended to be a critical view on
main, which is called the outer domain (OD) and is delimited          the quality of earthquake catalogues in weakly seismic areas,
by a spherical cap with a 30 km radius, centred like ED. Fig-         and a stimulus for further studies, to improve our knowledge
ure 2 shows the contour lines of the three domains along a            of the deep structures that characterize the collision between
vertical cross section approximately N–S oriented. The up-            the Alps and the Apennines beneath the Po Valley.
per crust structure, as interpreted by Martelli et al. (2016)
down to a depth of approximately 10 km, is superimposed.
Note that the OD has volume and surface corresponding to              2   Seismotectonic framework
approximately 8 and 4 times those of the ED, respectively.
                                                                      Italy is an active tectonic province characterized by two
   We identify the study area approximately with the OD, for
                                                                      mountain belts: the Alps and the Apennines. They were
which we summarize the main seismotectonic features and
                                                                      formed as the result of complex geodynamic processes linked
re-analyse the past instrumental seismicity, available from
                                                                      to the progressive migration of the African plate towards the
the national and regional catalogues from the early instru-
                                                                      European plate. The two opposite verging fold-and-thrust
mental period (i.e. after the Second World War) until 2019.
                                                                      belts face each other around the Po Plain that geologically
We deliberately exclude from our analysis the data acquired
                                                                      coincides with the foreland of both the chains (Fig. 1); it also
by the new local seismic network of Cornegliano Laudense,
                                                                      hosts their foredeeps, and for this reason it has undergone
implemented in 2016 and operational since 2017 within
                                                                      steady subsidence and sedimentation over the past 5 Myr
the UGS integrated seismic and geodetic monitoring system
                                                                      (Fantoni and Franciosi, 2010). The Po Plain represents the
(http://rete-cornegliano.crs.inogs.it/, last access: 10 August,
                                                                      north-westernmost buried sector of the Apulian indenter too
2021).
                                                                      (i.e. Adria plate, Dercourt et al., 1986). New insights into the
   The result of the present study is a revised dataset of in-
                                                                      tectonic evolution of the Alps and adjacent orogens are made
strumental earthquake locations that covers about 70 years.
                                                                      available thanks to the AlpArray initiatives (see http://www.
Although this catalogue does not feature uniform quality and
                                                                      alparray.ethz.ch/en/home/, last access: 10 August 2021, and
completeness characteristics, it represents the most accurate
                                                                      the special issue at https://se.copernicus.org/articles/special_
and reliable view of the seismicity in the Lodi area available
                                                                      issue1099.html, last access: 10 August 2021); despite our
right now. To further strengthen the relevance of our results,
                                                                      study area being quite marginal to the main experiments (e.g.

https://doi.org/10.5194/se-12-2021-2021                                                          Solid Earth, 12, 2021–2039, 2021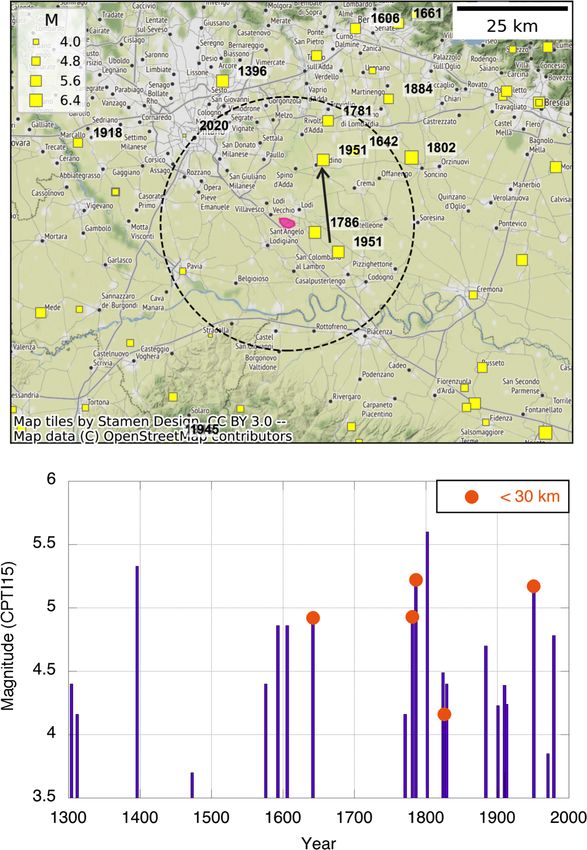
2024                                                        L. Peruzza et al.: A revised image of the instrumental seismicity

Hetényi et al., 2018), some additional constraints, on the
Moho depth, for example, are given by Kind et al. (2021).
Global Positioning System (GPS) studies show that the con-
vergence rate at the latitude of northern Italy is about 3–
8 mm yr−1 (Serpelloni et al., 2007), while the shortening
across the Po basin is estimated at 1–3 mm yr−1 and increases
from west to east (Devoti et al., 2011).
   The Po valley is formed by alluvial sediments deposited
by the Po River and its tributaries coming from the southern
Alpine and northern Apennine slopes; they are characterized
by uneven thickness – the maximum thickness of approxi-
mately 7–8 km is located in the eastern Po Plain (Ghielmi
et al., 2010) – and the subsidence is asymmetric. Below the
alluvial and clastic Cenozoic deposits, the sedimentary se-
quence includes Mesozoic carbonates and a crystalline base-
ment essentially formed by Hercynian metamorphic rocks.
The main fault systems have evolved from extensional (Late
Triassic–Early Jurassic) to compressional regimes (Late
Cretaceous-Cenozoic), with the inversion of tectonic mecha-
nisms. Triassic-Early Jurassic rift-related structures were lo-
cally re-arranged by Cretaceous contractional phases, with
the reactivation of some of the existing normal faults (Dal
Piaz et al., 2004); during Miocene and Pliocene times, the
basin became the foreland of the Alps, and the Apennine
belts and the Mesozoic rocks were deeply buried beneath
the Palaeogene–Neogene clastics and the associated foredeep
wedges. These late sedimentary formations, consisting of al-
ternating shale and sandstone layers, permitted the accumu-
lation of hydrocarbons derived from biogenic sources; sand-
stones are excellent reservoir rocks for oil and gas, thanks
to their porosity, whilst shales with very low permeability        Figure 3. Seismicity of the Lodi area according to CPTI15, v. 3.0
act like impermeable barriers. Also, the underlying Triassic       (Rovida et al., 2021); top panel: epicentral map (© OpenStreetMap
carbonates are great reservoir rocks, as in the Villafortuna–      contributors, 2021. Distributed under the Open Data Commons
Trecate field, 30 km west of Milan. The Po Plain represents        Open Database License (ODbL) v1.0) – the black arrow shows the
one of the major provinces of conventional hydrocarbons in         shift between the macroseismic (lower) and one of the instrumental
continental Europe (Turrini et al., 2015).                         (upper) epicentres for the 1951 main event as relocated by Caciagli
   Throughout geological time, both pre-Alpine (Mesozoic           et al. (2015); bottom panel: plot of magnitude versus time for events
                                                                   located within 50 km distance of the reservoir.
and pre-Mesozoic) and Alpine (mainly Cenozoic) orogenic
phases have interacted to create the current structural and
stratigraphic setting (Carminati and Doglioni, 2012). Three
main outer arcs have been suggested or defined for the North-      within a distance of approximately 10 km from it, there are
ern Apennines, buried below the Pliocene–Quaternary ma-            the composite sources ITCS002 and ITCS115 towards the
rine and continental deposits. From west to east respectively      NE, belonging to the outer arc of the Southern Alps (SAOA),
they are (Fig. 1) the Monferrato Arc, the Emilian Arc (EA),        and ITCS044 towards the S, belonging to the EA. They are
and the Ferrara-Romagna Arc. On the opposite side of the           expected to have a maximum slip rate of 0.5 mm yr−1 (Mae-
Po Plain, one wide arc running from Milan to the Garda             sano et al., 2015) and be capable of a maximum magnitude
Lake is related to the Southern Alps (Vannoli et al., 2015).       of 5.5–6.0.
The above-mentioned arcs host active tectonic structures ca-          The study area is characterized by weak to moderate seis-
pable of generating earthquakes. In most cases, the faults         micity. Figure 3 shows the main historical and instrumental
in the Po Valley are blind; i.e. they do not reach the sur-        earthquakes as reported by CPTI15 (Rovida et al., 2021): in
face and hence cannot be identified by surficial geological-       the timeline (bottom panel), earthquakes within 50 km dis-
geomorphological surveys (Benedetti et al., 2003). Accord-         tance of the reservoir are represented, differently marked
ing to the Database of Italian Seismogenic Sources (DISS           if within 30 km. The earthquakes of major interest for the
Working Group, 2018), our study area does not intersect            area of Lodi are the events that occurred in 1781 and 1786
any of the seismogenic sources recognized to date. However,        (magnitude M ∼ 5, estimated by macroseismic data), and the

Solid Earth, 12, 2021–2039, 2021                                                        https://doi.org/10.5194/se-12-2021-2021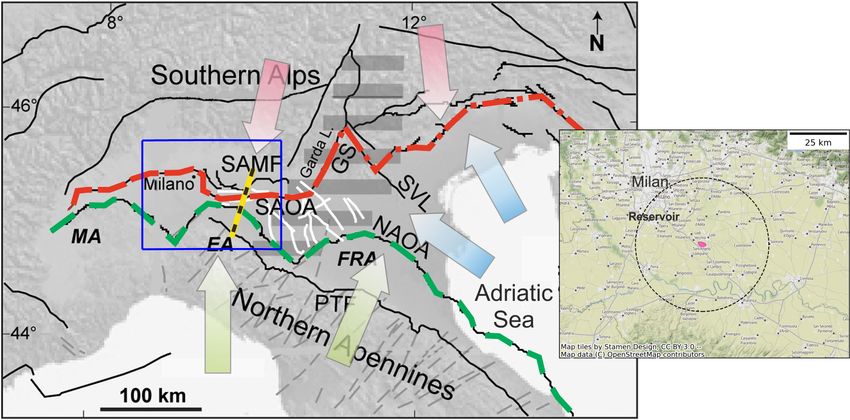
L. Peruzza et al.: A revised image of the instrumental seismicity                                                                2025

earthquakes of 15–16 May 1951, also known as the Caviaga
earthquakes. The earthquakes of 15 May at 22:54 UTC and
16 May at 02:27 UTC are the most important ones for our
study area, for at least three reasons: (1) they are the only
moderate events that occurred during the instrumental pe-
riod; (2) they occurred in an area that was thought to be aseis-
mic, until that time, and that was the core of international in-
terests on hydrocarbon reserves for several decades; (3) for
decades, they have been considered anthropogenic events,
and they are still included in worldwide compilations of in-
duced seismicity. The 15 May earthquake is yet considered
the only M ≥ 5 gas-extraction-induced earthquake reported
for Europe (Foulger et al., 2018). In their recent study, Ca-
ciagli et al. (2015) relocated the two major events (assigning
an estimated MW = 5.4 to the main event of 15 May 1951,            Figure 4. Magnitude versus time plot of earthquakes located within
and MW = 4.6 to the aftershock of 16 May), by using phase          30 km distance of the reservoir, as reported in the INGV databases
readings reported in the International Seismological Sum-          and ISC Bulletin. The INGV data come from CPTI15 (Rovida et al.,
mary (ISS), with the use of modern hypocentral location pro-       2021) and ISIDe databases (ISIDe, 2007): 46 events with M > 1.5
                                                                   are reported in the time interval 1985–2019. The ISC data start with
cedures. They provided some bounds for the uncertainty of
                                                                   the 1951 event and end in 2018. Magnitudes are not uniform and
the location parameters and estimated the variation of the
                                                                   in some cases are not defined (see the blue circles labelled as nd
stress field due to extraction activities. As a result of that     along the x axis): in the case of multiple magnitudes no conver-
study, the epicentral location of the two events is moved far      sion rules are adopted, and values are selected on priority criteria
away from the most damaged area of Caviaga toward N–NW,            (MW > MS > ML > MD ).
from a minimum of 12 km to a maximum of 25 km distance
(in Fig. 3 we show the macroseismic and instrumental loca-
tion of the main event, namely the solution quoted as “15b”
in Caciagli et al., 2015). The depth of the source is estimated    Seismological Centre, ISC, which handles seismic stations
at 32–34 and 16–20 km for the main event and the aftershock,       and network bulletins of world seismicity); or dedicated
respectively, with statistical errors of 3–5 km; these are then    projects. A short description of the data providers and past
locations compatible with inherited faults within the crys-        initiatives in Italy is provided in Supplement 1.
talline basement. With regard to the focal mechanism, this            We first collected the earthquake locations provided on-
recent study did not suggest fault planes, as in some pre-         line and offline by the previously mentioned organizations
vious analyses (e.g. Ritsema, 1961; Gasparini et al., 1985).       and falling within the OD (Fig. 4). A preliminary working file
The stress perturbation induced by the coeval gas produc-          has been compiled by stacking the hypocentral solutions pro-
tion is estimated to be far below any value usually taken as       vided by INGV, UNIGE, OGS, and ISC in the period 1980–
a triggering threshold. Therefore, today, the Caviaga earth-       2019. It was immediately clear that some events are present
quakes are attributed to a tectonic origin, as they are deep       in one database only, while other earthquakes have many dif-
crustal events likely representing active sources at the con-      ferent solutions with large scatter in epicentral coordinates.
tact between the Northern Apennines and the Southern Alps          To account for such differences, we did other searches over
beneath the Po Plain.                                              a larger area (target area, TA, white frame in Fig. 5, that en-
                                                                   velopes the OD) and/or by individual earthquakes. The com-
                                                                   posite catalogue retains only one location for each event.
3   Data revision                                                  Multiple locations are believed to belong to the same earth-
                                                                   quake if the origin times differ by less than 20 s. In this case,
The initial phase of the work was the collection and compar-       the following priority rules are given to the data providers:
ison of instrumental earthquake catalogues that are available      INGV > UNIGE > OGS > ISC. If an event is reported inside
for the area, namely catalogues released by either the main        the TA by only one agency we retain that location. With re-
Italian institutions that manage seismic networks (the Na-         gard to the OGS data (available at http://rts.crs.inogs.it/, last
tional Institute of Geophysics and Volcanology, INGV, au-          access: 10 August 2021), it is worth mentioning that a very
thoritative centre for the National Seismic Network (RSN);         limited number of events are located inside the TA, as it is out
the University of Genoa (UNIGE), which manages the re-             of the NEI authoritative region; nonetheless, phase readings
gional seismic network of north-western Italy (RSNI); the          for non-located events are stored in the bulletins and have
National Institute of Oceanography and Applied Geophysics          been used in the later steps.
(OGS), with its regional seismic network of north-eastern             In Fig. 5 we represent the composite catalogue achieved
Italy (NEI); international agencies (e.g. the International        after merging the events, located by the aforementioned

https://doi.org/10.5194/se-12-2021-2021                                                        Solid Earth, 12, 2021–2039, 2021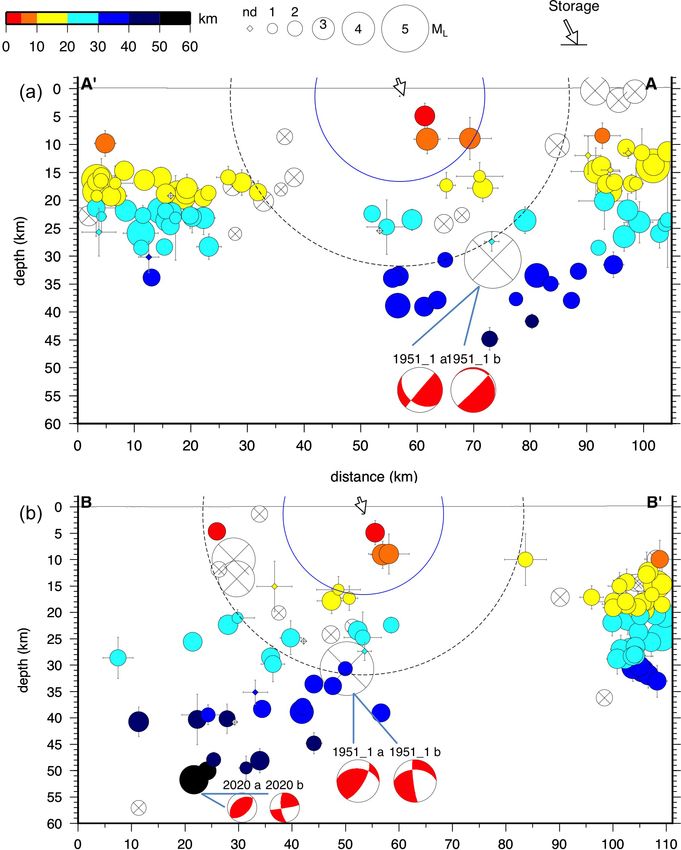
2026                                                            L. Peruzza et al.: A revised image of the instrumental seismicity

Figure 5. Composite earthquake catalogue for the study area from 1980 to 2019: (a) epicentral map of events that approximately fall in the
target area (latitude 44.94–45.65◦ N; longitude 9.00–10.00◦ E, white frame); (b) vertical cross section AA’. The 15 and 30 km distances from
the reservoir (ED and OD domains) are marked by blue and black dashed circles, respectively; in the magnitude scale, nd means not defined;
the reservoir is indicated by the pink polygon (map) and the arrow (section). The main buried faults are taken from Pieri and Groppi, 1981.

agencies from 1980 to 2019. We identify three main clus-                which shows, in this area, the northern Apennine EA facing
ters of shallow events (up to 20 km depth, red, orange and              the outermost fronts of the Southern Alps (SAMF, SAOA)
yellow in the colour legend in the NE, SE, and SW cor-                  separated at the surface by the sediment cover of the Po Plain.
ners of the study area, respectively), and some scattered deep          However, there are no clear correlations with the seismogenic
events (up to 50 km) in the northern sector of the OD and               sources proposed for this area. According to DISS v.3.2.1
between the two southernmost clusters. These features are               (DISS Working Group, 2018), the closest composite sources
somehow compatible with the structural setting of Fig. 1,               to the reservoir are ITCS115 (Western S-Alps external thrust

Solid Earth, 12, 2021–2039, 2021                                                             https://doi.org/10.5194/se-12-2021-2021
L. Peruzza et al.: A revised image of the instrumental seismicity 2027
3.1 Toward a revised instrumental catalogue
After the identification of 344 earthquakes that potentially
belong to the study area, we started the collection of P- and
S-phase readings and station data, for uniform reprocessing;
these data are only partially available on the web portals of
the data providers.
The map in Fig. 6 is a simplified graphical representa-
tion of what is usually called “station book”, i.e. the infor-
mation about location, operational conditions, instrumenta-
tion installed, and site response at each seismometric station,
data usually managed by the station’s owners. When a seis-
mic station has a permanent installation, it can be registered
with a unique code to international organizations (e.g. ISC;
see Supplement 1). For local or temporary monitoring, some-
times station books are not so rigorous, and station code can
duplicate existing names, keep the same code with some lo-
cation changes, or conversely modify the code when different
instrumentation is installed in the same site. For each station
contributing to the event location of this study with one or
more phase readings, we collected its geographical position
and, if available, the installation time with the colour palette
(Fig. 6). Stations closed during the investigated time given
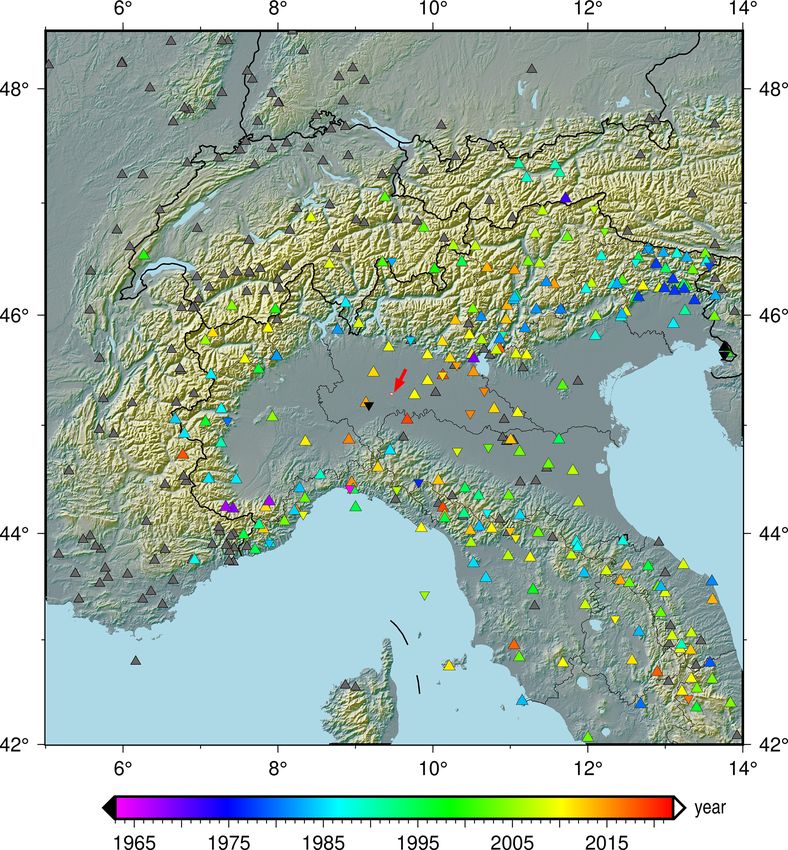
Figure 6. Location map of seismic stations used for the reloca- by the legend are indicated by point-down triangles. For the
tions done in this study. The red arrow shows the location of the stations in grey, we did not recover the details of operational
Cornegliano Laudense UGS. Stations are coloured according to the
conditions.
starting date, if known. Grey triangles are for unknown installation
date, point-down triangles for stations that are no longer operative.
The lack of stations in the Po plain is evident, especially
Note that the stations mapped do not represent all the existing sta- before the mid-1990s. Around the reservoir area, this lack is
tions, but only the ones for which phase readings have been col- confirmed at least until 2010–2015, if we exclude the Pavia
lected in this work. station (black symbols westwards of the arrow) closed pre-
sumably before 1985.
This makes it clear that the detectability threshold of earth-
shallow west; min-max depth 2–6 km) and ITCS002 (West- quakes in this area is worse than in adjacent sectors of north-
ern S-Alps external thrust deep; 6–13 km) in the Southern ern Italy, with better station coverage since the 1980s. In ad-
Alps; ITCS044 (Portalbera-Cremona; 2–7 km), on the Apen- dition, the completeness magnitude is strongly influenced by
nine side. The distribution of earthquakes along the vertical the level of background noise at the seismic stations, critical
cross section in Fig. 5 (A’A, SW–NE oriented) does not un- in this region too.
derline any particular geometry; several events are very shal- To quantify the noise level in the study area, we have
low (less than 5 km depth) and a fixed/trial depth of 10 km analysed the continuous signal recorded at the ground sur-
is visible. Note also that the location uncertainties are not face by a set of temporary stations (13 sites) we deployed in
represented in the graphs, as location errors are usually not July 2016, in the ED area, during the scouting phase carried
reported in the origin catalogues. Among the events closest out for designing the new monitoring seismic network for
to the reservoir (i.e. those inside the ED, represented as a blue the Cornegliano Laudense UGS. In addition to our tempo-
semi-sphere of 15 km radius in Fig. 5), eight events are pro- rary stations, we have also analysed the signal of the INGV
vided by the INGV database, and two are derived from the permanent station of Milano (MILN). We have to keep in
ISC bulletins, without a corresponding record on national or mind that all those stations are located in a densely popu-
regional datasets. lated area – MILN is in the centre of Milan – which hosts
This preliminary analysis motivated us in performing a several mid- to small-size cities and industry compartments.
global check and relocation of events for this sector of the Figure 7 shows the median noise curves (McNamara et al.,
Po Plain. 2004) relative to 1 d of continuous recording measured at the
13 temporary sites (thin blue lines) and 1 week of the signal
at the MILN station (thick red curve). The figure also shows
the two curves known as new high-noise model (NHNM) and
new low-noise model (NLNM) (lines in dark grey), respec-
tively, obtained by Peterson (1993) from the analysis of the
https://doi.org/10.5194/se-12-2021-2021 Solid Earth, 12, 2021–2039, 2021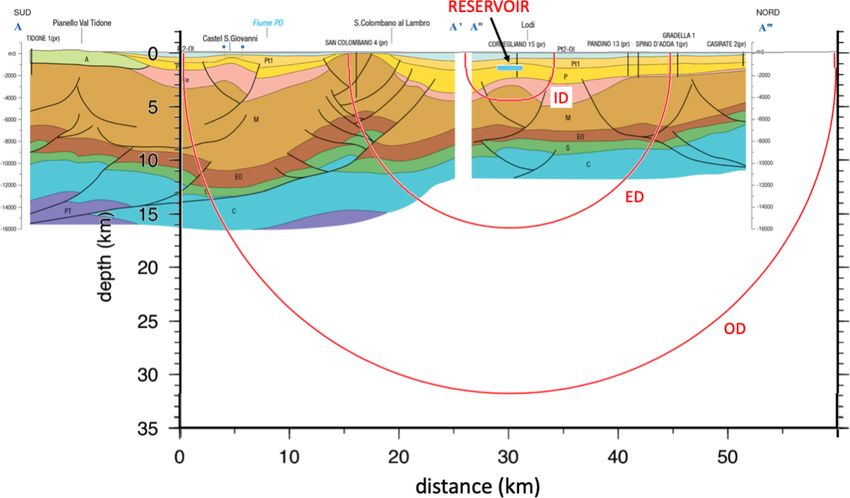
2028                                                        L. Peruzza et al.: A revised image of the instrumental seismicity

seismic microtremor data of 75 stations distributed in dif-             for assigning the uncertainties and magnitude over the
ferent parts of the world and generally used as a reference             years.
for estimating the quality of the signal recorded by a seis-
mological station. For the temporary stations represented in        3. The phase data provided by UNIGE. Some phase data
Fig. 7, the noise curves are truncated at the period of 4 s, as        are available online, but an extended search on the
the seismometer used is a Lennartz 3D-Lite with resonant pe-           archives has been performed (Scafidi, personal commu-
riod T = 1 s. We see in Fig. 7 that all the recordings carried         nication, 2019), for also including non-located/badly lo-
out at the ground surface feature a seismic noise level gener-         cated events that may be out of the authoritative area of
ally near to or higher than the NHNM line in the short-period          the RSNI network. Readings are available in different
range.                                                                 formats, depending on the years.
   The impact of the background noise on the minimum de-            4. The phase data of OGS, available in a uniform format
tectable magnitude has been evaluated by Franceschina et               in the online CRS Bulletins (http:// www.crs.inogs.it/
al. (2015) for a site located in the Po Plain within a pilot           bollettino/ RSFVG/ RSFVG.en.html, last access: 10 Au-
project for CO2 geo-sequestration. In their study, the authors         gust 2021) from 1977 on. In many cases, these data have
use both experimental data and theoretical arguments to de-            never been used before in location procedures, because
termine the noise levels of the area, the detection capabil-           the events that were manually picked and reckoned out-
ities of a future possible monitoring seismic network, and             side the OGS authoritative region of monitoring have
the improvement of borehole vs. surface installations. Based           not been processed until the hypocentral solution. Un-
on a 1 year observation period, they show that the Po Plain            localized phase manual readings are available in partic-
features high seismic noise levels, although slightly smaller          ular during the so-called “analogic” period (see Gentili
than our ones. They also estimate in ML 1.9 the minimum de-            et al., 2011) and after the improvement of the Veneto
tectable earthquake magnitude for an event-station distance            Region monitoring (from 2005 on; see Bragato et al.,
of 20 km.                                                              2021). Other unpublished data derive from the seismic
   Considering that the average inter-station distance exist-          monitoring of the Minerbio site that was performed by
ing until 2016 in our study area is greater than 30 km, we             OGS on behalf of A.G.I.P. S.p.A. (Rebez, 1991), or have
can reasonably shift the detection magnitude threshold to              been searched on original seismograms on paper, avail-
ML ∼ 2.5. As the completeness magnitude (Mc ) of the cat-              able in the Sgonico headquarters of OGS. Note that the
alogue is higher than the detection magnitude we can easily            readings of Trieste station (station code TRS from 1904
understand that the poor completeness magnitude value of               to 1964; TRI from 1959 on) are usually available on the
the existing catalogues is the outcome of the high seismic             ISC archives, but for the earliest events they have been
noise existing there, combined with the low network density.           checked on original documents too.
Additional problems derive from the use of different stan-
dards for magnitude assessment in time, but we leave these            Each earthquake is given a unique event identifier
issues as a subject for future analysis.                           (OrigID), corresponding to the one assigned by the ISC
                                                                   (if the event is present in the international Bulletin), or
3.1.1   Collection of phase arrival times                          given by a string that contains year, month, day, hour, and
                                                                   minute of first arrival time, in the case of multiple events on
We collected the phase arrival times from the following            the same day. Considering the differences in data format,
sources:                                                           and the reliability of the final solutions, we processed the
                                                                   earthquakes in several time frames, as given in Table 1. Note
 1. The extended list of data from the ISC Bulletin. Each          that the period before 1985 starts with an earthquake re-
    event is represented by a text file that summarizes the        ported by the ISC Bulletin in 1936 (OrigID = 903762, http:
    hypocentral solutions provided by various agencies and         //www.isc.ac.uk/cgi-bin/web-db-v4?event_id=903762&
    the PRIME solution adopted by the bulletin: magni-             out_format=IMS1.0&request=COMPREHENSIVE,                    last
    tude data and the list of stations, phase type, and arrival    access: 10 August 2021; for the bad location of the 31
    times, with additional metadata about the preferred so-        July 1931 earthquake that hit the western side of the Garda
    lution (e.g. distance, azimuth, residual, station magni-       Lake, see https://emidius.mi.ingv.it/CPTI15-DBMI15/event/
    tude).                                                         19360731_1446_000, last access: 10 August 2021) for
                                                                   which no phases are listed. In practice the online dataset
 2. The list of data from the INGV website, as tables of ar-       of arrival times begins with the aftershock of 1951: for the
    rival times for each event (e.g. http:// terremoti.ingv.it/    main event, phase readings have been integrated into this
    event/ EVENTID, last access: 10 August 2021). These            study too (Caloi et al., 1956).
    data are available jointly with the solution provided for         Table 1 summarizes the number of phase arrivals by sta-
    the location, for all the events since 1985, with a uni-       tions, as provided by the various agencies, and the total
    form format but different criteria adopted, for example,       number of events processed, located, and discarded. Note

Solid Earth, 12, 2021–2039, 2021                                                      https://doi.org/10.5194/se-12-2021-2021
L. Peruzza et al.: A revised image of the instrumental seismicity 2029
Figure 7. Power spectral density of continuous seismic signal recorded by a set of stations in the study area. The two panels show the
average of the horizontal components (a) and the vertical component (b), respectively. Thin blue lines: 1 d continuous signal recorded by 13
temporary stations deployed within the ED area in July 2016; thick red line: 1 week of continuous signal recorded in the same period at the
MILN station belonging to the national network managed by INGV. The dark grey lines show the two reference curves known as NHNM
and NLNM by Peterson (1993), used for estimating the quality of the signal recorded by a seismological station.
Table 1. Summary table of the phases/events gathered by four data providers in different time frames. As multiple phase readings for the
same stations are sometimes provided, for example in ISC archives, the number of available arrival times are counted by stations.
< 1985 1985–1990 1991–1995 1996–2000 2001–2005 2006–2010 2011–2019 Total
Phase arrival times (by station)
ISC 810 613 2509 896 1010 1309 2074 9221
INGV 15∗ 176 371 90 19 79 478 1228
UNIGE – 185 544 298 241 327 533 2128
OGS 17 115 54 50 7 231 137 611
Earthquakes
Number of events analysed 35 40 73 35 22 33 67 305
Number of events in ISC Bulletin 34 24 71 29 22 31 55 266
∗ They refer only to the readings provided in Caloi et al. (1956) for the event of 15 May 1951, not given in the ISC archive.
that some phase/station data used by INGV and UNIGE 3.1.2 Relocation of selected events
can be duplicated, and they both are usually provided to the
ISC Bulletin. OGS data are mainly original, as non-located
phases are not provided to the international agency. ISC, Hypocentral location is performed by a standard code used in
collecting data worldwide, is the most represented dataset. regional monitoring analyses, i.e. the software Hypo71 (Lee
The earthquakes not reported in the ISC Bulletin are usu- and Lahr, 1975) that uses simple 1D regional models, with
ally the smallest events. Concerning magnitude, as in this a fixed value of Vp /Vs . The choice of a robust method, al-
study it is needed mainly for representation purposes, we though less sophisticated than other, more recent ones, is mo-
avoided conversion relationships and retained the values as- tivated by the need to accommodate the varying quality of the
signed by the original agencies, selected on priority criteria phase readings collected in more than 50 years and to treat
(MW > MS > ML > MD ). As previously said, the uniform all data using a common location algorithm, thus avoiding
re-assessment of magnitude is a relevant problem that falls artefacts introduced by different relocation procedures. The
outside the schedule of this study, and it will be the focus of complexity of finding robust solutions in an inverse problem,
future efforts. like hypocentral location, is well known in the literature: in
The phase data coming from the various providers have their very recent paper Arrowsmith et al. (2020) state the
been then transformed into a common format, and merged, superiority of global search methods which sample the full
for their uniform processing by the selected location code, model space, using a standard iterative linear least-squares
using a suite of original Bash scripts and Python codes, im- approach, as originally introduced by Geiger in 1912, and
plemented for this study. implemented by Hypo71 and its updated/improved versions.
However, when dealing with datasets derived by the “merge”
of phase readings published by several agencies throughout
many decades, as was the dataset of this study, there are other
https://doi.org/10.5194/se-12-2021-2021 Solid Earth, 12, 2021–2039, 20212030 L. Peruzza et al.: A revised image of the instrumental seismicity
problematic features and uncertainties to deal with, such as the data providers, if assigned, and to set standard values
the following: (0 – full weight for P readings; 1 for S) if not given. The
careful analysis of each solution led to a revision of the
– duplication of readings – phase readings used by vari- weights based mainly on either outliers or readings that
ous agencies may have redundancies, with the same or drive the algorithm to converge towards solutions with
different arrival times; an anomalous root-mean-square (RMS) time residual,
– unknown phase readings or phase readings that are not reckoned by a generalized increase in acceptable resid-
proper; uals (less than 2 s) in most of the stations.
– assessment of uncertainty given to the readings; – Anomalies in phase associations have been found in
very few cases, for cascading events. Sometimes the re-
– differences in the phase association performed by dif- vision of associations led to the analysis of other events
ferent agencies. not selected at first according to the spatial rules.
We decided to face these problems as follows: After the station list and phase arrival dataset, the
last but very important component of hypocentral lo-
– As we have no “a priori” element to establish which are cations is the velocity model. We, therefore, col-
the “best” readings, in the case of multiple arrival times lected a set of 1D models (see Table 2), used at
assigned to the same station/phase, we decided to let the global (IASPEI91; Kenneth and Engdahl, 1991), na-
duplications in. In theory, the duplication of the same tional (INGV RSN1 and RSN2; see https://emidius.
equation in a linear system does not affect its solution; mi.ingv.it/CSTI/Versione1_0/Html/LOC.HTM, last ac-
conversely, slightly different observations may “accom- cess: 10 August 2021, and Marchetti et al., 2020; CSI,
modate” the uncertainty of arrival times that we can- Chiarabba et al., 2005, modified to accommodate the in-
not verify on the original seismograms/time series. The version in velocity profile not allowed by the location
evaluation of relevant discrepancies among data given code), and regional scale (UNIGE, Spallarossa et al.,
for the same station is done by checking the printout 2014, adopted for a study in north-western Italy, then
of the locations, thus assigning different weights (e.g. further simplified and modified to accomplish the large
4, which means discard the reading, or 9, which uses interstation distance of our dataset; OGS, Bressan et al.,
the difference of arrival time of P and S phases only) 2003, used in north-eastern Italy). We selected the so-
to the high residuals (more than 2 s for P phases, 4 s lutions obtained by the model that provides the mini-
for S phases). We thus consider the resulting statisti- mum time residuals (in bold in Table 2) for the final
cal errors a relative measure of the goodness of the so- map and profiles given in Figs. 8 and 9, acknowledging
lutions within a uniformly processed dataset and not a the huge variability in location parameters (mainly the
physical reference for the point source approximation of value of depth) that results from the different velocity
the hypocentre. The literature on these subjects is wide- models, coupled with non-optimal station distribution
ranging (see for example Husen and Hardebeck, 2010; and large uncertainties in phase pickings. Note that the
Arrowsmith et al., 2020) and some additional comments selected model (no. 4 in Table 2) puts the Moho inter-
will be given in the final sections. face at 39.5 km, a value that is a reasonable average of
lateral strongly variable depths sampled by teleseismic
– Phase types are often not explicitly indicated by the data
waves in Kind et al. (2021). Additional comments will
providers (it happens mainly in the ISC dataset and for
be given in the results.
the last decades only); we decided to exclude distant sta-
tions (at distances larger than 400 km, after some sensi-
tivity tests) and improper phase readings if explicitly la- 3.2 The Milan earthquake of 17 December 2020
belled (e.g. Pn, Pg, P∗ ), and to retain unknown phase
types as alternative arrival times, as previously men- On 17 December 2020 at 15:59:22 UTC an earthquake oc-
tioned. The removal of data is driven by an “a posteri- curred near Milan, right while we were writing this paper.
ori” check on the residuals of the theoretical travel times The Italian agencies INGV, UNIGE, and OGS notified it in
and giving priority to the proprietary data (i.e. readings nearly real time on their institutional channels and social
for the stations managed by the agency). media, as a deep event; the revised hypocentral determina-
tion given by INGV and UNIGE (http://terremoti.ingv.it/ and
– It is not possible to assign a weight to the picking http://www.distav.unige.it/rsni, last access: 10 March 2021)
without checking the original seismogram. It was com- assigned a local magnitude ML 3.8 and 4.2, and hypocentral
mon practice in the past to assign the weight without depth of 55 and 49.6 km, respectively. The event was widely
declaring the assessment criteria, and mainly referring felt in the Milan province, and somehow it surprised the pop-
to the residuals on theoretical travel times. We decided ulation, convinced they were living in an aseismic area. No
to adopt in the first runs the weighting codes given by focal mechanism has been released by any Italian or foreign
Solid Earth, 12, 2021–2039, 2021 https://doi.org/10.5194/se-12-2021-2021L. Peruzza et al.: A revised image of the instrumental seismicity 2031
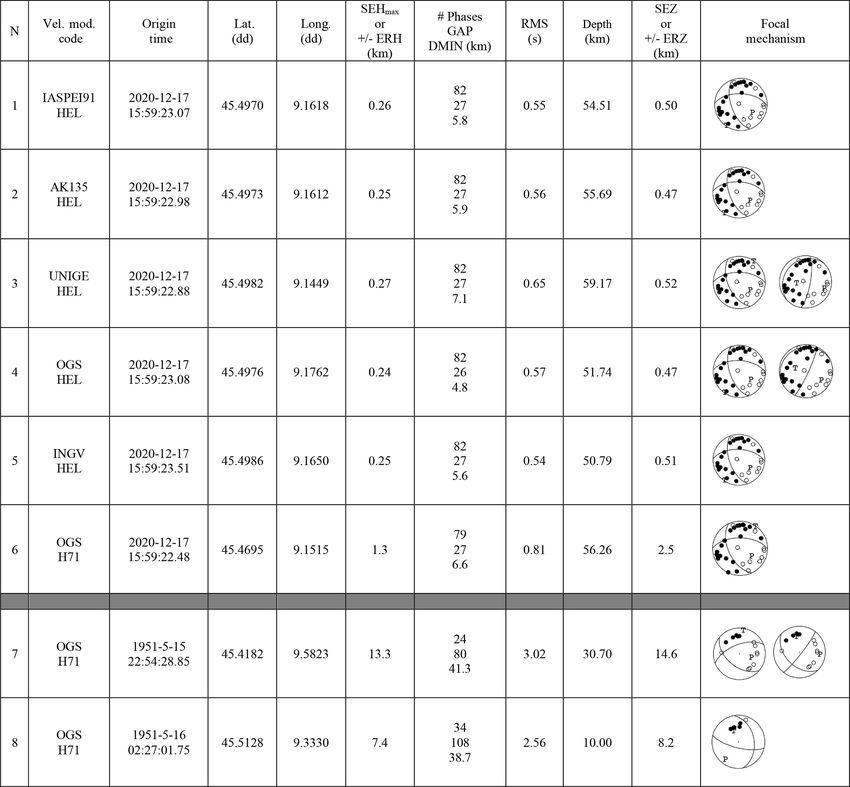
Table 2. Summary table of the velocity models tested in this study. The results in Figs. 8 and 9 are obtained with the model that minimizes
time residuals.
N Model code Vp1/Dep1 Vp2/Dep2 Vp3/Dep3 Vp4/Dep4 Vp5/Dep5 Vp /Vs RMS DEPTH
Vp6/Dep6 (mean)
Vp7/Dep7 (mean)
1 IASPEI91 5.8/20 6.5/35 8.05/∼ – – 1.73 1.210 16.5
2a UNIGE 4.6/4 6.0/10 6.1/15 6.3/25 6.5/30 1.68 1.357 11.0
2b modified 7.5/36 1.73 13.7
2c modified2 8.1/∼ 1.78 1.235 17.6
1.233
3a UNIGE Simpl. 5.8/25 6.5/30 7.5/36 8.1/∼ – 1.68 1.338 13.5
3b Simpl. modified 1.78 18.4
1.203
4 OGS 5.85/22 6.8/39.5 8.0/∼ – – 1.78 1.188 21.6
5 INGV RSN1 5.0/10 6.0/30 8.1/∼ – – 1.73 1.236 12.9
6 INGV RSN2 5.0/11.1 6.5/26.9 8.05/∼ – – 1.77 1.265 12.0
7 INGV CSI Mod. 5.1/3 5.7/6 6.2/20 6.3/34 7.7/50 1.80 1.258 24.2
8.0/∼
agencies up to now. Since the event occurred right within hypocentral solution given as 4 in Table 3, to be coherent and
our study area, we decided to pick manually the arrival times uniform with the relocated earthquake catalogue.
and first polarities on available waveforms, to compare this We then calculated the fault-plane solution based on first-
earthquake with the results of our analysis. We selected the arrival polarities, by using the classical code by Reasenberg
seismic stations within the cross-over distance for the area and Oppenheimer (1985). All the focal mechanisms obtained
(130 km according to Spallarossa et al., 2014) from the best are represented in Table 3: note the irrelevant changes in the
epicentre published by INGV, to be sure to pick only di- plane orientation due to the differences in hypocentral lo-
rect arrivals of P and S waves. The selected stations (45) cation. Note also that the solutions obtained with the same
belong to different networks from international to regional model (OGS, no. 4 and 6) are invariant to the location code.
scale and are equipped with seismometers or acceleromet- A transtensive mechanism on NNW–SSE-to-E–W-oriented
ric sensors. We picked 45 P (with 31 polarities) and 37 S structures is common to all the models: in two models (no. 3
arrival times, weighted according to the following scheme: and 4 in Table 3) an alternative compressive solution is given
code 0 for uncertainty in picked time Upt ≤ 0.1 s; code 1 for too, on a low-angle thrust fault dipping to NW, or a nearly
0.1 < Upt ≤ 0.5 s; code 2 for 0.5 < Upt ≤ 1.0 s; code 3 for vertical N–S-oriented fault. For the preferred solution, the
1.0 < Upt ≤ 2.0 s; code 4 for Upt > 2.0 s, not used in the lo- station distribution ratio (STDR) is always > 0.63, suggest-
cation process. ing a well-constrained result. We recognize that the data col-
We used both Hypo71 and Hypoellipse (Lahr, 1999) to lo- lected in this study do not allow us to overcome this uncer-
cate the Milan earthquake, as the latter allows us to take into tainty and a moment tensor analysis might be useful to obtain
account the station elevation and to use velocity models fea- more robust solutions.
turing Vp /Vs variable with depth, or velocity inversions.
We performed location tests using different velocity mod-
els: four models are the ones already described in Sect. 3.1.2, 4 Results
the fifth one is the well-known AK135 model (Kennet et al.,
1995) used by Caciagli et al. (2015). Figures 8 and 9 show the map and cross sections of the fi-
Table 3 lists the hypocentral parameters obtained for each nal relocated catalogue of earthquakes, for the period 1951–
location. The main difference is the hypocentral depth that 2019. For Fig. 5, there is a generalized increase in the depth
ranges from 50.8 to 59.2 km, while all the other parameters of events, and more concentrated patterns of earthquakes;
are similar: no “best location” can be defined, in our opin- some M > 3 earthquakes appear due to the extension of the
ion, based on statistical residuals. Therefore, we adopted the time interval represented before 1980, with the inclusion of
the two strongest earthquakes of the 20th century (the Cavi-
aga earthquakes in 1951). Several events, mainly during the
https://doi.org/10.5194/se-12-2021-2021 Solid Earth, 12, 2021–2039, 20212032 L. Peruzza et al.: A revised image of the instrumental seismicity Figure 8. Relocated earthquake catalogue for the study area, for the period 1951–2019. The black arrow and label show the location of the 17 December 2020 Milan earthquake, relocated in this study too and corresponding to the solution given by model 4 in Table 3. Main panel: epicentral map of events that fall approximately in the target area (white frame); inset: events discarded as probable fake locations. The 30 km distance from the reservoir is marked by a black dashed circle; the main buried faults are taken from Pieri and Groppi (1981). White crossed circles represent earthquakes with large standard errors in location (horizontal error ERH > 5 km or vertical error ERZ > 10 km). early instrumental period, i.e. before the 1990s, have rele- tified by national or regional agencies: it is a first warning vant standard errors (mapped with white, crossed symbols if on the uncritical utilization of earthquake catalogues in low- they have ERH > 5 and ERZ > 10 km). According to the co- seismicity and badly monitored areas. Then, we removed the ordinates obtained, 197 events fall inside the TA; many of earthquakes with DMIN > 70 km, adopting a threshold that them shift toward the lower border of the plot area or are out- corresponds to the 95 percentile of DMIN distances for the side of the figure. At least a dozen of events inside the TA events in the target area: the remaining earthquakes are plot- can still be considered fake locations, due to improper min- ted in the cross sections of Figs. 9 and 10. imum search, as happens when the hypocentral coordinates The distribution of relocated earthquakes now shows a move far away from the stations that recorded the event. The more evident separation between the Apennines and Alpine earthquakes represented in the inset, for example, are likely domains. Earthquakes are in general deeper than in the events that occurred in Switzerland or France, as suggested composite catalogue (Fig. 5), especially towards the Apen- by their first-arrival phase data. They have been identified nines: if the “absolute” depths are confirmed by further stud- considering their horizontal and vertical standard errors but ies, many earthquakes can be assigned to the lower crust also using of the minimum distance of the first recording sta- (> 15 km depth). For the main event of 1951, we acknowl- tion (DMIN), a parameter that usually is not taken into ac- edge the consistency of our location with one of the two so- count in the quality analyses, or it cannot be taken into ac- lutions obtained by Caciagli et al. (2015), even if the param- count when the catalogues do not report the full solution pa- eters and algorithms used are different. In our study, in par- rameters. These considerations explain why in the compos- ticular, phase readings were taken from the original paper of ite catalogue (Fig. 5) we found at least two events not iden- Caloi not included up to now in the ISC database; our re- Solid Earth, 12, 2021–2039, 2021 https://doi.org/10.5194/se-12-2021-2021
L. Peruzza et al.: A revised image of the instrumental seismicity                                                                    2033

Table 3. (1–6) Hypocentral parameters of the 17 December 2020 Milan earthquake based on different velocity models and location codes;
(7–8) hypocentral parameters of the two 1951 Caviaga events. SEHmax /SEZ: (maximum) horizontal and vertical single 68 % confidence
estimates referred to hypocentral locations performed by Hypoellipse; ERH/ERZ: statistical horizontal and vertical location errors provided
by Hypo71; DMIN: epicentral distance of the nearest station. In the last column, multiple solutions of focal mechanisms are reported if
existing.

location uses a regional model rather than a global model;              solution is similar to the mechanisms already published (e.g.
we retain only stations up to 400 km distance, discarding the           Martelli et al., 2016), but an alternative, statistically prefer-
worldwide stations used by Caciagli and co-authors, and use             able, extensional mechanism is suggested, on NW–SE-to-
regional relocation code (Hypo71) instead of global ones.               WSW–ENE-oriented fault planes with a moderately dipping
Our relocation of the aftershock of 16 May 1951 is orthog-              angle. Note, however, that the retrieved focal mechanisms do
onal to the NE–SW line obtained by the two solutions pro-               not help to fix the uncertainty in aftershock location and fault
posed by Caciagli et al. (2015) for this event; we think that           identification, or to associate the events with any of the seis-
the quality of the aftershock hypocentral solution is lower             mogenic sources identified in the literature until now. The
than the main event, despite the better statistical errors (see         15 May 1951 mechanisms, although not well constrained,
Table 3). The focal mechanism, obtained from the first po-              have common elements with the 2020 ones, i.e. a comparable
larity data in this study (Table 3), shows multiple or poorly           unusual depth, the same ambiguity between two contrasting
constrained solutions: for the main event, the compressive              solutions (transtensive vs. transpressive mechanism), and the

https://doi.org/10.5194/se-12-2021-2021                                                             Solid Earth, 12, 2021–2039, 2021
2034                                                            L. Peruzza et al.: A revised image of the instrumental seismicity

Figure 9. Vertical cross sections of the relocated earthquake catalogue. (a) SW–NE cross section (AA’ in Fig. 8) in which earthquakes within
a 30 km thick stripe centred on the trace line are projected; (b) NW–SE cross section (BB’ in Fig. 8), transversal to (a), with the same
thickness. The reservoir is indicated by the arrow; the OD and ED domains are represented by black-dashed-line and blue-line half-circles,
respectively. White crossed circles represent earthquakes with large standard errors in location (horizontal error ERH > 5 km, or vertical
error ERZ > 10 km): error bars represent the statistical standard errors as defined in Hypo71. The multiple solutions of focal mechanisms
obtained by first-motion polarity, and projected on the section planes, are the ones given in Table 3 for the events of 15 May 1951 (row 7)
and 17 December 2020 (row 4), respectively. Other details as in Fig. 8.

maximum stress σ 1 axis orientation (indicated by P in the              events that have DMIN < 70 km are plotted in the double-
plots in Table 3). Surprisingly, the σ 1 is compatible with a           Y graph of Fig. 10, where the blue dots represent the
NW migration of Adria plate, more than to the NNE–SSW-                  hypocentre-to-reservoir distance (left axis), and red crosses
oriented convergence of the Alpine and Apennine systems.                the magnitude assigned by the origin agency, both plot-
As proposed for the eastern Southern Alps (Caputo et al.,               ted versus time. Only two events are located within the
2010) this may suggest the presence of a low-angle decou-               15 km distance (Fig. 9), i.e. the M2.7 earthquake of 2 Febru-
pling level at an intermediate depth. These very preliminary            ary 2002, and M3.0 earthquake of 24 December 1996: al-
considerations have to be confirmed by further analyses (e.g.           though their location features small standard errors, in both
full moment tensor, reflected and converted phase modelling             the cases the relevant distance from the first recording sta-
at the Moho) that could probably help to constrain the rupture          tion (DMIN approximately 53 and 60 km) makes the relia-
location and reduce the uncertainties.                                  bility of the estimated depth still poor. Another event is lo-
   Very few earthquakes are located within 30 km distance               cated nearby, that is the M2.7 earthquake that occurred on
of the reservoir (dashed black circles in Figs. 8 and 9). The

Solid Earth, 12, 2021–2039, 2021                                                             https://doi.org/10.5194/se-12-2021-2021
L. Peruzza et al.: A revised image of the instrumental seismicity                                                              2035

                                                                         The collection of instrumental data allowed us to iden-
                                                                      tify more than 300 earthquakes from 1951 to 2019 (Fig. 5).
                                                                      Through their re-processing, we have located nearly 200
                                                                      events within a target area (white rectangle in Fig. 8) defined
                                                                      around the Cornegliano Laudense gas storage. The hypocen-
                                                                      tral solutions are obtained with a standard absolute location
                                                                      method that, even if non-optimal, is a suitable choice to per-
                                                                      form uniform processing for the whole period. Depths are
                                                                      influenced by the velocity model: the one we adopted for the
                                                                      final representation leads to the best statistical performances
                                                                      and depths that are compatible with the ones obtained by
                                                                      other recent analyses and in agreement with the results ob-
                                                                      tained for the very last earthquake that occurred in 2020.
                                                                      The location errors are relevant for the early instrumental pe-
                                                                      riod and decrease in the most recent years. While we recall
                                                                      that the statistical error cannot be considered a physical mea-
                                                                      sure of hypocentral uncertainty, we underline that, in com-
Figure 10. Magnitude–distance plot of relocated events versus time.   bination with a careful analysis of each event, and other so-
Blue bullets: hypocentre-to-reservoir distance (only events within    lution parameters (e.g. the minimum event-station distance,
35 km distance are shown); red crosses: magnitude. Events with        DMIN), they help detect fake locations and permit a compar-
undefined magnitude are represented at magnitude equal to zero        ative evaluation of the hypocentral solutions.
(whole dataset).                                                         This study also shows that the detection capability in
                                                                      Northern Italy increased after the 1976 Friuli earthquakes,
                                                                      and then in the early 80s, mainly because of the improvement
25 March 1983, at about 17 km distance from the reservoir             of the regional networks; a second improvement consisting
(DMIN = 33 km).                                                       of a decrease in minimum magnitude threshold is observed
   Note in Fig. 10 the decrease in the minimum magnitude              in 2008–2010, probably due to the growth of the national net-
threshold versus time, which corresponds to an increase in            works that followed the 2009 L’Aquila earthquake. As we did
the network sensitivity, and the lack of magnitude data for           not check the magnitude assessment, however, these data are
some events. We consider this picture a useful representa-            not uniform: no conclusive remarks can be drawn on com-
tion of the weak level of seismicity that characterizes the           pleteness magnitude versus time.
area near Lodi, as it (1) helps in driving the future investiga-         The seismicity in this sector of the Po Plain, where the
tions towards individual earthquakes, or specific sequences;          Northern Apennines and the Southern Alps collide below a
(2) permits a 4D representation of the volumes surroundings           thick sedimentary cover, is weak and deep. This picture is
the investigated site and is useful for comparison purposes           quite clear, although the area is not monitored with quality
too; and (3) provides a visual perception of the complete-            comparable to that of the adjacent regions. With regard to
ness magnitude, as a statistical treatment cannot be applied          the Lodi area, and in particular, to the outer domain (30 km
to such a small sample that is not uniform.                           distance; see Fig. 2) of the Cornegliano Laudense storage,
   This study adds some new pieces of information to the              the earthquakes identified in the last decades are extremely
knowledge of the seismicity of the Po Plain area around the           rare (on average 0.5 earthquakes per year, if we assume a
Lodi town; however, we think that only an improvement of              completeness magnitude Mc ∼ 2.7, from the 1980s). In the
the existing observational capability will allow us to interpret      whole period 1951–2019, only two events fell within the
which lithospheric structures are responsible for the earth-          volume with a radius of 15 km from the reservoir (external
quakes, both past and present, in the Lodi area. The new              domain); the reliability of their hypocentral location can be
seismic monitoring network that has been recently accom-              further investigated by alternative location methods, given
plished for the Cornegliano Laudense UGS will surely con-             the limitations of the available recordings. The first instru-
tribute significantly to that purpose.                                mentally sufficiently recorded events are related to the seis-
                                                                      mic sequence of Caviaga, in 1951; they also represent the
                                                                      strongest events that occurred in the area. Our study con-
5   Conclusions                                                       firms the elevated depth and large distance of these events
                                                                      from the Cornegliano Laudense reservoir, as already pro-
The uncritical use of existing earthquake catalogues can              posed by Caciagli et al. (2015). We further suggest a sim-
lead to biased representations of the seismicity, especially in       ilarity between the focal mechanisms of the M5.4 earth-
weakly seismic or poorly monitored areas. This is the case            quake of 15 May 1951, and the M4.2 earthquake of 17 De-
for the Lodi area, in the central sector of the Po Valley.            cember 2020, which occurred near Milan. Some hints about

https://doi.org/10.5194/se-12-2021-2021                                                         Solid Earth, 12, 2021–2039, 2021
You can also read