Shear wave reflection seismic yields subsurface dissolution and subrosion patterns: application to the Ghor Al-Haditha sinkhole site, Dead Sea ...
←
→
Page content transcription
If your browser does not render page correctly, please read the page content below
Solid Earth, 9, 1079–1098, 2018
https://doi.org/10.5194/se-9-1079-2018
© Author(s) 2018. This work is distributed under
the Creative Commons Attribution 4.0 License.

Shear wave reflection seismic yields subsurface dissolution
and subrosion patterns: application to the Ghor
Al-Haditha sinkhole site, Dead Sea, Jordan
Ulrich Polom1 , Hussam Alrshdan2 , Djamil Al-Halbouni3 , Eoghan P. Holohan4 , Torsten Dahm3,7 , Ali Sawarieh2 ,
Mohamad Y. Atallah5 , and Charlotte M. Krawczyk3,6
1 Section1, Leibniz Institute for Applied Geophysics (LIAG), Stilleweg 2, 30655 Hanover, Germany
2 Geological Directorate, Ministry of Energy and Mineral Resources (MEMR), P.O. Box 7 code 11118, Amman, Jordan
3 Department 2, GFZ German Research Centre for Geosciences, Telegrafenberg, 14473 Potsdam, Germany
4 UCD School of Earth Sciences, University College Dublin, Dublin 4, Ireland
5 Yarmouk University 21173, Department of Geological and Environmental Science, Irbid, Jordan
6 Technische Universität Berlin, Institute of Applied Geosciences, Ernst-Reuter-Platz 1, 10587 Berlin, Germany
7 University of Potsdam, Institute of Earth and Environmental Sciences, 14476 Potsdam, Germany

Correspondence: Ulrich Polom (ulrich.polom@liag-hannover.de)

Received: 8 March 2018 – Discussion started: 25 April 2018
Revised: 26 July 2018 – Accepted: 21 August 2018 – Published: 21 September 2018

Abstract. Near-surface geophysical imaging of alluvial fan        flection amplitudes and velocities image with good continu-
settings is a challenging task but crucial for understating ge-   ity a complex interlocking of alluvial fan deposits and lacus-
ological processes in such settings. The alluvial fan of Ghor     trine sediments of the Dead Sea between 0 and 200 m depth.
Al-Haditha at the southeast shore of the Dead Sea is strongly     Furthermore, the underground section of areas affected by
affected by localized subsidence and destructive sinkhole         sinkholes is characterized by highly scattering wave fields
collapses, with a significantly increasing sinkhole formation     and reduced seismic interval velocities. We propose that the
rate since ca. 1983. A similar increase is observed also on       Dead Sea mud layers, which comprise distributed inclusions
the western shore of the Dead Sea, in correlation with an         or lenses of evaporitic chloride, sulfate, and carbonate min-
ongoing decline in the Dead Sea level. Since different struc-     erals as well as clay silicates, become increasingly exposed
tural models of the upper 50 m of the alluvial fan and varying    to unsaturated water as the sea level declines and are conse-
hypothetical sinkhole processes have been suggested for the       quently destabilized and mobilized by both dissolution and
Ghor Al-Haditha area in the past, this study aimed to clarify     physical erosion in the subsurface. This new interpretation
the subsurface characteristics responsible for sinkhole devel-    of the underlying cause of sinkhole development is supported
opment.                                                           by surface observations in nearby channel systems. Overall,
   For this purpose, high-frequency shear wave reflection vi-     this study shows that shear wave seismic reflection technique
bratory seismic surveys were carried out in the Ghor Al-          is a promising method for enhanced near-surface imaging in
Haditha area along several crossing and parallel profiles with    such challenging alluvial fan settings.
a total length of 1.8 and 2.1 km in 2013 and 2014, respec-
tively. The sedimentary architecture of the alluvial fan at
Ghor Al-Haditha is resolved down to a depth of nearly 200 m
at a high resolution and is calibrated with the stratigraphic     1   Introduction
profiles of two boreholes located inside the survey area.
   The most surprising result of the survey is the absence of     Since around 1980 until today, thousands of sinkholes have
evidence of a thick (> 2–10 m) compacted salt layer formerly      affected specific areas along the Dead Sea shoreline (Yechieli
suggested to lie at ca. 35–40 m depth. Instead, seismic re-       et al., 2006; Shalev et al., 2006; Abelson et al., 2017), appar-

Published by Copernicus Publications on behalf of the European Geosciences Union.
1080                                                        U. Polom et al.: Application to the Ghor Al-Haditha sinkhole site

ently contemporaneous with the rapid decrease in the Dead          at Ghor Al-Haditha and thereby contributes to reappraising
Sea level (Sawarieh and Alrshdan, 2011). The sinkhole pro-         the different models suggested above. We further show that
cesses continuously disrupt farming areas, houses, industrial      shear wave reflection seismics have advantages for study-
sites, and infrastructure and, therefore, hamper the future        ing highly porous, partly saturated alluvial fans with com-
economic development of the whole region. Geological and           plex compositions, e.g. compared to P-wave reflection and
geophysical sinkhole studies started already in the 1990s at       refraction, which is partly controlled by the pore fluids, and
both the western (e.g. Wachs et al., 2000) and eastern (El-Isa     multi-channel analysis of surface wave (MASW), which is
et al., 1995) shorelines of the Dead Sea. An early map of the      only valid in a 1-D layer case. A particular methodological
main sinkhole sites was published by Yechieli et al. (2002).       question of interest is to what extent shear wave seismics can
The sinkholes typically appear in clusters on either alluvial      be used to identify dissolution processes at depth and early
fans or mudflats. Arkin and Gilat (2000) defined two differ-       stages of collapse sinkholes.
ent classes of sinkholes: (a) gravel holes on alluvial fans that
consist of highly permeable gravel and sand layers including
some silt, clay, and evaporites and (b) mud holes on Dead Sea      2   Site of investigation
mudflats that consist of very fine marl, silt, clay, and evapor-
itic minerals like aragonite, gypsum, and halite.                  Ghor Al-Haditha is a small village at the southeastern end
   An early hypothesis postulated that clay softening, lique-      of the Dead Sea in the province Al Karak of the Hashemite
faction, and mobilization in the subsurface, due to the dilu-      Kingdom of Jordan (Fig. 1a and b). It is located within the
tion of former highly salty porewater by freshwater inflows,       Dead Sea pull-apart basin close to the outlet of the Wadi Ibn
generates the sinkholes (Arkin and Gilat, 2000). As discussed      Hammad valley. Sediments transported down the Wadi Ibn
by Ezersky and Frumkin (2013), two other factors may con-          Hammad and the neighbouring Wadi Mutayl have formed a
trol the location of the sinkholes at the Dead Sea: (1) the        connected alluvial sediment plain, which is in contact with
presence of a thick, massive salt layer that is exposed to a       the border of the Dead Sea. The alluvial plain (current el-
dissolution front at its edge and (2) the presence of subsur-      evation nearly − 360 to −380 m) was formerly located at
face faults that control freshwater inflow into, and thus enable   the bottom of the Dead Sea and has been dry land since an
dissolution of, a salt layer. Such controls were suggested on      unknown time. It is now mainly used for market gardening
the basis of a variety of methodical approaches (e.g. Yechieli     and, for the irrigation of the plants, water flowing from Wadi
et al., 2002; Diabat, 2005; Closson, 2005; Abelson et al.,         Ibn Hammad and surrounding springs is stored in some man-
2006, 2009; Frydman et al., 2008; Closson and Abou Karaki,         made pools in the area.
2009; Ezersky, 2006; Ezersky and Livne, 2013; Ezersky et              Khalil (1992) published the geological information of the
al., 2010, 2013c, 2017).                                           area (geologic map sheet Ar Rabbah at 1 : 50 000 scale).
   Although many geophysical studies have been carried out         The bedrock underlying the alluvial plain is not exposed,
at the Ghor Al-Haditha sinkhole site (Fig. 1a) in the past         but on structural grounds it probably comprises limestone
24 years, the subsurface structure and the subsurface ero-         (some dolomitic or silicified), marl, chalk, and phosporite of
sion (subrosion) processes are still rather uncertain. Since the   the Ajun and Belqa groups of Late Cretaceous (Turonian–
year 2000, several authors have proposed that a several metre      Campanian) age and possibly also sandstones of the Ram and
thick, massive salt layer lies at a top depth of 35–40 m b.g.s.    Kurnub groups of Cambrian and Early Cretaceous ages. The
at the site, underneath the alluvial fan deposits (Taqieddin et    depth to bedrock under the alluvial fan is unknown. West of
al., 2000; Legchenko et al., 2008; Frumkin et al., 2011; Ez-       Ghor Al-Haditha, the Lisan peninsula rises in the Dead Sea
ersky et al., 2013 a, b, c, 2017; Ezersky and Frumkin, 2013;       and uplifts at a rate of nearly 9 mm yr−1 by salt diapirism
Ezersky and Livne, 2013). In this shallow salt layer model,        related to an underlying Usdom evaporate formation of Plio-
chemical erosion (dissolution) of this salt layer by fresh wa-     Pleistocene age (Taquieddin et al., 2000; Fiaschi et al., 2017).
ter flow from the eastern mountain range is supposed to gen-       The alluvial plain consists of semi-consolidated sands and
erate initial cavities in the subsurface, which subsequently       gravels, interbedded with layers of silt, clay, and marl (El-
move upwards due to the continuous solution or collapse            Isa et al., 1995; Sawarieh et al., 2000), all of which are con-
of material at the cavity top, up to the final collapse of the     sidered part of the lacustrine Lisan Marl Formation of Late
ground surface. In contrast, Al-Halbouni et al. (2017) pre-        Pleistocene age. This sedimentation mixture was also ob-
sented an alternative conceptual model for Ghor Al-Haditha,        served during the survey in shallow outcrops of 1–2 m depth
based on photogrammetric surveying, historic satellite image       along new water pipeline constructions in the whole area and
analysis, and field observations. They propose both chemical       at the flanks of up to 20 m deep young sinkholes. The al-
and physical subrosion of weak material, which consists both       luvial plain also comprises younger, unconsolidated alluvial
of mudflat (including evaporite lenses) and alluvial fan sedi-     gravels and sands, especially around the modern wadi out-
ments.                                                             lets. Together with the interbedded marl, evaporites, silt, and
   Our reflection seismic study resolves for the first time the    clay layers exposed in the adjacent mudflat (former Dead
fine structure of subsurface layers with a high resolution         Sea bed), these younger semi-poorly consolidated materials

Solid Earth, 9, 1079–1098, 2018                                                                www.solid-earth.net/9/1079/2018/
U. Polom et al.: Application to the Ghor Al-Haditha sinkhole site                                                                       1081

Figure 1. (a) Generalized map of the Dead Sea area. Except for the site Ghor Al-Haditha at the eastern border, which is the focus of this
paper, most sinkhole sites are located along the western shoreline of the Dead Sea (see, e.g., Yechieli et al., 2002). (b) Detailed map of the
Ghor Al-Haditha sinkhole site and previous refraction seismic (El-Isa et al., 1995; Sawarieh et al., 2000) and MASW (Bodet et al., 2010)
profiling. Boreholes BH1 and BH2 are reported in detail by El-Isa et al. (1995); two other boreholes are reported by Bodet et al. (2010)
without any further information. Background is a Pleiades satellite image from 2015 combined with an aerial orthophoto mosaic from 2016.

likely correspond to the Ze’elim Formation of Holocene age               2017). The above-mentioned boreholes, the reported depths
(Abou Karaki et al., 2016)                                               of which vary from one paper to another, are used to support
                                                                         this finding, although no detailed descriptions of the bore-
2.1   Borehole information                                               holes, no details about the drilling method used, and no litho-
                                                                         logic bars are provided. Because the indication of possible
                                                                         massive salt layers is important for comparison with our re-
Two boreholes (BH1 and BH2) were drilled at the Ghor
                                                                         sults, we point out these inconsistencies here.
Al-Haditha investigation site in January–February of 1995
(Fig. 1b), and the drillings and sample analyses were firstly
described in a report of El-Isa et al. (1995). Bodet et                  2.2    Previous geophysical surveys
al. (2010) reported two additional boreholes (Fig. 1b) from
2006 but without further descriptions, and they are not men-             Numerous unpublished studies were carried out in the Ghor
tioned in other reports and publications. Figure 2 shows the             Al-Haditha area by the Ministry of Energy and Mineral
borehole lithology of BH1 and BH2 based on a detailed mi-                Resources (MEMR), Jordan (until 2014 the Natural Re-
croscopic analysis of cuttings (El-Isa et al., 1995). There, the         sources Authority, NRA) subsequent to the first occurrence
lithology is described as an alternating sequence of sand and            of the sinkholes (Ali Sawarieh, personal communication,
gravel, with a “silt and clay” bed at the bottom down to 51              2013). Early refraction seismic experiments that used stan-
and 45 m depth. Nothing is mentioned about a massive salt                dard compression wave (P-wave) techniques were conducted
layer.                                                                   in August–December 1994 by the University of Jordan (El-
   Several papers have subsequently presented lithologic                 Isa et al., 1995; blue lines in Fig. 1b), combined with first hy-
cross sections for the Ghor Al-Haditha sinkhole area, in                 drology and other geophysical studies. The equipment used
which a thick (> 2–10 m) pure salt layer is postulated to lie at         is only poorly documented; the seismic source was a 7 kg
between 30 and 45 m depth below the surface (e.g. Taqieddin              sledgehammer. Then, hydrology and hydrochemistry work
et al., 2000; Frumkin et al., 2011; Ezersky et al., 2013a, b, c,         was accompanied by extended seismic refraction (orange

www.solid-earth.net/9/1079/2018/                                                                        Solid Earth, 9, 1079–1098, 2018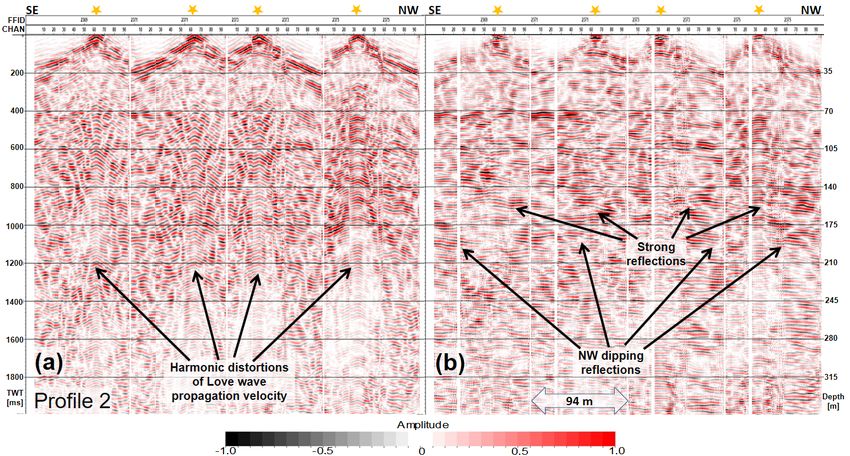
1082                                                            U. Polom et al.: Application to the Ghor Al-Haditha sinkhole site

                                                                          Soon after the 1999 surveys, Batayneh et al. (2002) ap-
                                                                       plied GPR to assess the potential of sinkholes of the Ghor Al-
                                                                       Haditha area and to determine the location of the filled sink-
                                                                       hole features within relatively dense and more resistive ma-
                                                                       terials. Barjous et al. (2004) carried out a FDEM (frequency
                                                                       domain electromagnetic) survey, supplemented by direct cur-
                                                                       rent (DC) resistivity methods (Wenner and dipole–dipole ar-
                                                                       rays), and conventional geological mapping techniques. Dur-
                                                                       ing this work a systematic electromagnetic (EM) survey was
                                                                       applied on the Wadi Ibn Hammad alluvial fan.
                                                                          More recent investigations carried out between 2005 and
                                                                       2008 used a multi-method approach of transient electromag-
                                                                       netic (TEM) sounding, magnetic resonance sounding (MRS),
                                                                       GPR, and electric resistivity tomography (ERT) (Camer-
                                                                       lynck et al., 2012). In 2007, these also included a seismic
                                                                       survey along four profiles targeted at combined reflection,
                                                                       refraction tomography, and MASW data analysis (e.g. Dhe-
                                                                       maied, 2007; Bodet et al., 2010; Keydar et al., 2011; Ezer-
                                                                       sky et al., 2013a, magenta lines in Fig. 1b). For this seis-
                                                                       mic survey, a Geometrics recorder with a 24-channel geo-
                                                                       phone (4.5 Hz resonant frequency) spread at 5 m intervals
                                                                       and a sledgehammer source (mass not reported) was utilized.
                                                                       MASW results are published in Bodet et al. (2010) (profile
                                                                       3) and Keydar et al. (2011) (profiles 3 and 4). MASW results
                                                                       and interpretations of profiles 3 and 4 are published in Ez-
                                                                       ersky et al. (2013b, 2017) and Ezersky and Frumkin (2013).
                                                                       The limit of reliable depth penetration was reported as 60 m
                                                                       (maximum half-space depth), following the empirical for-
                                                                       mula Zmax = 0.5 L of Park et al. (1999) and Rix and Leip-
Figure 2. Lithologic columns of the boreholes BH1 and BH2 from
                                                                       ski (1991), where L is the total source–receiver spread length
microscopic analyses, referenced to their surface elevation (black
                                                                       of 120 m. Results of profile 3 (magenta line 3 in Fig. 1b)
and white columns are the original columns of El-Isa et al., 1995).
The coloured, generalized columns are used for the figures of this     show shear wave velocities of mainly less than 400 ms−1
paper. The main dip tendencies of the units toward the west are vis-   from the surface to Zmax , while profile 4 (magenta line 4 in
ible by the green connecting lines. The annotated borehole depths      Fig. 1b) images a high-velocity layer of more than 800 ms−1
below the columns follow the text in El-Isa et al. (1995).             from nearly 30 m depth to Zmax , which was interpreted as
                                                                       the shallow salt layer. A reflection seismic analysis result of
                                                                       profile 4 in Ezersky and Frumkin (2013) shows no reflection
                                                                       response of the proposed shallow salt layer, however. Refrac-
lines in Fig. 1b) and ground penetration radar (GPR) sur-              tion tomography analysis results are reported to be of insuf-
veys in February 1999 (Sawarieh et al., 2000; Abueladas and            ficient resolution (Camerlynck et al., 2012) and are later on
Al-Zoubi, 2004). Seismic equipment was a 350 kg weight                 shortly mentioned in Ezersky et al. (2017) only.
drop source and a Bison Geopro 8024 24-channel recorder                   Three further MEMR geophysical surveys undertaken in
(10 m geophone interval). The refraction seismic surveys in-           2009 and 2010 with GPR, ERT, and time–domain electro-
dicated that the thickness of the alluvial deposits was more           magnetic (TDEM) with NanoTEM technique provide the
than 70 m, that there was a possible salt intrusion body be-           most recent information about the sinkhole area in Ghor Al-
low (at least 70 m deep) at one profile location (profile 5            Haditha (Alrshdan, 2012). These newer results depict ge-
of Sawarieh et al., 2000; Fig. 1b), and that there were also           ological and groundwater conditions, the salt-to-freshwater
sinkhole-causing cavities at a relatively shallow depth (less          interface, and the limits of safe and vulnerable zones. Alr-
than 20 m). Except for the one location suspected of having a          shdan (2012) also discusses the mechanism of sinkhole for-
salt intrusion body, the seismic velocity of the deepest refrac-       mation suggesting that the freshwater inflow acts as the ma-
tor below 40–50 m depth was reported to vary from 2245 to              jor player, which dissolves cementing evaporite minerals and
3300 ms−1 in all profiles, and seismic velocities above this           the fine materials within the alluvial fan, leaving weak allu-
are in general less than 2500 ms−1 . Unfortunately, the ac-            vial layers and cavities which develop to sinkholes later on.
quired seismic data of the 1994 and 1999 campaigns are ir-                To shed more light on these different models and to pro-
recoverable.                                                           vide an independent database for the detailed mapping of the

Solid Earth, 9, 1079–1098, 2018                                                                  www.solid-earth.net/9/1079/2018/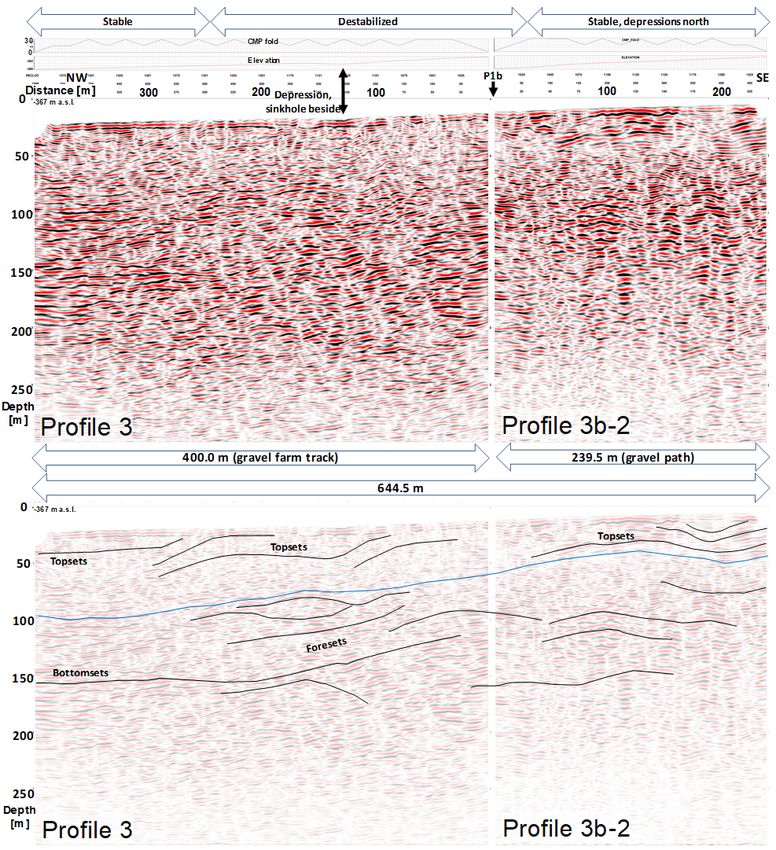
U. Polom et al.: Application to the Ghor Al-Haditha sinkhole site 1083
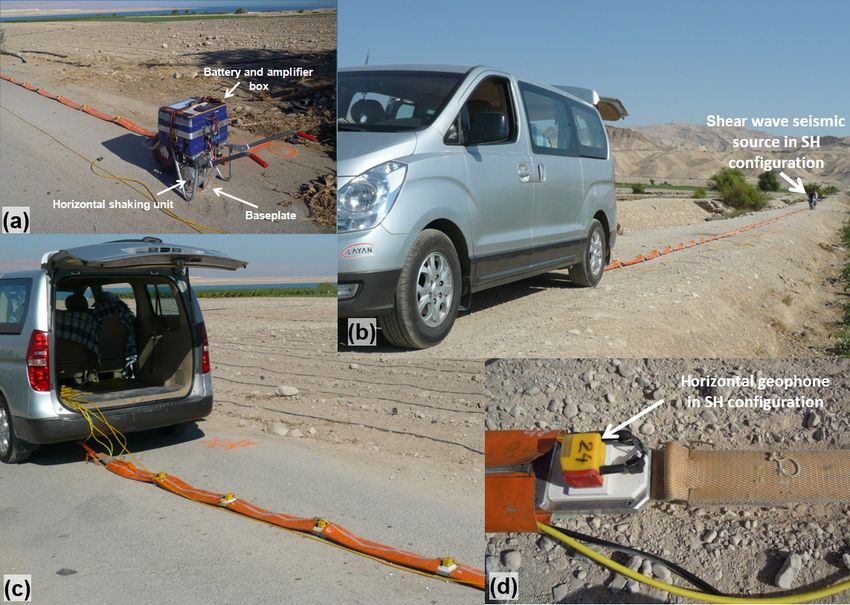
Figure 3. Photos of the shear wave seismic reflection acquisition campaign carried out in October 2013. (a) Wheelbarrow-mounted shear
wave source system on asphalt pavement at start location of profile 2. (b) Recording car, towed land streamer and source during operation
on profile 3. (c) Land streamer towed by the recording car during acquisition on profile 2. Colour paintings on the road surface were used
for location numbering along the profiles. (d) Sledge-mounted horizontal geophone in SH (particle movement perpendicular to profiling
direction) configuration along profile 3.
postulated salt layer, its morphology, and synclinal structures tions, noticeable by strong wave field scattering in the record-
expected at its top, we started high-resolution shear wave re- ings. Typically, two records were gained at each source loca-
flection seismic surveying in 2013 at Ghor Al-Haditha. The tion by alternating the source polarity and stored separately.
target depth of the survey was initially focused to the pro- Only during times of stronger wind disturbances was the
posed salt layer depth of 35–60 m and, at most, 100 m depth. number of records per location increased to four. In the 2013
campaign, a total of 2011 records (9.34 Gb data volume) at
898 source locations was gained along 1.92 km of profile
3 Shear wave reflection seismic equipment and survey length. In 2014, 2000 records (9.14 Gb) at 1144 source loca-
tions were recorded along 2.1 km of profile length (see profile
A shear wave land streamer (Inazaki, 2004; Pugin et al., locations in Fig. 4).
2004, 2007, 2013) consisting of 95 transverse horizontal A variable split-spread source–receiver configuration
(shear wave horizontally polarized – SH) geophones (10 Hz (Polom et al., 2016) was applied to enable geometry opti-
resonance frequency) at 1 m intervals was used as a receiver mization for the detection of dipping structures and to facil-
unit, connected to a Geode (Geometrics Inc., four units of 24 itate workarounds due to obstacles in the profile track. To
channels each) recording system. Transverse horizontal (SH) reduce the proportion of Love surface waves during record-
waves were generated by the seismic micro-vibrator source ing, profiles were carried out mostly either on asphalt-paved
ELVIS (Polom et al., 2011, 2013; Krawczyk et al., 2012). roads or on dirt roads covered by compacted gravel, so that
Figure 3 shows the equipment in operation on site. The small high shear wave velocities at the surface disable the exci-
size (under 1.5 m3 ) and weight (under 600 kg) of the whole tation of Love surface waves. In 2013, geodetic surveying
equipment enabled air cargo transportation to Jordan. of the profile tracks was performed by using a handheld
The source signal (sweep) was set to 20–120 Hz (20–80 Hz GPS system. Without differential GPS corrections, the fi-
during the survey extension in 2014), with a linear frequency nal positioning of the profiles from the 2013 campaign re-
modulation on 10 s duration (Crawford et al., 1960). Data quired laborious optimizations by manual corrections based
recording was set to 12 s duration and stored uncorrelatedly on the known distances along the receiver units. The horizon-
to enable the processing of uncorrelated data later on, if re- tal accuracy was improved to less than 5 cm for the profiling
quired. In the field, vibroseis correlation processing was ap- and 0.5–1 m for absolute positioning. Reliable elevation data
plied for immediate quality control. After initial tests on site, could not be restored. During the 2014 campaign, the po-
the source interval was set to 2 m to increase the statistical sitioning method was improved by using a differential GPS
redundancy due to challenging, disturbed subsurface condi-
www.solid-earth.net/9/1079/2018/ Solid Earth, 9, 1079–1098, 2018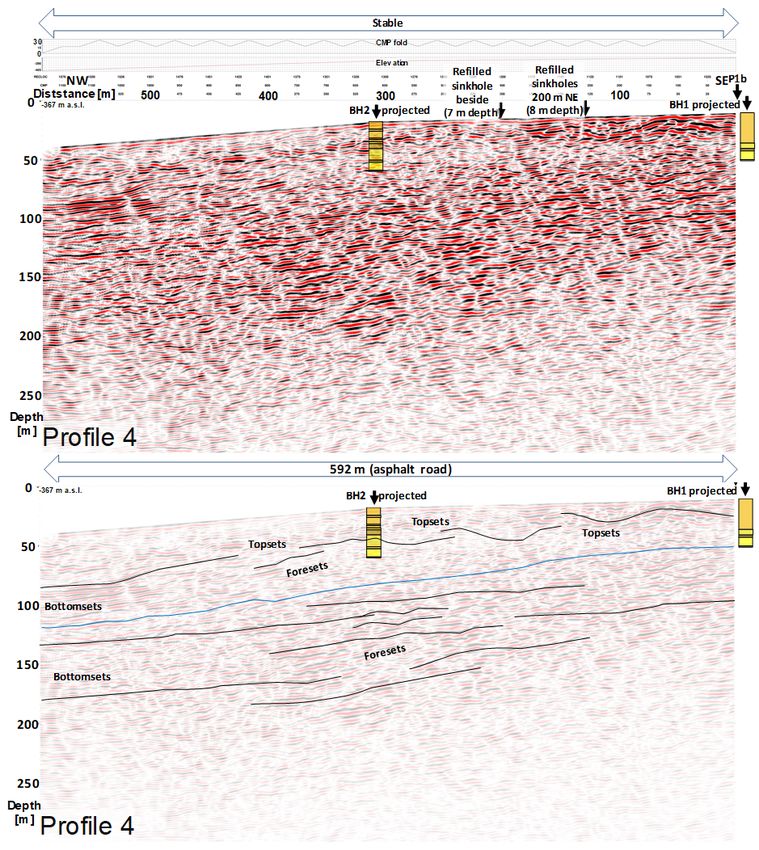
1084                                                             U. Polom et al.: Application to the Ghor Al-Haditha sinkhole site

Figure 4. Map of the shear wave reflection seismic profiles acquired in 2013 (red lines) and 2014 (yellow lines). Green circles denote the
locations of the boreholes made in 1994 (according to the report of El-Isa et al., 1995). Older refilled sinkholes are denoted by brown circles
(after El-Isa et al., 1995), blue circles (after Sawarieh et al., 2000), and the orange circle (after Bodet et al., 2010). The dotted black line
marks the main sinkhole and subsidence area after Al-Halbouni et al. (2017).

system, leading to precise elevation data of 10 cm horizontal             tected already in the single recordings. Along profile 2b-2
and 15 cm vertical error.                                                 (Fig. 6), selected record examples show a better data qual-
   All seismic data recorded were checked and preprocessed                ity compared to profile 1b: flat first breaks and a range of
in the evening of each recording day by using the VISTA                   clear reflection events occur. This is surprising because the
10.028 (GEDCO Inc., Calgary, CA) seismic data process-                    road quality along profile 2b-2 did not differ from that of the
ing software on a notebook computer (DELL Precision M65)                  southwest sector of profile 1, and both roads are of obviously
for quality-control purposes and a first interpretation. De-              similar age.
tailed inspections of correlated raw records showed strong
Love wave scattering on profiles 1 and 3 that indicated a
low-velocity layer close to the surface, even though the dirt             4    Data processing
road construction at profile 3 was modified some years ago
by gravel infill after heavy damage caused by sinkholes and               Reflection imaging was carried out by following a gen-
related subsidence.                                                       eral processing sequence described by, e.g., Krawczyk et
   Selected record examples along profile 1b illustrate the               al. (2012) and Polom et al. (2013). The main data process-
typical range of signal propagation responses at the Ghor Al-             ing flow of the first iteration consisted of vibroseis correla-
Haditha site (Fig. 5).                                                    tion, vertical stacking of records, geometry installation, am-
   In the northeast sector of the profile, close to the main sink-        plitude scaling, bandpass filter, frequency-wave number (FK)
hole area, a typical scattering of the wave propagation is vis-           filter, interactive velocity analysis, common midpoint (CMP)
ible. The wave propagation behaviour is mostly asymmetric                 stacking, parallel applied frequency-space (FX) deconvo-
regarding the receiver distance to the source position, which             lution, and finite-difference (FD) migration. Subsequently,
indicates heterogeneous subsurface structures. In the middle              depth conversion was applied by using a mean 1-D veloc-
sector, even though there is an asphalt surface pavement of               ity function. The background of the data processing applied
apparently continuous integrity, Love wave propagation was                is reported in Aki and Richards (1980) and Yilmaz (2001).
partly indicated (note the area of Love wave reverberations                   Since Love wave reverberation patterns are a widely ob-
marked in Fig. 5), probably caused by poor road construc-                 served disturbance effect in the whole data set (cf. Fig. 5),
tion. In the southwest sector, clear reflection events were de-           the elimination of such patterns was one of the main pro-
                                                                          cessing steps undertaken to enhance the desired reflection re-

Solid Earth, 9, 1079–1098, 2018                                                                        www.solid-earth.net/9/1079/2018/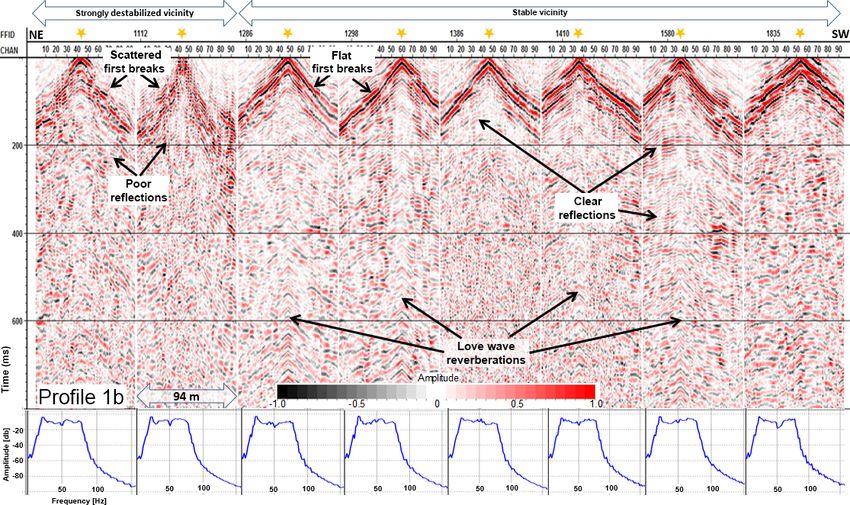
U. Polom et al.: Application to the Ghor Al-Haditha sinkhole site                                                                        1085

Figure 5. Examples of recorded shot gathers (automatic gain control – AGC of 220 ms window; amplitude scaling and bandpass filter (18-
20-76-82 Hz) applied) in the time domain along profile 1b. The positions of the seismic source are labelled by orange stars. FFID denotes
the record number along the profile; CHAN denotes the geophone number along the land streamer unit. Arrows at top denote the condition
of the ground surface observed along the profile. In the northeast, close to the sinkhole-affected area, first break and reflection signals are
weak due to the strong wave scattering in the subsurface caused by material loosening and cracking. The situation improves towards the
southeast, where no sinkholes or other subsidence features were present during profiling and the road surface was in good condition. Below,
mean amplitude spectra of the time window 0–400 ms (estimated 0–70 m depth) for each record are shown.

Table 1. Reflection seismic data processing sequence.

       1       Vibroseis correlation (using the recorded pilot sweep)
       2       Bad trace elimination
       3       Vertical stack (two records at each source location)
       4       Geometry assignment (crooked line binning)
       5       Amplitude scaling (AGC 220 ms)
       6       Bandpass filter (18-20-76-82 Hz)
       7       Vibroseis spectral balancing in the vibrogram domain – convolution by synthetic sweep operator 15–130 Hz (linear),
               11.5 s (same frequency gradient as the pilot sweep), AGC 1000 ms, correlation by the synthetic sweep operator
       8       Topmute – interactive, elimination of first breaks
       9       FK-filter, polygon mode to remove Love wave and harmonic residuals
       10      CMP sort
       11      Interactive velocity analysis (every 40 m)
       12      Normal moveout correction
       13      CMP stack (mean 24-fold, max 30-fold)
       14      Trace energy normalization
       15.1    FX deconvolution
       15.2    Finite-difference (FD) time migration, 67 ◦ algorithm
       16      Time-to-depth conversion of 15.2 (using a mean 1-D velocity function derived from rms stacking velocities)
       17      Elevation statics to −367 m a.s.l.

sponse. This required several iterative loops during the main             mainly by using VISTA 10.028 (GEDCO Inc., Calgary, CA)
processing sequence to improve the final result. The main                 seismic data processing software. The first sequence was car-
data processing was carried out in two iteration sequences                ried out to establish the main database and to extract the main

www.solid-earth.net/9/1079/2018/                                                                        Solid Earth, 9, 1079–1098, 2018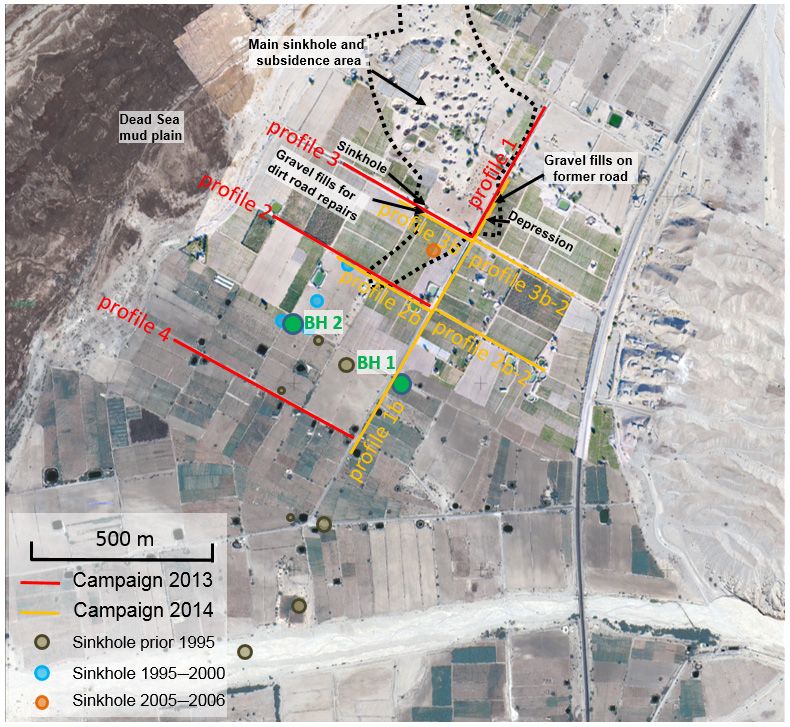
1086                                                           U. Polom et al.: Application to the Ghor Al-Haditha sinkhole site

Figure 6. Examples of recorded shot gathers (AGC of 220 ms window; amplitude scaling and bandpass filter (18-20-78-82 Hz) applied) in
the time domain along profile 2b-2 (labelling as in Fig. 5). Good signal quality of first breaks and reflections mirrors a rather unaffected
signal propagation in the subsurface, which correlates to the sinkhole-unaffected vicinity at the surface. Reflection signals up to 400 ms in
time represent layer responses from 70 m depth (applying a 350 ms−1 shear wave propagation velocity). Below, mean amplitude spectra of
the time window 0–400 ms for each record are shown.

structures in the data. In the second iteration sequence, the            low velocity results affected by wave propagation along ir-
time section results were used to improve the processing flow            regular, non-straight ray paths (due to the disturbed shallow
in detail towards the specific reduction of imaging artefacts            subsurface structure) with more regular straight ray path re-
and to stabilize the processing velocities for later use dur-            sponses from deeper levels (later travel times).
ing depth conversion. It included reduction of the harmonic                 Figure 7 shows a comparison of processed shot gathers of
distortions in the near-source area and vibroseis spectral bal-          profile 2 in an area of good subsurface reflectivity (profil-
ancing (Pugin et al., 2009) in a vibrogram transformation do-            ing distance 325 m in Fig. 9) after step 5 (Fig. 7a) and after
main (Polom, 1997). Furthermore, the results of the veloc-               step 9 (Fig. 7b) of the processing sequence in Table 1. Ana-
ity analysis were improved. To derive final depth sections,              log to the timescale on the left vertical axis, a depth scale is
a mean 1-D rms velocity–time function (shown in Fig. 8)                  added on the right axis based on a mean shear wave velocity
for all profiles was derived from the reflection seismic data            of 350 m s−1 to visualize the raw time-to-depth relationship.
set and applied to all profiles. Due to the lack of any refer-           The record set shows continuous and partly strong reflector
ence velocity–depth function, e.g. from vertical seismic pro-            elements which are partly covered in Fig. 7a by harmonic
filing (VSP) logging, the 1-D solution was chosen as a first             distortions (so-called herring bone or chevron pattern) prop-
depth approximation to prevent the projection of lateral ve-             agating with Love wave velocity of nearly 200 m s−1 from
locity irregularities (e.g. due to irregular wave ray paths close        the source position. After step 9 of the processing sequence,
to sinkhole-affected areas) onto the depth sections, which               this covering pattern is removed from the data, showing the
would result in structure imaging distortions. The detailed              reflector structures behind this pattern (Fig. 7b). Such a dis-
processing sequence is listed in Table 1.                                turbance pattern typically results from poor road construction
    Because of these general improvements, some structures               where the sub-base layer is not properly done.
in the near-surface down to 50 m became weaker than in the
first iteration. This is a compromise result of combining shal-

Solid Earth, 9, 1079–1098, 2018                                                                      www.solid-earth.net/9/1079/2018/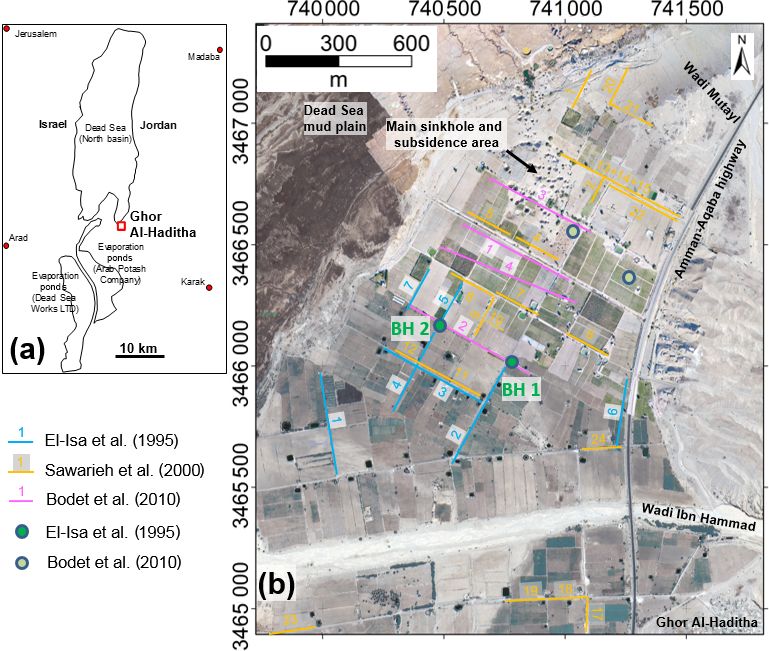
U. Polom et al.: Application to the Ghor Al-Haditha sinkhole site                                                                    1087

Figure 7. (a) A consecutive set of recorded shot gathers (AGC of 220 ms window; amplitude scaling and bandpass filter (18-20-76-82 Hz)
applied) in the time domain in an area of good reflectivity along profile 2 (labelling as in Fig. 5). Parts of the records are disturbed by
harmonic distortions centred on the source position and propagating with Love wave velocity (∼ 200 m s−1 ). In (b) the disturbing pattern
is removed, uncovering the reflection events below. For a raw time-to-depth estimation, a depth scale is added on the right based on a mean
velocity of 350 m s−1 for body shear waves. In (b) Topmute (step 8 in Table 1) is also applied.

5   Resulting depth sections and structure correlations                 major sinuous depression that runs down to the former Dead
                                                                        Sea shore and that hosts the smaller-scale sinkholes (for de-
                                                                        tails, see Al-Halbouni et al., 2017). Several gravel infills on
The main northeast–southwest-trending profile 1b has trans-
                                                                        the former asphalt surface in the past make this part of the
parent and strongly layered segments between the ground
                                                                        road usable. Further along profile 1b, to the southwest of its
surface and 200 m depth (Fig. 8).
                                                                        intersection with profile 3, the road stability continuously in-
   The depth section of profile 1b refers to a reference level
                                                                        creases. The road surface is essentially unaffected by subsi-
of −367 m a.s.l., and it includes annotations of joints to the
                                                                        dence along the area denoted as stable along the southwest
other profiles, remarks about the surrounding area (top), and
                                                                        half of the profile 1b. Within this stable area, from the in-
information on the road construction (bottom). The location
                                                                        tersection of profile 1b with profile 2 to the borehole BH1,
of borehole BH1 which is nearly 10 m southeast of the profile
                                                                        a continuous reflectivity pattern is visible below 50 m refer-
is projected perpendicularly into the profile and shown with
                                                                        ence depth (i.e. nearly 45 m below the ground surface). The
a simplified lithology (see Fig. 2). The mean 1-D velocity
                                                                        top of this pattern nearly correlates with the depth of the
function used for time-to-depth conversion is given as inter-
                                                                        silt and clay layer detected 44 m below the ground surface
val velocity in depth (Dix, 1955) beside the borehole BH1. It
                                                                        in borehole BH1. The bottom of the nearly horizontal pat-
shows estimated shear wave velocities in the range of 250–
                                                                        tern reaches nearly 100 m depth below reference level along
450 ms−1 down to depths of about 170 m. Finally, the reflec-
                                                                        much of the profile, although southwest of the BH1 loca-
tion amplitude responses throughout all seismic sections rep-
                                                                        tion, the pattern extends downward to 230 m depth within a
resent reflection coefficients of nearly 0.1 or less, indicating
                                                                        V -shaped structure. Northeast of the intersection of profiles
materials with relatively low contrasts in seismically sensi-
                                                                        1 and 2, the pattern becomes weak and disappears north-
tive material properties (elastic parameters and density) and
                                                                        east of the intersection of profiles 1 and 3. Also southwest
hence in shear wave seismic velocity.
                                                                        of borehole BH1, the horizontal pattern weakens and bowl-
   The main area of sinkhole activity is located immediately
                                                                        shaped structures become more dominant. Overall, the pat-
northwest of profile 1 (see Fig. 4). This activity has strongly
                                                                        tern widely correlates with the stable part of the road, where
affected the road construction along this part of profile 1b,
                                                                        no sinkholes have occurred yet. Above this pattern, around
northeast of its intersection with profile 3 (Fig. 8). A depres-
                                                                        the borehole BH1 location, nearly horizontal layers occur
sion with several fractures is visible here along the road sur-
                                                                        which show finer subdivided structures resolved down to me-
face (Fig. 4) but without any sinkhole activity up to now. In
                                                                        tre scale. This finer layered structure also abruptly disappears
detail, this part of the road crosses the southeastern limit of a

www.solid-earth.net/9/1079/2018/                                                                     Solid Earth, 9, 1079–1098, 2018
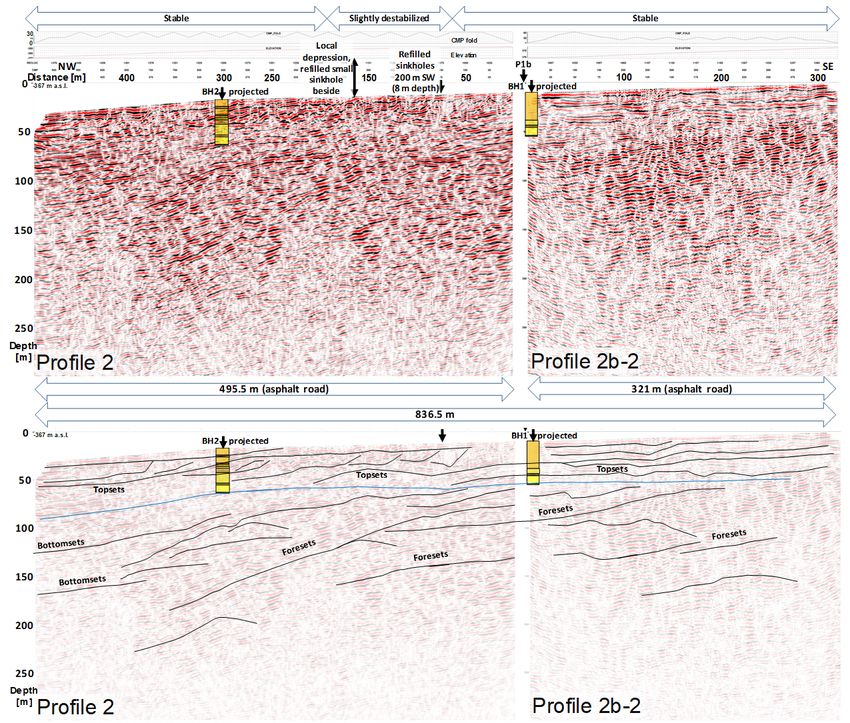
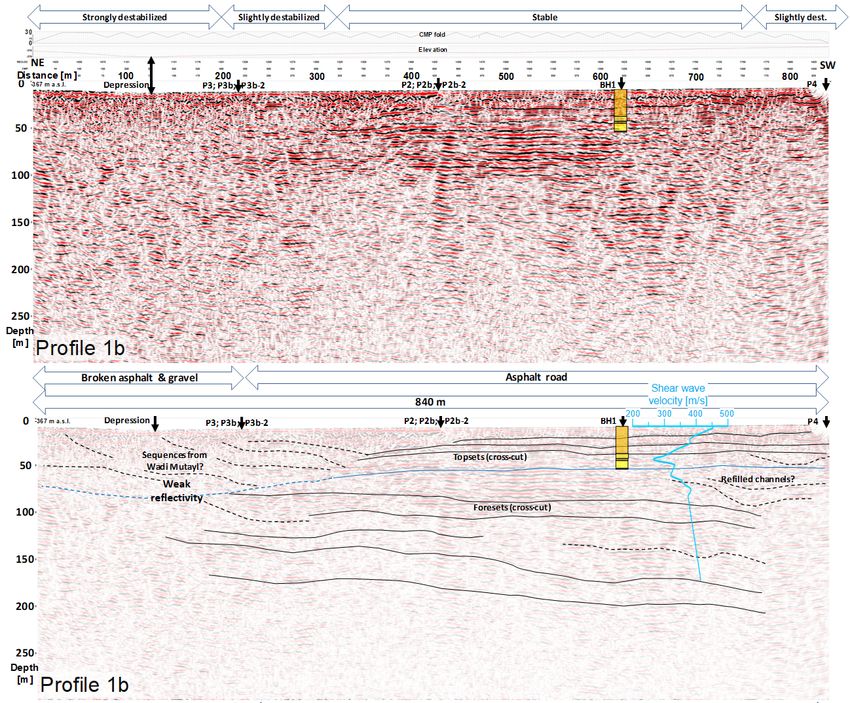
1088                                                             U. Polom et al.: Application to the Ghor Al-Haditha sinkhole site

Figure 8. Resulting depth section of profile 1b after post stack FD time migration (a) and interpretation of the main structure elements (b).
Arrow bars at the top of the upper image denote the surface instability/stability as observed along the profile, while arrow bars below denote
the road surface situation along the profile and the profile length. Black arrows at the top indicate joints with the crossing profiles. The
lithology of borehole BH1 is projected from 10 m distance perpendicularly into the profile. The interpreted top of the silt and clay layer in
BH1 is shown as the blue line along the profile, since it is the first layer detected at depth that is prone to subrosion. Also shown is the 1-D
shear wave velocity–depth function derived from seismic data in this area; this function was used for time-to-depth conversion of all profiles.

northeast of the intersection of profiles 1 and 2, i.e. as one ap-        seismic response above 50 m depth (i.e. from 30 to 35 m be-
proaches the main sinkhole area.                                          low the ground surface). This is spatially associated with a
   The combined depth sections of profiles 2 and 2b-2 are                 local depression and related cracks in the road. At least one
shown in Fig. 9. The profiles were both acquired on an as-                sinkhole formed directly adjacent to this part of road prior
phalt road. Also shown in Fig. 9 are the simplified litho-                to 2000 (Sawarieh et al., 2000) and was subsequently filled
logical bars of boreholes BH1 and BH2 as projected per-                   in. Along profile 2b-2, at profiling position 125 m, a striking
pendicularly into the profile plane from their true locations             stack of bowl-shaped structures is visible from the surface
nearly 200 m to the southwest (cf. El-Isa et al., 1995). Due              down to nearly 75 m depth. Along this part of the profile and
to this relatively large projection distance, the lithology bars          for at least 300 m on either side of it (i.e. towards the north-
may not precisely reflect the lithology in the profile plane.             east and southwest), no sinkhole activity was reported in the
The sections show a nearly horizontal layering down to 50 m               past.
depth below the reference level of −367 m a.s.l. in the south-               The combined depth sections of profiles 3 and 3b-2 are
east part of the combined profile, which changes laterally to             shown in Fig. 10. The boreholes BH1 and BH2 are not in-
less well organized but mainly northwest-dipping structures               cluded in the profile plane due to the distance of nearly 420 m
in the northwest part of the combined profile.                            from their true positions further southwest.
   Below 50 m depth the main structural dip is towards the                   Profiles 3 and 3b-2 were acquired on a gravel farm track
northwest and is divided into several dip sequences visible               and on a gravel path, respectively, both close to a parallel
down to nearly 250 m. Along profile 2, between profiling po-              drainage channel. A 250 m long segment of the farm track
sitions 75 and 200 m, there is a slightly more disorganised               along profile 3 was refilled extensively in the past. The main

Solid Earth, 9, 1079–1098, 2018                                                                        www.solid-earth.net/9/1079/2018/
U. Polom et al.: Application to the Ghor Al-Haditha sinkhole site                                                                        1089

Figure 9. Resulting depth sections of combined profiles 2 and 2b-2 after post-stack FD time migration (a) and interpretation of the main struc-
ture elements (b). For annotations, see Fig. 8. Lithology of boreholes BH1 and BH2 is projected perpendicularly into the profile from 200 m
distance and therefore may not show the precise layering signature. Except for the top 40 m, the main characteristics down to 200 m show
stacked sequences of northwest-dipping reflectors, which are interpreted as northwest-prograding alluvial fan sequences. The interpreted top
of the silt and clay layer in BH1 and BH2 is shown by the blue line.

area of sinkhole activity lies immediately northeast of this                 The depth section of profile 4 (Fig. 11), which again in-
refilled section of profile 3 (see Fig. 4), and indeed a recent           cludes projections of boreholes BH1 and BH2 (both in re-
sinkhole (formed in 2008) was located directly beside the                 ality located nearly 200 m northeast of the profile plane),
track during data acquisition.                                            shows mainly slightly northwest-dipping structural signa-
   Northeast of profile 3b-2, no sinkhole activity was reported           tures. Bowl-shaped structures are restricted to the top 50 m
in the past. Due to the different surface conditions, and prob-           of the southeast part of the profile, which lies less than 200 m
ably caused by the sinkhole activity directly beside profile              southwest of where sinkhole activity was reported by El-Isa
3, these sections slightly differ in seismic signature. Pro-              et al. (1995) and Sawarieh et al. (2000) in the 1990–2000
file 3b-2 shows some undulating layer structures of contin-               decade. One sinkhole of 7 m depth was reported to have
uous amplitudes to 50 m depth below reference datum (40–                  formed beside the road prior to 1992. No surface damages
45 m below the ground surface), which change at the north-                were reported for the road track itself, however, and no de-
west end of the profile to northwest-dipping sequences. In                pressions, cracks, or repairs were visible at the surface during
the very southeast part of the profile, a bowl-shaped struc-              data acquisition. At the northwest end of the section several
ture sequence dominates down to 80 m depth but without                    continuous events of higher amplitudes occur nearly 50 m be-
any indication of deformation at the surface. Profile 3 mainly            low the surface.
shows northwest-dipping structural elements without signif-                  Figure 12 shows a 2.5-D grid of the profiles shown in
icant amplitude variations, especially above 100 m depth.                 Figs. 8–11 including the continuation of profile 1b along pro-
Only small bowl-shaped structures are visible.                            file 1. Also integrated are the simplified columns of bore-
                                                                          holes BH1 and BH2. The reference level at the section top

www.solid-earth.net/9/1079/2018/                                                                        Solid Earth, 9, 1079–1098, 2018
1090 U. Polom et al.: Application to the Ghor Al-Haditha sinkhole site Figure 10. Combined depth sections of profiles 3 and 3b-2 after post stack FD time migration (a) and interpretation of the main structure elements (b). For annotations, see Fig. 8. The interpreted top of the silt and clay layer in BH1 and BH2 is shown by the blue line. The centre part of the profiling track was repeatedly affected by recent sinkhole activity directly beside it to the northeast. For farming access, it was refilled with gravel along more than 250 m and was subsequently again affected by sinkholes and subsidence. This may cause the weaker reflection signatures in the upper 50 m when compared to profile 2 (Fig. 8). The main reflection pattern signature is similar to profile 2 and 2b-2, showing northwest-dipping events. In the southeast of the profile, a v-shaped structure is visible close to surface, filled with nearly horizontal reflection events, which is interpreted as a refilled channel side cut. Due to the wide subsidence area northeast of profile 3 the top of the silt and clay layer (blue line) was continued to the northwest starting from profile 1b instead using the projection of BH2. is −367 m a.s.l. The image illustrates that a direct projection area. To interpolate the top of this layer in space (light blue of borehole BH2 to profiles 2 and 4 needs to be carefully line in Figs. 8–11), it was traced from borehole BH1 along handled due to the projection distance of nearly 200 m. Nev- profile 1b and profile 1, from where it was further contin- ertheless, the results of the profiles 2 and 4 both show their ued to profiles 2 and 2b-2, profiles 3 and 3b-2, and profile main structural dips towards the northwest, which fit the dip 4, with respect to the perpendicular projection of borehole tendency of the lithology detected in the boreholes (Fig. 2). BH2 into the profiles 2 and 4. Subsequently, these layer con- Blue markers included along the borehole shafts in Fig. 12 tinuations along the profiles were triangularly interpolated in determine the top of the silt and clay layer below the allu- space to get an impression of the probable layer extent and vium sequence consisting of gravel and sand. Since this silt topography. Regarding the lithology of boreholes BH1 and and clay layer is the only one detected in the lithology bars BH2, the constructed horizon represents the estimated base of the boreholes that is prone to act as an aquiclude sensi- of the upper alluvial gravel and sand unit. The lithology of tive to subrosion and it also fits the general structural dip, it this upper alluvial unit shows no sequence prone to subro- was obvious that this layer probably extends across the whole sion, and neither the borehole lithology nor the seismic re- Solid Earth, 9, 1079–1098, 2018 www.solid-earth.net/9/1079/2018/
U. Polom et al.: Application to the Ghor Al-Haditha sinkhole site                                                                         1091

Figure 11. Depth section of profile 4 after post stack FD time migration (a) and interpretation of the main structure elements (b). For
annotations, see Fig. 8. Lithology of boreholes BH1 and BH2 is projected from 200 m distance perpendicularly into the profile. In contrast
to profile 2, more gently northwest-dipping events are present to 150 m depth, indicating less transportation energy of the alluvial material or
an apparent structure dip. The top of the silt and clay layer in BH1 and BH2 is indicated by the blue line. Bowl-shaped signatures close to the
surface in the southeast indicate sinkhole-caused subsidence and/or refilled channel side cuts. Significant reflection amplitudes of a stronger
reflector pattern close to the northwest end at nearly 90 m depth may indicate an evaporite-rich lens included in the alluvium–lacustrine
deposits.

flection responses give indications of any included massive               and silt and clay sequences may lie below the presently ex-
salt layers or extended salt lenses. Therefore, subrosion as              posed mudflat.
the origin of the sinkhole process on the exposed alluvial fan
is estimated to occur mainly below this constructed horizon
within the area of the seismic survey. The deepest part of this           6    Discussion
constructed horizon reaches −467 m a.s.l. towards the north-
west, which is 60 m below the level of the current alluvium-              The shear wave reflection seismic survey acquired at the
to-mudflat transition of −407 m a.s.l. at the former shoreline            Ghor Al-Haditha sinkhole site in 2013 and 2014 was the first
of the Dead Sea in the 1960s (as calculated by Al-Halbouni et             comprehensive shallow seismic investigation of the sinkhole
al., 2017). It therefore represents a different subrosion level           phenomenon area since the refraction seismic investigation
to the present mudflat surface, which indicates that alluvium             campaigns carried out by El-Isa et al. (1995) and Sawarieh et

www.solid-earth.net/9/1079/2018/                                                                         Solid Earth, 9, 1079–1098, 2018
1092                                                            U. Polom et al.: Application to the Ghor Al-Haditha sinkhole site

Figure 12. Three-dimensional representation of the 2.5-D profiling grid (cf. sections in Figs. 8–11), restricted to 200 m depth (no vertical
exaggeration). Boreholes BH1 and BH2 are included as yellow bars representing the sand and gravel sequence above the detected silt and clay
layer, the top of which is marked by a blue disc along each well shaft. Light blue lines along the profiles mark the interpreted continuation
of the top of this layer starting from BH1 along profile 1 and subsequently continuing to the crossing profiles. The constructed horizon by
triangular interpolation represents the derived top of the silt and clay layer below the reference datum of −367 m a.s.l. based on the drilling
and seismic results. At the deepest parts towards the Dead Sea border the top of this layer reaches nearly −467 m a.s.l., which is 60 m below
the level of the current alluvium–mudflat transition of −407 m a.s.l. calculated by Al-Halbouni et al. (2017).

al. (2000). The results presented here show the advantageous              olution improvement factor of 8–10 below the groundwater
imaging capabilities of the method regarding high-resolution              level, when one postulates a similar seismic signal frequency
structural analysis and depth penetration compared to com-                bandwidth for P and S waves.
mon refraction seismic methods or common P-wave reflec-                      The success of the application to the alluvial fan setting
tion analysis. In this section, we discuss firstly the general            at Ghor al-Haditha is seen in the well-resolved shallow sub-
outcomes of our application of the S-wave reflection method               surface structure imaged in the seismic profiles, which show
to an alluvial fan setting and secondly the implications for              in general mainly northwest-dipping (i.e. lake-ward-dipping)
the nature of processes leading to sinkhole development at                reflectors typical of an alluvial fan sequence prograding into
the Ghor Al-Haditha site.                                                 a lacustrine environment. The internal structure is complex
                                                                          and includes typical fan-delta elements such as topsets, fore-
6.1    The application of the shear wave reflection seismic               sets, and indications of bottomsets. Especially profile 2 in
       technique to alluvial fan setting                                  Fig. 9 shows typical dip structures of a Gilbert-type delta
                                                                          (Gilbert, 1885). Intercalated, more horizontal structures in-
The S-wave reflection method is especially advantageous in                dicate lacustrine deposit layers. The topset structures, the in-
the area close to the Dead Sea border because wave propaga-               tercalated lacustrine deposit layer and the dip directions fit
tion is restricted to the matrix only, and so it is not affected          the lithology of both boreholes BH1 and BH2, which show
by the pore space content, whether that is air in the shal-               northwest-dipping alluvial sand and gravel above an obvi-
low unsaturated zone or freshwater or saltwater in the deeper             ously lacustrine-type deposit denoted as silt and clay (Fig. 2).
parts below the groundwater level. Therefore the groundwa-                Below the blue line (Figs. 8–11), stacked foreset structures
ter level itself does not act as a physical interface during              dominate in profiles 2–4, connected to bottomset structure
wave propagation, as is generally the case for common P-                  indications in the northwest. Due to the absence of borehole
wave methods. In the S-wave profiles acquired in the area,                information for depths greater than 51 m below the ground
no influence and no response of the groundwater level to the              surface, more detailed interpretations remain speculative and
wave propagation was detected. Furthermore, wave propaga-                 require further investigations. With respect to the fluctuations
tion velocities of S waves (Vs ) are in general significantly             of the Dead Sea level (Bookman (Ken-Tor) et al., 2004) in the
smaller than those of P waves (Vp ). The Vp / Vs ratio ranges             past, several levels of included lacustrine-type deposits in the
from nearly 1.7 for an ideal elastic medium (e.g. perfect con-            fan architecture are most probable and these may have a com-
solidated rock) to more than 10 (Yilmaz, 2015) for uncon-                 plex distribution in three dimensions. For instance, the refill
solidated sediments (e.g. Holocene alluvium and soft clays).              of eroded alluvial channels on the fan surfaces by lacustrine
This leads to a significantly improved resolution when using              deposits may be a mechanism for the inclusion of soluble
S waves, depending on the grade of matrix consolidation. In               fine material in the alluvial fan structure. Furthermore tec-
the case of the Ghor Al-Haditha site, this results in a res-              tonically induced level variations in the whole fan structure,

Solid Earth, 9, 1079–1098, 2018                                                                       www.solid-earth.net/9/1079/2018/
U. Polom et al.: Application to the Ghor Al-Haditha sinkhole site 1093 caused by the sinistral transform fault movement, cannot be structure imaging. Since the discrepancies could not be elim- excluded. inated due to missing additional velocity information, e.g. Since wave propagation is controlled by the matrix only, by well logging, the final depth conversion was carried out the effects of grain size coupling play a key role in the wave by using a stabilized 1-D velocity function for all profiles propagation of S waves in contrast to P waves. In contrast (Fig. 8), derived as mean function from profile parts with suf- to P-wave velocity, which usually increases with depth in the ficient reflection responses. Therefore, the resulting depths case of a fluid-saturated pore space, S-wave velocities often have to be handled with an estimated error range of up to decrease with depth, e.g. if the grain cementation reduces or 20 %. the pore pressure increases with depth as both factors result As is well known in hydrocarbon exploration and shal- in reduced grain contacts. A further reason for velocity func- low seismic operations using the seismic refraction, reflec- tion decrease with depth is the influence of a high-velocity tion, borehole, and other seismic methods, there are no stand- layer at the surface, which is the case operating on an asphalt alone seismic properties that enable the detection of the road surface. This effect is visible in the 1-D velocity–depth lithology or the grain size of a layer. This also holds for other function in Fig. 8 in the range 0–10 m below ground surface. geophysical methods and their combinations. Such conclu- Diminished grain coupling can also arise from mechanical sions can only be reached if seismic results are calibrated damage, e.g. by fracturing, subsidence, and subrosion, which by comprehensive borehole coring in the investigation area. leads to breaks in the direct (geometrical) wave paths. In con- Since the borehole descriptions of BH1 and BH2 are based trast to P waves, where such breaks may be cut short due to on the analysis of cuttings only, precise lithology depths and the wave propagation through the pore fluids, decoupling be- the information about grain size derived from the boreholes tween grains causes additional paths for S waves, leading to are in principle poor, and no information is available below enhanced wave energy scattering and an apparent velocity the borehole bottoms due to the missing well logging. The reduction. alluvial fill rate can be estimated relatively by the borehole In the Ghor Al-Haditha data, enhanced wave energy scat- lithology profiles and by the seismic structure dips but must tering was observed in areas close to sinkhole activity, lead- be handled with care since geochronological data are limited ing to transparent zones of weak reflectivity in the seismic and the area is close to an active, main sinistral strike-slip sections (e.g. Figs. 8, 10). In the northeast part of profile 1b transform fault. It is to be expected that, in addition to the in Fig. 8, the zone of scattered reflections is imaged up to lake level variations, tectonic overprints may have changed 60 m depth below the reference level of −367 m a.s.l. (i.e. the whole sedimentation structure over time, even though nearly 50 m below the ground surface), indicating the depth there was no main fault structure detected in the seismic data. range of the destabilized alluvium. Profile 3 in Fig. 10 shows In summary, the S-wave reflection seismic method the continuation of this low-reflectivity zone to 70 m depth achieved advantageous high-resolution imaging results of below the reference level (i.e. nearly 50 m below the ground the alluvial–lacustrine deposit structure at the Ghor Al- surface) in the centre of that profile. Beside the transparent Haditha sinkhole site; these results are superior to common zones of strong wave field scattering, buried syncline struc- near-surface seismic investigation methods. The favourable tures imaged in profiles 2b-2 (Fig. 9), 3b-2 (Fig. 10), and 4 velocity–frequency relationship of the resulting wavelets and (Fig. 11) are in the depth range of 30–60 m below ground the absence of pore fluid effects enabled a metre-scale res- surface. These synclines probably indicate ancient or recent olution and a nearly 200 m penetration depth. Furthermore, subsidence by sinkhole activity caused by subrosion below and unlike the refraction method, the shear wave reflection the syncline centres at different horizons. The structures are method is independent of an obligatory, increasing velocity– targets for time-lapse monitoring by shear wave reflection depth function. In the case of the sinkhole-affected subsur- seismics in the upcoming years to evaluate changes in the face structure at Ghor Al-Haditha, where strong vertical and reflectivity response in detail. lateral subsurface inhomogeneity occurs, it is not free of The effect of apparent velocity reduction was also ob- shortcomings, and, similar to other geophysical methods, it served, leading partly to irregular interval velocity values of requires borehole calibration to verify precise depth imaging. less than zero. Such velocity irregularities can be caused by curved ray paths instead of straight rays which are the base 6.2 Implications of the shear wave reflection seismic of the CMP concept in reflection seismic. Subrosion-affected results for sinkhole formation zones (e.g. cavities) in the subsurface may cause the shear waves to propagate around affected zones in stiffer mate- Combining the reflection amplitude responses and the de- rial instead of passing them along a straight path. Whereas tected borehole lithologies of BH1 and BH2 (Figs. 8–11) this velocity problem is of minor importance for the CMP results in no indication of an extended massive salt layer stacking, processing the velocity functions of the individual of several metres’ thickness in the depth range 35–52 m be- profiles required careful handling during the time-to-depth low the ground surface, as proposed, e.g., by Taquieddin et conversion, where such zones of irregular velocities would al. (2000), Frumkin et al. (2011), Ezersky et al. (2013a, b, c) locally compress the depth sections, leading to a distorted and Ezersky et al. (2017). If a massive salt layer thicker than www.solid-earth.net/9/1079/2018/ Solid Earth, 9, 1079–1098, 2018
1094                                                        U. Polom et al.: Application to the Ghor Al-Haditha sinkhole site

2 m were present in the shallow subsurface down to 200 m           of the previous studies of El-Isa et al. (1995) and Sawarieh
depth, which is our estimated limit of stable imaging, this        et al. (2000). El-Isa et al. (1995) detected a deepest refrac-
would result in strong seismic reflection responses in our pro-    tor layer of Vp max 2500–3300 ms−1 at 40–50 m depth in
files. A reflection coefficient of nearly 0.5 has to be expected   nearly all of their profiles. In the profiling tracks, which were
for an alluvium–salt interface if one assumes mass densities       repeated by Sawarieh et al. (2000) using a similar acquisition
for alluvium (∼ 1900 kgm−3 ) and salt (2200 kgm−3 ) and if         configuration, max P-wave refraction velocities Vp of 2500
one assumes the mean shear wave velocity range of 250–             and 3130 ms−1 were detected for similar depths, but pre-
450 ms−1 in the alluvium, as detected during data process-         dominantly the detected velocities were around 2150 ms−1
ing, and at least 1000–1600 ms−1 for a massive salt layer, as      at nearly 40–50 m depth. In only one of 24 profiles (no. 5,
reported by Ezersky and Livne (2013) for the boreholes MN-         Fig. 1) of Sawarieh et al. (2000), in the northwest outside
5E and EB-3E at the western Dead Sea shore. In contrast,           the study area of El-Isa et al. (1995) and close to profile 3
the reflection amplitude responses visible below 52 m depth        of our study, Sawarieh et al. (2000) detected a P-wave ve-
are similar to the reflection amplitude responses above 52 m       locity of 3948 ms−1 at 70 m depth, which was interpreted as
depth, which represent reflection coefficients of nearly 0.1       a salt diapir. Directly beside their profile 5, in their profile
and less. We also find no indication of anticlinal structures,     4 (Fig. 1), Sawarieh et al. (2000) detected a maximum ve-
as one must expect from salt diapirism or salt pillows below       locity of 2245 ms−1 in 40 m depth. The area of profile 4 has
52 m depth. Finally, there is no structure or amplitude indi-      subsequently been affected since 2000 by massive sinkhole
cation of a hard rock basement below the alluvial–lacustrine       activity and subsidence, which prevented further investiga-
sequence as imaged in the profiles down to depths of about         tion, whereas the area of profile 5 has remained unaffected
200 m. Such low Vs values and reflection coefficients are          until today (see Figs. 1 and 4). For the Ghor Al-Haditha
typical for poorly consolidated alluvial and lacustrine sili-      site, these observations of sinkhole development are in di-
ciclastic deposits and are consistent with the existing bore-      rect contradiction to predictions of the salt layer edge model
hole information at Ghor Al-Haditha. Similar low Vs veloc-         as suggested, e.g., in Ezersky et al. (2017) and as based on
ities for alluvium and silty clay layers (Vs: 100–600 m s−1 )      the above-mentioned P-wave refraction velocities.
were reported at the western Dead Sea shore (e.g. Ezersky             Overall, the P-wave velocities reported for the depth inter-
and Livne, 2013; Gorstein and Ezersky, 2015; Ezersky et al.,       val of 40–60 m in past studies are by themselves not indica-
2017), as proven by in situ tests in logged boreholes and lab-     tive of a laterally extensive, thick, massive salt layer at that
oratory tests on related samples.                                  level. Regarding borehole-defined salt layers on the western
   The previously derived MASW results at the Ghor Al-             shore of the Dead Sea, the overview by Ezersky et al. (2017)
Haditha site (Bodet et al., 2010; Keydar et al., 2011; Ezer-       notes that P-wave velocities for adjacent alluvial and lacus-
sky et al., 2013b, 2017) also show Vs of 200–400 ms−1 from         trine sediments range from 2000 to 2900 m s−1 , while P-
the surface to nearly 50 m depth (magenta profile 3 in Fig. 1)     wave velocities for the salt layers themselves range from
and to nearly 30 m depth (magenta profile 4 in Fig. 1). As-        2900 to 4500 m s−1 . The velocities reported for Ghor al-
suming a mean Vs value of 300 ms−1 and taking into account         Haditha area in the 30–60 m depth level thus overlap with the
the 4.5 Hz low-frequency limit of the geophones used for the       mid–upper end of the range expected for semi-consolidated,
MASW survey (see the fundamental-mode low-frequency                water-saturated, alluvial, or lacustrine deposits and with the
limit in Ezersky et al., 2013b, Fig. 4c), such low Vs values re-   lowermost end of the range expected for compacted salt, and
strict the data-driven maximum Rayleigh wavelength to 62 m         they are thus lithologically ambiguous. Moreover, the inter-
(VR ∼ 0.93 Vs). This results in a maximum MASW investi-            pretation of such velocities in terms of a massive salt layer is
gation depth of 31 m according to, e.g., Park et al. (1999),       not supported by borehole data available at Ghor Al-Haditha
Rix and Leipski (1991), and Park and Carnevale (2010), in          for the relevant depth interval.
contrast to the rule-of-thumb maximum depth estimation of             Another hypothesis in discussion (Ezersky et al., 2017)
60 m (0.5 of the spread length) based on the survey spread         states that the shallow salt layer proposed previously at Ghor
length of 120 m. The significance of the high-velocity layer       Al-Haditha could not be detected in our study because it was
of Vs > 800 ms−1 reported to lie below 35–40 m in MASW             already completely dissolved in the period 2006–2013 – i.e.
profile 4, which is the only reported S-wave evidence of the       before our survey. This hypothesis would additionally pos-
proposed shallow salt layer at the Ghor Al-Haditha site, must      tulate that the lithology description of BH1 and BH2 carried
therefore be handled with caution. The strong lateral Vs in-       out in 1994 may have been flawed because any salt encoun-
homogeneity reported (Bodet et al., 2010) is also in contrast      tered was probably immediately dissolved by the freshwater
to the required 1-D layer structure along the spread; such in-     bore fluid during the drilling process and so did not remain
homogeneity is well known to cause impaired inversion pro-         in the analysed cuttings. This latter postulation cannot be as-
cessing results for the MASW method (Forbriger, 2003).             sessed since details of the drilling operation and especially
   Due to the significant difference in propagation velocities     the bore fluid are not documented in El-Isa et al. (1995) or
of P and S waves, the S-wave velocity results in this study        elsewhere. Nonetheless, if the proposed > 10 m thick shal-
are not comparable to the P-wave refraction velocity results       low salt layer (e.g. Taquieddin et al., 2000; Ezersky et al.,

Solid Earth, 9, 1079–1098, 2018                                                              www.solid-earth.net/9/1079/2018/
You can also read