INTRODUCTION OF MIRA-BHAYANDER - ENVIS
←
→
Page content transcription
If your browser does not render page correctly, please read the page content below
Mira Bhayander Municipal Corporation.                            Environmental Status Report 2008-2009

CHAPTER -1
                                        INTRODUCTION OF MIRA-BHAYANDER
1.1   PURPOSE

        The overall purpose of this study is to identify and assess future environmental trends in the
region and to evaluate alternative strategies for environmental protection. The Environmental
Status Report is a comprehensive study of the selected region and is intended to summarize and
synthesize existing information in order to identify key driving forc es and both current and future
environmental issues. More specifically, the goal of this report is to describe the causes of growth
and change, to assess the driving forces whic h create both benefits and environmental concerns for
the region, and to c haracterize the current status of environmental conditions related to air, water,
and land resources. The report will serve as a basic referenc e document and the results will help to
guide future study directions.

       Initially Water, Air, Soil samples were collected form respective sites; also the noise levels
were recorded at various junctions. These samples were analysed in a laboratory and reports were
compiled. Following information about Mira-Bhayander was gathered, such as:

a) Topography,
b) Climate,
c) Population

1.2 INTRODUCTION

      Mira-Bhayander is a city, in the district of Thane with an area 79 sq. km., in the western state
of Maharashtra, in India, located around 20 kms to the north of Mumbai on the Mumbai-
Ahmedabad highway. It extends between 18º42’ N to 20º20’ N latitude and 0º25’ E to 73º44’ E.

       Mira-Bhayander area is situated at the northern threshold of Brihan Mumbai Metropolis
and has been identified as one of the growth centers. Mira-Bhayander has gradually developed into
an important residential locality due to its proximity to Mumbai and lower cost of living. Earlier
Bhayander was administrated by the Gram Panchayat system of local government. However
subsequently in accordance with recommendations of MMRDA Mira Bhayander Municipal
Corporation (MBMC) has been constituted for this area on 12 th June 1985. Khari, Ghoddeo,
Ghodbunder, Pen-pada, Mira, Kashi, Navghar, Bhayander and Mahajan wadi are the nine villages
under its jurisdiction. Adjoining villages of the limits of Municipal Corporation are also showing
trend of urbanization. Therefore govt. under its notification extended the limits of MBMC by
including following 10 villages: Chene, Varsave, Rai murdhe, Murdhe, Morva, Uttan, Dongri,
Tarodi Pali Chowk.

       Bhayander is divided into two parts by the Mumbai suburban rail line - East and West. The
West was traditionally residential, and the East was predominantly an industrial area. Recent
population growth and a flurry of construction has blurred the boundaries between Bhayander and
neighbo ring Mira Road on the East side of the rail tracks, turning it into a populous suburb.
Government ow ned Salt Pans and marshland in W est Mira Road have restricted the southward

Enviro Analysts & Engineers Pvt. Ltd.                                                                1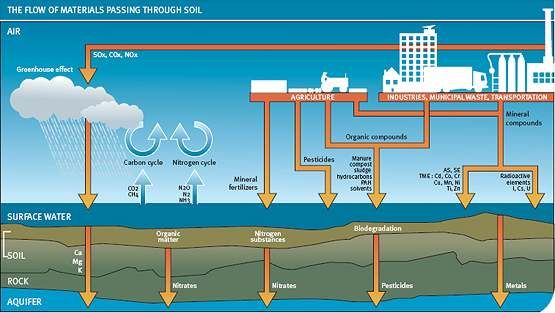
Mira Bhayander Municipal Corporation.                                 Environmental Status Report 2008-2009

spread of Bhayander. Mira road is situated on the island of Salcette. A marshy creek divides Mira
Road from Mumbai. Earlier, Mira Road was divided into two main parts, Shanti Nagar and Naya
Nagar. In recent times, several new localities like Jangid, Silver Park, Beverly Park, and Evershine
Enclave have come up. Shanti Nagar is a cosmopolitan locality.

1.3 TOPOGRAPHY

         It is located in the northern part of the Konkan region to the west of sahyadri hill ranges.
The who le town is on a plain level land. The vasai creek surrounds the city from east to north,
followed by the Arabian Sea, till the west. The Mumbai city is situated on the southwest. To the
south is the Sanjay Gandhi national park and on the southeast thane city. Geographically the city
falls in the Deccan lava terrain. Geologically the city falls in lava terrain. Uttan and Ghodbunder are
hilly regions. The plain terrain forms a wide area of water logged and marshy land.

                                        Figure no. 1.1 Location Map

Enviro Analysts & Engineers Pvt. Ltd.                                                                     2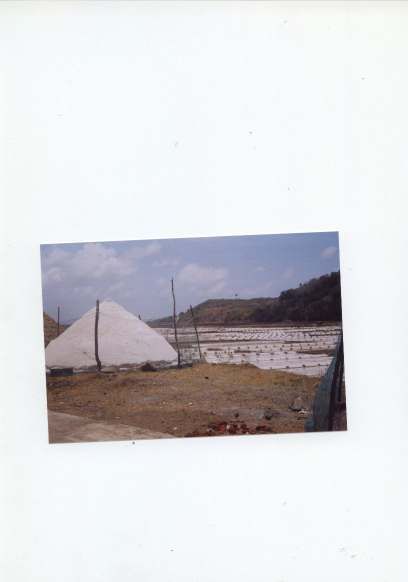
Mira Bhayander Municipal Corporation.                                Environmental Status Report 2008-2009

1.4 METEROLOGY
1.4.1 Climate

      The climate in the month of October is wet and hot followed by cool and pleasant weather
from December to February and dry and hot weather from March to June. The climate of Mira-
Bhayander is typically coastal, sultry and not really hot. There are virtually two distinct seasons,
namely Monsoon and dry season. The later covers both summer and winter.

                                        Table no. 1.1 Climatic Condition

                              Sr.         Season      Max. temp        Min.
                              no.                        ºC          temp ºC
                               1.         Summer        34.57          32.37
                               2.          Winter       20.5           17.6

1.4.2 Rainfall

      The rainy season starts at the beginning of June and ends in the last week of September.
Annual mean rainfall of 2400 mm. the maximum rainfall is in the month of July averaging to 800
mm.

1.4.3 Humidity

The humidity ranges from 49% to 87% with the highest humidity in the month of July.

1.5 DEMOGRAPHY
1.5.1 Distribution of Population

        In year 2008-2009 the population of Mira-Bhayander has been recorded app. 9,00,000. The
total male population is 55% of the total population i.e. 4,95,000 and the total female population is
4,05,000 (45%) of total population. In Mira-Bhayander 1,1 7,000 population is under 6 years of age
i.e. 13% of total population.

                                     Table no. 1.2 : Distribution of Population

                 Sr. No.                Particulars                 Study Area
                    1                Total Population                 9,00,000
                    2                Male Population                  4,95,000
                    3               Female Population                 4,05,000
                    4                Population (0-6)                 1,17,000

1.5.2 Literacy Level

       Mira-Bhayander has an average literacy rate of 81% which is higher than the national
average of 59.5%. In this region, male literacy is found to be 81% of total male population i.e.
4,00,950 and female literacy is 74% i.e. 6,66,000 of total female population.

Enviro Analysts & Engineers Pvt. Ltd.                                                                    3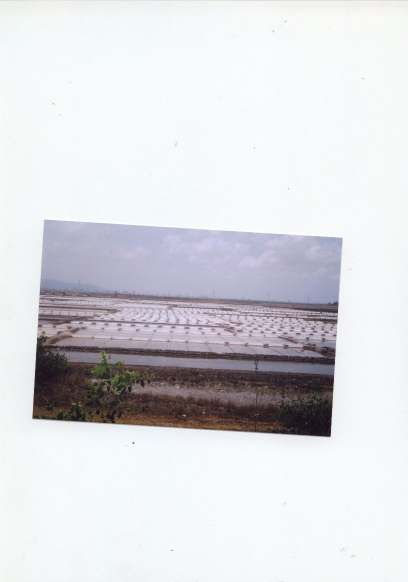
Mira Bhayander Municipal Corporation.                                  Environmental Status Report 2008-2009

                                         Table no. 1.3 : Literacy Level

                 Sr. No.                Particulars                  Oservation
                      1       Total literates                             7,29,000
                      2       Male literates                              4,00,950
                      3       Female literates                            6,66,000
                      4       Average literacy rate (%)                     81%
                      5       Male literacy rate (%)                        81%
                      6       Female literacy rate (%)                      74%

1.6 LAND USE PATT ERN
       The Mira- Bhayander Municipal Corporation area is 79.40sq.km. it was incurred in the
previous BMRDA development plan. The independent development of the plan was sanctioned by
the State Government as per the government rule dated 14 th May 1990. The planning was as
follows;

                                Table no. 1.4: Land use details of study area

           SR. NO.        LAND USE                                        AREA (HECTARES)
               I.         Developed area                                      2034.36
               1.         Residential Area                                           1157.75
               2.         Industrial Area                                             138.29
               3.         Commercial area                                             53.91
               4.         Public Utility                                              251.49
               5.         Transportation                                              254.17
               6.         Open spaces (Playgrounds & gardens)                         175.05
               7.         Graveyard                                                    3.70
                II.       Undeveloped area                                           4554.77
                1.        Barren land & Salt pans                                     139.33
                2.        Forest and Mountain Area                                   1064.96
                3.        Water Logged Area                                          3350.48

                                                                     Residential A rea
                                  AREA (HECTARES)
                                                                     Indust rial Area

                                                                     Commercial area

                                                                     Public utilty

                                                                     Transportation

                                                                     Open spac es (Playgrounds &
                                                                     gardens)
                                                                     Gravey ard

                                                                     Barren land & Salt pans

                                                                     Forest and Mount ain Area

                                                                     Water Logged A rea

              Figure no.1.2: Pie Diagram showing Land Use Pattern of Mira Bhayander

Enviro Analysts & Engineers Pvt. Ltd.                                                                      4
Mira Bhayander Municipal Corporation.                                    Environmental Status Report 2008-2009

 Residential area: In last few years Mira-Bhayander has emerged as the fastest growing suburb of the
  Mumbai City. Due to the increasing population pressure on Mumbai and easy communication facilities for
  commuters going to and coming from Mumbai from Mira- Bhayander, the population has shifted toward s
  the Mira-Bhayander region. As a result large housing complex have come up in this area. This has also lead
  to the development of slum pockets in the area. At present, 13,182 no. of slum household have been
  recorded in the area of which only 10,261 no. are authorized and 2,921 nos. are unauthorized.

 Commercial area: Residential growth of the area has lead to the massive commercial establishment.
  Earlier the commercial activities were limited mainly on Bhayander Uttan road form Bhayander station (W)
  upto Municipal Corporati on offi ce and on east of Bhayander railway station activity was concentrated to
  Balaram Patil road. In last year the area around Mira Bhayander road and Mira – Bhayander Bridge has
  emerged as the largest commercial development of the region. Maxus Mall, Reliance Fresh, Spinach bank,
  Restaurants, showrooms of fam ous brands like Reebok, Woodland, Vijay sales etc. have come up here.
  Further, many banks such as, SBI, Corporation Bank etc. had also open their branches in this region.

 Industrial area: This user covers around 1.59% of the total area. As per the latest records of MBMC there
  are around 383 industrial esta tes wi th around 5000 indu strial galas are existing in the area. It is estimated
  that around 20,000 workers are working in this industrial area.

   Land under Public and Semi public Use : This category includes areas occupied by Educa tional
    institutions such primary and secondary schools, Religious places such as temple, church, mosque etc,
    Government and semi-government offices. It covers nearly 0.151% of the total area.

   Land under open spaces: Mira-Bhayander is bounded by natural water tanks scattered in various parts of
    the town. The municipal corporati on has developed three lakes enriched with proper landscaping viz.
    MBMC Main Office Lake, Goddeo lake and Shivar lake wherein boating activity is also available for
    citizens. The open spaces and recreational grounds are lungs of the town and they cater active and passive
    recreation needs of the city.

       There are several salt pans in Mira-Bhayander region. These Salt pans are shallow man-
made ponds designed to produce salt from sea water. The seawater is fed into large pans and water
is drawn out through natural evaporation which allows the salt to be subsequently harvested.

                                  Figure no. 1.3 Salt pans at Morva gaon

Enviro Analysts & Engineers Pvt. Ltd.                                                                           5
Mira Bhayander Municipal Corporation. Environmental Status Report 2008-2009
CHAPTER - 2
WATER ENVIRONMENTS
2.1 INTRODUCTION
Water is a common chemical substance that is essential to all known forms of life. About
1,460 teratonnes (Tt) of water cover 71% of Earth's surface, with 1.6% of water below ground in
aquifers and 0.001% in the air as vapor, clouds, and precipitation. Saltwater oceans hold 97% of
surface water, glaciers and polar ice caps 2.4%; and other land surface water such as rivers and
lakes 0.025%. When toxic substances enter Lakes, Streams, Rivers, Oceans, and other water bodies,
they get dissolved or lie suspended in water or get deposited on the bed. This results in the
pollution of water whereby the quality of the water deteriorates, affecting aquatic ecosystems.
Pollutants can also seep down and affect the groundwater deposits.
Mira-Bhayander is having a variety of water bodies nearby such as Lakes, Borewell, Creek,
and Nallah. They are regularly monitored to c heck the pollution levels. Virtually all types of water
pollution are harmful to the health of humans and animals. Water pollution may not damage our
health immediately but can be harmful after long term exposure. Different forms of pollutants
affect the health of animals in different ways:
• Heavy metals from industrial processes can accumulate in nearby lakes and rivers. These
are toxic to marine life such as fish and shellfish, and subsequently to the humans who eat
them. Heavy metals can slow development; result in birth defects and some are
carcinogenic.
• Industrial waste often contains many toxic compounds that damage the health of aquatic
animals and those who eat them. Some of the toxins in industrial waste may only have a
mild effect whereas other can be fatal. They can cause immune suppression, reproductive
failure or acute poisoning.
• Microbial pollutants from sewage often result in infectious diseases that infect aquatic life
and terrestrial life through drinking water. Microbial water pollution is a major problem in
the developing world, with diseases such as cholera and typhoid fever being the primary
cause of infant mortality.
• Organic matter and nutrients causes an increase in aerobic algae and depletes oxygen from
the water column. This causes the suffocation of fish and other aquatic organisms.
• Sulfate particles from acid rain can cause harm the health of marine life in the rivers and
lakes it contaminates, and can result in mortality.
• Suspended particles in freshwater reduces the quality of drinking water for humans and the
aquatic environment for marine life. Suspended particles can often reduce the amount of
sunlight penetrating the water, disrupting the growth of photosynthetic plants and micro-
organisms.
• In order to assess the water quality in Mira- Bhayander corporation area three types of
water namely Nalla water, Industrial water, and Bore well water were collected from
different location and analysed
Enviro Analysts & Engineers Pvt. Ltd. 6Mira Bhayander Municipal Corporation. Environmental Status Report 2008-2009
2.2 WATER QUALITY
2.2.1 Municipal / Drinking Water Samples :
Municipal / Drinking water are sampled 20 times per month. The sampling locations are
listed below,
Table no. 2.1: Municipal Water Sampling sites / Locations
Sr.No. Locations
1. Bhayander (W) Village
2. Cabin Road
3. Shanti Nagar
4. Uttan gaon
5. Dongari goan
6. Navghar Road
7. B.P. road
8. Raai village
9. MBMC Water Treatment Plant
10. Golden nest complex
11. Penkar pada
12. Palli village
13. Morva gaon
14. Jesal Park
15. Poonam Sagar Complex
16. Shirdi nagar
17. Asmita tower
18. Naya nagar
19. Versave
20. Ghodbander Road
Average Municipal Water Analysis report is given in table 2.2 for the month of May 2008 to
April 2009.
Enviro Analysts & Engineers Pvt. Ltd. 7Mira Bhayander Municipal Corporation. Environmental Status Report 2008-2009
Table no.2.2 (a): Average Analysis results of Municipal / Drinking water samples from May 2008
– April 2009
STD
PARAMETERS UNITS LIMITS 1 2 3 4 5 6 7 8 9 10
pH - 6.5 – 9.2 7.37 7.25 7.89 7.62 7.55 6.97 6.6 7.14 8.56 8.05
TSS ppm < 100 0 0 0 0 0 0 0 0 0 0
TDS ppm < 1000 25.01 24.87 28.68 35.74 34.96 34.65 40.45 42.75 48.37 50.91
Total Solids ppmMira Bhayander Municipal Corporation. Environmental Status Report 2008-2009
Yearly Average Analysis Results Of Municipal Water Samples
1500
Ph
1400
1300 ppm TSS
1200
ppm TDS
1100
1000 ppm TS
900
A n a ly s is R e s u lts
ppm BOD
800
700 ppm TH
600
ppm TA
500
400 ppm NH3
300
ppm Nitrate
200
100 ppm Inorg PO4
0
std 1 2 3 4 5 6 7 8 9 10 ppm Total PO4
Sampling Locations
Figure – 2.1 (a) Barchart showing Yearly Average Analysis results of Municipal water samples
Note:
Std: Standard limit for Parameter prescribed by MPCB; 1 – 10: Sampling Locations
Enviro Analysts & Engineers Pvt. Ltd. 9Mira Bhayander Municipal Corporation. Environmental Status Report 2008-2009
Table no.2.2 (b): Average Analysis results of Municipal / Drinking water samples from May 2008
– April 2009
STD
PARAMETERS UNITS LIMITS 11 12 13 14 15 16 17 18 19 20
pH - 6.5 – 9.2 7.59 8 6.69 6.86 6.53 7.56 7.48 7.89 7.16 6.94
TSS ppm < 100 0 0 0 0 0 0 0 0 0 0
TDS ppm < 1000 25 34 38 69 46 37 47 55 53 49
Total Solids ppmMira Bhayander Municipal Corporation. Environmental Status Report 2008-2009
Yearly Average Analysis of Municipal Water Samples
1600
Ph
1500
1400 ppm TSS
1300
ppm TDS
1200
1100 ppm TS
An aly sis Resu lts
1000
900 ppm BOD
800
ppm TH
700
600 ppm TA
500
400 ppm NH3
300
ppm Nitrate
200
100 ppm Inorg PO4
0
std 11 12 13 14 15 16 17 18 19 20 ppm Total PO4
Sampling Locations
Figure – 2.1 (b) Barchart showing Yearly Average Analysis results of Municipal water samples
Note:
Std: Standard limit for Parameter prescribed by MPCB; 11 – 20: Sampling Locations
Enviro Analysts & Engineers Pvt. Ltd. 11Mira Bhayander Municipal Corporation. Environmental Status Report 2008-2009
2.2.2 Borewell Water Samples
Borewell water is sampled 20 times per month. The sampling locations are listed below,
Table no. 2.3: Borewell water sampling sites / locations
Sr.No. Locations
1. Raai village
2. Morva gaon
3. Palli village
4. Bhayander (W) Village
5. Dongari goan
6. Naya nagar
7. B.P. road
8. Penkar pada
9. Uttan goan
10. Shirdi nagar
11. Navghar road
12. Cabin Road
13. Bander vadi
14. Mira road station
15. 60 ft. road
16. 90 ft. road
17. Asmita tower
18. Jesal park
19. Gaurav garden
20. Kashimira road
Average Borewell Water Sample Analysis report is given in table 2.4 for the month of May
2008 to April 2009.
Enviro Analysts & Engineers Pvt. Ltd. 12Mira Bhayander Municipal Corporation. Environmental Status Report 2008-2009
Table no.2.4 (a): Average Analysis results of Borewell water samples from May 2008 – April 2009
STD
PARAMETERS UNITS LIMITS 1 2 3 4 5 6 7 8 9 10
pH - 6.5 – 9.2 7.24 7.59 7.38 7.64 7.3 7.57 6.81 6.76 6.85 6.92
TSS ppm < 100 52 24 26 36 59 85 65 74 12 45
TDS ppm < 1000 1135 1271 1422 1824 1874 1061 674 696 659 725
Total Solids ppmMira Bhayander Municipal Corporation. Environmental Status Report 2008-2009
Average Yearly Analysis of Borewell Water Samples pH
1900
1800 ppm TSS
1700
ppm TDS
1600
1500 ppm TS
1400
ppm BOD
1300
A nalysis Results
1200 ppm TH
1100
ppm TA
1000
900
ppm NH3
800
700 ppm Nitrate
600
ppm Inorg PO4
500
400 ppm Total PO4
300
MPN
200
100 Colony / 100ml F.
Coli
0
std 1 2 3 4 5 6 7 8 9 10 Colony / 100ml E.
Sampling Locations Coli
Figure – 2.2 (a) Barchart showing Yearly Average Analysis results of Borewell water samples
Note:
Std: Standard limit for Parameter prescribed by MPCB; 1 – 10: Sampling Locations
Enviro Analysts & Engineers Pvt. Ltd. 14Mira Bhayander Municipal Corporation. Environmental Status Report 2008-2009
Table no.2.4 (b): Average Analysis results of Borewell water samples from May 2008 – April 2009
STD
PARAMETERS UNITS LIMITS 11 12 13 14 15 16 17 18 19 20
pH - 6.5 – 9.2 7.59 8 6.69 6.86 6.53 7.56 7.48 7.89 7.16 6.94
TSS ppm < 100 0 0 0 0 0 0 0 0 0 0
TDS ppm < 1000 25 34 38 69 46 37 47 55 53 49
Total Solids ppmMira Bhayander Municipal Corporation. Environmental Status Report 2008-2009
Yearly Average Analysis of Borewell Water Samples pH
1600
1500 ppm TSS
1400 ppm TDS
1300
ppm TS
1200
1100 ppm BOD
A na ly s is Re s u lts
1000 ppm TH
900
ppm TA
800
700 ppm NH3
600 ppm Nitrate
500
ppm Inorg
400 P O4
300 ppm Total
P O4
200 MPN
100
Colony / 100
0 ml F. Coli
std 11 12 13 14 15 16 17 18 19 20 Colony / 100
Sampling Locations ml E.Coli
Figure – 2.2 (b) Barchart showing Yearly Average Analysis results of Borewell water samples
Note:
Std: Standard limit for Parameter prescribed by MPCB; 11 – 20: Sampling Locations
Enviro Analysts & Engineers Pvt. Ltd. 16Mira Bhayander Municipal Corporation. Environmental Status Report 2008-2009
2.2.3 Ground Water Samples
Water is such an excellent solvent it can contain lots of dissolved chemicals. Since ground
water moves through rocks and subsurface soil, it has a lot of opportunity to dissolve substances as
it moves. For that reason, ground water will often have more dissolved substances than surface
water will.
Even though the ground is an excellent mechanism for filtering out particulate matter, such
as leaves, soil, and bugs, dissolved chemicals and gases can still occur in large enough
concentrations in grou nd water to cause problems. Underground water can get contaminated from
industrial, domestic, and agricultural chemicals from the surface. This includes chemicals such as
pesticides and herbicides that many home owners apply to their lawns.
Naturally occurring contaminants are present in the rocks and sediments. As ground water
flows through sediments, metals such as iron and manganese are dissolved and may later be found
in high concentrations in the water. Industrial discharges, urban activities, agriculture, ground-
water pumpage, and disposal of waste all can affect ground-water quality. Contaminants from
leaking fuel tanks or fuel or toxic chemical spills may enter the ground water and contaminate the
aquifer. Pesticides and fertilizers applied to lawns and crops can accumulate and migrate to the
water table. Ground water is sampled 20 times per month. The sampling locations are listed below,
Enviro Analysts & Engineers Pvt. Ltd. 17Mira Bhayander Municipal Corporation. Environmental Status Report 2008-2009
Table no. 2.5 : Ground water sampling sites / locations
Sr.No. Locations
1. Dongari gaon
2. Shirdi nagar
3. Asmita tower
4. Naya nagar
5. B.P. road
6. Raai village
7. Bander vadi
8. Palli village
9. Morva gaon
10. Golden nest complex
11. Penkar pada
12. Uttan gaon
13. Bhayander (W) Village
14. Cabin Road
15. Shanti Nagar
16. 90 ft. road
17. Poonam Sagar Complex
18. Ghodbander Road
19. Versave
20. 60 ft. road
Average Borewell Water Sample Analysis report is given in table 2.6 for the month of May
2008 to April 2009.
Enviro Analysts & Engineers Pvt. Ltd. 18Mira Bhayander Municipal Corporation. Environmental Status Report 2008-2009
Table no.2.6 (a): Average Analysis results of Ground water samples from May 2008 – April 2009
STD
PARAMETERS UNITS LIMITS 1 2 3 4 5 6 7 8 9 10
pH - 6.5 – 9.2 8.02 7.72 7.86 8.41 7.54 8.62 8.98 8.15 7.63 7.28
TSS ppm < 100 145 110 124 116 131 129 120 99 128 120
TDS ppm < 1000 1028 921 398 375 691 508 356 264 322 550
Total Solids ppmMira Bhayander Municipal Corporation. Environmental Status Report 2008-2009
Yearly Average Analysis of Ground Water Samples pH
1600
1500 ppm TSS
1400
ppm TDS
1300
ppm TS
1200
1100 ppm BOD
Analysis Results
1000 ppm TH
900
ppm TA
800
ppm NH3
700
600 ppm Nitrate
500
ppm Inorg
400 PO4
ppm Total
300
PO4
200 ppm MPN
100
Colony/100
0 ml Fcoli
std 1 2 3 4 5 6 7 8 9 10 Colony/100
Sampling Locat ions ml Ecoli
Figure – 2.3 (a) Barchart showing Yearly Average Analysis results of Ground water samples
Note:
Std: Standard limit for Parameter prescribed by MPCB; 1 –10: Sampling Locations
Enviro Analysts & Engineers Pvt. Ltd. 20Mira Bhayander Municipal Corporation. Environmental Status Report 2008-2009
Table no.2.6 (b): Average Analysis results of Ground water samples from May 2008 – April 2009
STD
PARAMETERS UNITS LIMITS 11 12 13 14 15 16 17 18 19 20
pH - 6.5 – 9.2 7.59 8 6.69 6.86 6.53 7.56 7.48 7.89 7.16 6.94
TSS ppm < 100 0 0 0 0 0 0 0 0 0 0
TDS ppm < 1000 25 34 38 69 46 37 47 55 53 49
Total Solids ppmMira Bhayander Municipal Corporation. Environmental Status Report 2008-2009
Yearly Average Analysis Results of Ground Water Samples
1600 pH
1500 ppmTSS
1400
ppm TDS
1300
ppm TS
1200
1100 ppm BOD
A n aly s is R e s u lts
1000 ppm TH
900
ppm TA
800
ppm NH3
700
ppm Nitrate
600
500 ppm Ing PO4
400 ppm Total PO4
300
MPN
200
Colony/100ml Fcoli
100
0 Colony/100ml Ecoli
std 11 12 13 14 15 16 17 18 19 20
Sampling Locations Colony/100ml Ecoli
Figure – 2.3 (b) Barchart showing Yearly Average Analysis results of Ground water samples
Note:
Std: Standard limit for Parameter prescribed by MPCB; 11 –20: Sampling Locations
Enviro Analysts & Engineers Pvt. Ltd. 22Mira Bhayander Municipal Corporation. Environmental Status Report 2008-2009
2.2.4 River Water Samples
River water is sampled 20 times per month. The sampling locations are listed below,
Table no. 2.7 : River water sampling sites / locations
Sr.No. Locations
1. Bhayander ( W) Village
2. Shreepati Complex
3. Silver Park Road
4. Ghodbander Road
5. Versave Naka
6. Cabin Road
7. Morva Goan
8. Uttan Goan
9. Dongari Goan
10. Naya Nagar
11. B.P. Road
12. Raai Village
13. Shanti Nagar
14. Bander Vadi
15. Pendkar Pada
16. Palli Village
17. Jesal Park
18. Asmita Tower
19. Shirdi Nagar
20. Golden Nest Complex
Average River Water Sample Analysis report is given in table 2.8 for the month of May 2008
to April 2009.
Enviro Analysts & Engineers Pvt. Ltd. 23Mira Bhayander Municipal Corporation. Environmental Status Report 2008-2009
Table no.2.8 (a): Average Analysis results of River water samples from May 2008 – April 2009
STD
PARAMETERS UNITS LIMITS 1 2 3 4 5 6 7 8 9 10
pH - 6.5 – 9.2 6.62 6.59 7.23 7.15 8.24 8.16 7.63 7.54 7.32 7.48
TSS ppm < 100 42 35 74 82 75 60 78 77 46 35
TDS ppm < 1000 150 162 167 123 140 155 128 146 117 147
Total Solids ppmMira Bhayander Municipal Corporation. Environmental Status Report 2008-2009
Yearly Average Analysis of River Water Samples pH
1600
1500 ppm TSS
1400
ppm TDS
1300
ppm TS
1200
1100 ppm BOD
Analysis Results
1000
ppm TH
900
ppm TA
800
700 ppm NH3
600
ppm Nitrate
500
ppm Inorg PO4
400
300 ppm Total PO4
200
ppm MPN
100
Colony/100ml
0 Fcoli
std 1 2 3 4 5 6 7 8 9 10 Colony/100ml
Sampling Locations Ecoli
Figure – 2.4 (a) Barchart showing Yearly Average Analysis results of River water samples
Note:
Std: Standard limit for Parameter prescribed by MPCB; 1 –10: Sampling Locations
Enviro Analysts & Engineers Pvt. Ltd. 25Mira Bhayander Municipal Corporation. Environmental Status Report 2008-2009
Table no.2.8 (b): Average Analysis results of River water samples from May 2008 – April 2009
STD
PARAMETERS UNITS LIMITS 11 12 13 14 15 16 17 18 19 20
pH - 6.5 – 9.2 7.85 7.72 7.08 7.34 7.31 7.22 7.16 8.24 7.34 6.94
TSS ppm < 100 52 45 56 61 57 49 43 32 26 28
TDS ppm < 1000 78.22 70.12 50.8 63.38 55.49 152.4 162 171.2 162.8 156.4
Total Solids ppmMira Bhayander Municipal Corporation. Environmental Status Report 2008-2009
Yearly Average Analysis Results of River Water Samples pH
1600
1500 ppm TSS
1400
ppm TDS
1300
ppm TS
1200
1100 ppm BOD
A n al ysi s R esu l ts
1000 ppm TH
900
ppm TA
800
ppm NH3
700
600 ppm Nitrate
500
ppm Inorg
400 PO4
ppm Total
300
PO4
200 MPN
100
Colony/100ml
0 Fcoli
std 11 12 13 14 15 16 17 18 19 20 Colony/100ml
Sampling Locations Ecoli
Figure – 2.4 (b) Barchart showing Yearly Average Analysis results of River water samples
Note:
Std: Standard limit for Parameter prescribed by MPCB; 11 –20: Sampling Locations
Enviro Analysts & Engineers Pvt. Ltd. 27Mira Bhayander Municipal Corporation. Environmental Status Report 2008-2009
2.2.5 Creek Water Samples
Creek water is sampled 20 tim es per month. The sampling locations are listed below,
Table no. 2.9 : Creek water sampling sites / locations
Sr.No. Locations
1. Shanti Nagar
2. Poonam Sagar Complex
3. Shreepati Complex
4. Silver Park Road
5. Ghodbander Road
6. Versave Naka
7. Uttan Goan
8. Bhayander Chowpatti
9. Palli Village
10. Bhayander (W) Village
11. Cabin Road
12. Shanti Nagar
13. Dongari Goan
14. Raai Village
15. Morva Goan
16. Jesal Park
17. B. P. Road
18. Kashimira Road
19. Old Raviraj Complex
20. Chowk Sea Garden
Average Creek Water Sample Analysis report is given in table 2.10 for the month of May
2008 to April 2009.
Enviro Analysts & Engineers Pvt. Ltd. 28Mira Bhayander Municipal Corporation. Environmental Status Report 2008-2009
Table no.2.10 (a): Average Analysis results of Creek water samples from May 2008 – April 2009
STD
PARAMETERS UNITS LIMITS 1 2 3 4 5 6 7 8 9 10
pH - 6.5 – 9.2 8.04 7.93 7.2 7.8 7.14 8.5 7.4 6.2 8.3 7.5
TSS ppm < 100 78 110 74 65 85 73 96 87 94 83
TDS ppm < 1000 258 423 472 654 536 763 542 612 425 519
Total Solids ppmMira Bhayander Municipal Corporation. Environmental Status Report 2008-2009
1600
Yearly Average Analysis Results of Creek Water Samples pH
1500 ppm TSS
1400
ppm TDS
1300
ppm TS
1200
1100 ppm BOD
1000 ppm TH
A n a ly s is R e s u lts
900
ppm TA
800
ppm NH3
700
600 ppm
Nitrate
500
ppm Inorg
400 PO4
ppm Total
300 PO4
200 MPN
100 Colony/100
ml Fcoli
0
Colony/100
std 1 2 3 4 5 6 7 8 9 10
Sampling Locations ml Ecoli
Figure – 2.5 (a) Barchart showing Yearly Average Analysis results of Creek water samples
Note:
Std: Standard limit for Parameter prescribed by MPCB; 1 –10: Sampling Locations
Enviro Analysts & Engineers Pvt. Ltd. 30Mira Bhayander Municipal Corporation. Environmental Status Report 2008-2009
Table no.2.10 (b): Average Analysis results of Creek water samples from May 2008 – April 2009
STD
PARAMETERS UNITS LIMITS 11 12 13 14 15 16 17 18 19 20
pH - 6.5 – 9.2 7.04 7.11 7.78 8.22 8.18 7.96 7.35 8.49 7.32 7.81
TSS ppm < 100 64 79 60 85 64 74 82 69 45 56
TDS ppm < 1000 654 628 623 649 716 676 714 761 692 743
Total Solids ppmMira Bhayander Municipal Corporation. Environmental Status Report 2008-2009
Yearly Average Analysis Results of Creel W ater Samples pH
1600
1500 ppm TSS
1400 ppm TDS
1300
ppm TS
1200
1100 ppm BOD
An a lys is Re s ult s
1000 ppm TH
900
ppm TA
800
700 ppm NH3
600
ppm Nitrate
500
ppm Inorg PO4
400
300 ppm Total PO4
200
MPN
100
0 Colony/100ml
Fcoli
std 11 12 13 14 15 16 17 18 19 20
Colony/100ml
Sampling Locations Ecoli
Figure – 2.5 (b) Barchart showing Yearly Average Analysis results of Creek water samples
Note:
Std: Standard limit for Parameter prescribed by MPCB; 11 –20: Sampling Locations
Enviro Analysts & Engineers Pvt. Ltd. 32Mira Bhayander Municipal Corporation. Environmental Status Report 2008-2009
2.2.6 Nallah Water Samples
Nallah water is sampled 20 times per month. The sampling locations are listed below,
Table no. 2.11: Nallah water sampling sites / locations
Sr.No. Locations
1. Bhayander (W) Village
2. Cabin Road
3. Morva gaon
4. Uttan gaon
5. Dongari goan
6. Naya nagar
7. B.P. road
8. Raai village
9. Bander vadi
10. Golden nest complex
11. Penkar pada
12. Palli village
13. Poonam Sagar Complex
14. Shirdi nagar
15. Asmita tower
16. Versave Naka
17. Navghar Road
18. Kashimira Road
19. Silver Park Road
20. Uttan Road
Average Nallah Water Sample Analysis report is given in table 2.1 2 for the month of May
2008 to April 2009.
Enviro Analysts & Engineers Pvt. Ltd. 33Mira Bhayander Municipal Corporation. Environmental Status Report 2008-2009
Table no.2.12 (a): Average Analysis results of Nallah water samples from May 2008 – April 2009
STD
PARAMETERS UNITS LIMITS 1 2 3 4 5 6 7 8 9 10
pH - 6.5 – 9.2 9.05 8.87 8.42 7.56 8.12 6.58 8.05 7.81 7.64 9.2
TSS ppm < 100 1123 897 556 578 2231 1025 1187 3014 741 625
TDS ppm < 1000 981 1241 2045 645 4120 553 991 2500 378 4512
Total Solids ppmMira Bhayander Municipal Corporation. Environmental Status Report 2008-2009
Yearly Analysis Results of Nallah Water Sam ples
6750
6500 pH
6250
6000
ppm TSS
5750
5500
5250 ppm TD S
5000
4750
ppm TS
4500
4250
A nalysis Resu lts
4000 ppm B OD
3750
3500
ppm C OD
3250
3000
2750 ppm TH
2500
2250 ppm TA
2000
1750
MPN
1500
1250
1000 Colony/100ml
750 Fcoli
500
Colony/100ml
250
Ecoli
0
std 1 2 3 4 5 6 7 8 9 10
Sampling Locations
Figure – 2.6 (a) Barchart showing Yearly Average Analysis results of Nallah water samples
Note:
Std: Standard limit for Parameter prescribed by MPCB; 1 – 10: Sampling Locations
Enviro Analysts & Engineers Pvt. Ltd. 35Mira Bhayander Municipal Corporation. Environmental Status Report 2008-2009
Table no.2.12 (b): Average Analysis results of Nallah water samples from May 2008 – April 2009
STD
PARAMETERS UNITS LIMITS 11 12 13 14 15 16 17 18 19 20
pH - 6.5 – 9.2 7.4 8.42 7.28 7.26 7.75 7.64 7.62 8.15 8.9 7.4
TSS ppm < 100 275 330 382 269 236 225 362 428 530 286
TDS ppm < 1000 1256 1180 1026 870 786 681 580 640 963 1121
Total Solids ppmMira Bhayander Municipal Corporation. Environmental Status Report 2008-2009
Yearly Analysis Results of Nallah Water Samples
1750
pH
1500
ppm TSS
ppm TDS
1250
ppm TS
A nalysis R esults
ppm BOD
1000
ppm COD
750
ppm TH
ppm TA
500
MPN
250
Colony/100ml
Fcoli
Colony/100ml
0 Ecoli
std 11 12 13 14 15 16 17 18 19 20
Sampling Locations
Figure – 2.6 (b) Barchart showing Yearly Average Analysis results of Nallah water samples
Note:
Std: Standard limit for Parameter prescribed by MPCB; 11 – 20: Sampling Locations
Enviro Analysts & Engineers Pvt. Ltd. 37Mira Bhayander Municipal Corporation. Environmental Status Report 2008-2009
2.2.7 Industrial Water Samples
Industrial water is sampled 20 times per month. The sampling locations are listed below,
Table no. 2.13: Industrial water sampling sites / locations
Sr.No. Locations
1. M.I. Udyog nagar
2. Penkar pada
3. Versave
4. Cabin crossroad
5. Uttan gaon
6. Dongari goan
7. Naya nagar
8. Raai village
9. Bander vadi
10. Golden nest complex
11. Near Thakur Mall
12. MIDC
13. Navghar road
14. Kashimira Road
15. Swami Vivekanand Road
16. 90ft Road
17. Mira - Bhayanader Road
18. B.P.road
19. Palli village
20. Ghodbunder road
Average Industrial Water Sample Analysis report is given in table 2.13 for the month of
May 2008 to April 2009.
Enviro Analysts & Engineers Pvt. Ltd. 38Mira Bhayander Municipal Corporation. Environmental Status Report 2008-2009
Table no.2.14 (a): Average Analysis results of Industrial water samples from May 2008 – April
2009
STD
PARAMETERS UNITS LIMITS 1 2 3 4 5 6 7 8 9 10
pH - 6.5 – 9.2 9.05 8.87 8.42 7.56 8.12 6.58 8.05 7.81 7.64 9.2
TSS ppm < 100 1123 897 556 578 2231 1025 1187 3014 741 625
TDS ppm < 1000 981 1241 2045 645 4120 553 991 2500 378 4512
Total Solids ppmMira Bhayander Municipal Corporation. Environmental Status Report 2008-2009
Yearly Analysis Results of In dustrial Water Samples
6500
6250 pH
6000
5750
ppm TSS
5500
5250
ppm TDS
5000
4750
4500 ppm TS
4250
4000
Analysis Results
ppm BOD
3750
3500
3250 ppm COD
3000
2750 ppm TH
2500
2250
ppm TA
2000
1750
1500 MPN
1250
1000
Colony/10 0
750 ml Fc oli
500
Colony/10 0
250
ml Ecoli
0
std 1 2 3 4 5 6 7 8 9 10
Sampling Locations
Figure – 2.7 (a) Barchart showing Yearly Average Analysis results of Industrial water samples
Note:
Std: Standard limit for Parameter prescribed by MPCB; 1 – 10: Sampling Locations
Enviro Analysts & Engineers Pvt. Ltd. 40Mira Bhayander Municipal Corporation. Environmental Status Report 2008-2009
Table no.2.14 (b): Average Analysis results of Industrial water samples from May 2008 – April
2009
STD
PARAMETERS UNITS LIMITS 1 2 3 4 5 6 7 8 9 10
pH - 6.5 – 9.2 7.39 7.59 7.12 8.37 8.18 7.96 7.62 8.01 7.36 7.88
TSS ppm < 100 123 285 170 158 169 298 385 358 451 514
TDS ppm < 1000 255 285 270 364 312 248 188 207 184 252
Total Solids ppmMira Bhayander Municipal Corporation. Environmental Status Report 2008-2009
Yearly Average Analysis Results of Industrial Water Samples pH
3000
2750 ppm TSS
2500
ppm TDS
2250
A na lys is R es ults
ppm TS
2000
1750 ppm BOD
1500
ppm COD
1250
ppm TH
1000
ppm TA
750
500 MPN
250
Colony/100ml
0 Fcoli
std 11 12 13 14 15 16 17 18 19 20 Colony/100ml
Sampling Locations Ecoli
Figure – 2.7 (b) Barchart showing Yearly Average Analysis results of Industrial water samples
Note:
Std: Standard limit for Parameter prescribed by MPCB; 11 – 20: Sampling Locations
Enviro Analysts & Engineers Pvt. Ltd. 42Mira Bhayander Municipal Corporation. Environmental Status Report 2008-2009
2.2.8 Lake Water Samples
Lake is a low-lying part of the Earth's surface in whic h rainwater, surface water run-off,
outflow from a river, and water from other sources accumulates. Almost half of the world's lakes
are degraded, depleted, and contaminated mainly by human activities. The main causes are inflow
of domestic sewage, agricultural run-off, discharge of industrial effluents, over-fishing,
introduction of exotic species and habitat degradation from population growth, expansion of cities.
Murdha Ram Mandir lake Uttan Moh Lake
Lake water is sampled 20 times per month. The sampling locations are listed below,
Table no. 2..15 : Lake water sampling sites / locations
Sr.No. Locations
1. Sukal lake
2. Mira Goanthan lake
3. MIDC lake
4. Shivar lake
5. Jarimari lake
6. Ghodbunder lake
7. Navghar old lake
8. Navghar new lake
9. Khari lake
10. Mandali lake
11. Gaondevi lake Murdha
12. Ram Mandir lake Murdha
13. Ram Mandir lake Rai
14. Gandhi lake Rai
15. Morva lake.
16. Dev lake Uttan
Enviro Analysts & Engineers Pvt. Ltd. 43Mira Bhayander Municipal Corporation. Environmental Status Report 2008-2009
17. Moha lake Uttan
18. Goddeo lake.
19. Mira Goanthan lake
20. Mandali lake
Average Lake Water Sample Analysis report is given in table 2.15 for the month of May
2008 to April 2009.
Table no.2.16 (a): Average Analysis results of Lake Water samples from May 2008 – April 2009
STD
PARAMETERS UNITS LIMITS 1 2 3 4 5 6 7 8 9 10
pH - 6.5 – 9.2 7.62 8.23 7.29 7.37 7.58 7.56 7.74 8.78 7.56 7.2
TSS ppm < 100 267 129 255 280 115 268 28 194 81 70
TDS ppm < 1000 419 453 391 936 821 360 240 585 220 156
Total Solids ppmMira Bhayander Municipal Corporation. Environmental Status Report 2008-2009
Ye arly Average Analysis Results of Lake W ater Samples
1600 pH
1500 ppm TSS
1400
ppm TDS
1300
ppm TS
1200
ppm BOD
1100
1000 ppm COD
Analysis Results
900 ppm TH
800
ppm TA
700
ppm NH3
600
ppm Nitrate
500
400 ppm Inorg PO4
300 ppm Total PO4
200
MPN
100
Colony/1 00ml
0 Fcoli
std 1 2 3 4 5 6 7 8 9 10 Colony/1 00ml
Sampling Locations Ecoli
Figure – 2.8 (a) Barchart showing Yearly Average Analysis results of Lake Water samples
Note:
Std: Standard limit for Parameter prescribed by MPCB; 1 – 10: Sampling Locations
Enviro Analysts & Engineers Pvt. Ltd. 45Mira Bhayander Municipal Corporation. Environmental Status Report 2008-2009
Table no.2.16 (b): Average Analysis results of Lake Water samples from May 2008 – April 2009
STD
PARAMETERS UNITS LIMITS 11 12 13 14 15 16 17 18 19 20
pH - 6.5 – 9.2 7.22 8.45 7.56 7.81 6.53 7.64 7.92 8.64 8.05 7.79
TSS ppm < 100 110 200 135 147 153 210 88 123 198 196
TDS ppm < 1000 569.3 451.2 332.8 119.9 135.7 564.9 325.8 433.7 314 537
Total Solids ppmMira Bhayander Municipal Corporation. Environmental Status Report 2008-2009
Yearly Average Analysis Results of Lake Water Samples pH
1600
1500 ppm T SS
1400
ppm T DS
1300
ppm T S
1200
ppm BOD
Analysis Results
1100
1000
ppm COD
900 ppm T H
800
ppm T A
700
ppm NH3
600
ppm Nitrate
500
400 ppm Inorg PO4
300 ppm T otal PO4
200
MPN
100
Colony/100ml
0 Fco li
std 11 12 13 14 15 16 17 18 19 20 Colony/100ml
Sampling Locations Ecoli
Figure – 2.8 (b) Barchart showing Yearly Average Analysis results of Lake Water samples
Note:
Std: Standard limit for Parameter prescribed by MPCB; 11 – 20: Sampling Locations
Enviro Analysts & Engineers Pvt. Ltd. 47Mira Bhayander Municipal Corporation. Environmental Status Report 2008- 2009
CHAPTER - 3
ATMOSPHERE
3.1 AIR ENVI R ONMENT
Air pollution is the presence in the atmosphere of one or more contaminants in such quality
and for such duration as is injurious, or tends to be injurious, to human health or welfare, animal or
plant life. It is the contamination of air by the discharge of harmful substances. Air pollution can
cause health problems and it can also damage the enviro nment and property. It has caused
thinning of the protective ozone layer of the atmosphere, whic h is leading to climate change.
Modernization and progress have led to air getting more and more polluted over the years.
Industries, vehicles, increase in the population, and urbanization are some of the major factors
responsible for air pollution.
In Mira-Bhayander air monitoring is done at various locations it includes residential area,
commercial area and solid waste disposal site.
3.2 SOURCES OF AIR POLLUTION
Air pollutants consist of gaseous pollutants, odours, and SPM, (suspended particulate
matter) such as dust, fumes, mist, and smoke. The concentration of these in and near the urban
areas causes severe pollution to the surroundings. The largest sources of human-created air
pollution are energy generation, transportation, and industries that use a great deal of energy
sources. Depending on their source and interactions with other components of the air, they can
have different chemical compositions and health impacts. Since these pollutants are generally
concentrated in and around urban areas, the outdoor urban pollution levels are far higher than in
the rural areas. Fires are another major source of air pollution and can lead to severe problems if the
smoke is inhaled for a period of time. These fires can either be forest fires, oil well fires, burning of
leaves in the backyard or as in the case of rural areas, large-scale burning of agricultural waste.
Other sources include industries and power plants located in these areas.
Table no. 3.1 -Common atmospheric pollution sources and their pollutants
Category Source Emitting pollutants
Agriculture Open burning Suspended particulate matter, carbon
monoxide, volatile organic compounds
Mining and Coal mining; crude oil and Suspended particulate matter, sulphur dioxide,
quarrying gas production; stone oxides of nitrogen, volatile organic compounds
quarrying
Power Electricity; gas; steam Suspended particulate matter, sulphur dioxide,
generation oxides of nitrogen, carbon monoxide, volatile
organic compounds, sulphur trioxide, lead
Transport Combustion engines Suspended particulate matter, sulphur dioxide,
oxides of nitrogen, carbon monoxide, volatile
organic compounds, lead
Community Municipal incinerators Suspended particulate matter, sulphur dioxide,
service oxides of nitrogen, carbon monoxide, volatile
Enviro Analysts & Engineers Pvt. Ltd. 48Mira Bhayander Municipal Corporation. Environmental Status Report 2008- 2009
organic compounds, lead
Indoor air pollution can be particularly hazardous to health as it is released in close
proximity to people. It is stated that a pollutant released indoors is many times more likely to reach
the lung than that released outdoors. In the developing countries a fairly large portion of the
population is dependent on biomass for their energy requirements. These include wood, charcoal,
agricultural residue, and animal waste. Open fires used for cooking and heating are commonly
found in the household both in the rural and the urban areas. The stove is often at floor level,
adding to the risk of accident and the hygiene factor. In addition, they are often not fitted with a
chimney to remove the pollutants. In such households the children and women are most likely to
be affected, as they are the group that spends more time indoors. The main pollutant in this
environment is the SPM. In fact, death due to indoor air pollution, mainly particulate matters, in the
rural areas of India is one of the highest in the world. Many of the deaths are due to acute
respiratory infections in children; others are due to cardiovascular diseases, lung cancer, and
chronic respiratory diseases in adults. If emissions are high and ventilation is poor, household use
of coal and biomass can severely affect the indoor air quality.
Pollutant emis sions per meal are also very high compared to those of other fuels. Household
use of fossil fuel is also fairly common in the developing countries, particularly coal. These are
particularly damaging as they burn inefficiently and emit considerable quantities of air pollutants.
If emissions are high and ventilation poor, then the exposure levels to the gases emitted are far
higher. The most harmful of the gases and agents that are emitted are particulate matter, carbon
dioxide, polycyclic organic matter, and formaldehyde. The indoor concentrations of these are far
higher than the acceptable levels and are cause for concern in rural areas.
3.3 HEALTH IMPACT OF SPECIFIC AIR POLLUTANTS
Some of these gases can seriously and adversely affect the health of the population and
should be given due attention by the concerned authority. The gases mentioned below are mainly
outdoor air pollutants but some of them can and do occur indoor depending on the source and the
circumstances.
Tobacco smoke: Tobacco smoke generates a wide range of harmful chemicals and is a major
cause of ill health, as it is known to cause cancer, not only to the smoker but affecting passive
smokers too. It is well-known that smoking affects the passive smoker (the person who is in the
vicinity of a smoker and is not himself/herself a smoker) ranging from burning sensation in the
eyes or nose, and throat irritation, to cancer, bronchitis, severe asthma, and a decrease in lung
function.
Biological pollutants: These are mostly allergens that can cause asthma, hay fever, and other
allergic diseases.
Volatile organic compounds: Volatile compounds can cause irritation of the eye, nose and
throat. In severe cases there may be headaches, nausea, and loss of coordination. In the longer run,
some of them are suspected to cause damage to the liver and other parts of the body.
Formaldehyde: Exposure causes irritation to the eyes, nose and may cause allergies in some
people.
Enviro Analysts & Engineers Pvt. Ltd. 49Mira Bhayander Municipal Corporation. Environmental Status Report 2008- 2009
Lead: Prolonged exposure can cause damage to the nervous system, digestive problems, and in
some cases cause cancer. It is especially hazardous to small children.
Radon: A radioactive gas that can accumulate inside the house, it originates from the rocks and
soil under the house and its level is dominated by the outdoor air and also to some extent the other
gases being emitted indoors. Exposure to this gas increases the risk of lung cancer.
Ozone: Exposure to this gas makes our eyes itch, burn, and water and it has also been associated
with increase in respiratory disorders such as asthma. It lowers our resistance to colds and
pneumonia.
Oxides of nitrogen: This gas can make children susceptible to respiratory diseases in the
winters.
Carbon monoxide: CO (carbon monoxide) combines with haemoglobin to lessen the amount of
oxygen that enters our blood through our lungs. The binding with other haeme proteins causes
changes in the function of the affected organs such as the brain and the cardiovascular system, and
also the developing foetus. It can impair our concentration, slow our reflexes, and make us
confused and sleepy.
Sulphur dioxide: SO 2 (sulphur dioxide) in the air is caused due to the rise in combustion of fossil
fuels. It can oxidize and form sulphuric acid mist. SO2 in the air leads to diseases of the lung and
other lung disorders such as wheezing and shortness of breath. Long-term effects are more difficult
to ascertain as SO2 exposure is often combined with that of SPM.
SPM (suspended particulate matter): Suspended matter consists of dust, fumes, mist and smoke.
The main chemical component of SPM that is of major concern is lead, others being nickel, arsenic,
and those present in diesel exhaust. These particles when breathed in, lodge in our lung tissues and
cause lung damage and respiratory problems. The importance of SPM as a major pollutant needs
special emphasis as a) it affects more people globally than any other pollutant on a continuing
basis; b) there is more monitoring data available on this than any other pollutant; and c) more
epidemiological evidence has been collected on the exposure to this than to any other pollutant.
3.4 RESPIRABLE SUSPENDED PARTICULATE MATT ER
Particulate matter is characterized according to size - mainly because of the different health
effects associated with particles of different diameters. Particulate matter (PM) is a complex mixture
of tiny particles that consists of dry solid fragments, solid cores with liquid coatings, and small
droplets of liquid. It includes aerosols, smoke, fumes, dust, ash and pollen. These particles vary
greatly in shape, size and chemical composition, and can be made up of many different materials
such as metals, soot, soil, and dust. Particles 10 microns or less in diameter are defined as
"Respirable Suspended Particulate Matter". Respirable particulates, lodge in the lung capillaries and
alveoli, causing adverse health effects. The composition of particulate matter varies with place,
season and weather conditions.
Enviro Analysts & Engineers Pvt. Ltd. 50Mira Bhayander Municipal Corporation. Environmental Status Report 2008- 2009
3.5 SULPH UR DIOXIDE
Sulfur dioxide, or SO 2 , belongs to the family of sulfur oxide gases (SOx). These gases
dissolve easily in water. Sulfur is prevalent in all raw materials, including crude oil, coal, and ore
that contains common metals like aluminum, copper, zinc, lead, and iron. SOx gases are formed
when fuel containing sulfur, such as coal and oil, is burned, and when gasoline is extracted from
oil, or metals are extracted from ore. SO 2 dissolves in water vapor to form acid, and interacts with
other gases and particles in the air to form sulfates and other products that cab be harmful to
people and their environment.
3.6 NITROGEN OXIDES
A nitrogen oxide, or NOx, is the generic term for a group of highly reactive gases, all of
which co ntain nitrogen and oxygen in varying amounts. Many of the nitrogen oxides are colorless
and odorless. However, one common pollutant, nitrogen dioxide (NO 2 ) along with particles in the
air can often be seen as a reddish-brown layer over many urban areas. Nitrogen oxides form when
fuel is burned at high temperatures, as in a combustion process. The primary manmade sources of
NOx are motor vehicles, electric utilities, and other industrial, commercial, and residential sources
that burn fuels. NOx can also be formed naturally.
3.7 SAMPLING LOCATIONS
Sampling of air is done every month from 11 sampling locations. Ambient air quality monitoring
locations are listed below,
Table No. 3.2 Sampling Locations
Sr.No. Sampling Locations name
1 Kashimira Chowk near Chatrapathi Shivaji statue.
2 Junction near Bhayander Police station
3 Mira road railway station.
4 Bhayander East, Cabin road
5 Bhayander East, B.P. road.
6 Bhayander East, Navghar station road
7 Bhayander West, Railway Station
8 S.K. Stone Chowk
9 Uttan naka, (Bus Stop Chowk)
10 Near Pali, St Andrew Chowk
11 Kanakia Police station Mira Road
Yearly Average Analysis report of ambient air samples is given in table 3.3 for the month of May
2008 to April 2009.
Enviro Analysts & Engineers Pvt. Ltd. 51Mira Bhayander Municipal Corporation. Environmental Status Report 2008- 2009
Table No. 3.3 Average Analysis Results of Ambient Air Samples from May 2008 – April 2009
CONCENTRATIONS (µ
µ g/cum)
SAMPLING
SAMPLING SITES RSPM SOx NOx
PERIOD (hrs)
(100µ
µ g/cum)* (80µ
µ g/cum)* (80µ
µ g/cum)*
Kashimira Chowk near Chatrapathi
12 73.2 25.3 18.5
Shivaji statue.
Junction near Bhayander Police station 12 75.4 24.7 10.1
Mira road railway station. 12 66.8 26.4 18.3
Bhayander East, Cabin road 12 89.3 23.7 14.24
Bhayander East, B.P. road. 12 111.2 24.22 15.17
Bhayander East, Navghar station road 12 99.6 29.4 14.22
Bhayander West, Railway Station 12 93.2 27.6 11.56
S.K. Stone Chowk 12 74.6 20.9 18.2
Uttan naka, (Bus Stop Chowk)
12 77.1 23.5 20.3
Near Pali, St Andrew Chowk
12 75.4 29.7 11.6
Kanakia Police station Mira Road 12 55.7 27.3 13.4
Enviro Analysts & Engineers Pvt. Ltd. 52Mira Bhayander Municipal Corporation. Environmental Status Report 2008- 2009
Fi g 3 .1 Bar –Char t sh owi n g Ye ar l y Ave r a ge An al ysi s Re sul t s of Am bi e nt Ai r S am p le s
Yearly Average Analysis Results of Ambient Air Samples
120
100
Analysis Re sults
RSPM(µg
80 /cum)
60 SOx
(µg/cum)
40
NOx
20 (µg/cum)
0
STD 1 2 3 4 5 6 7 8 9 10 11
Sampling Locations
Enviro Analysts & Engineers Pvt. Ltd. 53Mira Bhayander Municipal Corporation. Environmental Status Report 2008- 2009
C H APT E R - 4
SOIL E NVIR ONMENT
4.1 SOI L ENVI R ONMENT
DEFINITION:
Soil pollution is defined as the build-up in soils of persistent toxic compounds, chemicals, salts,
radioactive materials, or disease causing agents, which have adverse effects on plant growth and
animal health.
4.2 SOURCE OF SOIL POLLUTION
There are various means of soil pollution. Soil pollution in Mira – Bhayander is increasing
day by day resulting in poor crop stand along with health hazards of human beings and animals.
Major sources of soil pollution in Mira – Bhayander are as follows:
1. Industrial effluents
2. Sewage Sludge
3. Fertilizers and pesticides application.
4. Non - degradable Solid Waste
5. Bio- medical Waste.
4.3 SOIL SAMPLING LOCATION
Soil Sampling is done quaterly i.e, thrice a year from three sampling locations . Soil
sampling location of Mira – Bhayander is as follows
1) Jesal Park
2) Creek Sediments
3) Near Mira Road railway station
4.4 SOIL ANALY SIS REPORT
Yearly Average Soil analysis report from May – 2008 to April -2009 is as follows,
ORGANIC ORGANIC
SAMPLING pH( 20% EC
CARBON P 2 O5 % K2O % MATTER
SITES suspension) mS/cm
% % per gram
Jesal Park 8.12 0.010 2.61 5.25 10.10 2.61
Creek sediments 7.89 0.12 3.24 6.42 9.8 3.24
Near Mira road
7.69 0.67 2.94 7.54 14.75 2.94
railway station
Enviro Analysts & Engineers Pvt. Ltd. 54Mira Bhayander Municipal Corporation. Environmental Status Report 2008- 2009
Fig – 4.1 Barchart showing Yaerly Average Analysis Results of Soil samples from May 2008 to
April 2009
Yearly Average Analysis Results of Soil Samples
30
25
Analysis Results
20
15
10
5
0
1 2 3
Sampling Locations
pH( 20% suspension) EC mS/cm
ORGANIC CARBON % P2O5 %
K2O% ORGANIC MATTER % per gram
Enviro Analysts & Engineers Pvt. Ltd. 55Mira Bhayander Municipal Corporation. Environmental Status Report 2008- 2009
C H APT E R - 5
NOISE E NVIR ONMENT
5.1 NOI SE ENVI R ONMENT
Noise pollution is displeasing human or machine created sound that disrupts the
environment. The overarching source of most noise worldwide is generated by transportation
systems, principally motor vehicle noise, but also including aircraft noise. Besides transportation
noise, other prominent sources are office equipment, factory machinery, appliances, power tools
and audio entertainment systems.
In Mira-Bhayander noise levels are monitored in different sectors such as Residential &
commercial area and Industrial area. In each month noise levels are recorded with the help of
Noisemeter.
5.2 NOISE SAMPLING LOCATIONS
Table 5.1 Sampling Locations for measuring Noise levels
Sr.No. Sampling Locations name
1 Kashimira Chowk near Chatrapathi Shivaji statue.
2 Junction near Bhayander Police station
3 Mira road railway station.
4 Bhayander East, Cabin road
5 Bhayander East, B.P. road.
6 Bhayander East, Navghar station road
7 Bhayander West, Railway Station
8 S.K. Stone Chowk
9 Uttan naka, (Bus Stop Chowk)
10 Near Pali, St Andrew Chowk
11 Kanakia Police station Mira Road
Enviro Analysts & Engineers Pvt. Ltd. 56Mira Bhayander Municipal Corporation. Environmental Status Report 2008- 2009
Table no. 5.2. – Yearly Average Noise levels measured during May 2008 to April 2009
SITES NOISE LEVELS (dB)
1 59
2 58
3 45
4 65
5 78
6 78
7 65
8 56
9 54
10 78
11 68
Yaerly Average Analysis Results of Noise Levels
90
80
70
Noise levels Measured
60
50
NOISE
40 LEVELS
(dB)
30
20
10
0
1 2 3 4 5 6 7 8 9 10 11
Sampling Locations
Figure no. 5.1 Barchart showing Yearly Average Analysis of Noise levels from May 2008 to April
2009
Enviro Analysts & Engineers Pvt. Ltd. 57Mira Bhayander Municipal Corporation. Environmental Status Report 2008- 2009
C H APT E R – 6
COMP AR A T IV E ST UDIE S
In comparative study the objects are specimens or cases which are similar in some respects
but they differ in some respects. These differences become the focus of examination. The goal is to
find out why the cases are different to reveal the general underlying structure which allows and
generates such a variation.
In this section pollution load of 07-08 and 08-09 is compared. This is done to keep a check on
the pollution levels so that the proper measures can be taken.
6.1 C OMPAR ATI VE STUDY OF WATER SAMP LES
6.1.1 Annual Comparative Study of Minicipal / Drinking Water Samples
Table no. 6.1 Comparison between Municipal Water Samples
Parameters 2007-2008 2008-2009
PH 7.77 7.39
TSS 0 0
TDS 74.88 40.96
TS 52.63 40.96
BOD 0 0
TH 120.47 137.8
TA 85.6 92.1
NH3 0 0
Nitrate 0.38 0.47
Inorganic PO4 0.63 0.50
Total PO4 0.84 0.93
MPN 0 0
F. Coli 0 0
E. Coli 0 0
Municipal water analysis results of previous year and this year are compared, shown in following
graph.
Enviro Analysts & Engineers Pvt. Ltd. 58Mira Bhayander Municipal Corporation. Environmental Status Report 2008- 2009
Comparisio n o f Mu nicipal Water Samples
145
140
135
130
125
120
115
110
105
100
95
90
Analysis Results
85
80
75
70 2007-
65 2008
60
55
2008-
50
2009
45
40
35
30
25
20
15
10
5
0
4
4
li
e
D
PN
S
li
3
H
H
TA
S
TS
O
PO
o
Co
at
TD
H
TS
T
O
P
C
P
itr
N
M
B
ic
al
F.
E.
N
an
ot
g
T
or
In
Parameters
Figure no. 6.1 Barchart showing Comparision between Analysis Results of Municipal Water
Samples
The graphical representations shown that the analysed values for this year are slightly on higher
side than the previous year.
6.1.2 Annual Comparative Study of Borewell Water Samples
Table no.6.2 Comparison between Borewell Water
Parameters 2007-2008 2008-2009
PH 7.24 7.41
TSS 67.21 54.85
TDS 462.7 598.1
TS 625.31 799.85
BOD 20.69 22.65
TH 241.20 125.6
TA 96.58 108.7
NH3 0.10 0.16
Nitrate 0.30 0.22
Inorganic PO4 0.25 0.30
Enviro Analysts & Engineers Pvt. Ltd. 59You can also read