The 1921 European drought: impacts, reconstruction and drivers
←
→
Page content transcription
If your browser does not render page correctly, please read the page content below
Clim. Past, 17, 2201–2221, 2021
https://doi.org/10.5194/cp-17-2201-2021
© Author(s) 2021. This work is distributed under
the Creative Commons Attribution 4.0 License.

The 1921 European drought: impacts, reconstruction and drivers
Gerard van der Schrier1 , Richard P. Allan2,3 , Albert Ossó4 , Pedro M. Sousa11 , Hans Van de Vyver5 , Bert Van
Schaeybroeck5 , Roberto Coscarelli6 , Angela A. Pasqua6 , Olga Petrucci6 , Mary Curley7 , Mirosław Mietus8 ,
Janusz Filipiak9 , Petr Štěpánek10 , Pavel Zahradníček10 , Rudolf Brázdil10,11 , Ladislava Řezníčková10,11 ,
Else J. M. van den Besselaar2 , Ricardo Trigo12 , and Enric Aguilar13
1 Royal  Netherlands Meteorological Institute, De Bilt, the Netherlands
2 Department    of Meteorology, University of Reading, Reading, United Kingdom
3 National Centre for Earth Observation, University of Reading, Reading, United Kingdom
4 Wegener Center for Climate and Global Change, University of Graz, Graz, Austria
5 Royal Meteorological Institute, Uccle, Belgium
6 National Research Council of Italy, Research Institute for Geo-Hydrological Protection CNR-IRPI, Rende, Italy
7 Met Éireann, Dublin, Ireland
8 Institute of Meteorology and Water Management, Warsaw, Poland
9 Department of Meteorology and Climatology, Institute of Geography, Faculty of Oceanography and Geography,

University of Gdańsk, Gdańsk, Poland
10 Global Change Research Institute, Czech Academy of Sciences, Brno, Czech Republic
11 Institute of Geography, Masaryk University, Brno, Czech Republic
12 Instituto Dom Luiz (IDL), Faculdade de Ciências, Universidade de Lisboa, 1749-016 Lisboa, Portugal
13 Center for Climate Change (C3), Universtitat Rovira i Virgili, Tarragona, Spain

Correspondence: Gerard van der Schrier (schrier@knmi.nl)

Received: 16 April 2021 – Discussion started: 21 April 2021
Revised: 26 July 2021 – Accepted: 5 August 2021 – Published: 21 October 2021

Abstract. The European drought of 1921 is assessed in              angle between Brussels, Paris and Lyon, but a vast stretch of
terms of its impacts on society and in terms of its physical       the continent, from Ireland to the Ukraine, was affected. The
characteristics. The development of impacts of the drought         reported impacts on water supply and water-borne transport
are categorized by a systematic survey of newspaper reports        in that region were matched by an analysis of the hydrologi-
from five European newspapers covering the area from Eng-          cal situation over the Seine catchment. On average, the 1921
land to the Czech Republic and other parts of Europe. This         summer was not particularly hot, but the heatwave which
is coupled to a reconstruction of daily temperature and pre-       was observed at the end of July saw temperatures match-
cipitation based on meteorological measurements to quan-           ing those of the heatwaves in modern summers. Similar to
tify the drought severity and extent, and reanalysis data are      modern droughts, an anticyclone was present roughly over
used to identify its drivers. This analysis shows that the first   the British Isles, maintaining sunny and dry weather in Eu-
impacts of the drought started to appear in early spring and       rope and steering away cyclones to the north. Its persistence
lingered on until well into autumn and winter, affecting wa-       makes it exceptional in comparison to modern droughts.
ter supply and agriculture and livestock farming. The domi-           The 1921 drought stands out as the most severe and most
nant impact in western Europe is on agriculture and livestock      widespread drought in Europe since the start of the 20th cen-
farming while in central Europe the effects of wildfires were      tury. The precipitation deficit in all seasons was large, but in
reported on most often. The peak in the number of reports is       none of the seasons in 1920 and 1921 was the precipitation
in late summer. Preceding the first impacts was the dry au-        deficit the largest on record. The severity of the 1921 drought
tumn of 1920 and winter 1920–1921. The area hardest hit by         relates to the conservative nature of drought which amplifies
the drought in the following spring and summer was the tri-

Published by Copernicus Publications on behalf of the European Geosciences Union.
2202                                                                                     G. van der Schrier et al.: 1921 drought

the lack of precipitation in autumn and winter into the fol-        of historic droughts is needed to put recent events in per-
lowing spring and summer.                                           spective. An early overview of the 1921 drought for Europe
                                                                    is provided by Eredia (1923) of which an English summary is
                                                                    provided by Bonacina (1923), for the British Isles by Brooks
1   Introduction                                                    and Glasspoole (1922) and for the French Dauphine region
                                                                    by Blanchard (1922). More recently Brázdil et al. (2015)
Drought is one of the most costly natural disasters (Van La-        analysed the 1921 drought for the Czech Republic.
nen et al., 2016). The severe drought that affected large
areas of Europe in 2018 resulted in widespread losses in
agriculture and forestry and produced an overall loss of            2     Impacts of the 1921 drought
around EUR 3.3 billion, making it the year’s costliest event
in Europe (MunichRe, 2019). A comprehensive view of past            This section describes the 1921 drought in terms of its con-
drought events based on the long instrumental records ex-           sequences on socioeconomic and environmental systems, i.e.
tending back into the 19th century is, however, far from com-       its negative impacts (Blauhut et al., 2015). The information
plete yet highly essential in order to put the recent European      used in this section is almost exclusively based on text-based
droughts (2003, 2010, 2013, 2015, 2018) and future ones into        reports. The 1921 drought is described by its physical charac-
perspective (Hanel et al., 2018). Changes in droughts in a fu-      teristics, like the reduction of precipitation, the loss of mois-
ture warming world may vary strongly between regions and            ture to the overlying atmosphere and the associated increase
models (e.g. Cook et al., 2019; Naumann et al., 2018; Stagge        in air temperature, in Sects. 3 and 4.
et al., 2017; Trenberth et al., 2014), but models consistently
project more frequent and severe droughts over the Mediter-         2.1    Impact analysis on text-based reports
ranean region (Spinoni et al., 2018). A deep understanding
of past extreme events matters from an attribution perspec-         A systematic effort was made to review the impacts of the
tive, and recently different frameworks have been proposed          1921 drought. This was done by collecting text-based reports
to address the anthropogenic influences on specific events          from five digitized newspapers which reported drought im-
(e.g. Zahradníček et al., 2015; Brázdil et al., 2016, 2019; Har-   pacts. The period for which the newspapers were reviewed
rington et al., 2019).                                              was from 1 January to 31 December 1921. Different selected
   Droughts are often viewed from a climatic perspective            newspapers were explored through their digital archives by
where a host of indicators are available based on meteoro-          means of the search term “drought” (in each of the native
logical parameters (e.g. McKee et al., 1993; van der Schrier        languages). Text-based reports from the following digitized
et al., 2006; Vicente-Serrano et al., 2010). A more system-         newspapers were used: the Birmingham Gazette (United
atic way of combining the physical and impact dimensions            Kingdom), Algemeen Handelsblad (the Netherlands), De
of drought is necessary (Stahl et al., 2016), particularly for      Standaard (Belgium), Berliner Tageszeitung (Germany) and
historical events from the first half of the 20th century which     Lidové noviny (the Czech Republic). These papers can be ac-
are never assessed in detail, often due to the lack of sufficient   cessed through their digital archives (web addresses are pro-
meteorological and documentary data. The aim of this study          vided in the Acknowledgements).
is therefore to provide a more holistic description of the ex-         The newspaper clippings were classified into major im-
ceptional drought that hit Europe in 1921. An overview of           pact categories, each of which had a number of subtypes.
the impacts which this drought had on the various sectors of        The classification follows the pioneering work of Stahl et al.
European society is presented, along with a reconstruction          (2016, their Table A2), and each report is labelled by area
of the severity and spatiotemporal drought extent in terms of       or place and date. The distribution of these categories and
meteorological and climatological indices and a description         types was then analysed over time for the five newspapers
of the drivers of this drought.                                     and taken to be representative for the related countries.
   The principal motivation to focus on 1921 is that this 100-         In addition to this systematic effort, a more ad hoc ap-
year old climatic extreme is the driest year since the start        proach was taken for Ireland, northern Italy and the Alpine
of the 20th century for Europe in terms of area affected            region, France, and Poland. Newspaper-based reports on im-
(van der Schrier et al., 2006; Hanel et al., 2018). The drought     pacts and reported impacts in scientific publications from that
of 1921 affected a large part of Europe and extended east up        period were used to identify impacts which were prominent
to the Volga region and Ural mountains (Cook et al., 2020)          in the reporting.
where it contributed to the famine in Russia of 1921–1922              Recently, Cheval et al. (2021) used the digital archives of
(Fisher, 1927). With the recent dry years in Europe (Re-            Romanian newspapers to construct a dataset of observed me-
betez et al., 2006; Barriopedro etal., 2011; Buitink et al.,        teorological events and observed that this approach to cli-
2020) and the discussion in the literature of a possible in-        mate reconstruction has been used more often. In this paper,
crease in drought frequency or severity (Trenberth et al.,          the newspaper clippings are used to assess the impact of the
2014; Spinoni et al., 2018), a complete and detailed record         climatic extreme rather than to describe the event itself.

Clim. Past, 17, 2201–2221, 2021                                                        https://doi.org/10.5194/cp-17-2201-2021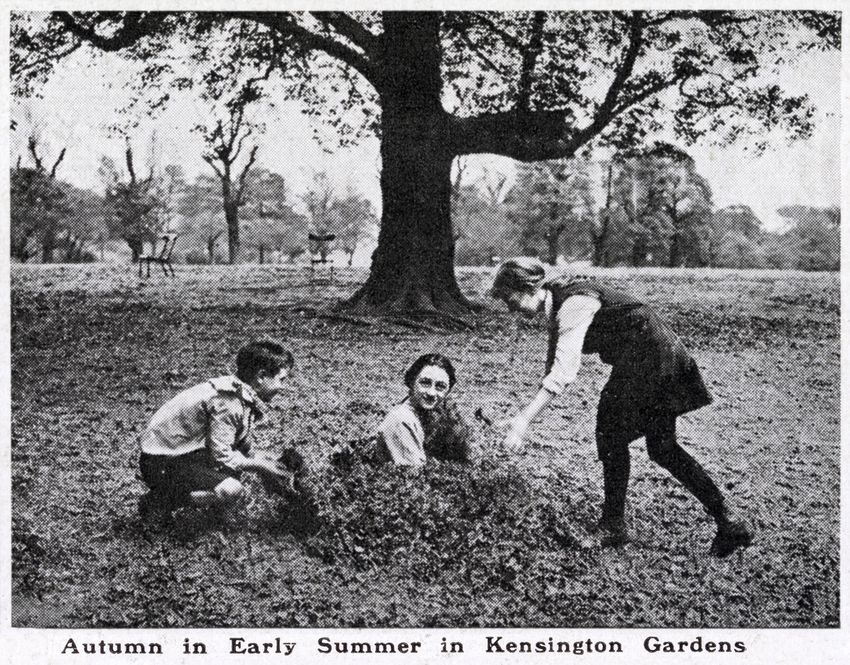
G. van der Schrier et al.: 1921 drought                                                                                                  2203

Figure 1. Graphs showing reported impact type for the United Kingdom, the Netherlands, Belgium, Germany and the Czech Republic (top
to bottom). The vertical axis shows the number of reports, the horizontal axis shows the date associated with the publication of the text-based
report. Below each impact graph, the weekly sum of rainfall, averaged over the country and as the ratio with the corresponding climatological
period, is shown where brown relates to lower-than-expected values. In the background, daily maximum temperatures, averaged over the
country, are shown as deviations from the climatology. Temperature and precipitation data are based on the E-OBS dataset introduced in this
study.

https://doi.org/10.5194/cp-17-2201-2021                                                                Clim. Past, 17, 2201–2221, 2021
2204                                                                                      G. van der Schrier et al.: 1921 drought

   Figure 1 shows the impact-categorization statistics for the      much in the Netherlands. Although the water level in the
five countries aggregated in 7 d periods (Sunday–Saturday).         Rhine (where it enters the Netherlands) was at an all-time
The colour coding relates to the main impact categories de-         low from spring to autumn 1921, it remained possible to nav-
fined by Stahl et al. (2016). Table 1 summarizes, for each of       igate the Dutch part of the river (Boris Teunis, Rijkswater-
these countries, the earliest, latest and top three most reported   staat, personal communication, 2019). However, the Meuse,
impacts. The most frequently covered impacts across coun-           with its catchment in France, Belgium and the Netherlands,
tries relate to agriculture and livestock farming with the ex-      was completely dry in the southeastern part of the Nether-
ception of the Czech Republic where this impact ranks only          lands4 . Photograph A3 shows that in the north of the Nether-
third and wildfires are reported most often. An indirect illus-     lands, the canals were completely dry at the end of summer.
tration of the impact of drought on agriculture is provided            The impact categorization scheme (Stahl et al., 2016) gives
by photograph A1, showing children playing with leaves that         the main impact category and a more detailed impact type
have been shed in the period of drought. Such scenes are also       within each category. This facilitates further differentiation
witnessed in city parks in the Netherlands1 and in the Dutch        of impacts. Figure 2 shows for the five countries within
apple orchards2 .                                                   “Agriculture and livestock farming” the eight impact types
   The most reported impacts that occur the earliest in the         and for “Public water supply” the seven impact types. This
year are different among the countries, but both Belgium            shows that the impact “Reduced productivity of annual crop
(BE) and Germany (DE) report the earliest on effects on wa-         cultivation” dominates the agricultural impacts. The decision
terborne transportation. Photograph A2 documents the low            to sell livestock in response to the drought was reported par-
water levels in the Rhine falls near Neuhausen (Switzerland)        ticularly often in the Czech Republic. For the “Public wa-
in March 1921, which will be illustrative for other rivers in       ter supply”, limitations of use to households (combined ru-
the area. For most countries, the effects on water supply and       ral and urban areas) was reported on most often. Effects of
agriculture and livestock farming persist until the end of the      the limited supply of drinking water are illustrated in pho-
year.                                                               tographs A4 and A5, where water from smaller rivers in cen-
   The period with the largest number of reports is in July         tral and southeast Netherlands is used in addition to the water
1921. For the United Kingdom and Belgium this peak takes            supply in households.
place in the week of 17 July, the Netherlands (NL) has the             In many reports, particularly those from the Netherlands
largest amount of reports in the week of 24 July, and Ger-          and England, the late spring frost of 1921 was mentioned as
many and the Czech Republic (CZ) in the week of 31 July,            an additional setback for farmers. However, an analysis of
showing a clear west–east time shift. The timing of these re-       the Julian day with the last night with frost using the mete-
ports coincides with the heatwave peak in Europe, with tem-         orological station data did not show a significant difference
peratures peaking in London around July 19 and in Paris (and        between the 1921 last spring frost and 1981–2010 climato-
in about 75 % of France) on 28 July to 38.4 ◦ C, the latter         logical mean values of the last spring frost.
not seen since 18813 (more on the heatwave in Sect. 4.4 and
Fig. 9). Figure 1 also shows anomalous daily maximum tem-
perature and rainfall ratios (with respect to the 1981–2010         2.2     Recorded regional impact of the 1921 drought
climatology), averaged over the respective countries, super-        2.2.1    North Italy and the Alpine region
posed on the impact information. For all five countries, the
peaks in reported impacts follows periods of sustained high         The 1921 drought in Italy was preceded by dry conditions
temperatures or peaks in temperatures. Similarly, the peak in       in 1920, and the first reports on its impact appeared in mid-
reported impacts are at the end of a long period of below-          November 1920 as a lower harvest for some products, espe-
normal precipitation, although the length of the dry spell          cially cereals, due to the persistent drought. The dry condi-
varies from country to country. The countries with a long           tions starting in autumn 1920 led to a dramatic decrease in
period of below-normal precipitation show a more gradual            water levels in Italian rivers, streams and lakes, especially
build-up of the number of reported impacts (like GB, NL,            those that came from the Alps. Recently, a reconstruction of
BE) whereas DE en CZ show a more sudden increase in re-             monthly precipitation of the Abba basin in northern Italy for
ports following a relatively short dry period. Less clear is the    the period 1800–2016 (Crespi et al., 2021) confirms these
relation of a decrease in reported impacts with the decrease        reports as the annual precipitation sum over the Abba basin
in temperatures and the short-lived wet period in August.           was observed to be the lowest on record. Dry conditions in
   Impacts on waterborne transportation are reported on rel-        the Alpine region are reflected by the situation in Switzerland
atively often in Belgium and especially Germany and not so          where, following a rainy summer in 1920, a deficiency of pre-
                                                                    cipitation started in winter 1920–1921 and continued until
   1 de Telegraaf, 21 July 1921; Algemeen Handelsblad, 26 July      the 1921 autumn. Salter (1921) wrote that the 1921 drought
1921.                                                               in Switzerland was the driest period since 1788.
   2 Algemeen Handelsblad, 10 July, 22 July and 4 August 1921.
   3 Le Figaro, 29 July 1921.                                          4 De Telegraaf, 15 July 1921.

Clim. Past, 17, 2201–2221, 2021                                                        https://doi.org/10.5194/cp-17-2201-2021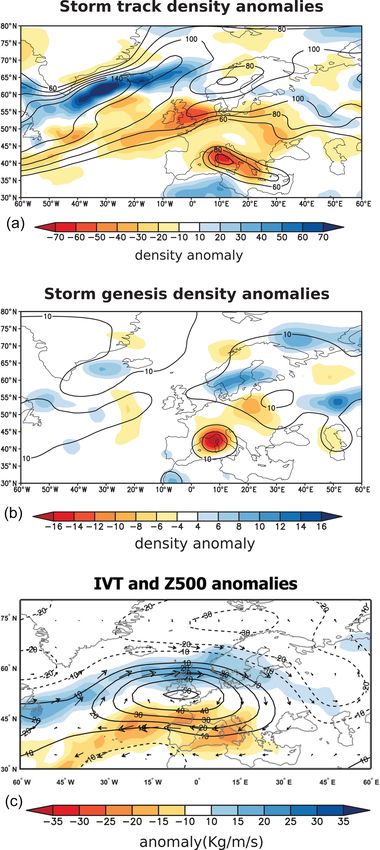
G. van der Schrier et al.: 1921 drought                                                                                                   2205

Table 1. Earliest and latest reported impacts for the five countries, and the top three of the most reported impacts for 1921.

              Earliest             First                Second                    Third                       Last
       UK     agriculture and      agriculture and      wildfires                 human health                water supply
              livestock farming    livestock farming
       NL     wildfires            agriculture and      water supply              wildfires, human health,    water supply
                                   livestock farming                              water quality
       BE     waterborne           agriculture and      water supply              wildfires                   human health, agriculture
              transportation       livestock farming                                                          and livestock farming
       DE     waterborne           agriculture and      wildfires, waterborne     energy and industry,        agriculture and
              transportation       livestock farming    transportation            water supply                livestock farming
       CZ     soil system          wildfires            water supply              agriculture and             water supply
                                                                                  livestock farming

Figure 2. Reported impact types in public water supply (a) and agriculture and livestock farming (b) for the five countries.

   Interestingly, the dry winter 1920/21 in Switzerland was               with complete hills prey to the fires. In the Trentino region,
reflected in an impact on the tourism sector; the Birmingham              the substantial decrease in water level in a lake exposed a
Gazette of 16 March 1921 reports on “disappointed tourists                white stone put on a rock with an inscription in remembrance
[which] are leaving the country in large numbers”.                        of the low lake level during the drought event of 1806. The
   In January 1921, hydro-powered electricity production                  water level in the “Lago Maggiore” lake decreased by about
was scarce because of the low water levels in dam reser-                  2 m below the normal level in this period, forcing the steamer
voirs, and the problem intensified in autumn 1921 and win-                lines to change the landing place in several stations around
ter 1921/22. Several provinces of northern Italy established              the lake.
severe reductions on the use of electrical energy, for indus-
tries, homes, cinemas, public/private offices and shops. This
meant that major cities in northern Italy were without light              2.2.2    Ireland
or light was rationed and industries and transportation (loco-
                                                                          At the end of April and early May, reports began to appear
motives) ceased operation. The water shortages at the start
                                                                          in the Irish newspapers that water reservoirs and rivers were
of 1921 affected the agricultural sector: cattle were sold be-
                                                                          lower than normal for the time of year, and the public were
fore they died of thirst and lack of fodder. Drinking water be-
                                                                          urged to economize water usage as much as possible. By June
came scarce, with queues for public fountains, and villages
                                                                          the drought had started to affect livestock, grass growth was
were without water, requiring marches of several kilometres
                                                                          poor and crops in many parts of the country were reported
to fetch water. A review in La Stampa of mid-December 1921
                                                                          to be suffering. In the second half of June there continued
reports that throughout Upper Italy the water reserves were
                                                                          to be anxiety over the development of crops due to the al-
close to exhaustion, impacting on hygiene and deteriorating
                                                                          most entire absence of rain, the late spring frosts and the low
the quality of the water. Large-scale wildfires were observed,
                                                                          night temperatures. There were reports of water supplies be-

https://doi.org/10.5194/cp-17-2201-2021                                                                  Clim. Past, 17, 2201–2221, 2021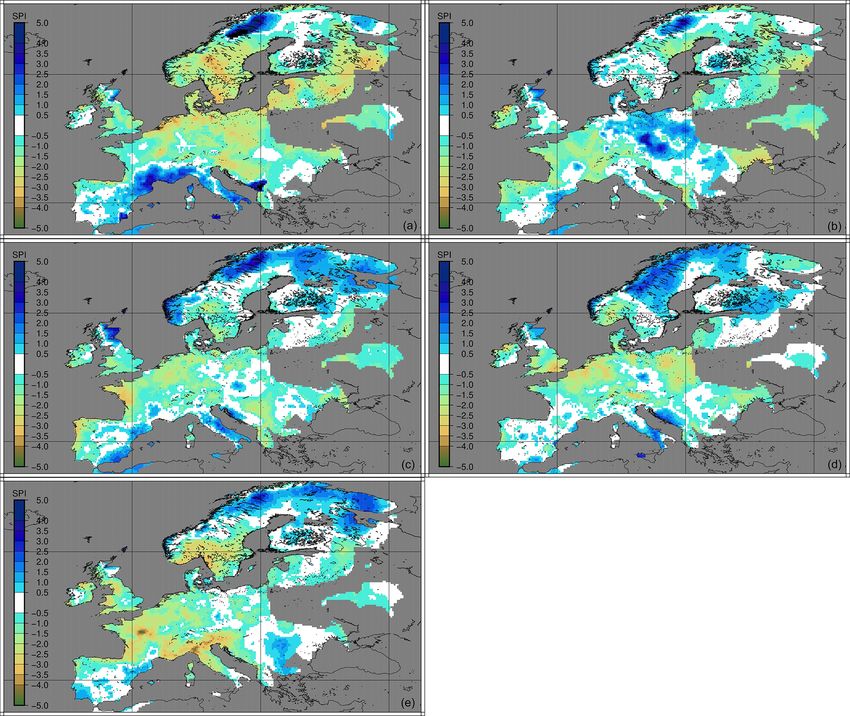
2206 G. van der Schrier et al.: 1921 drought
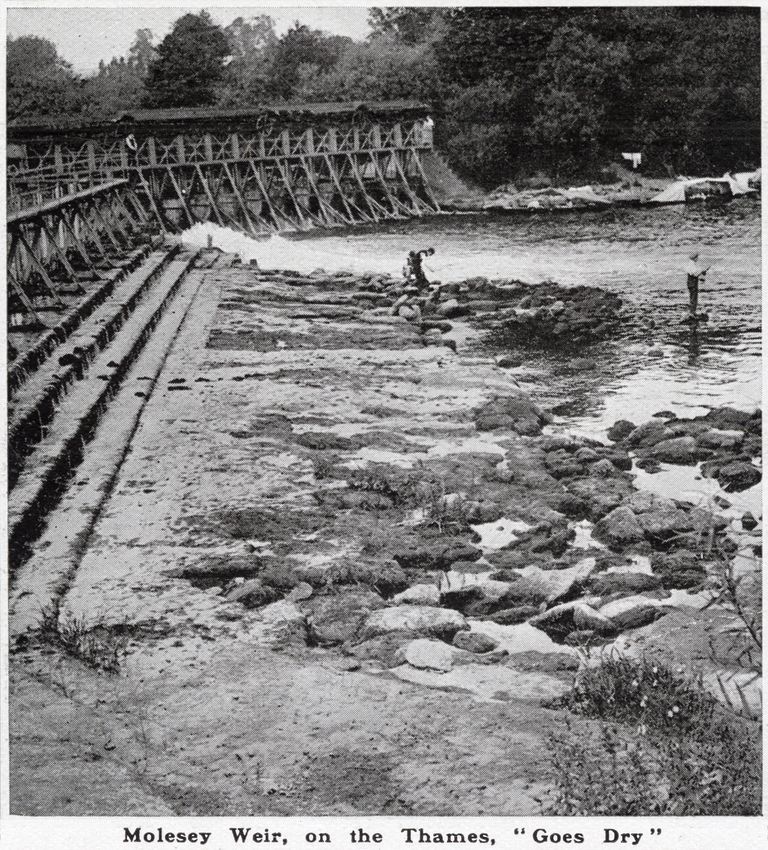
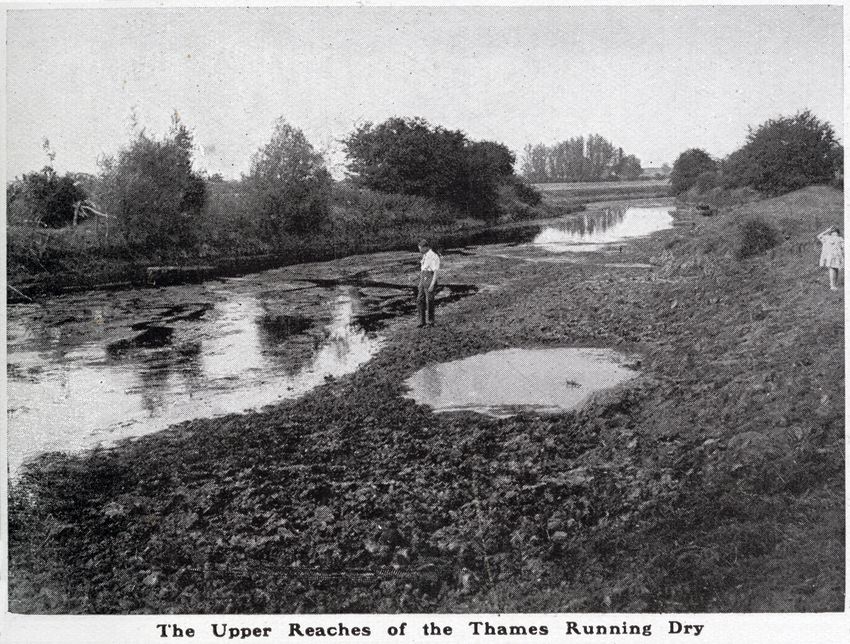
ing shut down in some parts of the country at night and by in eastern and southern England amounted to between 50 %
the end of the month there were serious concerns in Dublin and 60 % of the normal value (Meteorological Office, 1922).
that the Vartry reservoir would run dry. In July, newspaper The Met Office report for the rainfall for 1921 argues that it
reports stated that the drought still prevailed in all parts of was the most remarkable for the period of about 100 years
the country and there were fears of water famine. Further ap- over which rainfall has been recorded, and that 1921 was the
peals were made for citizens to be strictly economical in the driest year in London for practically a century and a half.
use of water. Ponds and rivers that had not been seen dry by Over the Thames Estuary rain fell on less than 100 d during
the oldest inhabitants were completely dried up in some ar- the year. The impact of the exceptionally low number of rainy
eas. Thousands of cattle had to be driven for miles daily to days is documented in photographs A6 and A7, showing low
be watered, and many cows in all parts of the country were water levels in the Thames estuary during the second half of
ceasing to give milk. August 1921.
The sunny and stable weather made for an early harvest. The overview of London weather from 1841 to 1949 (Mar-
In some cornfields bordering the sea in the Hook, Co. Wex- shall, 1952) had 1921 as the driest year by far with only
ford district, the oat production was so poor owing to the 100 mm rainfall. Only January had normal rainfall amounts.
great drought that the crop had to be cut and gathered up like Partial drought conditions (in which mean daily rainfall does
hay. However, the drought did not affect the winter wheat not exceed 0.4 mm – a threshold in use at the time at the UK
crop, contrasting with the situation of the pastures which was Met Office) span the period from 10 May until 12 August 12.
hardly short of disastrous, particularly for grazers. The drought peaked between 4–19 June and 20 September–
13 October when precipitation on each of these days was be-
2.2.3 France
low 0.4 mm. These contemporary reports are confirmed by
a review of major droughts in England and Wales, in which
The dry period which started in the last quarter of 1920 had Cole and Marsh (2006) classify the 1921–1922 drought as a
the consequence of a general lowering of groundwater tables “Major Drought”’ with the second lowest 6-month and third
and a significant decrease in the flow of rivers. An example lowest 12-month rainfall totals for England and Wales, af-
is the Seine basin where the small rivers in the Champagne fecting most of the UK. The drought had major soil water
region ran dry and in particular the Somme, the source of impacts in the latter half of 1921, heralding low ground wa-
which was dry since 20 September 1920 (P., 1921). The re- ter levels in 1922.
duction in streamflow impacted on the extensive canal sys- The film news of Pathé (British Pathé, 1921) vividly pre-
tem in northern France, causing serious inconvenience in the sented the consequences of the drought of 1921. The film is
operation of inland waterways. Traffic on the Canal de Bour- produced on 28 July 1921, a week after newspapers reported
gogne stopped and traffic on the Rhône–Rhine canal between an “unparalleled heat wave” on 19 July5 which had tempera-
Strassbourg and Montreux-Chateau was strongly reduced (P., tures in excess of 30 ◦ C in the West Midlands, the south-west,
1921). southeast and the east of England. The film bears the title
The succession of rainfall deficits for five consecutive The peril of the drought and the subtitle (Burning crops and
quarters in France, with the autumn of 1921 being particu- stacks menace our winter food supplies) reflects the fears that
larly dry, had repercussions on the production of hydroelec- the British were at risk of being deprived of their harvests for
tric energy and on the supply of drinking water for large the coming winter, with the food rationing still fresh in their
cities like Grenoble, Chambéry, and Gap due to rapid and sig- memories. The movie shows fields and haystacks on fire as
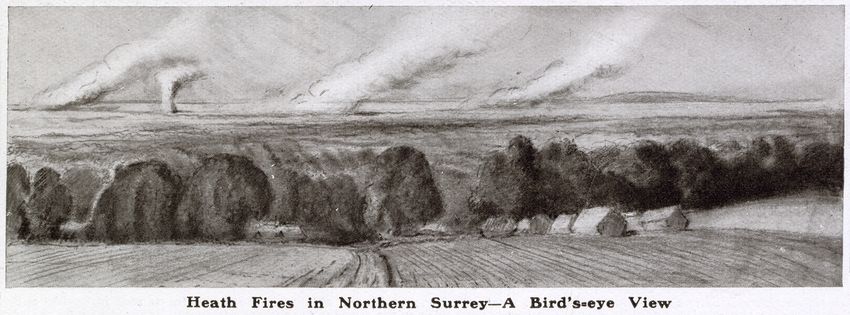
nificant drops in underground aquifers deprived of recharge firemen try to put them out. Wildfires are also reported on
(Duband et al., 2004). Duband et al. (2004) observed that most often in the British written press (Fig. 1), and photo-
1921 had the lowest annual flow for the Rhine and Rhone graph A8 documents a scene with several wildfires in north-
and second lowest for the Loire and Seine (1949 was slightly ern Surrey during early September.
lower) in a 150-year record.
The dry conditions in summer 1921 coincided with a heat-
2.2.5 Poland
wave, which will be quantified in Sect. 4.4. The newspaper
Le Figaro (29 July 1921) describes a short-lived wind from A striking impact of the 1921 drought in Poland were its
the south advecting hot and dry air into the capital, in the many fires, the largest of which occurred in August. These
height of the heatwave. To protect themselves from the heat, include the one on 7 August in the town of Pińsk (popu-
Parisians held wet clothes before their faces and wore wet lation in 1921: 23 497), eastern Poland, where loss of life
shirts. was reported and a third of the town, predominantly built of
wood, was destroyed, including the town centre and an al-
2.2.4 United Kingdom most 1000-year-old synagogue. The losses were so great that
the Polish Government decided to move the authorities of the
Publications following the 1921 drought highlight the scale
and severity of this event. The rainfall deficiencies for 1921 5 The Register (Adelaide) 20 July 1921.
Clim. Past, 17, 2201–2221, 2021 https://doi.org/10.5194/cp-17-2201-2021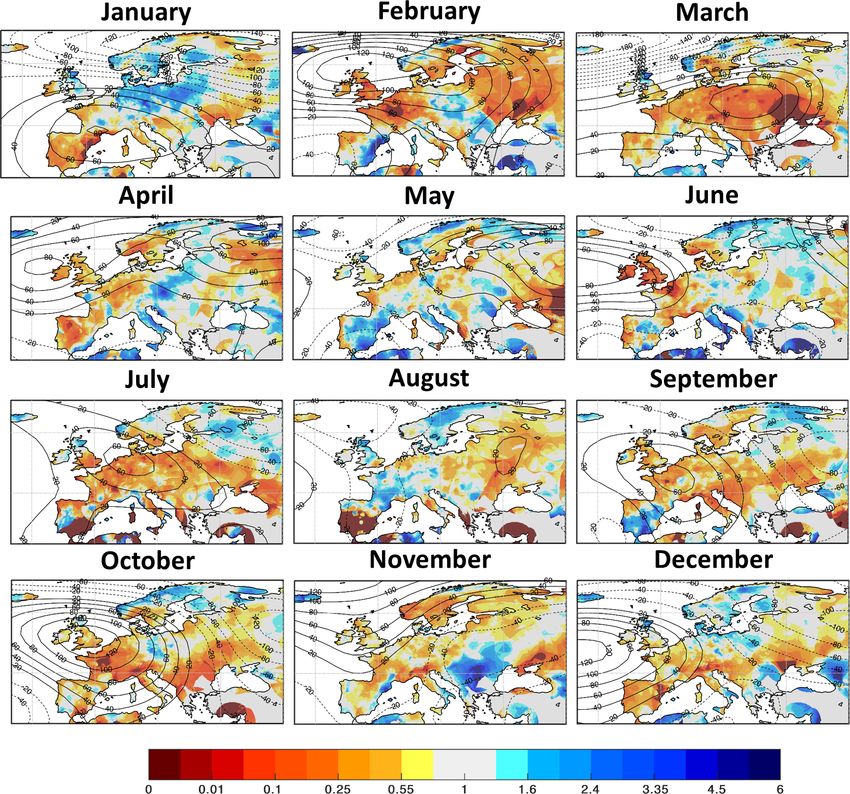
G. van der Schrier et al.: 1921 drought                                                                                            2207

region to which Pińsk belongs to Brest, located 150 km west-          1. Within the ERA4CS INDECIS project 6 , a data-rescue
ward. On the same day, the smaller town of Kłodawa (pop-                  effort was made for data from the Balkans and Italy
ulation in 1921: about 2200) in central Poland saw a large                (two areas which have a particularly low station density
part of the town completely destroyed by fire, and at least               in ECA&D), and the Irish Meteorological Service Met
130 buildings burned down. The town of Rudnik on the San                  Éireann digitized all data for four long-running stations.
(population in 1921: 2959) in the southern part of Poland was             The Polish Institute of Meteorology and Water Manage-
densely covered in smoke from the fires in the surrounding                ment (IMGW) digitized data from the current-day Pol-
bogs, meadows and forest, making it difficult to breathe.                 ish borders and within former Polish regions which now
   Between 9–16 August 1921, forest fires raged in the San-               belong to Belarus and the Ukraine, thereby adding 18
domierz Forest in the southern part of Poland. At least a                 temperature-recording stations and 79 rain gauges.
dozen square kilometres burned down in this fire. For 13 Au-
gust, reports on forest fires in the region of Upper Silesia are       2. The data portals of the European national meteorolog-
found. The fires have been estimated as the biggest ones in               ical services (NMSs) were accessed in search of data
the region of Silesia for at least several dozen years. Not only          for 1920 and 1921 that were not already included in the
many square kilometres of forests but also suburban districts             ECA&D database. This approach was directed mainly
of the town of Mikołów (formerly: Nikolai) were burned                    at the Scandinavian countries, Germany and the UK.
down. The railway traffic on the route Zabrze/Gliwice–
                                                                       3. Inquiries were made at the NMS contacts of ECA&D
Kȩdzierzyn (formerly: Hindenburg/Gliwitz–Kendrin) was
                                                                          with a request for additional data. The Czech Hydrome-
temporarily suspended due to the risk of flames.
                                                                          teorological Institute (CHMI) provided data from 8 sta-
   An assessment of the production of annual crops in west-
                                                                          tions which continued from 1920 to 1960. In addition,
ern Poland on 1 August 1921 showed that many crops for
                                                                          CHMI provided a set of 359 discontinued stations with
human consumption or fodder rated between “medium” and
                                                                          data from 1920 and 1921. A set of 187 rain gauge sta-
“poor” up to “bad” for potatoes, sugar beet and pastures.
                                                                          tions were provided from the Dutch NMS. These latter
Widespread deficits in the availability of dairy products due
                                                                          data provisions are for stations that are now no longer
to a strong reduction in milk production was reported, as well
                                                                          operational.
as low availability of meat and sausages, which resulted in
price increases, particularly in western and central Poland.             All data were subject to a quality control (ECA& D Project
Restrictions in drinking water were issued in Poland as well.         Team, 2012). The data series used for the reconstruction of
                                                                      rainfall and temperature were not adjusted for homogeneity.
                                                                      Although in the INDECIS project daily observations for rain-
3     Description and quantitative analysis of the 1921               fall and temperature are homogenized for the modern period,
      drought                                                         this was not possible for the 1920s.
                                                                         Figure 3 shows the station coverage that is used for the
To further develop and complement the qualitative assess-             current study. For some countries, such as Poland, many data
ment of impacts related to the 1921 European drought, we              still remain to be digitized (and is not digitally available to
now provide quantitative assessment of this climatic event            both the NMS and ECA&D).
using new datasets and methods.
                                                                      3.2   Construction of the gridded E-OBS for 1920–1921

3.1    Data gathering and data rescue                                 The aforementioned station dataset is used to develop the E-
                                                                      OBS dataset for 1920 and 1921. The gridding procedure was
An initial assessment of the number of stations in the                developed by Cornes et al. (2018) and adopts a two-stage
European Climate Assessment and Dataset (ECA&D)                       process to produce the daily fields. The spatial trend in the
(Klein Tank et al., 2002) for 1921 showed that the coverage           three daily temperature variables (daily maximum, minimum
was poor to the point that a reliable reconstruction of pan-          and average temperature) is captured by fitting a generalized
European precipitation was not really possible. The quality           additive model (GAM) to the station values, where the daily
of a gridded dataset is largely dependent on the amount of            temperature data are modelled as a smoothed function of lon-
data used (Cornes et al., 2018), which motivated us to in-            gitude, latitude, and altitude using a reduced-rank thin-plate
crease the station coverage for this historic period. The rea-        spline, plus a smoothed function of the monthly mean, back-
sons for using a gridded dataset rather than the original sta-        ground field values of temperature using a cubic spline. For
tions are the possibility to better assess the spatial scale of the   precipitation, altitude is not used in the spatial trend as this
extreme event more easily and its ease of use for the wider           did not significantly improve the fitting of the model (Cornes
research community.                                                   et al., 2018). Note that the rain gauges in areas with complex
   Three approaches are used to increase the station coverage
for 1920–1921 in ECA&D.                                                  6 http://www.indecis.eu/ (last access: 25 August 2021).

https://doi.org/10.5194/cp-17-2201-2021                                                           Clim. Past, 17, 2201–2221, 2021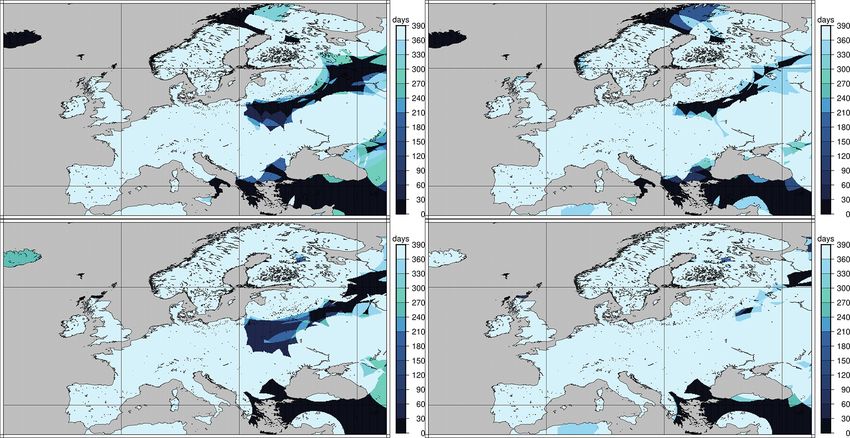
2208                                                                                           G. van der Schrier et al.: 1921 drought

Figure 3. Map with the stations for daily temperature (a) and daily precipitation (b) that provide data for 1920–1921.

topography in the 1921 situation are likely to be concentrated          humidity (q). Geopotential height at the 500 hPa level will be
in the valleys. To remove some of the skewness in the data,             referred to as Z500 hereafter. Sea surface temperature data
the precipitation values and monthly background precipita-              were retrieved from the Met Office Hadley Centre HadSST
tion totals were square root transformed prior to fitting. Step         dataset (Kennedy et al., 2019).
two is to interpolate the residuals from this model using a
stochastic technique (Gaussian random field simulation) to              3.4     Methods
produce the daily ensemble. The occurrence of precipitation
(as a binary field) was gridded separately from accumulations           There are numerous ways to quantify drought (e.g. Heim,
using a full thin-plate spline. This was then used to mask the          2002), including indices based on precipitation alone or in-
daily fields.                                                           cluding the storage of moisture in the soils, or the loss of
   Figure A9 shows the coverage of the grids for precipita-             moisture to run-off or the overlying atmosphere. Here we opt
tion and temperature for 1920 and 1921 and the number of                for using a straightforward index that relates to the precip-
days for which data are available. Temperatures for the east-           itation amount and standardizes the metric against local cli-
ern part of the Mediterranean are missing as well as an elon-           matic conditions, and we use other means to quantify the loss
gated stretch from Belarus into Russia. For precipitation, the          of moisture to the atmosphere. The transport of moisture to
largest part of Europe is almost fully covered except for a             (or away from) the European continent relates the drought
few isolated spots in more remote areas that do not have full           to atmospheric circulation, and a heatwave index is used to
time coverage. Iceland is the exception: the data for 1920 are          quantify the heat during the 1921 summer.
much less complete than for 1921. A stretch of data from
Belarus into Russia is missing for 1920, but for 1921 this is           3.4.1    Standardized precipitation index
already much better. The E-OBS gridded fields for 1920 and
                                                                        A common meteorological drought index to analyse drought
1921 comes in the grid resolutions of 0.25 and 0.1◦ , covering
                                                                        conditions is the Standardized Precipitation Index (SPI; Mc-
the area 25–71.5◦ N, 25 ◦ W–45◦ E.
                                                                        Kee et al., 1993), which quantifies the anomaly of an ob-
                                                                        served accumulated precipitation depth over the timescale
3.3    Other data used for reconstruction                               of interest (e.g. 3, 6, 12 months), calculated using a long-
                                                                        term time series. The cases SPI > 0, SPI < 0, and SPI = 0
In the analysis, long-term daily precipitation series from              indicate wet, dry, and normal conditions with respect to the
ECA&D are used (Klein Tank et al., 2002) for Uccle (Bel-                reference climate, respectively. Another useful precipitation
gium), Marseille (France), Milan (Italy), and St. Petersburg            index to quantify drought is the number of rainy days with
(Russia). The E-OBS reconstruction for 1920–1921 is com-                totals ≥ 1 mm.
bined with E-OBSv20.0e covering the 1950–2018 period
for the calibration of the climate indices, for example. For
                                                                        3.4.2    Estimates of evaporation
the synoptic analysis we select monthly-mean data from
the ERA20C reanalysis product (Poli et al., 2016), which                The evaporation of water from the soils is principally driven
covers the 1900–2010 period and has a horizontal resolu-                by radiation which provides the energy for evaporation. As
tion of about 125 km. The following variables were retrieved            the observation-based reconstruction of the 1920–1921 cli-
for pressure levels between 1000 and 300 hPa: geopotential              mate lacks an estimate of daily global radiation sums, a com-
height (Z), zonal (U ) and meridional (V ) wind, and specific           monly used alternative approach uses the Hargreaves equa-

Clim. Past, 17, 2201–2221, 2021                                                              https://doi.org/10.5194/cp-17-2201-2021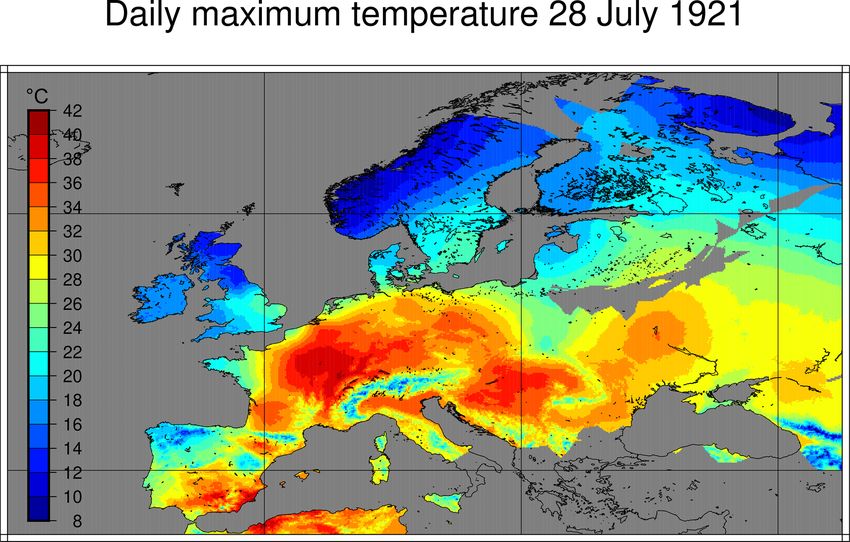
G. van der Schrier et al.: 1921 drought 2209
tion for potential evaporation ET0 (Hargreaves and Samani,
1985; Hargreaves and Allen, 2003). The relation between
sunshine data and the diurnal temperature range provided
the possibility to construct an estimate for evaporation that
is based on maximum and minimum temperature (which are
available in this reconstruction).
The form of the Hargreaves and Samani (1985) parameter-
ization used here is
√
ET0 = 0.0023Ra (Tc + 17.8) DTR, (1) Figure 4. Monthly SPI12 values of the Uccle (Belgium) series for
the period 1900–2019. Positive values (blue) show conditions wet-
where Ra is the extra-terrestrial radiation (which is a func- ter than usual, negative values (red) show conditions drier than usual
tion of latitude and yearday in W m−2 ), and Tc is the average with values below −2 relating to “extremely dry”.
daily temperature and DTR the diurnal temperature range,
both in ◦ C. The empirical coefficients were determined in
various field experiments (Hargreaves and Allen, 2003). By the daily minimum temperature). The WSDI is then simply a
comparing daily ET0 values from 1921 as a ratio of present- string of consecutive warm day-times.
day values we aim to mitigate some of the unavoidable de-
viation from more realistic estimates of daily ET0 . Here the
climatological period 1981–2010 is used as a reference pe- 4 Results
riod.
4.1 The 1921 drought in the long-term context
3.4.3 Integrated vapour transport The SPI indicator computed for the accumulation period of
12 months is shown in Fig. 4 for Uccle, Belgium, based on
Moisture availability and transport were evaluated by using
the precipitation series starting in 1880. The drought in 1921,
the vertically integrated water vapour transport (IVT), based
with a value below −4, clearly stands out in comparison to
on ERA20C data, which is defined as the horizontal transport
more recent droughts, indicating the exceptional nature of
of specific humidity, integrated for a vertical column of the
this period. The long timescale of this metric (12 months)
troposphere (between 1000 and 300 hPa), as follows:
and the negative values at the start of 1921 indicate below-
v
u 2 300 hPa 2 normal rainfall in autumn 1920 and winter 1920–1921. To
u 1 300 Z hPa compare the 1921 SPI12 value, which is well below −4, with
u Z
1
IVT = u t qudp + qvdp , (2) more recent values, peak value in the dry year 2018 is −1.93
g g and in 1976 it is −2.41. On the shorter time periods, the con-
1000 hPa 1000 hPa
trast with recent years is large as well. For SPI3 and SPI6, the
where q is the specific humidity [kg kg−1 ], u and v are the 1921 value for Uccle is well below −4, while peak values in
zonal and meridional layer averaged wind [m s−1 ], dp is the year 2018 are −2.65 for SPI3 (July 2018, accumulating pre-
pressure difference between two adjacent levels [Pa], and g cipitation for May–June–July) and −1.87 for SPI6 (October
is the acceleration due to gravity [m s−2 ]. 2018, accumulating precipitation for May to October), and
peak values in 1976 are −3.44 (June 1976) and −2.84 (June
1976) respectively. For the calculation of the SPI values, the
3.4.4 The metric for warm day-times and the length of
calibration interval 1950–2019 is used.
heatwaves
The combination of the length of the dry period with
The heatwave index used here is the Warm Spell Duration the maximum value of the precipitation deficit relates to
Index (WSDI) defined by the CCl/CLIVAR/JCOMM Expert “drought severity”. The overview of drought severity of ma-
Team on Climate Change Detection and Indices (ETCDDI) jor European cities is given in Fig. 5 and shows that Uccle is
(Klein Tank et al., 2009). The WSDI relates to the locally in the area in Europe where the 1921 drought was the longest
defined threshold of the 90th percentile in daily maximum and most severe, together with Paris and Lyon. For this figure
temperature. Following the definition of this index, at least the SPI3 metric is used.
6 d in a row need to exceed the 90th percentile threshold for a
warm spell to be observed, where the 90th percentile is based 4.2 Spatial variations in the 1921 drought for Europe
on data, smoothed using a 5 d running mean, from the 1961–
1990 period. A day where the daily maximum temperature Figure 6 shows the spatial distribution of the SPI values over
exceeds the threshold of the 90th percentile is called a “warm Europe as the drought evolves from autumn 1920 to au-
day-time” (as opposed to a warm day, which relates to the tumn 1921, based on the E-OBS dataset. The SPI3 values
daily-mean temperature, and a warm night, which relates to for September–November 1920 (Fig. 6a) show moderately
https://doi.org/10.5194/cp-17-2201-2021 Clim. Past, 17, 2201–2221, 2021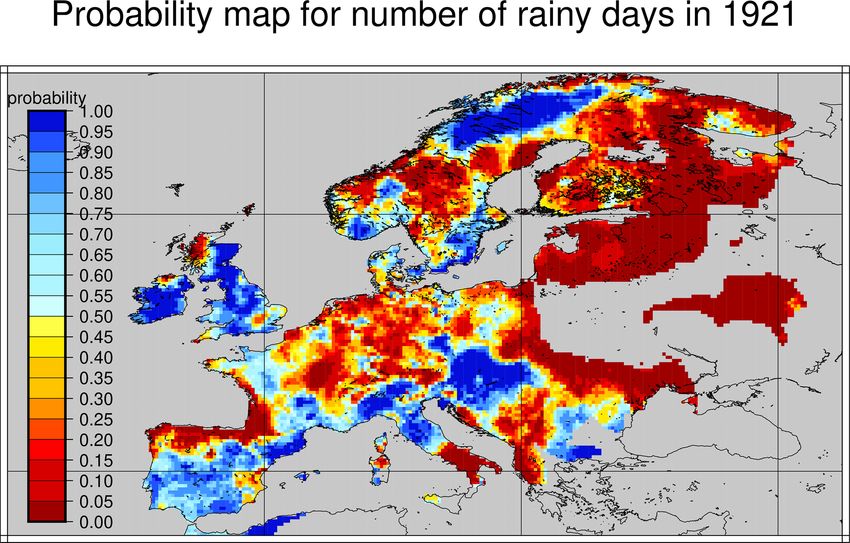
2210                                                                                       G. van der Schrier et al.: 1921 drought

Figure 5. Diagram showing the drought severity of major European cities in 1921. The horizontal axis gives the number of months in 1921
that SPI3 values were below −0.5, and the vertical axis shows the lowest SPI3 value attained in 1921.

dry to extremely dry conditions (relating to SPI values below         where the 1981–2010 period is the baseline period. This fig-
−1.0 and −1.5 respectively) in a large area from England              ure shows large areas of western and central Europe, extend-
and Wales eastward, including southern Scandinavia, north-            ing toward the east, with a very low probability indicating
eastern Europe and the northern part of the Balkans. The              that the number of rainy days in 1921 was well outside the
driest spots are found in the Netherlands and northern Ger-           distribution in the baseline period.
many, southern Sweden, Estonia, and northwestern Russia.
Mediterranean Europe is rather wet, but with moderately dry
conditions in northeast Italy. This figure shows that the end of      4.3   Rainfall and evaporation over river catchments
1920 was already particularly dry. The dry conditions are less
expansive in the 1920–1921 winter (Fig. 6b), while in par-            In the inventory of impacts of the 1921 drought, the limita-
ticular France, Ireland, the Ukraine and some more isolated           tions in the water supply for drinking and sanitation purposes
areas in Europe remained in a droughty state. In spring 1921,         and to a lesser extent the limitations in waterborne transport
the drought shifted slightly to the southwest with the focal          ranked high. An assessment of the remarkable nature of the
point over Brittany in western France, but the SPI values re-         1921 drought can be made by making a cumulative distribu-
mained well below −1 or −1.5 for a large part of Europe               tion of the daily rainfall, integrated over a river catchment. In
(Fig. 6c). The SPI3 map for summer 1921 (Fig. 6d) shows a             an effort to assess the loss of evaporation to the atmosphere,
further intensifying drought, especially in southern England          a similar integral measure over a river catchment of poten-
and Belgium. The wet conditions in Mediterranean Europe               tial evaporation is made. Figure 8 shows this analysis for the
have moved away, except in south and central Italy and along          Seine catchment. Panel (a) show the cumulative distribution
the Adriatic coast in the Balkans. In autumn 1921 (Fig. 6e),          of daily rainfall for the combined years 1920 and 1921 (in
the drought further intensified, with the driest points in cen-       red) and the individual years in the 1981–2010 period (in
tral France and northern Italy and south Sweden. A large part         grey). The red line is outside the ensemble of climatologi-
of western and central Europe remained firmly in its grip.            cal years, indicating that the number of dry days was higher
   The assessment of the drought conditions on a monthly              than what was seen in the baseline period 1981–2010 and that
basis (not shown) shows that the driest months of 1920 were           there were many more days with low amounts of precipita-
October and November, whereas the driest months of 1921               tion in 1920 and 1921 than in the modern climatology. The
were March and July. There were, however, a lot of subse-             lack of rain was aggravated by anomalously high amounts
quent dry months in 1921, and only August showed some-                of potential evaporation. Figure 8b shows daily values of the
what normal conditions. The remarkable nature of 1921 is              1921 ET0 as the ratio of the climatological 1981–2010 value.
made clear in Fig. 7, which shows, for each location in Eu-           The aggregated potential evaporation over the Seine is for
rope, the probability of the number of rainy days in 1921,            81.4 % of the time larger than 1, exceeding the mean 1981–
                                                                      2010 value, and for 47.1 % of the time above the 90th per-

Clim. Past, 17, 2201–2221, 2021                                                          https://doi.org/10.5194/cp-17-2201-2021
G. van der Schrier et al.: 1921 drought 2211
Figure 6. Maps with SPI values showing the evolution of the drought from autumn 1920 to autumn 1921. The panels show SPI3 values
for September–November 1920 (a), December–February 1921 (b), March–May 1921 (c), June–August 1921 (d) and September–November
1921 (e). Maps based on the E-OBS data.
centile, whereas it drops below the 10th percentile for just in summer 1921 was remarkable. When compared to all other
2.5 % of the time. The highest peaks in potential evapora- hottest summer days in the period 1920–2019, 1921 ranks in
tion (with respect to the climatology) are observed in July the top five for the area between Paris, the eastern half of Bel-
and in the autumn, where values peaked to over twice the cli- gium, southwest Germany and into Switzerland. The hottest
matological value. Similar observations apply to the Moselle day of 1921 also ranks in the top five of the past 100 years
catchment (not shown). in western Poland, the Black Sea coast of Romania, western
parts of the Ukraine, parts of Ireland and the North Sea coast
of northern England.
4.4 Heatwave quantification Figure 9a shows the spatial pattern of the warm spell du-
The 1921 drought coincided with high temperatures across ration index and gives the length of the longest warm spell
Europe, parts of which were affected by a heatwave which observed in summer 1921. Figure 9b shows the number
occurred in July. While the European-average July tempera- of warm day-times in summer 1921 (regardless of whether
ture was not remarkable in the 100-year period 1920–2019 these days are clustered or not). Figure 9 shows that the 1921
(mean daily average temperature ranks 47th), the hottest day heatwave covered several regions of a large latitudinal band
https://doi.org/10.5194/cp-17-2201-2021 Clim. Past, 17, 2201–2221, 20212212 G. van der Schrier et al.: 1921 drought
pressure, where high levels of the geopotential reflect high
sea-level pressure values. This figure shows that a high-
pressure system dominates the 1921 circulation, although
it moves around Europe from month to month. The high-
pressure anomaly is situated roughly over the British Isles
and is present in February, April, June, July, September and
October. These months give anomalously low precipitation
values in western and – for some of these months – cen-
tral Europe. In March, the high-pressure anomaly dominates
all of Europe, giving dry conditions in most of Europe ex-
cept Scotland and western Norway in the north and southern
Italy, Sardinia, and southern France/northwestern Spain in
the south. North of the Black Sea, March lacks any rain. May
is a typical saddle situation between troughs over Iceland and
Figure 7. Probability-scaled map of the number of rainy days for northwest Africa and ridges with their centres in eastern Eu-
1921, using the 1981–2010 period as a base period to calculate the rope and over the Atlantic. This situation gives calm weather
expected value. The map shows the probability to observe the same and does not ameliorate the precipitation deficit build-up in
number of rainy days in the 1981–2020 climate as was observed in
the preceding months. August, with a weak low-pressure area
the 1921 drought.
north of Scotland, brings some rain to parts of the UK and
France, but from southeastern England well into central and
eastern Europe, the anomalously low precipitation amounts
stretching from Ireland to the Ukraine, including southwest
are sustained. The extensive high-pressure centre north of
England and Wales, central France, and a large area in cen-
Iceland in November gives dry conditions in much of Eu-
tral Europe and the Balkans, where a long period of persis-
rope except the Balkan peninsula and areas north of it, while
tently high temperatures can be observed. Finally, a large
December has a high-pressure centre east of Ireland extend-
sector of the Ukraine and western Russia, located just north
ing into central Europe so that only the countries around the
of the Black Sea, observed a relatively short duration warm
Baltic Sea and Denmark are wetter than usual.
spell. This does not mean that high temperatures were not
Figure 12a shows the annual mean 1921 North At-
observed in other parts of Europe. Figure 9b shows that out-
lantic storm track density anomaly with respect to the
side the heatwave-stricken areas a large number of days in
ERA20C climatology, based on the tracking scheme devel-
summer 1921 also exceeded the 90th percentile – more than
oped by Hodges (1995) and using spherical kernel estimators
the expected 9 d if this was an ordinary summer.
(Hodges, 1996).
One of the hottest days in the heatwave that affected
Figure 12 shows an evident poleward displacement of the
France was 28 July 1921. Figure 10 shows the daily maxi-
Atlantic storm track which resulted in a large reduction of
mum temperature for this day, where temperatures in France
Atlantic storms (mid-latitude cyclones) in continental Europe
locally exceeded 40 ◦ C, and about three-quarters of France,
and the UK. The overall reduction of storms is also striking
including Paris, saw temperatures of 38 ◦ C or higher (briefly
over southern Europe (ca. 60 % decrease), extending into the
discussed in Sect. 2.2.3). These temperatures are high for to-
central Mediterranean and eastern Europe.
day’s standards as well. Ranking the highest daily maximum
Although smaller than its Atlantic counterpart, the
temperature reached in summer 1921 in the 100-year E-OBS
Mediterranean storm track also contributes to the total num-
record shows that a sizeable part of France, from Paris into
ber of storms and rainfall accumulated over southern Europe.
Switzerland, have the highest 1921 summer temperature in
Mediterranean cyclones are generated on preferred cycloge-
the top five. Further east in an arc over southern Germany,
nesis areas such as the lee of the Alps, the Gulf of Lyon
central Poland and the Ukraine to the Romanian Black Sea
and the Gulf of Genoa, where the land–sea contrast provides
coast, temperatures high enough to reach the top 10 are ob-
the right conditions for storm growth (Trigo et al., 1999).
served.
Mediterranean storms are mostly subsynoptic lows, triggered
by the major North Atlantic synoptic systems (Trigo et al.,
5 Drivers of the 1921 drought 2002). Therefore, North Atlantic jet variability also exerts a
strong control on Mediterranean cyclogenesis. It is plausible
In this section, we explore the atmospheric circulation con- that the northward deviation observed for the 1921 Atlantic
ditions associated with and contributing to the 1921 drought. storm track contributed to the marked reduction of Mediter-
Figure 11 shows the Z500 geopotential height monthly mean ranean cyclogenic events during that year. Figure 12b shows
anomalies with the monthly precipitation as a ratio of the the ERA20C genesis density climatology (contours) and the
corresponding 1981–2010 monthly climatology. Here we use 1921 anomaly (shading), highlighting that the year of 1921
the Z500 geopotential height as a “proxy” of the sea-level had about 60 % fewer genesis events than a typical year.
Clim. Past, 17, 2201–2221, 2021 https://doi.org/10.5194/cp-17-2201-2021G. van der Schrier et al.: 1921 drought 2213
Figure 8. Cumulative distribution of daily rainfall aggregated over the Seine catchment (a). In red the data from the 1920–1921 period; the
grey lines show individual years in the 1981–2010 period. Panel (b) shows estimates of ET0 for 1921 averaged over the Seine catchments as
ratios to the 1981–2010 climatology. Added in blue and green are the 10th and 90th percentile of ET0 values from the 1981–2010 climatology,
again as a ratio from the mean value. Based on the E-OBS dataset.
Figure 9. Maps showing (a) the warm spell duration index for summer 1921, a heatwave index relating to the locally defined threshold of the
90th percentile in daily maximum temperature and with a minimum length of 6 consecutive days above this threshold, and (b) the number of
days above this 90th percentile threshold, regardless if they are clustered in time or not. Based on the E-OBS dataset.
The poleward displacement of the storm track is also well
reflected in moisture transport anomalies. Figure 12c dis-
plays the anomalies observed for the annual mean integrated
vapour transport (IVT) (shading denotes the anomaly in in-
tensity, while arrows show the direction) and Z500 (con-
tours). A notable north–south dipole of positive–negative
IVT anomalies was observed between northwestern and
southwestern Europe during 1921 (Fig. 12c). Although there
were some seasonal differences, anticyclonic conditions per-
sisted all year round, with increased frequency of ridges and
blocking systems over the northeastern Atlantic and western
Europe, well reflected in the yearly weighted Z500 anoma-
lies, and thus decreasing the zonal flow (and consequently
moisture transport) towards Central Europe. Enhanced mois-
ture transport was observed in northern sectors of the UK and
in Scandinavia as a result of this anomalous synoptic pattern.
Figure 10. Map showing the daily maximum temperature for
28 July 1921 at the peak of the heatwave in France. Based on the
E-OBS dataset.
https://doi.org/10.5194/cp-17-2201-2021 Clim. Past, 17, 2201–2221, 20212214 G. van der Schrier et al.: 1921 drought
Figure 11. Monthly precipitation totals for January to December 1921 as the ratio of the corresponding 1981–2010 climatology. Contours
show the Z500 anomalies (solid lines for positive, and dashed lines for negative, in 20 m intervals).
6 Discussion and conclusion The impacts of the 1921 drought are assessed by a system-
atic review of text-based reports from selected papers in five
There are several aspects that make the 1921 drought stand countries where the reported drought impacts were classified
out from other droughts. Perhaps the most intriguing is into major impact categories, and by a more ad hoc approach
that this drought can be regarded as a “compound event” highlighting the major impacts in some other European coun-
(Zscheischler et al., 2018). The 1921 drought could have had tries. The focus on the impact is coupled to a reconstruction
the impact it had because the preceding autumn 1920 and of daily temperature and precipitation of the 1920 and 1921
winter of 1920–1921 were dry as well; the integrative na- situation based on observations. This study shows the follow-
ture of drought carries the effects of the lack of precipitation ing:
in autumn and winter into the following spring and summer.
Such a chain of events, a preceding dry winter or a cluster- 1. The drought had its first major impacts in autumn 1920
ing of dry winters, has been linked to heightened summer over the Alpine region and affected north Italy by re-
drought risk for the UK (Marsh et al., 2007). This is illus- duced streamflow and low water levels in lakes. Dry
trated further by the observation that for the areas that are hit conditions started to affect other parts of Europe in
hardest by the drought, none of the seasons in 1920 and 1921 spring 1921. The type of impact which was experienced
are the driest on record (in the framework of the E-OBS re- first varies across Europe. There is more agreement on
construction). This points to the succession of relatively dry the type of impact which lingered on the longest, that
seasons that makes 1921 such an extreme year in relation to is the impact on water supply, and on agriculture and
drought. livestock farming.
Clim. Past, 17, 2201–2221, 2021 https://doi.org/10.5194/cp-17-2201-2021G. van der Schrier et al.: 1921 drought 2215
2. The impacts on agriculture and livestock farming are re-
ported on most frequently, except in the Czech Republic
where wildfires (followed by problems with the water
supply) were more dominant. This was also the case in
Poland, where towns were completely or partially de-
stroyed by fires.
3. The epicentre of the drought was observed in the area
including Brussels, Paris and Lyon, but a broad band
from Ireland and the UK, including the Low Countries
and the Greater Alpine area, to the east over Poland and
the Ukraine.
4. The reported water shortage is confirmed by the recon-
struction of precipitation and (potential) evapotranspi-
ration; over the catchment of the Seine river the num-
ber of rainy days was well below anything observed in
the 1981–2010 baseline period while (potential) evapo-
transpiration values were up to twice as high as in the
baseline period.
5. While the average summer or annual temperature in
1921 was not really remarkable for modern standards,
the hottest days in the summer of 1921 ranked in the
top five of hottest days of the last 100 years for parts
of western and central Europe. The soil desiccation will
have been instrumental in generating the 1921 extreme
temperatures in Europe, a mechanism which is shown to
be a key player in more recent heatwaves as well (Mi-
ralles et al., 2014; Sousa et al., 2020).
6. Instrumental to the 1921 drought was a persistent high-
pressure area situated roughly over the British Isles, al-
though it moved around slightly from month-to-month.
This synoptic situation steered away cyclones, shifting
the Atlantic storm track northwards.
The examined newspaper reports from the UK and the
Netherlands suggest a late spring frost in 1921, but this could
not be confirmed in the meteorological measurements. A
possible reason for this intriguing mismatch is that temper-
ature measurements in 1921 in the Netherlands were made
at 2.2 m height whereas modern measurements are done at
1.5 m. While this may bias this comparison, ground tempera-
tures are hardly correlated to the air temperature at both these
Figure 12. (a) 1921 storm track density anomaly (shaded) and heights when stable conditions in the atmospheric boundary
storm track ERA20C density climatology (contours). Densities are layer occur. Our interpretation is that the newspaper reports
in units of number of storm tracks per year, per unit area, where the probably relate to temperatures close to the ground which
unit area is equivalent to a 5◦ spherical cap (≈ 106 km2 ). (b) 1921 can be considerably lower than those at thermometer screen
storm genesis density anomaly (shaded) and ERA20C genesis den- height. The persistent high-pressure situation in spring 1921
sity climatology (contours). Densities are in units of number of favours calm and cloudless nights and the development of
storm tracks or genesis events per year respectively, per unit area,
stable conditions in the boundary layer, leading to ground
where the unit area is equivalent to a 5◦ spherical cap (≈ 106 km2 ).
(c) 1921 vertically integrated horizontal vapour transport anomaly
frost. In addition, crops may have developed faster because
intensity (shading) and transport direction (arrows). Contours show of the high afternoon temperatures of spring 1921 and may
the 1921 Z500 anomaly. have been in a critical stage when the late frosts occurred,
giving greater damage to the crop.
https://doi.org/10.5194/cp-17-2201-2021 Clim. Past, 17, 2201–2221, 2021You can also read