MEASURING THE ECONOMIC FOOTPRINT OF THE BIOTECHNOLOGY INDUSTRY IN EUROPE
←
→
Page content transcription
If your browser does not render page correctly, please read the page content below
RESEARCH REPORT DECEMBER 2020

MEASURING THE ECONOMIC
FOOTPRINT OF THE
BIOTECHNOLOGY INDUSTRY IN
EUROPE
Prepared for EuropaBio – The European Association for Bioindustries

Andreas Haaf
Dr. Sandra Hofmann
In collaboration with Dr. Julia Schüler (BIO. ASPEKTE)
Imprint

Version
December 2020

Publisher
WifOR Institute
Rheinstraße 22
64283 Darmstadt
Germany

Authors
Andreas Haaf
Dr. Sandra Hofmann
Co-author Dr. Julia Schüler (BIO. ASPEKTE)

Acknowledgement
This project was undertaken with the financial support of EuropaBio.

 2

Table of Contents
EXECUTIVE SUMMARY 4

1 BIOTECHNOLOGY: DEFINITION AND IMPACT 7

Definition of biotechnology and differentiation to related sectors 8
Impact and value of biotechnology 10

2 EUROPEAN BIOTECHNOLOGY INDUSTRY’S ECONOMIC FOOTPRINT
 14

Gross Value Added Effects 17
Labour productivity 20
Employment effects 21
Trade 24
Impact of research and development 27

3 CONCLUSION 28

A REFERENCES 31

Literature and weblinks 32
Data sources 34

B DATA SOURCES AND METHODOLOGY 35

Data sources 36
Industry definition 37
Gross value added and employment 37
Trade 38
Spillover effects 38

C BREXIT: EU27-EU28 COMPARISON 39

D BACKGROUND INFORMATION: MICRO-ECONOMIC VIEW OF THE
EUROPEAN BIOTECHNOLOGY INDUSTRY AND COMPARISON TO THE
US 41

Key metrics compared 42
Financings compared 43

E GLOSSARY 46

 3
Executive Summary
This economic impact study was conducted by WifOR Institute – an
independent research institute specialising in impact analysis – on
behalf of the European Association of Bioindustries, EuropaBio.
It estimates the contribution of the biotechnology industry to the EU
economy and labour market in terms of gross value added,
employment and trade. The study looks at the economic impact of the
biotechnology industry within the 28 European member states.
Direct, indirect, and induced effects generated by the biotechnology
industry in the EU28 are quantified in accordance with the system of
national accounts and using a multiregional input-output model.

GDP CONTRIBUTION OF SUPPORTING JOBS IN
€34.5 BILLION THE EU
The direct contribution of the The biotechnology industry
European biotechnology industry to strengthens the labour market by
the EU28 GDP was €34.5 bn in directly creating 223,000 jobs in the
2018. This accounts for about 1.5% healthcare, industrial and
of the industrial sector’s GVA. agricultural biotechnology sector, as
Including spillover effects, the total well as supporting 710,500 jobs in
GVA effect of the EU biotechnology the overall economy through indirect
industry amounted to €78.7 bn and and induced effects.
equates to the size of the
advertising industry in Europe.

 4
EXTRA EU TRADE SURPLUS: €22.3 bn
Openness to international trade ensures
prosperity in Europe: With a continuously
increasing trade surplus of more than €22 bn
recently, the European biotechnology industry
shows that it makes an above-average
contribution by the worldwide distribution of
high-quality goods.

 DRIVER FOR GROWTH
 With an average annual growth rate of 4.1%,
 the biotechnology industry is growing more than
 twice as fast as the EU information and
 communication sector (2.0%) and the overall
 economy (1.9%), making it one of the fastest
 growing innovative industries in Europe.

HIGHLY PRODUCTIVE INDUSTRY
With an average labour productivity of
€154,500 GVA per employee, the
biotechnology industry is a highly efficient and
capital-intensive industry and outstrips highly
productive industries such as the
telecommunications sector and the financial
sector.

 5
The purpose of this study is to estimate the economic impact of the production
activities of European enterprises applying biotechnology in their research
and manufacturing processes. The analysis covers the years between 2008
and 2018 while focusing on contributions to economic growth and employ-
ment. Especially estimations of direct as well as indirect and induced effects
(so-called spillover effects) are considered, in total tagged as “footprint”. The
impact is analysed regarding to employment and contribution to gross domes-
tic product (GDP), the latter being measured in terms of gross value added
(GVA). Therefore, this economic footprint analysis provides an overall eco-
nomic picture of the EU biotechnology industry supplemented by trade and
R&D figures. It sheds light on the performance of the industry, its direct con-
tribution to Europe’s GDP and labour market, as well as on the spillover effects
occurring in European supply chains.
The study computes the impact of the biotechnology industry operating in 28
EU member countries.1 A detailed description of data sources and methodol-
ogy can be found in Appendix B.
The results show that the biotechnology industry has contributed €34.5 bn
GVA to the growth of the European economy in 2018. If indirect and induced
effects are considered, this amount increases to €78.7 bn. This simply means
that every Euro of GVA directly generated by the biotechnology industry sup-
ports additionally €1.3 GVA in the European economy.
Furthermore, the biotechnology industry accomplished to safeguard up to
223,000 jobs directly and supports 710,500 jobs along the value chain, mainly
created by the suppliers of goods and services to the biotechnology industry.
Or to put it differently, for each job in the biotechnology industry there are 3.2
additional jobs in the overall economy. Detailed figures on the three biotech-
nology sub-sectors can be found in Chapter 2.
This study was commissioned by EuropaBio, the European Association of
Bioindustries, with the objective to better quantify the impact of the
biotechnology industry on the European Union’s economy.
Founded in 1996, EuropaBio is the recognised voice of the EU biotechnology
community, championing world-class solutions for society’s challenges. Eu-
ropaBio and its members are committed to the responsible use of biotechnol-
ogy to improve quality of life, to prevent, diagnose, treat and cure diseases, to
improve the quality and quantity of food and feedstuffs and to move towards
a bio-based and zero-waste economy.2

1
 Statements concerning the impact of the biotech industry in the EU on the “European economy” and “European labour
market” refer to the impact on the EU28 economy and the EU28 labour market, respectively. Neither the impact of firms
located in Switzerland nor the impact occurring in Switzerland is included. Comparisons to European industries are
based on official data for the EU28 aggregate. Furthermore, no gross output for biotechnological goods is statistically
recorded for the following three EU members: Cyprus, Luxembourg, and Malta.
2
 EuropaBio, ‘Biotechnology Industry Manifesto 2019. Resetting the Ambition for Biotechnology in the EU’.

 6
1
Biotechnology: definition and
impact

 7
Definition of biotechnology and
differentiation to related sectors
This study refers basically to the definition of the Organisation for Economic Co-
operation and Development (OECD) which is a generally accepted definition of
biotechnology (see box 1 for more detail).
Thus, biotechnology is “the application of science and technology to living
organisms, as well as parts, products and models thereof, to alter living or non-
living materials for the production of knowledge, goods and services.”

 BOX 1: OECD Definition of biotechnology

 In 2002, the OECD developed both a single definition of biotechnology and a list-based definition of different types of biotechnology
 techniques.

 “The application of science and technology to living organisms, as well as parts, products and models thereof, to alter living or non-living
 materials for the production of knowledge, goods and services.”

 This single definition covers all modern biotechnology but also many traditional or borderline activities. Thus, the OECD recommends
 that the single definition should always be specified by the list-based definition.

 DNA/RNA: Genomics, pharmacogenomics, gene probes, genetic engineering, DNA/RNA sequencing/
 synthesis/amplification, gene expression profiling, and use of antisense technology, large-scale DNA
 synthesis, genome- and gene-editing, gene drive.
 Proteins &
 other molecules: Sequencing/synthesis/engineering of proteins and peptides (including large molecule hormones); improved
 delivery methods for large molecule drugs; proteomics, protein isolation and purification, signaling,
 identification of cell receptors.

 Cell & tissue culture
 & engineering: Cell/tissue culture, tissue engineering (including tissue scaffolds and biomedical engineering), cellular fusion,
 vaccine/immune stimulants, embryo manipulation.

 Process biotechnology
 techniques: Fermentation using bioreactors, bioprocessing, bioleaching, biopulping, biobleaching, biodesulphurisation,
 bioremediation, biofiltration and phytoremediation.

 Gene & RNA vectors: Gene therapy, viral vectors.

 Bioinformatics: Construction of databases on genomes, protein sequences; modelling complex biological processes,
 including systems biology.

 Nanobiotechnology: Applies the tools and processes of nano/microfabrication to build devices for studying biosystems and
 applications in drug delivery, diagnostics etc.

 ‘Revised Proposal for the Revision of the Statistical Definitions of Biotechnology and Nanotechnology’. OECD Science, Technology and
 Industry Working Papers. Vol. 2018/01. OECD Science, Technology and Industry Working Papers, 18 January 2018.
 https://doi.org/10.1787/085e0151-en.

A more coherent definition might be, “biotechnology uses structures, functions
and processes of living biological organisms or parts of them to provide goods
and services”. Their smallest entities, the cells, work like a plant or factory as they
process materials, energy and information. Hence, biotechnology (or abbreviated
biotech) could be considered as an industrial production technology frequently
also called fermentation if microorganisms are used.

 8
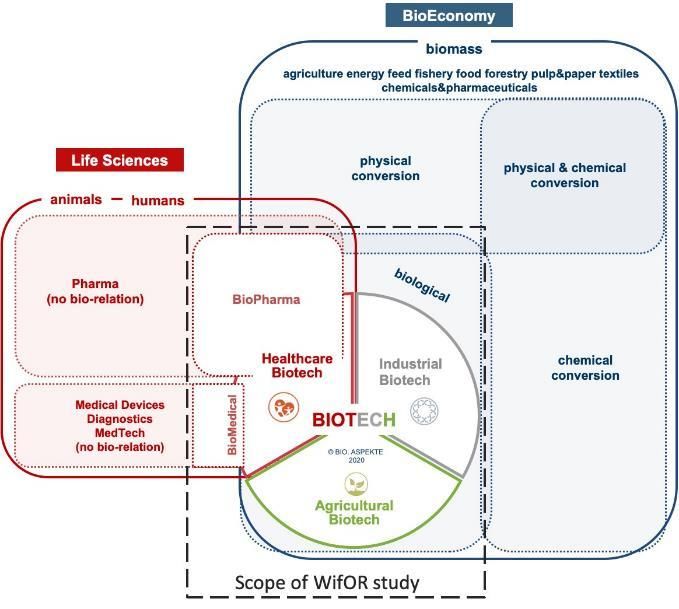
Often biotechnology is linked to Life Sciences. There is no precise and commonly
applied definition of Life Sciences, but the term is habitually used to encompass
all activities from the biotechnology, medical device and pharmaceutical sector
with regard to human or animal health. Thus, besides biotechnology, other tech-
nologies are used, such as physical (medtech) and chemical (pharma) technolo-
gies.
Also, the term Bioeconomy is often linked to biotechnology. In 2012, the Euro-
pean Commission (EC) published its Bioeconomy strategy “Innovating for Sus-
tainable Growth: A Bioeconomy for Europe”3, which was subsequently updated
in 2018.4 The EC definition is as follows: "The bioeconomy covers all sectors and
systems that rely on biological resources (animals, plants, micro-organisms and
derived biomass, including organic waste), their functions and principles. It in-
cludes and interlinks: land and marine ecosystems and the services they provide;
all primary production sectors that use and produce biological resources (agricul-
ture, forestry, fisheries and aquaculture); and all economic and industrial sectors
that use biological resources and processes to produce food, feed, bio-based
products, energy and services.”
Biotechnology is a subset of bioeconomy where biological resources (biomass)
could be processed or treated by biological (biotechnology), chemical, or physical
means (technologies). This and the context of biotechnology against Life Sci-
ences is schematically illustrated in figure 1.

Figure 1: Context of sectors life sciences, biotechnology and bioeconomy.

3
 European Commission, Innovating for Sustainable Growth.
4
 European Commission, A Sustainable Bioeconomy for Europe.

 9
In this study the scope is on biotechnology as illustrated in figure 1. This means,
broader bioeconomy (including physical and chemical conversion of biomass),
conventional pharmaceutical technologies and medtech are excluded here. The
biotechnology sector itself is divided into healthcare, industrial and agricultural
biotechnology.
Biotechnology goes back well before Christ with first applications to produce wine,
beer, bread, and cheese. The oldest biotechnology in the world provided safe
drinks and food that nurtured civilisations. It is only about 100 years ago that the
understanding of the biotechnology mechanisms progressed so that enzymes
and microorganisms could be used to produce food, food ingredients or simple
chemicals such as ethanol by fermentation. Later, the first pharmaceuticals (an-
tibiotics) were manufactured by using moulds. During World War II, biotechno-
logical production secured the supply of Penicillin. About 50 years ago, bioscien-
tific progressions induced the rise of a new industry that is based on modern
biotechnology.
According to the Bio4EU study5, which assessed the consequences, opportuni-
ties and challenges of modern biotechnology for Europe it can be defined as “use
of cellular, molecular and genetic processes in production of goods and services.
Its beginnings date back to the early 1970s when recombinant DNA technology
was first developed. Unlike traditional biotechnology – which includes fermenta-
tion and plant and animal hybridisation – modern biotechnology involves a differ-
ent set of technologies, including industrial use of recombinant DNA, cell fusion
and tissue engineering amongst others.” The study published in 2007 presented
the first comprehensive picture of the applications of modern biotechnology and
their contribution to the European Union’s policy goals. Biotechnology was con-
sidered to be one of the key technologies that would enable the EU’s long-term
sustainable development.

Impact and value of biotechnology
Biotechnology has the unique advantage to be applicable to a variety of pro-
cesses in many sectors like healthcare, industrial and agriculture. Gene technol-
ogy, including gene editing techniques like CrisprCas-9 can be applied across
different fields and have a transformative effect in their areas of application. Very
few other sectors enhance quality of life, knowledge, innovation, productivity, and
environmental protection as biotechnology does.
From new drugs that can address unmet medical needs, fight epidemics and
change paradigm in rare diseases, to industrial processes that use renewable
feed-stocks instead of crude oil, to drought-resistant crops that allow farmers
around the world to better feed more people under increasingly harsher climatic
conditions, the applications of biotechnology are multiple and are promising to
address key challenges for societies like pandemic preparedness, health and

5
 Zika and Institute for Prospective Technological Studies, Consequences, Opportunities and Challenges of Modern Biotech-
nology for Europe.

 10
well-being, global warming and destruction of biodiversity. Promoting and invest-
ing in biotechnology will have economic, societal and environmental impact.
Up to now, the largest impact and value of biotechnology has been seen in the
healthcare sector with breakthrough therapies and medicines that are lives sav-
ing or improving quality of life for patients and their families. The industrial bio-
technology sector itself is on its way to take off with today insufficient detailed
economic data to show its continued progress.
In the past fifteen years, the pharmaceutical industry (formerly part of the chemi-
cal industry) has transformed itself into a so-called biopharmaceutical industry.
With time these companies have become more dependent of new biotechnolo-
gies to bring innovative drugs to the market. This critical knowledge was collected
through alliances with biotechnology companies or through acquisitions of com-
pounds or whole firms often start-ups originating from the United States.
It was in the US where the biotechnology industry was born in 1976 with the
foundation of Genentech (today part of Roche). The first biotechnological pro-
duced drug reached the market in 1982 (Lilly/Genentech), a human insulin, de-
veloped by means of recombinant DNA technology. It was the first human protein
manufactured by engineered bacteria and it replaced the conventional therapy
for patients with diabetes. Before this, insulin was extracted from pancreases of
animals, usually pigs and cows, with the disadvantage of animal contaminants
and limited supply.
Today, biopharmaceuticals (drugs produced on the basis of molecular biotech-
nology) or biologics (protein drugs) are more and more impacting the pharma-
ceutical sector complementing its conventional drugs (mainly produced by chem-
ical synthesis). Especially in the subsector of prescription medicines (commonly
abbreviated as Rx), biotechnological drugs are predominant with regard to growth
in annual worldwide sales as shown in figure 2.

Yearly growth in sales in %
14%
 12%
 10%
 8%
 6%
 4%
 2%
 0%
 -2%
 -4%

 Rx biotechnological Rx non-biotechnological

Figure 2: Annual growth in worldwide sales of prescription drugs (Rx) – biotech versus
non-biotech
Source: Data from Evaluate Pharma; BIO. ASPEKTE & WifOR analysis.

 11
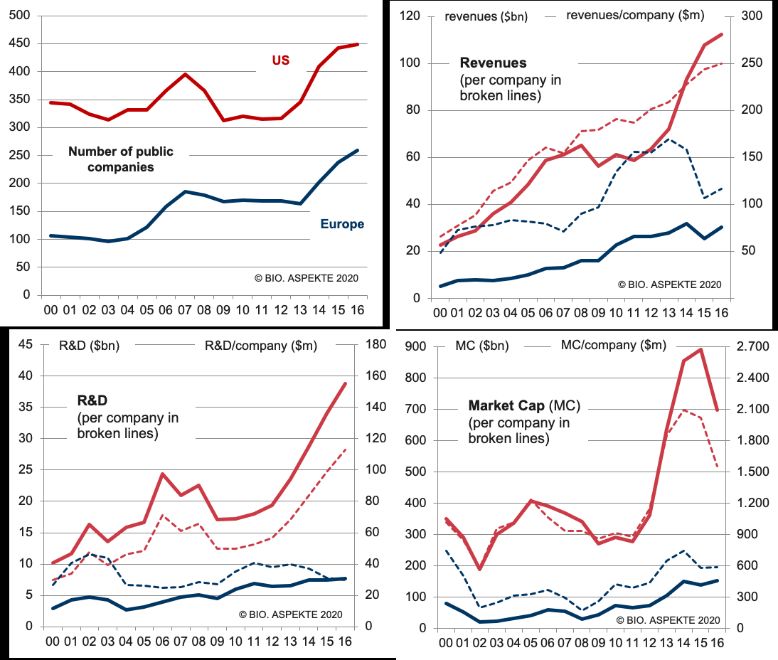
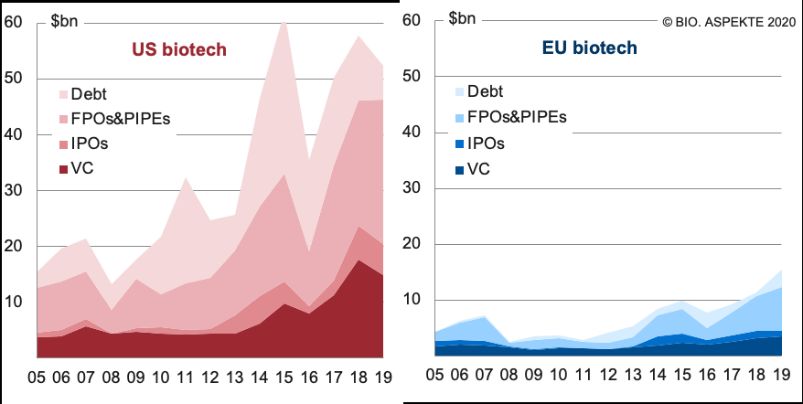
In some of the past years, prescription drugs produced by conventional, non-
biotechnological means have even shown negative development in their world-
wide sales figures. However, for the coming years, the data provider Evalu-
atePharma expects again rising growth rates reaching more than 6% yearly sales
growth beyond 2023. In contrast, biologics often have revealed an annual sales
growth between 8% and 10% as they frequently are more effective than conven-
tional drugs, eg in the field of inflammatory diseases or in some cancers. This will
continue in the near future.
With regard to shares in worldwide prescription drug sales it becomes clear – as
shown in figure 3 – that biotechnological medicines or therapies have increased
over the years. Ranging from about a fifth in the year 2012, their share was nearly
one third in 2019. For 2026 it is expected to reach 36% of all worldwide Rx sales.
Focusing on only the best 100 selling products, biotechnological drugs have sur-
passed the 50% threshold by 2019.

 21%
 31%
 36%
 39%
 47% 45%
 2012 2019 53% 2026e 55%
 61%
 64%
 69%
 79%

 biotechnological conventional

Figure 3: Conventional and biotechnological drugs by shares of worldwide drug sales
Outer circle: all prescription drugs, inner circle: only TOP100 products in sales
Source: Data from Evaluate Pharma; BIO. ASPEKTE & WifOR analysis

Most of the biotechnological drugs were originally developed by US based small
and medium sized enterprises (SME). Some are still existing as independent
firms; others were acquired by larger pharmaceutical companies. For example,
antibodies launched since the 90s by Swiss based pharmaceutical firm Roche,
are especially based on the acquisition of the US biotechnology pioneer Genen-
tech in 1990/2009. In 1990 Roche acquired a major stake and in 2009 the whole
company was taken over. Genentech started in 1976 to develop the first recom-
binant drug ever, namely human insulin produced in bacteria which reached the
market roughly five years afterwards in 1982. The first antibody developed by
Genentech (in collaboration with Biogen), Rituxan/MabThera (brand name in the
US/Europe) was launched to the market 20 years after the firm’s foundation. In
total, the company raised $2 bn in financing before it was completely integrated
into the Roche group. Comparable developments are barely to be found in Eu-
rope due to a later start of the industry (about 10-15 years) and less favourable
financing conditions (see appendix D for more details).
As most of the modern healthcare biotechnology is originating from the US, the
US are still today leading when it comes to the number of public companies, the

 12
size of the overall market capitalization, the level of R&D investments or the to-
tal revenues.

 13
2
European biotechnology
industry’s economic footprint

 14
The purpose of the study is to examine the biotechnology industry in macroe-
conomic categories. In contrast to a purely business perspective, the integra-
tion of the industry in value chains and its importance for the overall economy
can thus also be measured. Through this approach, the results can be com-
pared with national accounts data from statistical offices and thus inform
stakeholders and the general public more precisely.
In other words, the focus will not be longer on the companies and their metrics
itself but on the goods they are producing. This will include the output of SMEs
as well as of larger companies and thus will allow an assesment of the impact
of biotechnology with regard to the whole European economy.
Typically, the value of an economy is measured via the gross domestic prod-
uct (GDP) which sums up the total monetary or market value of all the finished
goods and services produced within a country's borders in a specific time pe-
riod. Related to GDP is gross value added (GVA), what is GDP plus subsidies
and minus taxes on products.
In this analysis the focus will be on the following key indicators:
 • Gross value added: Biotechnology’s contribution to GDP
 • Employment: The number of jobs created, measured on a head-
 count basis
 • Trade: The aggregated value of exported or imported biotechnologi-
 cal produced goods from or into the EU
 • Impact of R&D: Direct GVA of intramural R&D activities in the con-
 sidered industries

Moreover, the following indicators are computed: GVA rate (ratio of direct
GVA to output) and labour productivity (direct GVA per employed person).

 15
GVA as a key figure to measure the contribution to the
economy
A central figure of the economic impact analysis is gross value added (GVA).
It is used to assess the economic contribution of companies or industry sec-
tors to a national or regional GDP. In this sense, GVA is the equivalent of GDP
on company or industry level. Box 2 illustrates why GVA is better suited to
measure economic contributions than, e.g., revenue.

 BOX 2: OUTPUT AND GROSS VALUE ADDED

 € 10 bn
 Gross Output

 € 3 bn € 7 bn
 Sector A
 Intermediate Consumption Gross Value Added

 € 6 bn € 4 bn
 Sector B Intermediate Consumption Gross Value Added

 The illustration shows two industry sectors generating the same amount of gross output while their GVAs
 differ. This difference lies in intermediate consumption: Direct GVA is defined as the difference between
 output and intermediate consumption such that sector A has a higher GVA and hence its direct GDP
 contribution is higher than sector B’s. Sector B’s higher intermediate consumption on the other hand may
 trigger larger indirect GVA contributions along its supply chains. These may, however, occur outside the
 economy under consideration. In this way, GVA draws a more detailed and complete picture of the
 macroeconomic performance of an economic agent than revenue alone.

 GVA rate
 The gross value added rate (GVA rate) is calculated as the ratio of GVA and output. It shows the integration
 of the upstream gross value added stages into the economic activities of a company or industry.
 A company or industry with a high GVA rate is characterised by strong vertical integration and as a result
 generates most of its gross value added directly.

 In this example, sector A has a 70% and sector B a 40% GVA rate.

Due to its strong link to the GDP, the GVA enables companies and industries
to report their performance in a way that ensures comparability with other eco-
nomic actors as well as political targets. Many political goals are defined in

 16
terms of GDP or value added, such as the Europe 2020 target to spend 3%
 of GDP on research and development.6
 In the following the key findings from the economic impact on the EU28 econ-
 omy of the European biotechnology industry are presented. The aggregated
 economic contributions of the biotechnology industry to the EU28 economy
 are presented in terms of gross value added, employment and trade.7.

 Gross Value Added Effects
 At 44%, the GVA rate of the EU biotechnology industry indicates a substantial
 share of intermediate consumption in comparison to GVA. This GVA rate in-
 dicates relatively high value creation at the biotechnology industry’s suppliers
 and therefore high spillover effects in the European economy.
 Biotechnology as we define it, is a cross-sectoral industry. Apart from that, the
 three subsectors (healthcare, industrial and agricultural biotechnology) mostly
 reflect the characteristics of their corresponding industry sectors (pharmaceu-
 tical and chemical manufacturing, agriculture) in terms of GVA rates and in-
 termediate consumption. However, it must be taken into account that for the
 purpose of this study few specific goods from the food sector are included8 in
 order to comply with the industry definition given in the annex. Thus, their in-
 fluence on the total biotechnology GVA rate is marginal.
Total contribution to GDP

 Total contribution to GDP

 € 34.5 bn Direct GDP contribution

 € 78.7 bn € 27.8 bn Indirect GDP contribution
 Gross value added
 in 2018

 € 16.5 bn Induced GDP contribution

 Figure 4: Direct, indirect, and induced GVA effects of Europe’s biotechnology
 industry in 2018.
 Source: Eurostat: Prodcom database;WIOD; WifOR analysis.
2020 WifOR calculation, differences in the totals are due to rounding.
 21
 Measuring the Economic Footprint of the Biotech Industry in Europe

 In terms of direct GVA, the biotechnology industry’s contribution of €34.5 bn
 accounts for about 1.51% of the European industrial sector. In other words,
 this is approximately one third of the size of the computer, electronic and

 6
 European Commission, ‘Taking Stock of the Europe 2020 Strategy for Smart, Sustainable and Inclusive Growth’.
 7
 Comparisons to European industries are based on official data for the EU28 aggregate.
 8
 Included products from the food and feed sector are: yeast, human milk oligosaccharides, food colorants and several
 preparations for animal feed.

 17
optical products manufacturing sector.9 The highest direct GVA is created by The highest
pharmaceutical biotechnology (€29.9 bn), followed by industrial biotechnology
(€4.5 bn) and agricultural biotechnology (€134 m). spillover GVA
The total GVA effects amount to €78.7 bn which is almost the direct GDP impact was
contribution of the European media industry.10 Of these €78.7 bn, direct ef- generated in the
fects account for 44%. The remaining 56% or €44.3 bn are spillover effects
triggered throughout the EU28. These spillover effects consist of €27.8 bn in industrial
indirect and €16.5 bn in induced effects (see figure 4). Correspondingly, for biotechnology
each directly generated Euro of GVA,
 Total contribution effect of €1.3 were generated in
 an additional
 to GDP,
the EU28 economy.11 sector.
 distribution per sector

 Total contribution to GDP, effect distribution per sector

 Healthcare biotechnology Industrial biotechnology Agricultural biotechnology

 20,5% 47,2% 23,0% 29,6% 20,5% 47,2%

 €63.3 bn €15.1 bn €0.3 bn

 32,3%
 47,4% 32,3%

 GDP contribution: Direct Indirect Induced

Figure 5: Distribution of direct, indirect and induced GVA effects for the 5

biotechnology sub-sectors.
Source: Eurostat: Prodcom database; WIOD; WifOR analysis.

Broken down by the biotechnology subsectors, the characteristics of these
industries can be easily identified. The GVA spillover effects (indirect and in-
duced combined) of the industrial biotechnology are significantly higher than
in the pharmaceutical or agricultural subsector as they rely more heavily on
intermediate inputs. However in agricultural biotech, induced GVA effects are
relatively low (17% of the total effect). This is because consumption along the
value chain in this specific sector is not as high as in manufacturing industries
(figure 5).

9
 €98.3 bn in 2014, EU28, NACE C26. Eurostat: NAMA 64a: National accounts aggregates by industry.
10
 €79.9 bn in 2017, EU28, NACE J59_J60: Motion picture, video, television programme production; programming and
broadcasting activities. Eurostat: NAMA 64a: National accounts aggregates by industry.
11
 The spillover multiplier is the ratio of spillover effects to direct effects.

 18
Direct GVA effect caused by Biotech sectors
€ bn
 40
 34,5
 35 31,1
 29,3 29,6
 27,3 28,0
 30 25,8 26,4
 24,5
 23,0 21,9
 25
 20
 15
 10
 5
 0
 2008 2009 2010 2011 2012 2013 2014 2015 2016 2017 2018
 Healthcare Biotech Industrial Biotech Agricultural Biotech

Figure 6: GVA time series for the EU biotechnology industry (EU28, current prices).
Source: Eurostat: Prodcom database; WIOD; WifOR analysis.

A longer-term view shows that the contribution to growth made by the EU bi-
otechnology industry has grown steadily since 2008, except for the year of the
financial crisis in 2009. The biotechnology sector is thus a relevant growth
driver (figure 6). One reason for this is the expanding adaptation of biotech-
nological processes, which are increasingly replacing and displacing conven-
tional production methods.

 GVA growth rates

 Automotive industry 4,5%

 Healthcare biotech 4,3%

 Total biotech 4,1%

 Agricultural biotech 3,8%

 Industrial biotech 2,9%

 Mechanical engineering 2,5%

 Information and communication 2,0%

 Total economy 1,8%

 Manufacture of computer products 0,6%

Figure 7: GVA compound average growth rate, (2008-2018).
Source: Eurostat: Prodcom database, NAMA 64a; WIOD; WifOR analysis.

The average growth rates support this interpretation, as each of the three bi-
otechnology sectors has a higher growth rate than the total economy (figure
7). In addition, the biotechnology sector can also exceed the growth of highly
innovative industries such as mechanical engineering (2.5%) or

 19
manufacturing of computer products (0.6%) in the period from 2008 to 2018.
Of the three biotechnology sectors, the pharmaceutical biotechnology sector
not only has the highest absolute contribution to GDP (€29.9 bn), but also the
highest growth rate (4.3%).

Labour productivity
The labour productivity of the EU biotechnology industry amounted to
€154,500 GVA per employee (figure 8). This comparably high labour produc-
tivity shows that the EU biotechnology industry is very efficient and capital
intensive.

 Healthcare biotechnology 170.200 €

 Total biotechnology 154.500 €

 Financial and insurance activities 118.800 €

 Industrial biotechnology 103.400 €

 Information and communication 102.100 €

 Manufacturing 68.800 €

 Total economy 59.500 €

 Trade, transport, accomodation 45.600 €

 Agricultural biotechnology 30.500 €

 Agriculture, forestry and fishing 22.900 €

Figure 8: Labour productivity in the EU28, 2018, GVA per person employed.
Source: Eurostat: Prodcom database, NAMA 64a, NAMA 64e; WIOD; WifOR analysis.

The biotechnology industry even outperforms highly productive industries
such as information and telecommunication (€102,100) or financial and insur-
ance activities (€118,800) and positions itself well above the manufacturing
industry (€68,800), and the total economy (€59,500).12

12
 Latest industry data for EU28 from Eurostat.

 20
Employment effects
 In addition to their GDP contribution, the EU biotechnology industry also con-
 tributes to the EU labour market.
 Total contribution to the EU28 labour market

 Total contribution to the EU28 labour market

 223,000 Direct employment

 933,500 444,200 Indirect employment
 employees
 in 2018

 266,300 Induced employment

 Figure 9: Direct, indirect, and induced employment effects of the EU biotechnology
 industry.
 Source: Eurostat: Prodcom database; WIOD; WifOR analysis.
2020 WifOR calculation, differences in the totals are due to rounding.
 6
 Measuring the Economic Footprint of the Biotech Industry in Europe

 In 2018, around 223,000 people were directly employed in the EU biotechnol-
 ogy industry, most of them in the healthcare biotechnology sector (175,400;
 79%), followed by industrial biotechnology (43,200; 19%) and agricultural bi-
 otechnology (4,400; 2%).
 In addition to the 223,000 jobs directly created by the biotechnology industry,
 they also supported almost 710,500 indirect and induced jobs. Consequently,
 the total employment effects of the EU biotechnology industry amount to
 933,500 jobs. The reason for the additional 710,500 jobs on top of the jobs
 directly created is that the biotechnology industry purchases services and
 goods from suppliers, which in turn leads to an increase in production and
 employment in the supplying industries (indirect jobs). Moreover, generated
 income along this value chain is spent in the overall economy and thus triggers
 additional job creation. This effect varies depending on the industry and its
 corresponding supply chain. For the biotechnology industry, this translates
 into an employment spillover multiplier of 3.2, or in other words, for each direct
 job, another 3.2 jobs were supported within the overall economy.
 This value is in the upper middle range: For example, the spillover multiplier
 of the automotive industry is ahead with 4.2, meaning that for one job approx-
 imately more than four additional jobs are supported along European supply
 chains. But there are also sectors with a substantial lower employment multi-
 plier, for example in the wholesale trade sector 1.4 and in the agricultural sec-
 tor only 0.6 additional jobs are supported.13

 13
 Latest industry data for EU28 from WIOD.

 21
Total contribution to EU28 labour
 market, effect distribution per sector

 Total contribution to EU28 labour market, effect distribution per sector

 Healthcare biotechnology Industrial biotechnology Agricultural biotechnology

 24,9% 11,3%
 29,7% 19,4%
 25,2% 62,0%

 703,700 222,700 7,100
 26,8%

 45,3% 55,4%

 Labour market contribution: Direct Indirect Induced

Figure 10: Distribution of direct, indirect and induced employment effects for the 6
biotechnology sub-sectors.
Source: Eurostat: Prodcom database; WIOD; WifOR analysis.

Looking at the three biotechnology sectors, it can be seen that the agricultural
biotechnology has the lowest employment spillover effects, as this sector re-
lies least on labour-intensive inputs. Within its value chain, the majority of the
workforce (62%) is already tied up in actual production, i.e. as a direct effect.
The opposite is true for industrial biotechnology: its intermediate consumtion
is so labour-intensive that more than half of the total effect is accounted for by
the employees of suppliers (55.4%). Healthcare biotechnology is positioned
between these two extremes. These differences may become clearer if only
the multipliers are compared as shown in figure 11.

 Comparison of employment spillover multipliers For each direct job
 in industrial
 Automotive 4,2
 biotechnology,
 Chemicals 3,4
 another 4.2 jobs
 Computer products 2,2
 were supported in
 Elecrical equipment 2,1
 the overall
 Wholesale trade 1,4
 economy.
 Industrial biotechnology 4,2

 Total biotechnology 3,2

 Healthcare biotechnology 3,0

 Agricultural biotechnology 0,6

Figure 11: Employment spillover multipliers for the biotechnology sectors and
comparable industries
Source: Eurostat: Prodcom database; WIOD; WifOR analysis.

For every job directly generated by healthcare biotech, three additional jobs
are supported in the total economy, leading to a spillover effect of more than
528,300 jobs. Industrial biotechnology is at the top of the biotechnology

 22
sectors with an employment multiplier of 4.2. The sector is thus responsible
for additional 180,000 jobs in the EU28.

 Direct employment effect by biotech sectors
1'000 persons employed
250 223,0
 190,1 188,0 191,5 191,7 182,9 192,4
200 172,5 180,3 183,7
 160,2
150

100

 50

 0
 2008 2009 2010 2011 2012 2013 2014 2015 2016 2017 2018
 Healthcare biotech Industrial biotech Agricultural biotech

Figure 12: Employment time series for the EU biotechnology industry (EU28).
Source: Eurostat: Prodcom database; WIOD; WifOR analysis.

In contrast to gross value added, there is no evidence of a steady increase in
employment (figure 12). From 2010 to 2017, the number of employees was
relatively constant between 180,000 and 192,000. The rapid increase in em-
ployment in 2018 up to 223,000 persons, shows a new dynamic for skilled
workers in the biotechnology sector.

 Employment growth rates

 Agricultural biotech 3,6%

 Healthcare biotech 2,7%

 Total biotech 2,6%

 Industrial biotech 2,0%

 Information and communication 1,4%

 Total economy 0,2%

Figure 13: Employment compound average growth rate, 2008-2018.
Source: Eurostat: Prodcom database, NAMA64e; WIOD; WifOR analysis.

Although the absolute employment figures do not allow such a clear interpre-
tation as the value added, when compared to the overall economic employ-
ment growth rate (0.2%), it is clear that the biotechnology industry is a positive
stimulus for the European labour market (2.6% annual growth). The absolute
employment figures for biotechnology are outperforming the overall economy
employment growth with a clear acceleration in 2018 due to the technologies

 23
introduced in both healthcare and industrial biotechnology like advanced ther-
apies and new biologics for health and new industrial processes.

Trade
In 2018, biotechnology industry exports from the EU28 (extra-EU exports)
amounted to €45.0 bn (figure 14). This is a doubling in export volume since
the financial crisis of 2009 and thereby an outstanding performance given the
relatively youth of the industry. While its share in total economic value added
is only 0.2%, biotechnological exports account for 2.3% of all exports from the
EU to the rest of the world and shows the tremendous potential of biotechnol-
ogy exports In addition, between 2008 and 2018, the average annual growth
of biotechnology exports (8.4%) has increased more than twice as much as
total exports (4.1%).

 Extra-EU biotech export trade
€ bn
50 45,0 5%
 42,5
 39,0 38,7
40 4%
 31,5 32,7
 30,3
 27,3
30 25,0 3%
 22,0
 20,1
20 2%

10 1%

 0 0%
 2008 2009 2010 2011 2012 2013 2014 2015 2016 2017 2018
 Healthcare biotech Industrial biotech share of total exports

Figure 14: Extra-EU28 exports of the biotechnology industry.
Source: Eurostat: Prodcom database; WifOR analysis.

In addition, between 2008 and 2018, the average annual growth of biotech-
nology exports (8.4%) has increased more than twice as much as total exports
(4.1%).
Biotechnology imports from outside the EU28 (extra-EU imports) almost dou-
bled over the period under review from €11.6 bn to €22.6 bn, despite the high
international integration of the biotechnology value chains this is half the level
of exports already mentioned (figure 15).

 24
Extra-EU biotech import trade
€ bn
50 5%

40 4%

30 3%
 21,3 22,0 22,6
 20,6
 17,1 16,9 17,7
20 14,1 15,6 2%
 11,6 12,3
10 1%

 0 0%
 2008 2009 2010 2011 2012 2013 2014 2015 2016 2017 2018
 Healthcare biotech Industrial biotech share of total imports

Figure 15: Extra-EU28 imports of the biotechnology industry.
Source: Eurostat: Prodcom database; WifOR analysis.

As a result, biotechnology exports and imports result in a significant trade sur-
plus of €22.3 bn in 2018 as it is shown in figure 16. In fact, the European
biotechnology industry’s exports are about twice as high as its imports. This
is relevant beyond the resulting payment flows into the exporting EU member
states, as it is associated with a lower dependence on non-European coun-
tries

 Extra-EU biotech balance of trade
€ bn
 50

 40

 30
 22,3
 20,5
 18,4 17,5
 20 14,6 15,0
 11,7 13,2
 9,7 10,9
 8,5
 10

 0
 2008 2009 2010 2011 2012 2013 2014 2015 2016 2017 2018
 Healthcare biotech Industrial biotech

Figure 16: Extra-EU28 trade balance of the EU biotechnology industry.
Source: Eurostat: Prodcom database; WifOR analysis.

However, the international integration of the industry could experience severe
setbacks in the event of external shocks, such as the current Covid-19 crisis.
For example, the distribution of life-saving medicines to developing countries
via airfreight was severely restricted at the beginning of the pandemic, when
first countries imposed lockdowns and international air traffic came to a virtual

 25
standstill.14 Many industries were reviewing their international supply chains
in light of the threat of border closures. Especially for pharmaceuticals and
medical equipment, there were demand peaks caused by hording behaviour
of consumers and increased stockpiling by governments which received sig-
nificant financial support from the European Commission.15
Moreover, several EU member states imposed export bans on numerous
drugs which lead to shortages.16 In this context, it is not surprising that, de-
pending on how supply chains have been disrupted during the crisis, a ten-
dency of re- or near-shoring in some industries and a stronger focus on more
sustainable supply chains is expected to happen.17 But a regionalization of
supply chains could potentially increase prices, reduce the diversification of
suppliers worldwide and hence especially affect developing countries as they
loose access to global value chains and their benefits.18
This study shows that the highly internationally integrated biotechnology in-
dustry has created a significant trade surplus in the EU in the last 10 years
that can certainly be accelerated in the future with the right incentives and an
open view to international trade value chains.

14
 UNICEF, ‘Impact of COVID-19 on Vaccine Supplies’.
15
 European Commission, ‘COVID-19: Commission Creates First Ever RescEU Stockpile’.
16
 Reuters, ‘EU Urges States to Lift Export Bans on Drugs That May Lead to Shortages’.
17
 International Labour Organization (ILO), ‘The Effects of COVID‑19 on Trade and Global Supply Chains’.
18
 Seric et al., ‘Managing COVID-19: How the Pandemic Disrupts Global Value Chains’.

 26
Impact of research and development
The direct contribution to GDP made by the biotechnology industry through its
internal research activities amounted to around €2.7 bn in 2018. This repre-
sents an absolute increase of around €0.9 bn since 2008 and corresponds to
an average annual growth rate of 4.5%.
This activity is thus growing faster than the biotechnology industry as a whole
(4.1%). In 2018, healthcare biotechnology contributed €2.5 bn and industrial
biotechnology €0.2 bn.

 Direct GVA effect caused by biotech R&D activities
 € bn
 3,0 2,72
 2,52 2,52
 2,35 2,30 2,41 2,34
 2,5 2,27
 1,98
 2,0 1,76 1,79

 1,5

 1,0

 0,5

 0,0
 2008 2009 2010 2011 2012 2013 2014 2015 2016 2017 2018
 Healthcare biotech Industrial biotech

Figure 17: Direct GVA impact of the EU biotechnology industry’s R&D activities
(EU28, current prices).
Source: Eurostat: Prodcom database, BERD, teina075_r2, WIOD; WifOR analysis.

Rarely before has an event spurred the global research community as much
as the Covid-19 pandemic. The time series presented here do not capture this
research acceleration, but the literature already anticipates shifts in research
resources towards a vaccine or treatments against Covid-19 which could re-
sult in significant increase of biotechnological R&D activities analysed here.19

19
 Ayati, Saiyarsarai, and Nikfar, ‘Short and Long Term Impacts of COVID-19 on the Pharmaceutical Sector’.

 27
3
Conclusion

 28
The EU Biotechnology sector: all the characteristics of
a transformative industry for the 21st century
Biotechnology is one of the key enabling technologies of the 21st century20
that has the transformative potential to change our lives for the better. For
urgent global challenges such as climate change, health and well-being, pan-
demic preparedness, and destruction of biodiversity it can bring exceptional
benefits and sustainable value propositions to society.21
As our study shows, biotechnology is not only important with regard to en-
hanced quality of life, knowledge, innovation, and environmental protection,
but it has also a significant economic impact with outstanding potential. The
European biotechnology industry showed an average GVA (gross value
added) growth rate of 4.1% between the years 2008 and 2018. That puts it on
a par with other highly innovative sectors
A comparatively high GVA rate of 44% shows that the major value creation
takes place within the industry and is not outsourced to suppliers. This is an
indicator of an innovative industry that provides high-quality goods. In 2018, it
contributed €34.5 bn to the EU28 GDP which represents an increase of €11.5
bn since 2008. Spillover effects, which are due to the purchase of inputs and
the expenditure of income, amount to €44.3 bn in 2018 and thus clearly shows
the additional economic impact of the industry's intra-European value chains.
Each Euro of Gross Value Added generated in the biotechnology industry con-
sequently leads to an additional €1.3 GVA in the overall economy.
The breakthroughs of the biotechnology industry have fully transformed the
pharmaceutical supply in the last decade and with new advanced therapies
and biotechnology-based treatment options this trend will continue to acceler-
ate. No other industry has been shaped in recent decades by the increasing
importance of biotechnology as much as the pharmaceutical market. In Eu-
rope, the healthcare biotechnology sector alone accounted for €29.9 bn or
86% of the total biotechnology industry in 2018. In the industrial biotechnology
sector this transformation is also in the making. The private and public sectors
use industrial biotechnology tools to develop and market a range of novel
products. Already today, industrial biotechnology is a central pillar of innova-
tion in Europe and a key enabler in the transition towards a more sustainable
and competitive circular bioeconomy.
The insignificance of the agricultural biotechnology in the EU (€134 m GVA in
2018) is the direct consequence of a too complex and rigid policy framework
that limits the EU’s acreage for GM crops. This greatly reduces the possibility
and incentive to invest in this sector, creates a challenging environment for
research and limits access to innovation for farmers in most EU member
states.22

20
 Organisation for Economic Co-operation and Development, 21st Century Technologies.
21
 Meyer, ‘Sustainability and Biotechnology’.
22
 USDA Foreign Agricultural Service, ‘EU-28 - Agricultural Biotechnology Annual’.

 29
The fact that regulation can almost bring an essential sector to a standstill is
shown by the low contributions to GDP of agricultural biotech. This sector has
moved to other areas of the world and the economic effects are now being
achieved outside the EU.
However, the biotechnology industry’s dynamism outstrips that of many com-
peting sectors with its high productivity in the sectors where it can flourish. Its
ability to safeguard 223,000 jobs directly and 933,500 in total including spill-
over effects along the value chain, its doubling of exports since 2008 and its
trade surplus of €22.3 bn in 2018 are proof of its competitiveness on the world
market.
This study is by definition only a snapshot of the biotechnology sector. The
industry benefits from a highly educated workforce, a functioning and barrier-
free EU internal market that allows and facilitates cross-border value chains
and consistent regulation. As soon as these conditions are questioned, as it
became evident from some short-term market interventions during the Corona
crisis, it may also affect unfavourably the European biotechnology ecosystem.
To develop the biotechnology sector as a whole, stakeholders should not only
consider the direct effects of this industry but also its high degree of intercon-
nectivity and integration with the European economy as illustrated by the eco-
nomic footprint study.
In July 2020, EU leaders agreed on a recovery plan and a multiannual finan-
cial framework for 2021-2027. One of the aims of this plan is to help the EU
rebuild after the COVID-19 pandemic and promote investment in the environ-
ment, digital transformation and citizens health and well-being. Among other
things, one approach involves the promotion of stronger supply chains within
the EU and the support of key sectors and technologies.23
Our study results show that the biotechnology industry has all the character-
istics of such a transformative industry: above-average growth, high-value
employment for the long run, a constant increase of R&D activities, highly in-
novative products that extend the lives and increase quality of life of European
citizens, creation of a more efficient manufacturing processes, and building
the trade surplusses for competitiveness on the global market and new solu-
tions for the global challenges of our planet.

23
 European Commission, ‘Recovery Plan for Europe’; European Commission, ‘An Enhanced Invest Eu Programme And
New Strategic Investment Facility To Help Kick-Start The Economy’.

 30
A
References

 31
Literature and weblinks
Ayati, Nayyereh, Parisa Saiyarsarai, and Shekoufeh Nikfar. ‘Short and Long
 Term Impacts of COVID-19 on the Pharmaceutical Sector’. DARU
 Journal of Pharmaceutical Sciences, 3 July 2020.
 https://doi.org/10.1007/s40199-020-00358-5.
BIC, and nova-Institute. ‘European Bioeconomy in Figures 2008–2017’.
 Hürth, 2020. https://biconsortium.eu/sites/biconsortium.eu/files/down-
 loads/BIC%20%26%20nova-Institute%20-%20Bioecon-
 omy%20in%20figures%202008-2017.pdf.
EuropaBio. ‘Biotechnology Industry Manifesto 2019. Resetting the Ambition
 for Biotechnology in the EU’. Brussel, 2019. https://www.europa-
 bio.org/sites/default/files/Biotechnology%20Industry%20Mani-
 festo%202019_0.pdf.
European Commission. A Sustainable Bioeconomy for Europe: Strengthen-
 ing the Connection between Economy, Society and the Environment.
 Updated Bioeconomy Strategy. Luxembourg: Publications Office,
 2018. https://data.europa.eu/doi/10.2777/792130.
———. ‘An Enhanced Invest Eu Programme And New Strategic Investment
 Facility To Help Kick-Start The Economy’. Brussels, 2020.
 https://ec.europa.eu/info/sites/info/files/economy-finance/investeu-
 factsheet.pdf.
———. ‘COVID-19: Commission Creates First Ever RescEU Stockpile’,
 2020. https://ec.europa.eu/commission/presscorner/de-
 tail/en/ip_20_476.
———. Innovating for Sustainable Growth: A Bioeconomy for Europe. LU:
 Publications Office, 2012. https://data.europa.eu/doi/10.2777/6462.
———. ‘Recovery Plan for Europe’. Brussels, 2020. https://ec.eu-
 ropa.eu/info/live-work-travel-eu/health/coronavirus-response/recov-
 ery-plan-europe_en.
———. ‘Taking Stock of the Europe 2020 Strategy for Smart, Sustainable
 and Inclusive Growth’, 2014. https://eur-lex.europa.eu/legal-con-
 tent/EN/TXT/HTML/?uri=CELEX:52014DC0130&from=EN.
Eurostat. NACE Rev. 2. Statistical Classification of Economic Activities in the
 European Community. Luxemburg: Office for Official Publications of
 the European Communities, 2008. https://ec.europa.eu/eurostat/doc-
 uments/3859598/5902521/KS-RA-07-015-EN.PDF/dd5443f5-b886-
 40e4-920d-9df03590ff91.
IDEA Consult, Center for European Economic Research (ZEW), Niedersäch-
 sisches Institut für Wirtschaftsforschung (NIW), TNO, CEA, Ecorys
 UK, and Fraunhofer Institute for Systems and Innovation Research
 ISI. ‘Key Enabling Technologies (KETs) Observatory. Second Re-
 port’. Brussels, 2015. https://www.eusemiconductors.eu/sites/de-
 fault/files/uploads/Dec2015_KETs_Observatory_Second-Report.pdf.

 32
International Labour Organization (ILO). ‘The Effects of COVID‑19 on Trade
 and Global Supply Chains’. Gemeva, 2020.
 https://www.ilo.org/wcmsp5/groups/public/---dgreports/---inst/docu-
 ments/publication/wcms_746917.pdf.
International Service for the Acquisition of Agri-biotech Applications (ISAAA).
 ‘Global Status of Commercialized Biotech/GM Crops in 2017: Biotech
 Crop Adoption Surges as Economic Benefits’. BRIEF 53, 2018.
 http://www.isaaa.org/resources/publications/briefs/53/.
Meyer, Hans-Peter. ‘Sustainability and Biotechnology’. Organic Process Re-
 search & Development 15, no. 1 (2011): 180–88.
 https://doi.org/10.1021/op100206p.
Miller, Ronald E., and Peter D. Blair. Input-Output Analysis: Foundations and
 Extensions. Cambridge University Press, 2009.
Organisation for Economic Co-operation and Development, ed. 21st Century
 Technologies: Promises and Perils of a Dynamic Future. Paris:
 OECD, 1998.
Reuters. ‘EU Urges States to Lift Export Bans on Drugs That May Lead to
 Shortages’. Brussels, 2020. https://www.reuters.com/article/health-
 coronavirus-eu-drug/eu-urges-states-to-lift-export-bans-on-drugs-
 that-may-lead-to-shortages-idUSL5N2BW05A.
Seric, Adnan, Holger Görg, Saskia Mösle, and Michael Windisch. ‘Managing
 COVID-19: How the Pandemic Disrupts Global Value Chains’. Vi-
 enna: UNIDO, 2020. https://iap.unido.org/articles/managing-covid-19-
 how-pandemic-disrupts-global-value-chains.
Timmer, Marcel P., Erik Dietzenbacher, Bart Los, Robert Stehrer, and
 Gaaitzen J. de Vries. ‘An Illustrated User Guide to the World Input-
 Output Database: The Case of Global Automotive Production: User
 Guide to World Input-Output Database’. Review of International Eco-
 nomics 23, no. 3 (August 2015): 575–605.
 https://doi.org/10.1111/roie.12178.
UNICEF. ‘Impact of COVID-19 on Vaccine Supplies’, 2020.
 https://www.unicef.org/supply/stories/impact-covid-19-vaccine-sup-
 plies.
USDA Foreign Agricultural Service. ‘EU-28 - Agricultural Biotechnology An-
 nual’, 2018. https://apps.fas.usda.gov/newgainapi/api/report/down-
 loadreportbyfilename?filename=Agricultural%20Biotechnol-
 ogy%20Annual_Paris_EU-28_12-14-2018.pdf.
Zika, Eleni, and Institute for Prospective Technological Studies. Conse-
 quences, Opportunities and Challenges of Modern Biotechnology for
 Europe. Seville: Joint Research Centre, 2007.

 33
Data sources
Eurostat: agr_r_accts: Economic accounts for agriculture by NUTS 2 re-
 gions, Last update: 30.07.2020, Weblink: https://appsso.euro-
 stat.ec.europa.eu/nui/show.do?dataset=agr_r_accts&lang=en
Eurostat: apro_cpnh1: Crop production in national humidity, Last update:
 30.07.2020, Weblink: http://appsso.eurostat.ec.eu-
 ropa.eu/nui/show.do?dataset=apro_cpnh1&lang=en
Eurostat: BERD: Business expenditure on R&D by NACE Rev. 2 activity and
 type of costs, Weblink: http://appsso.eurostat.ec.eu-
 ropa.eu/nui/show.do?dataset=rd_e_berdcostr2&lang=en, Last up-
 date: 01.10.2020
Eurostat: NAMA 64a: National accounts aggregates by industry, Last up-
 date: 30.07.2020, Weblink: http://appsso.eurostat.ec.eu-
 ropa.eu/nui/show.do?dataset=nama_10_a64&lang=en
Eurostat: NAMA 64e: National accounts employment data by industry, Last
 update: 30.07.2020, Weblink: http://appsso.eurostat.ec.eu-
 ropa.eu/nui/show.do?dataset=nama_10_a64_e&lang=en
Eurostat: PRODCOM database. https://ec.europa.eu/eurostat/de/web/prod-
 com/overview
Eurostat: teina075_r2: Compensation of employees - NACE Rev. 2, Web-
 link: http://appsso.eurostat.ec.europa.eu/nui/show.do?da-
 taset=teina075_r2&lang=en, Last update: 01.10.2020
State of the environment portal: Areas planted with genetically modified
 maize in Portugal, last update: 30.07.2020, Weblink:
 https://rea.apambiente.pt/content/genetically-modified-organ-
 isms?language=en
WIOD: World Input-Output Database, Weblink: http://www.wiod.org/home

 34
B
Data Sources and Methodology

 35
Data sources
For this study on the economic footprint of the biotechnology industry in Eu-
rope, several, mostly official, statistics habe been used. Most notable is the
Statistics on production of manufactured goods (PRODCOM), the EU produc-
tion statistics for mining, quarrying and manufacturing. These statistics allow
access to production values, exports and imports of about 3,900 industrially
manufactured goods (representing section B to C of NACE Rev. 2) for all EU
Member States in an annual survey since the early 1990s. This allows a de-
tailed sectoral definition of the biotechnology industry. NACE is the French
abbreviation24 for the Statistical Classification of Economic Activities in the Eu-
ropean Community which is used by statistical authorities to distinguish be-
tween different industries.
Data restrictions at country level, in particular for pharmaceutical goods, re-
quired a data correction, otherwise the production value of the goods con-
cerned would have been massively underestimated. For this purpose, country
values have been compared with the EU28 aggregate and allocated to the
countries concerned according to the relative share of the parent industry
(NACE 2-digit level). This was done using national accounts tables from Eu-
rostat.
As agriculture is not part of the production statistics, a different approach had
to be taken here to determine the biotech-relevant production value. Genet-
ically modified insect resistant maize (GM IR maize) is the only biotechnolog-
ical event approved in the EU25 and the only genetically modified plant with a
significant acreage under cultivation in the EU. A further limitation is that Spain
and Portugal are the only EU countries which planted GM IR maize annually
between 2008 and 2018.
Thus, in order to determine the relevant production value for the agricultural
biotechnology sector, the share of biotechnological maize acreage of Portu-
gal26 and Spain27 in the corresponding national total maize acreage28 is multi-
plied by the total value of grain maize production 29 and the average yield
markup derived from Brooks (2019) to take into account the improved effi-
ciency of GM IR maize.

24
 "nomenclature statistique des activités économiques dans la Communauté européenne"
25
 International Service for the Acquisition of Agri-biotech Applications (ISAAA), ‘Global Status of Commercialized Bio-
tech/GM Crops in 2017: Biotech Crop Adoption Surges as Economic Benefits’, 92.
26
 State of the environment portal: Areas planted with genetically modified maize in Portugal.
27
 International Service for the Acquisition of Agri-biotech Applications (ISAAA), ‘Global Status of Commercialized Bio-
tech/GM Crops in 2017: Biotech Crop Adoption Surges as Economic Benefits’, 93.
28
 Eurostat: apro_cpnh1, Crop production in national humidity.
29
 Eurostat: agr_r_accts: Economic accounts for agriculture by NUTS 2 regions.

 36
You can also read