An overview of the market for Pacific Island coconut products and the ability of industries to respond - Pacific Island Farmers Organisation Network
←
→
Page content transcription
If your browser does not render page correctly, please read the page content below
An overview of the market for Pacific
  Island coconut products and the
   ability of industries to respond

                              by
             Andrew McGregor with Mark Sheehy
         Pacific Island Farmers Organisation Network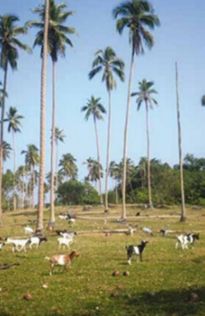
An overview of the market
 for Pacific Island coconut
products and the ability of
   industries to respond
                        by
       Andrew McGregor with Mark Sheehy
   Pacific Island Farmers Organisation Network

                 Suva, Fiji, 2017
© Pacific Community (SPC) 2017

   All rights for commercial/for profit reproduction or translation, in any form, reserved. SPC authorises the partial
  reproduction or translation of this material for scientific, educational or research purposes, provided that SPC and
 the source document are properly acknowledged. Permission to reproduce the document and/or translate in whole,
  in any form, whether for commercial/for profit or non-profit purposes, must be requested in writing. Original SPC
                       artwork may not be altered or separately published without permission.

                                                 Original text: English

                                  Pacific Community Cataloguing-in-publication data

McGregor, Andrew

An overview of the market for Pacific Island coconut products and the ability of industries to respond / by Andrew
McGregor with Mark Sheehy

1.       Coconut — Oceania.
2.       Cooking (Coconut oil) — Oceania.
3.       Coconut industry — Oceania.
4.       Coconut oil — Oceania.
5.       Coconut products — Oceania.

I. McGregor, Andrew II. Sheehy, Mark III. Title IV. Pacific Community

641.34610995								                                                             AACR2

ISBN: 978-982-00-1084-0

                  Prepared for publication at SPC’s Regional Office, Private Mail bag, Suva, Fiji, 2017
                                                     www.spc.int
                                  Printed by Quality Print Limited, Suva, Fiji, 2017

ii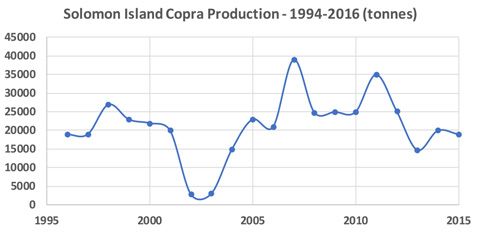
Contents
Abbreviations.......................................................................................................................................................... iv
1. Summary............................................................................................................................................................... 1
Traditional export markets for PIC coconut products.................................................................................................... 1
Analysis of coconut oil prices over the last 20 years...................................................................................................... 2
Non-traditional markets for PIC coconut products: a focus on virgin coconut oil (VCO) .............................................. 2
PICs adjusting to the changing VCO market situation: market considerations.............................................................. 2
Coconut water................................................................................................................................................................ 3
Coconut cream and milk products................................................................................................................................. 3
Coconut timber............................................................................................................................................................... 3
2. The core value chains for coconut products.......................................................................................................... 5
2.1 Four broad markets and core value chains for coconut products............................................................................ 5
3. Core market developments since the turn of the century...................................................................................... 7
3.1 Global vegetable oil markets.................................................................................................................................... 7
3.1.1 Coconut oil in the vegoil complex.................................................................................................................... 7
3.1.2 The inter-relationship between prices within in the vegoil complex . .......................................................... 10
3.1.3 Increasing income driving the increased demand for vegetable oil ............................................................. 11
3.1.4 The changing structure of vegetable oil consumption for non-food uses..................................................... 12
3.1.5 Summary........................................................................................................................................................ 12
3.2 Coconut oil and copra as commodities in international trade and ....................................................................... 13
the performance of PIC exporters................................................................................................................................ 13
3.2.1 Current trade in coconut oil and copra.......................................................................................................... 13
3.2.2 The traditional nature of the coconut oil and copra market......................................................................... 16
3.2.3 Time series analysis of coconut product prices and their trends ................................................................. 16
3.2.4 Comparative performance of coconut oil with other vegetable oils............................................................. 18
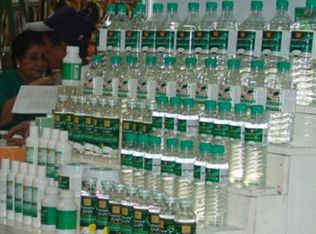
4. Non-traditional markets for Pacific Island coconut products............................................................................... 24
4.1 Virgin Coconut Oil (VCO)......................................................................................................................................... 26
4.1.1 A need for greater focus of domestic markets............................................................................................... 29
4.1.2 A need to re-look at small-scale high quality copra production ................................................................... 31
4.2 Coconut water........................................................................................................................................................ 32
4.2.1 PICs have not been part of the coconut water boom.................................................................................... 33
4.3 Coconut milk and cream products.......................................................................................................................... 35
4.4 Coconut timber....................................................................................................................................................... 36
Bibliography............................................................................................................................................................ 39
Annex 1: The Broad Input Output Structure of Coconut Product Value Chains
Annex 2: Processes for producing VCO.................................................................................................................... 43
Annex 3: The longer term comparative advantage of coconut oil: the impact of climate change ............................ 45
iii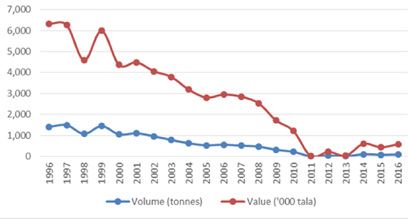
Abbreviations

     ACIAR Australia Centre of International Agricultural Research
      APCC Asia Pacific Coconut Community
       ASA American Soybean Association
      CIDP Coconut Industry Development for the Pacific
      CNO crude oil from crushed copra
       CRB coconut rhinoceros beetle
      DME Direct Micro Expeller
     ENSO El Niño Southern Oscillation
       FAS Foreign Agriculture Service
     FOSFA Federation of Oil, Seed and Fatty Acids
     MCFA medium chain fatty acids
       PICs Pacific Island countries
       RBD refined, bleached and deodorized coconut oil
       TFA trans fatty acids
       VCO virgin coconut oil
      WTO World Trade Organization
     USDA United States Department for Agriculture

iv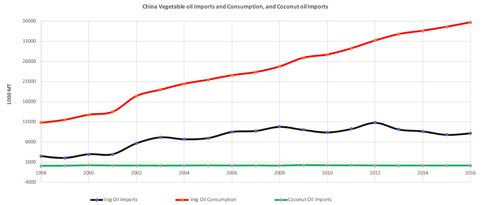
1 Summary

Traditional export markets for PIC coconut products
Copra oil and copra have been, and continue to be,            The Philippines dominates the world coconut economy,
the core export market for most Pacific Island coconut        accounting for about 40% of world copra production and
industries. Coconut oil is part of the ’vegoil’ complex,      60% of exports of coconut oil. The PIC share of world
which is made up of around 20 oils. Some are grown            coconut oil exports ranges from 3% to 6% annually,
only in temperate climates (canola), others only in           depending on the volume supplied by the Philippines.
the tropics (oil palm and coconuts), with most grown          PICs make up around 5% of world copra production.
in both temperate and tropical environments (soya             While this share is relatively small, it is higher than that
bean, sunflower, corn, sesame and cotton). Coconut oil        of any other Pacific Island major export commodity,
prices are determined by inter-relationships between          other than palm oil (Papua New Guinea, Solomon
all products within the ‘vegoil’ complex. The global          Islands). PICs make up over 50% of world copra exports –
vegetable oil market has seen substantial growth and          with Papua New Guinea being the largest copra exporter.
structural change over the last two decades in both food
and industrial uses. Food use per capita consumption has      Imports of copra oil are highly concentrated – Europe
increased by some 13% and industrial (oleochemical) use       accounting for about 50%. China and India are minor
of vegetable oil by over 110%.                                importers of coconut oil. In 2015, China imported
                                                              95,500 tonnes of coconut oil, compared with a total of
The key vegetable oil market developments have been:          8.5 million tonnes for all vegetable oils. India’s coconut
                                                              oil imports were 22,000 tonnes, compared with 15.1
•   the rapid technological development and demand            million tonnes of total vegetable oil imports. India,
    growth in industrial use of vegetable oils, including     however, has a large domestic coconut oil industry –
    biofuel;                                                  producing 1.1 million tonnes in 2015. Unless this pattern
•   increasing income driving the demand for vegetable        of consumption changes, coconut oil and copra will not
    oil – particularly in China and India; and                benefit directly from the vegetable oil demand growth in
•   the growing relative importance of palm oil due to        China and India. However, coconut oil prices are affected
    its competitive supply position.                          indirectly, due to the inter-relationship between all the
                                                              oils within the ‘vegoil’ complex.
Coconut oil’s closest substitute is palm kernel oil –
together they make up the ‘lauric oil’ sub-complex.           The crude copra oil and copra market is particularly
Coconut oil accounts for 3% of both food and industrial       narrow. It is traditionally characterised by little product
vegetable oil use, while palm kernel oil accounts for         differentiation and opportunities for niche marketing
3% (food use) and 6% (industrial use). Lauric oils are        for PIC exporters. Crude oil is not an end-product in
defined as vegetable oils having a lauric acid content of     the coconut value chain. It is exported to a few large
approximately 50%. This high lauric acid characteristic       companies for manufacture into refined, bleached and
affords particular advantages, particularly in food uses.     deodorised (RBD) oil for consumption in importing
Palm kernel oil and coconut oils are interchangeable in       countries or for re-export. These are large companies,
many applications because of their similar properties.        mainly located in Europe (particularly Germany and
The price of lauric oils tends to be significantly higher     the Netherlands) and some in Asia (particularly the
than the main vegetable oils (soya bean oil and palm oil).    Philippines).

Over the last 40 years, the prices of all vegetable oils
have generally moved together – with prices of some
vegetable oils more closely correlated than that of
others. The estimated price correlation between coconut
oil and palm kernel oil is 0.99. The last decade has seen a
general upward trend in vegetable oil prices – with lauric
oils being significantly higher.

                                                                                                                            1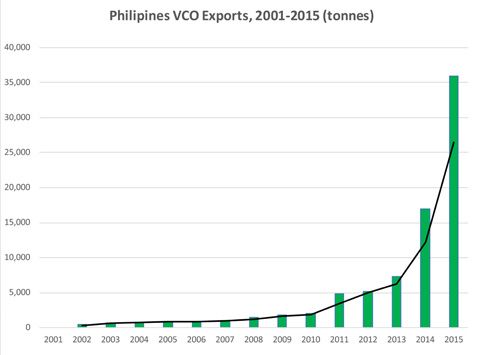
coconut oil (VCO). Fiji, Samoa and Solomon Islands were
Analysis of coconut oil prices                                 amongst the earliest global entrants into VCO export
                                                               markets.
over the last 20 years
                                                               VCO is a product ready for consumption without further
The first decade was a period of unstable prices with          processing. It is produced directly from fresh mature
a marked overall downward trend. The prices in the             coconut kernel, and is regarded as the purest form of
second decade were even more unstable but trended              coconut oil. As VCO is further down the coconut value
significantly upwards. Prices reached record levels            chain it is viable to send to the market in relatively small
exceeding USD 2,000 cif/tonne in 2011 and now stand at         quantities. RBD and VCO oil have the same physical and
around USD 1,600/tonne.                                        chemical characteristics but different sensory attributes.
                                                               The Philippines were the first to enter the VCO market
The instability and upward trend in coconut oil prices         in the early 1990s on a very small scale (only two tonnes
over the last decade can be explained by a combination         exported in 2001). For the first decade or so the price
of factors:                                                    premiums paid for VCO were very substantial – averaging
                                                               around five times the RBD price. Not surprisingly, the
•   the expansion of the world trade in vegetable oils,        growth in global exports of VCO has been exponential,
    following the closure of the Uruguay Round in 1996;        with Philippines exports exceeding 25,000 tonnes in
•   China and India’s income growth and high income            2015 (exporting to 38 countries). Sri Lanka has also
    elasticity of demand for vegetable oils;                   become a major player, exporting 16,000 tonnes in 2016,
•   replacement of the negative health image of                up from 5,000 tonnes in 2013. Australia has become a
    ‘tropical oils’ with a positive image, and the             major buyer of VCO, purchasing 1,750 tonnes from Sri
    increasing awareness of health problems associated         Lanka in 2015.
    with trans fatty acids (TFAs) in some other vegetable
    oils;                                                      This rapid increase in supply has transformed VCO
•   diversion of edible oils supplies (particularly palm oil   from an exceptionally high-priced niche product, to a
    and soya bean oil) for use as bio-fuel, followed more      commodity that can secure a significant price premium,
    recently by the demand for biofuel declining with          provided quality and other certification requirements
    the falling of petroleum prices; and                       are met. To remain competitive, PIC VCO producers
•   the continuing contraction in global coconut               need to produce a premium quality product that can be
    supply exacerbated by major cyclonic events in the         differentiated in the market through organic and other
    Philippines – this decline has been even greater in        certification. Certification brings with it substantial
    PICs.                                                      overhead costs. The experience with VCO in the Pacific
                                                               has shown that larger, more centralised processing
                                                               entities are likely to be more viable than small, village-
                                                               based units. These larger units have been better able
Non-traditional markets for PIC coconut                        to satisfy demanding quality standards. The larger units
products: a focus on virgin coconut oil                        have also been better able to ‘pull’ the product through
(VCO)                                                          the VCO value chain and link with markets.

Recent years have seen copra oil and copra prices reach
historic highs – yet PIC exporters have been unable to
take full advantage of this situation. The main reason
                                                               PICs adjusting to the changing VCO
for this is that the large processors in Europe still remain   market situation: market considerations
the main end-users. The shipping of crude coconut oil
to European buyers has become uneconomical for most            The focus of VCO development in PICs has been almost
PIC exporters, with decreasing volumes to ship and less        entirely on export markets. In the Philippines, VCO is
Europe-bound shipping.                                         now a common product found in most supermarkets and
                                                               pharmacies – this is not the case in PICs, which are large
Coconut oil and copra are now largely shipped to Asian         importers of vegetable oil. (In 2015, Fiji imported 16,675
markets (Singapore, Malaysia and the Philippines) at           tonnes of vegetable oil – landed value USD 20.7 million;
lower prices than those available in Europe. The nearby        and, Papua New Guinea 46,758 tonnes – landed value
markets of Australia and New Zealand have ample                USD 43.1 million). These imports are almost entirely for
shipping available but their demand is mainly for RBD oil.     food use. By comparison, the domestic consumption
The value added for RBD does not justify the investment        of coconut oil for food use is miniscule. and other food
required by the predominately small PIC copra mills.           grade coconut oil, a combination of measures needs to
PIC industry attention, as a consequence, has turned to        be taken. There would need to be significant reduction
niche products that can be differentiated in terms of          in the price at which VCO is sold locally – however,
specific quality attributes (various types of certification    not exporting would bring with it large marketing cost
such as origin, organic and fair trade). The particular        savings. In many PICs the prevailing image of coconut oil
niche market focus for PIC producers has been on virgin        for cooking is that of an ‘inferior’ product. A concerted

2
effort needs to be made to reverse this image for This situation is unlikely to change, unless there is a large
VCO and for food grade, high quality copra oil. Local increase in the ready availability of coconuts.
regulatory requirements (including labelling) need to
be reformed, together with the structure of tariffs for
vegetable oil.
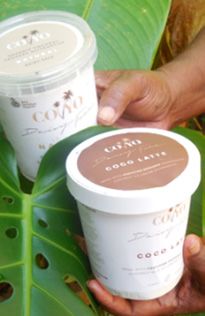
Coconut cream and milk products
Investigating PIC domestic VCO
Coconut milk and cream products have also experienced
(together with high grade, food rapid growth in demand – driven by new alternative
quality copra oil) value chains is dairy food and beverage products to cater for the
recommended as a priority for the increasing awareness of lactose intolerance and other
Coconut Industry Development Project health issues. Samoa was an early pioneer in the export
(CIDP). of coconut cream. The Samoan product was considered
to be of superior quality but Samoa found it difficult to
compete with the cheaper alternative produced by the
Approximately half the VCO produced globally is used Philippines.
in a range of non-food products (hair and skin care
products, massage oils, etc.). For most non-food uses, Coconut milk/cream products are seen to offer one of
high quality copra oil is a suitable substitute for VCO. the best niche market opportunities for PIC coconut
Small-scale cold press copra mills have been utilised in industries. Existing processing technologies allow for
Fiji, Solomon Islands and Vanuatu to produce high quality competiveness on a small to medium scale – provided
copra oil (well dried and stored copra without smoke adequate attention is given to quality standards and
contamination). Niche markets have been identified workforce skills to control the risk of contamination.
in Australia and New Zealand for high quality copra oil A number of potential coconut milk/cream products
outside the traditional bulk crude copra oil markets. have been identified where PIC processors could be
With the prevailing VCO price environment, high quality competitive on local and regional markets. These include
copra oil is identified as an alternative to VCO for small coconut cream freeze and coconut yogurt.
scale producers. While the price for high grade copra oil
is still significantly lower than that for VCO, small-scale
high quality copra production offers some significant Investigating the coconut cream freeze
advantages for producers. These include: low capital and coconut yogurt value chains is
cost, significantly lower labour input requirements, and recommended as a priority for the
less difficult in meeting quality requirements. CIDP.
Investigating small-scale, high quality
copra value chains is recommended as Coconut timber
a priority for the CIDP.
Globally, since the turn of the century, and particularly
over the last decade, there has been a massive increase
Coconut water in the demand for coconut products. Ironically, this
has come at a time when coconut production capacity
has been in marked decline and nowhere more so than
Globally, coconut water (UHT bottled or packaged) has
in PICs. In the Pacific, well over 50% of the 1.3 million
emerged as the fastest coconut product market and
coconut trees that remain standing can be regarded as
is part of what has become known as the ‘sport-drink’
senile and unproductive. The last forty years has seen
value chain. In 2014, the global coconut water market
very little replanting; a situation that urgently needs to
was estimated at USD 1.36 billion and is projected to
be reversed if rural communities are to take anywhere
increase to USD 4 billion by 2019. The Philippines the
near full advantage of the growing market opportunities
largest supplier – notably for PICs, Australia is the third
that are now on offer.
biggest buyer after USA. However, PICs have not shared
in this market development. The main reasons for this
are:
• the perishability of coconut water once removed
from the coconut;
• the high capital investment required to preserve
coconut water in a way that maintains flavour and
nutritional value; and
• the throughput requirements to make this
investment viable – there are just not sufficient
coconuts available in the right location.
3Coconut Market vs Produc�on
Market
Produc�on
APCC reports indicate >50% of trees are senile with declining yield
Asia and Pacific Coconut Community
A critical incentive for farmers to replant is to receive
worthwhile return for the removal of their old palms. For A detailed value chains analysis for
several decades, the expectation has been that coconut coconut timber in the manufacture of
timber would provide such an incentive. However, veneer products is recommended as a
despite the emergence of high-end niche coconut
furniture companies, such as Pacific Green in Fiji, the
priority for the CIDP.
overall level of demand for coconut timber has been
disappointing and has had little impact on the propensity
of PIC farmers to replant. Encouragingly, the last few
years have seen the emergence of more appropriate
technology that should allow for the commercially viable
use of coconut timber in much wider markets, such as
for veneer products.
42 The core value chains for coconut products
In Pacific Island countries (PICs), coconuts have been a fundamental food security crop for centuries, well before
coconut plantations were first established in coastal areas to produce copra for export to Europe more than a century
ago. Even though copra and copra oil exports to Europe have largely ceased, coconuts remain an important crop for
food security and livelihoods in the region1 and remain an export earner for most countries.
2.1
Four broad markets and core value chains for coconut products
There are essentially four broad markets for coconut The fourth value chain strand is not directly derived from
products, based on four core coconut value chain the coconut kernel.
strands. Three of these value chain strands involve
products derived from the coconut kernel. • Bi-products, which comprise a range of products
derived from the husks, shells, timber and leaves of
• Coconut food, which predominately has involved oil the coconut tree.
traditionally extracted from copra (dried coconut
kernel) but has increasingly involved virgin coconut Coconut oil still remains overwhelmingly the main
oil (VCO) extracted directly from the kernel. Other coconut product entering international trade, with its
coconut food products made directly from the use being shared approximately equally between the
kernel are coconut cream/milk and desiccated food and chemical product uses. The input/output
coconut. structure for these four broad value chains is presented
• Coconut oleo chemical, which includes products in more detail in Annex 1 of this report. The last 20 years
such as soaps, personal care products and has seen an explosion of products within these coconut
cosmetics. Both copra oil and VCO are used for value chains. This is reflected below in the extract from
these products. Over the last two decades, copra the presentation of the APCC Director at the Coconut
oil has also been increasingly used for bio fuel – Industry Development Project (CIDP) Value Chain
although this has declined in recent years with Workshop held in Nadi, Fiji, July 2017 (APCC 2017).
falling petroleum prices.
• Coconut water, which includes the newly emerging
‘sports drink’ market. Until very recently, the
coconut water market was relatively trivial
compared with the food and oleo chemical
markets for coconut products. The last few years,
however, has seen rapid growth in coconut water
consumption outside coconut producing countries.
This has been driven by a processing technological
change and consumer demand driven by health and
well-being concerns.
1 For example, the smallholder study in Solomon Islands estimated that around 110 million coconuts are grown and consumed annually (Bourke et al. 2006). This equates to around 20,000
tonnes of copra. In 2015 Solomon Islands produced 17,746 tonnes of copra (APCC Coconut Statistics Year Book 2015: 215). This domestic demand can be expected to have increased
significantly over the intervening decade in the face of high population and urbanisation growth rates.
5Emergence of Products
1993 2016
1. Oleo chemicals 1. Oleo chemicals
2. Glycerine 2. Glycerine
3. Fresh coconuts 3. Fresh coconuts
4. Matured coconuts 4. Matured coconuts
5. Coconut Seedlings 5. Coconut Seedlings
6. Bukayo 6. Bukayo
7. Coco Cream Powder 7. Coco Cream Powder
8. Coconut Milk 8. Coconut Milk
9. Frozen coco meat 9. Frozen coco meat
10. Kopyar/Makapuno 10. Kopyar/Makapuno
11. Coconut Vinegar 11. Coconut Vinegar
12. Nata de coco 12. Nata de coco
13. Ubod 13. Ubod
14. Coco acid oil 14. Coco acid oil
15. Alkanolamide 15. Alkanolamide
16. Paring oil 16. Paring oil
17. Coco coir waste 17. Coco coir waste
18. Coco coir fiber 18. Coco coir fiber
19. Coconut water 19. Coconut water
20. Coco husk 20. Coco husk
21. Coco husk chips 21. Coco husk chips
22. Coco chips 22. Coco chips
23. Coco lumber 23. Coco lumber
24. Coconut shell 24. Coconut shell
25. Coconut shell charcoal powder 25. Coconut shell charcoal powder
26. Toilet/Bath soaps 26. Toilet/Bath soaps
27. Husk nuts 27. Husk nuts
28. Laundry soap 28. Laundry soap
29. Shortening 29. Shortening
30. Coco jam
31. Special Creamed Coconut
32. Coconut Water Concentrate
33. Coco Soy Sauce
34. Coco Fiber Dust
35. Coco Shell Powder
36. Shampoo
37. Coco Wood Pallett
38. Margarine
39. Coconut Flour
40. Coconut Milk Powder
41. Coconut Liquor
42. Coco Handicrafts
43. Grated Coconut Milk
44. Coconut Honey
45. Coir Net
46. Soap Chips
47. Virgin Coconut Oil
48. Coconut Sugar
49. Neera fresh
63 Core market developments since the turn of
the century
3.1
Global vegetable oil markets
Copra oil and copra has been, and continues to be, the 13% increase) (Table 1). The increase in per capita
core export market for most PIC coconut industries. consumption for industrial uses has been even greater,
Coconut oil and copra, as part of vegetable oil complex, increasing from 3.7 kg (average 1991–2000) to 7.9 kg
are pulled through the value chains of food and (average 2001–2011 (a 113% increase).
oleo chemical industries. Recent decades have seen
substantial growth and structural change in global Coconut oil consumption, in contrast to the overall
consumption of vegetable oils in both food and oleo growth in vegetable oil consumption, has been lower
chemical (industrial) uses. over the same period. It has increased by only 4% in food
use (0.30 kgs to 0.31 kgs/capita) and fell by 11% in the
Global annual per capita consumption of vegetable oil industrial sector (0.23 kg to 0.20 kgs/capita) (Table 1).
for food use has increased significantly over the last
two decades – increasing from 9.5 kg for the period
1991–2000 to 10.7 kg for the period 2001–2011 (a
Table 1: Global per capita consumption of main vegoil complex products
Food Use Industrial Use
Consumption Share of global Consumption Share of global
(kg/cap/year) consumption (%) (kg/cap/year) consumption (%)
1991– 2001– Rate of 1991– 2001– 1991– 2001– Rate of 1991– 2001–
2000 2011 change 2000 2011 2000 2011 change 2000 2011
Soya bean oil 2.85 3.37 19% 30% 31% 0.58 1.57 171% 16% 20%
Palm oil 1.29 1.84 42% 14% 17% 1.28 3.09 142% 35% 39%
Rape seed oil 1.39 1.37 –1% 15% 13% 0.43 1.15 167% 12% 15%
Coconut oil 0.30 0.31 4% 3% 3% 0.23 0.20 –11% 6% 3%
Palm kernel oil 0.12 0.24 1% 1% 2% 0.20 0.46 129% 5% 6%
Sunflower oil 1.27 1.25 –2% 13% 12% 0.16 0.33 106% 4% 4%
Total 9.47 10.71 13% 100% 100% 3.70 7.88 113% 100% 100%
Source: Kojima et al. (2016) derived from FAOSTAT data
3.1.1
Coconut oil in the vegoil complex
Coconuts are classified as an oil seed, with most coconut products being part of the vegoil
complex. The markets and prices for most coconut products are directly affected by interactions
within the complex. To comprehend developments in coconut product markets, it is necessary to
understand the interrelationship between the prices and demand for all the vegetable oils within
the vegoil complex. Even the few coconut products that are not part of the vegoil complex are
indirectly affected through competing demand for inputs along their value chains.
The vegoil complex is made up of around 20 oil seeds. These include grains (soya bean, sunflower,
canola [rape seed]), ground nuts (peanuts) and tree crops (oil palm and coconuts). Some are
7grown only in temperate climates (canola), others only in the tropics (oil palm and coconuts),
while most are grown in both temperate and tropical environments (soya bean, sunflower,
corn, sesame and cotton). Soya bean and palm oil are dominant oil seeds in the vegoil complex.
Between 2001 and 2011, soya bean accounted for around 30% of vegetable oil consumption
globally, and palm oil around 17% (Table 1). In the industrial sector, palm oil was much more
important, accounting for nearly 40%, compared with around 20% for soya bean oil. The primary
product made from soya beans is cake for the supply of proteins in the manufacture of animal
feed. This is not part of the vegoil complex. Soya bean oil, the bi-product from soybean cake, is
the product that enters the vegoil complex.
Particular oil seeds have different characteristics, due to their oils having different attributes.
These substitute for each other in the production of a wide and increasing variety of final
products. The price of a particular vegetable oil reflects its own demand and supply situation,
together with its competitive position relative to other oils and, now, other liquid energy
products. As a result of this inter-relationship, price formation of vegetable oils tends to be more
complex than for most other agricultural commodities. Superimposed on market forces are the
intervention measures taken by national governments in each country by way of subsidies, tariffs,
quotas and export taxes. The situation is summarised by ITC (2012).
The major characteristics of the vegetable oils markets, palm oil included, are the
overwhelming weight of governmental policies on the sector development; the volatility
of prices and the impact of speculation; and the correlations between the consumption
and prices of several oils due to their substitutability for major uses (p 16).
Coconut oil’s market share in the vegoil complex is small, accounting for around 3% of oil
consumption in both food and industrial uses. Palm kernel oil, coconut oil’s closest substitute,
accounts for about 1% of vegetable food use and 6% of industrial use. Coconut oil and palm
kernel oil together make up the lauric oil sub-complex. This sub-complex complex is discussed in
some detail below, due to its importance for coconut products markets.
Palm oil’s growing dominance in the global supply of vegetable oils is due to its competitive
position in comparison to other oil seeds. The yield per hectare of oil palms is five to ten times
higher than that of other oil-bearing crops – particularly coconuts (ITC 2012). Compared with
grain crops, oil palms have much lower requirements in terms of fuel, fertilisers and pesticides.
Palm oil’s competitive production advantage is expected to increase further as, of all the oil
seed crops, it is expected to be the least adversely effected by climate change (Taylor et al. 2016:
261). The most adversely affected by climate change are the vegetable oils derived from grain
crops. Mature coconut palms (five to 50 years), like oil palm, are also expected to fare relatively
well in the face of climate change and the comparative advantage of the oil produced is likely to
improve. Unfortunately for PICs, however, an increasing number of coconut trees are regarded
as senile. These senile trees will be particularly vulnerable to the expected increasing intensity of
cyclones (Taylor et al. 2016: 257).
The lauric oil sub-complex: coconut and palm kernel
Lauric oils are defined as vegetable oils having a lauric acid content of approximately 50%. The
lauric oil sub-complex is made up almost entirely of coconut oil and palm kernel oil.2 This high
lauric acid characteristic affords particular advantages, particularly in food uses, compared with
other vegetable oils and justifies the designation as a vegetable oil sub-complex. The medium
chain fatty acids (MCFA), or medium chain triglycerides, that make up lauric oils are believed to
have particular digestive health advantages (Bawalan 2011: 11). The main food uses for lauric oils
are in ice cream, margarine, chocolate and confectionary products. Sodium laurate (the sodium
salt from lauric acid) is considered to produce the finest soaps and detergents. Palm kernel oil
and coconut oils are interchangeable in many applications because of their similar properties.
2 Oil palm planting is done primarily for the oil derived from the mesocarp of the palm fruits. However, palm kernel oil is a valuable bi-product derived from the palm kernels. For every
tonne of palm oil produced, around 130 kgs of palm kernel oil is obtained. This high lauric acid product is almost technically identical to coconut oil; it enters the same marketing channels
and commands approximately the same price.
8It is only in recent years that the health value of lauric oils has been recognised and promoted.
This has been able to offset the consumer resistance to tropical oil generated by the American
Soybean Association (ASA) in the 1980s.3 Klurfeld (1991) notes that changes in the dietary intake
of fats and oils that occurred over the past century comprised an increasing consumption of
saturated and partially hydrogenated trans-fats, which can increase the risk of coronary heart
disease by raising levels of ‘bad’ cholesterol and lowering levels of ‘good’ cholesterol. It was on
this basis the claim was made that tropical oils (palm oil and coconut oil) were harmful to public
health and such erroneous claims continue to be made. Yet the chemical composition of lauric oil
is neutral in terms of cholesterol.4 Therefore, it is now widely accepted that the consumption of
palm oil and coconut oil as a source of dietary fat does not pose any additional risks for coronary
artery disease when consumed in realistic amounts as part of a healthy diet (Klurfeld 1991).
The average price of lauric oils tends to be significantly higher than that of the main vegetable
oils (soya bean oil and palm oil) (Figure 1). Lauric oil prices also tend to more unstable due
to their more specialised uses and thus their more price inelastic (demand tends to be
relatively unresponsive to price). A comprehensive model of the world lauric oil economy
built in the 1970s estimated the own short run price elasticity of demand for lauric oil in the
US to be –0.16 (Labys 1975: 222).5 More inelastic demand, combined with greater production
variability, explains the greater price instability of coconut oil and palm kernel oil compared
with other vegetable oils. Thus, lauric oils are perhaps the most price unstable of any major
internationally traded commodity (Warr and Wolmer 1996) – something PIC copra growers
have long lived with.
Source: Data provided by the Public Ledger
Figure 1: Soya bean oil, palm oil and coconut oil prices 2000–2017
The privileged position of lauric oils in the market place has been under some threat with the
emergence of genetically modified rape seed oil that has a high lauric content (Becker and Rohde
2001). This competition is likely to affect the demand for coconut oil in its industrial uses –
although it does not yet seem to be reflected in price premiums received for coconut oil.
3 By the mid-1980s, soybean oil accounted for more than 70% of all edible oils in the United States; palm and coconut oils, only 4%. However, the domestic oil industry viewed with alarm the
competing interest of the imported oils. In 1986, with endorsements from other farm groups, the American Soybean Association (ASA) launched a series of attacks that became known as
the “tropical grease campaign.” The campaign created a new term, “tropical oils,” and used the phrase derisively. ASA convinced many consumers that tropical oils were unhealthy, and
consumers should be warned on product labels (Klurfeld 1991).
4 Specifically the hypercholesterolemic effect caused by the less than 1.5% of lauric and myristic saturated fatty acids contained in the oil are compensated for by the moderate amounts of
monounsaturated oleic acid and linoleic fatty acids, which are hypocholesterolaemic, as well as by the presence of vitamin E, which are natural inhibitors of cholesterol synthesis (Klurfeld
1991).
5 A 1% increase in the lauric oil price leads to a 0.16% decrease in demand, all other variables (price of substitutes, income) remaining constant.
93.1.2
The inter-relationship between prices within in the vegoil complex
A chart showing vegetable oil prices over the last 40 years reveals two broad conclusions.
• The prices of all vegetable oils generally move together – with the prices of some more
closely correlated than the prices of others.
• Over the last decade there has been a general upward trend in vegetable oil prices.
Table 2 shows the estimated correlations between prices (average annual) of the various oils in
the vegoil complex. The table is divided in two time periods: Period A (1977 to 2003) and Period B
(2000 to 2016).
Table 2: The correlation between prices of various vegetable oils: 1977 to 2003 and 2000 to 2016
Period A: 1977–2003*
coconut palm palm soya sunflower rapeseed
oil oil kernel oil bean oil oil oil
coconut oil 1 0.89 0.99 0.80 0.71 0.76
palm oil 0.89 1 0.89 0.94 0.92 0.92
palm kernel oil 0.99 0.94 1 0.83 0.74 0.80
soya bean oil 0.80 0.94 0.83 1 0.95 0.97
sunflower oil 0.71 0.92 0.74 0.95 1 0.96
rapeseed oil 0.76 0.92 0.80 0.97 0.96 1
*McGregor (2003: 4)
Period B: 2000–2016**
coconut palm palm soya sunflower rapeseed
oil oil kernel oil bean oil oil oil
coconut oil 1 0.86 0.98 0.83 0.79 0.39
palm oil 0.86 1 0.96 0.96 0.95 0.24
palm kernel oil 0.98 0.96 1 0.95 0.92 0.49
soya bean oil 0.83 0.96 0.95 1 0.95 0.37
sunflower oil 0.79 0.95 0.92 0.95 1 0.16
rapeseed oil 0.39 0.24 0.49 0.36 0.16 1
** Calculated from data provided by the Public Ledger
The correlation between coconut oil and palm kernel oil prices is the highest amongst all the
vegetable oils, being 0.99 for the period 1997 to 2003 and 0.98 for the period 2000 to 2016.
This compares with the correlation between coconut oil and palm oil prices of 0.89 and 0.86
respectively over the same periods. It is notable that price correlations between the oils within
the vegoil complex have fallen somewhat, indicating decline, but still high substitutability
between most vegetable oils.
103.1.3
Increasing income driving the increased demand for vegetable oil
The income elasticity of a product measures the change in the consumption in response to
changing income, controlling the other main factors affecting demand (the price of the product,
prices of substitutes, population growth, etc.). At low income levels, the income elasticity of
demand for vegetable oils is high – demand is highly responsive to changes in income. At higher
income levels, the income elasticity is lower (demand is less responsive to changes in income)
until, at a certain level, response ceases and the market reaches saturation.
China
An econometric study by Fang and Beghin (2000) for China estimated the income elasticity
for soya bean oil to be 0.27.6 The rapid growth in per capita income in China has been a major
contributing factor in the substantial expansion of vegetable oil consumption in recent decades.
In addition, in the lead-up to China’s accession to the World Trade Organization (WTO), there
was a partial dismantling of the restrictions on edible oil imports and a reduction in domestic
prices towards international prices. The consequence of these combined factors is that China’s
vegetable oil consumption increased from 10.3 million tonnes in 1997 to 35.7 million tonnes in
2016 (266% increase), with imports increasing from 3.5 million tonnes to 8.2 million tonnes (134%
increase) over the same period (Figure 2). China has become the largest consumer of vegetable
oil and the second largest importer after India (USDA FAS).
Source: USDA, Foreign Agriculture Service
Figure 2: China’s vegetable consumption, imports and coconut oil imports
India
Similar results are found for India, the other rapidly growing vegetable oil market. Pan et al.
(2008), estimated the income elasticity for vegetable oil used in food to be 0.57 and in industrial
use to be 0.64. Vegetable oil imports to India are around 15 million tonnes. A large population,
steady economic growth, trade policy reforms in the early 1990s, and domestic programmes
that favoured the production of cereals have contributed to a three-fold increase in vegetable oil
imports in the last few decades (Figure 3). There still remains considerable scope for expanding
Indian consumption of vegetable oil as, per capita, edible oil consumption remains relatively
low – 19 kgs in 2016/2017 compared to 26.3 kg for China, 39.9 kg for USA and 21.5 kg for the
European Union (USDA FAS). Most of the increase in domestic demand has been met by rising
imports, rather than increased domestic production.
6 A 1% increase in per capita income in China leads to 0.27% increase in soya bean oil consumption, controlling for the influence of other factors.
11Source: USDA, Foreign Agriculture Service
Figure 3: India’s vegetable oil imports
Europe, North America and Japan
In Europe, North America and Japan, average per capita income is still significantly higher than
that of China and India, and total vegetable oil consumption reflects this. However, growth has
been low to stagnant. For USA, Kojima et al. (2016) estimated, the income elasticities for soya
bean oil to be 0.11 in food use and 0.08 in industrial use. Income levels in China and India and
in some other developing countries can be expected to continue to grow faster than in North
America, Europe and Japan. It will thus be these countries, with their higher income elasticity,
that will continue to drive the demand for vegetable oils, including coconut oil.
3.1.4
The changing structure of vegetable oil consumption for non-food uses
At the beginning of the 21st century, around 94% of the world output of vegetable oils was used
in the food sector. The development of oleo chemical industries and biofuel drastically changed
the structure of vegetable oil consumption. By 2010/2011, 72% of the world production of
vegetable oils was used in the food sector – with the industrial and biofuel uses accounting for
18% and 15% respectively. It was palm oil that led the charge on non-food uses of vegetable oil
(ITC 2012 and Fry (2010).
3.1.5
Summary
Since the turn of century there has been a large increase in global consumption of vegetable oil
and a change in the structure of the market. The key causal factors can be summarised as:
• population and income growth in some developing countries, with high-income elasticities of
demand for vegetable oils;
• India becoming a major importer of vegetable oil – although coconut oil imports remain
insignificant;
• China’s more than threefold increase in vegetable consumption and a doubling of vegetable
oil imports (coconut oil imports remain relatively small);
• the accelerated technological development in the use of vegetable oils in non-food products;
12• a rapid increase in demand for biofuels (now subsided somewhat), particularly for products
with a lot of oil and minimal amounts of meal (particularly palm oil);
• palm oil, with production efficiency and relatively high oil content, being consistently able
to achieve the fastest production growth among the major vegetable oils, so increasing
comparative advantage is expected for palm oil in the face of climate change; and
• health concerns and labelling requirements regarding the trans-fatty acid (TFA) content of
foods having an increasing effect on consumer decisions in favour of particular vegetable oils
(particularly coconut and palm kernel oil).
3.2
Coconut oil and copra as commodities in international trade and
the performance of PIC exporters
3.2.1
Current trade in coconut oil and copra
While all vegetable oil markets are inter-related, it is the lauric oil complex that is of most
importance to coconut oil. World trade in lauric oils is shared approximately equally between
coconut oil and palm kernel oil.
The Philippines dominates the world coconut economy, accounting for about 40% of world copra
production (Table 3) and 60% of world exports of coconut oil (Table 34). Indonesia and India
are also substantial producers – with Indonesia being a significant exporter. PIC’s share of world
coconut oil exports ranges from 3% to 6% annually, depending on the volume supplied by the
Philippines in that year. PICs make up around 5% of world copra production. While this share is
relatively small, it is higher than that of any other major PIC export commodity, other than oil
palm in Papua New Guinea and Solomon Islands. When it comes to trade in copra, PICs are in the
unique position of being the most important supplier, with a market share of over 50% (Table 5).
Papua New Guinea has the distinction of being the world’s largest copra exporter, followed by
Vanuatu. The Philippines exports insignificant amounts of copra.
Table 3: PIC and world copra production (tonnes) 2011–2015
2011 2012 2013 2014 2015
PIC Production
FSM 265 1224 1224 76 76
Fiji 17,000 16,111 12,088 18,776 3,807
Kiribati 8,729 8,832 8,938 8,111 7,349
PNG 146,526 88,555 61,536 85,281 86,873
Samoa 20,000 14363 5,000 5,000 5,000
Solomon Islands 6,600 26,610 14,066 19,101 17,746
Tonga 6,000 10,333 10,303 9,459 9,030
Vanuatu 25,500 36,068 24,576 39,807 36,274
Palau 8600 8420 8420 8252 8200
Total PIC 239,220 2,105,516 146,151 193,863 174,355
Philippines 1,869,000 2,633,000 2,578,000 1,887,000 1,934,000
Indonesia 1,358,000 1,491,750 1,481,174 1,461,919 1,315,727
India 975,000 1,234,000 1,289,000 1,16,5000 1,072,000
Rest of world 523,550 511,178 525,804 457,266 460,143
Total world production 4,964,770 6,080,444 6,020,129 4,000,048 4,956,255
PIC share (%) 4.82% 3.46% 2.43% 4.85% 3.52%
Source: Asia Pacific Coconut Community Year Book 20015
13Table 4: PIC and world coconut oil exports (tonnes): 2011–2015
2011 2012 2013 2014 2015
PIC Production
Fiji 1,328 3,794 1,494 1,630 1,794
PNG 54,349 19,847 13,466 11,068 18,467
Samoa 2,509 3,935 1,633 1,428 1,020
Solomon Islands 470 172 196 238 1,163
Tonga 2531 3961 1428 1452 0
Vanuatu 12000 10011 5535 9,208 6,570
Total PIC 73,187 41,720 23,752 25,024 29,014
Philippines 781,411 852,236 1,080,836 815,018 765,558
Indonesia 540,050 799,973 630,568 771,419 760,072
Malaysia 143,611 136,783 131,068 187,665 152,091
Rest of World 316,428 296,958 347,674 278,857 361,450
Total world exports 1,854,687 2,127,670 2,213,898 2,077,983 2,068,185
PIC exports as % total 4% 1.9% 1.1% 1.2% 1.4%
Source: APCC 2015 Year Book and Oil World
Table 5: PIC and world copra exports: 2011–2015 (MT)
2011 2012 2013 2014 2015
FIC exports
FSM 146 540 540 76 -
Fiji - 3 3 - -
Kiribati 3,296 3,182 417 1,332 1,807
PNG 46,500 34,725 15,673 48,228 38,311
Samoa - - - - 1,968
Solomon Islands 37,287 28,582 9,200 15,856 17467
Tonga - - - - -
Vanuatu 13596 16336 12508 25194 12584
Total PIC 100,825 83,368 38,341 123,873 72,137
Philippines 274 464 591 1954 480
Indonesia 34565 48305 29393 53802 48350
Malaysia 1141 1946 711 684 622
Rest of World 24799 33783 37758 39800 32541
Total world exports 161,584 167,866 106,794 186,926 154,130
PIC % of world exports 53.6% 49.6% 36% 66% 46.8%
Source: APCC Year Book and Oil World
World imports of copra oil are highly concentrated, with the EU accounting for about 50% –
Germany the most important buyer (Table 6). USA accounts for about 25% of imports, coming
almost entirely from the Philippines.
World copra imports are usually less than 20% of coconut oil imports and these are dominated
by Europe and, in particular, Germany (Table 6). In 2006, Bangladesh emerged as an important
market for Pacific Island copra, particularly for Vanuatu and Solomon Islands, only to withdraw
from the market in 2014.
When it comes to the import of coconut oil and copra, India and China remain minor players. In
2015 China imported 95,500 tonnes of coconut oil, compared with total vegetable oil imports 8.5
million tonnes. For India coconut oil imports were 22,000 tonnes, compared with total vegetable
oil imports of 15.1 million tonnes. India, however, is a major coconut oil producer – producing 1.1
14million tonnes in 2015, that was sold almost entirely on the local market). Thus unless this pattern
of consumption changes significantly, coconut oil and copra will not benefit directly from the
demand growth of these giants. However, coconut oil market will benefit indirectly due to inter-
relationship between all the oils that make up the “vegoil” complex.
Table 6: World coconut oil and copra imports: 2011–2015 (tonnes)
2011 2012 2013 2014 2015
Coconut oil
Europe 714,831 722,029 1,023,135 774,102 966,530
Germany 232,227 290,518 342,987 197,549 320,300
Netherlands 146,873 80,971 275,562 228,966 268,700
UK 49,793 42,380 42,772 62,436 32,800
Africa 26,978 31,555 30,589 24,166 26,700
Americas 470,762 621,791 636,812 370,412 521,870
USA 423,189 589,192 588,054 335,784 477,500
Asia 259,193 204,735 252,101 348,722 391,820
China 43,400 32,670 72,302 39,483 95,500
Japan 19,996 28,045 33,321 28,128 32,300
India 6,900 4,400 1,373 23,500 22,000
Korea Rep 49,130 45,466 39,084 40,718 43,500
Pacific 22,743 17,980 16,850 18,832 16,100
Australia 17,613 13,400 14,000 14,834 12,200
Total coconut
oil imports 1,494,507 1,598,090 1,959,487 1,536,234 1,923,020
Copra
Europe
Germany 96 84 18 - -
UK 26 50 - 44 48
France 285 147 1811 148 122
Belgium-Lux - - - - 1
Ireland - 15 15 - -
Spain - 4 345 24 9
Others 34 95 60 210 1,431
Africa 17 1,790 50 73 1,979
Americas - 157 108 - 6
USA - 132 16 - -
Trinidad & Tobago - 21 49 - -
Others 17 40 50 73 1979
Asia 169,024 143,297 76,604 38,290 121,159
Bangladesh 28,765 13,500 13500 - -
India 1,00 1,000 1,600 480 1,500
China 4 52 - - 40
Pacific - 520 437 262 100
Australia - 0 8 21 0
New Zealand 197 420 329 141 0
Total copra imports 280,099 334,763 354,633 296,048 270,000
Copra as % coconut 18.7% 20.9% 18.1% 19.3% 14.0%
oil imports
Source: APCC 2015 Statistical Year Book
153.2.2
The traditional nature of the coconut oil and copra market
The market for crude coconut oil and copra is particularly narrow – traditionally characterised by
little product differentiation. There was thus limited opportunity for niche market products from
the small exporters in the PICs. Crude oil from crushed copra (CNO), the product produced by
most PICs, is not an end product in most coconut value chains. For the most part, crude coconut
oil is exported to a few large companies for manufacture into refined, bleached and deodorised
(RBD) oil for consumption in the importing countries or for re-export. These companies are
mainly located in Europe (particularly Germany and the Netherlands) and Asia (particularly the
Philippines). Copra is also exported directly for processing into crude coconut oil and then for
further processing into RBD oil. All copra and copra oil, regardless of where it is milled, receives
the Federation of Oils, Seeds and Fats Association (FOSFA) price, with quality discounts applying.
More recently, opportunities for niche market oil opportunities have emerged with the rapid
development of markets for virgin coconut oil (VCO). VCO is produced directly from fresh mature
coconut kernel and thus by-passes the stage of first making copra. Unlike crude or RBD coconut
oil, relatively small quantities of VCO can be differentiated in the market in terms of its quality
and certification, based on such things as origin, organic production and fair trade. Such niche
market products will be the focus of Section 4 of this overview market report.
3.2.3
Time series analysis of coconut product prices and their trends
Commodity prices tend to be unstable, with vegetable oils particularly so. Copra and coconut oil
are ranked as the must unstable of all agricultural commodities – something PIC copra farmers
and millers are readily aware of. Crude coconut prices for the last two decades for crude coconut
oil and copra are plotted in Figure 4 and Figure 5. The first decade was a period of unstable prices
with a marked overall downward trend. This was followed by decade of even more unstable
prices but with prices trending significantly upwards. Prices reached record levels exceeding USD
2,000/tonne in 2011 and now stand at around USD 1,600/tonne.
Unstable coconut oil prices and the significant upward price trend over the last decade can be
explained by a combination of factors:
• the expansion of world trade in vegetable oils with the closure of the Uruguay Round in 1996;
• the high income elasticity for edible oils and income growth in the major growth markets of
China and India;
• the replacement of the negative health image of tropical oils for food use in North American
and EU markets with a positive health image, and the increasing awareness of the health
problems associated with trans fatty acids (TFA) with some other vegetable oils;
• the diversion of edible oils supplies (particularly palm oil and soya bean oil) for use as bio-
fuel, which increased the demand for coconut oil. More recently the demand for biofuel has
declined with the falling of petroleum prices and growing international concern over the
environmental impact of deforestation for oil palm planting and soybean production. This
has had a price depressing effect on vegetable oils, including coconut oil;
• continuing contraction in global coconut supply that has been exacerbated by major cyclonic
events such as in the Philippines which is the dominant world coconut producer. The
production decline has been even greater in PICs than the Philippines– but this represents
only a small proportion of global supply.
16Figure 4: Coconut oil prices: 1996–2016
Figure 5: Copra prices: 1996–2016
173.2.4
Comparative performance of coconut oil with other vegetable oils
The Asian Pacific Coconut Community (APCC) has ranked the production/export performance of
the 13 major vegetable oils over four decades (Table 7). Over this period, coconut oil has slipped
from number 5 in production to number 7. In terms of exports, coconut oil’s ranking has fallen
from 4 to 5.
Table 7: Changing production and export rankings of vegetable oil
Vegetable oil 1960s 1970s 1980s 1990s
Soybean 1/1* 1/2 1/2 1/2
Palm oil 8/2 5/1 2/1 2/1
Rapeseed 7/11 6/6 4/5 3/4
Sunflower 3/3 2/4 3/3 4/3
Groundnut 2/5 3/5 6/8 5/9
Cotton 4/7 4/7 5/9 6/10
Coconut 5/4 7/3 7/4 7/5
Clove 6/8 8/8 8/7 8/8
Palm kernel 12/10 12/12 10/6 9/6
Corn 11/12 10/11 9/10 10/7
Linseed 9/6 9/9 11/11 12/12
Sesame 10/13 11/13 12/11 11/13
Castor 13/9 13/10 13/12 13/11
Note: The first number is the production ranking and the second number is the export ranking
Source: Boceta 2000
The overall decline in coconut oil exports is reflected in APCC data for the last seven years for
major exporting countries (Table 8).
Table 8: CNO exports 2010–2016
Country 2010 2011 2012 2013 2014 2015 2016
Philippines 1,746 1,137 1,353 1,511 1,137 1,124 895
Indonesia 857 840 830 868 911 917 843
India 413 407 401 376 395 371 363
Malaysia 45 51 44 53 50 52 42
Vietnam 33 34 34 34 34 34 33
Papua New Guinea 52 55 55 36 22 16 18
Mexico 132 130 131 129 127 127 127
Other Countries 310 311 311 322 311 311 333
Total 3,616 2,991 3,288 3,358 3,015 2,980 2,980
Source: APCC 2017
18You can also read