2021 CONFERENCE RECAP - INSTITUTIONAL INVESTOR

Page created by Gene Riley
 
CONTINUE READING
2021 CONFERENCE RECAP - INSTITUTIONAL INVESTOR
APRIL 2021

      2021
INSTITUTIONAL INVESTOR
CONFERENCE RECAP
2021 CONFERENCE RECAP - INSTITUTIONAL INVESTOR
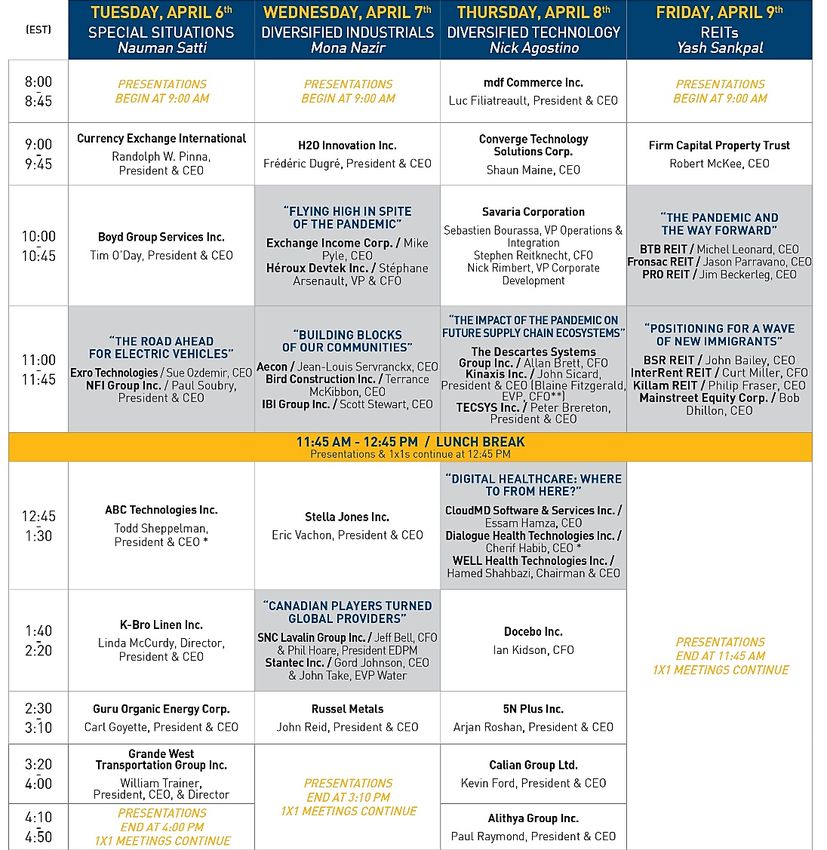
Institutional Investor Conference Recap
On April 6-9th, 2021, LBS hosted its eighth Annual Institutional Investor Conference in an extended, virtual form. Each day focused
on a specific industry and included engaging panels, presentations and 1x1 meetings. Attendance was exceptionally strong with approximately
300 people attending and included presentations from ~40 corporate issuers. We believe the strong conference attendance is indicative of
continued value of our product following strong performances in previous years, making it a marquee conference in Canada.
Presentations included traditional group presentations, panel discussions, fireside chats, as well as approximately 120 one-on-one
meetings between corporate issuers and institutional investors. Below is a list of events that took place:

We would like to thank all those who participated and we look forward to hosting you all at our next conference in 2022.

Cameron Baker, CFA M.IM.
Head of Equities and Syndication

APRIL 2021                                                      ii
2021 CONFERENCE RECAP - INSTITUTIONAL INVESTOR
Table of Contents
DAY 1: SPECIAL SITUATIONS                                                                              DAY 4: REITS
ABC Technologies Holdings Inc. (ABCT-T – $8.16) .............................2
                                                                                                       BSR REIT (HOM.U -T – US$10.97)..................................................... 21
Boyd Group Services Inc. (BYD-T – $225.12) .......................................2
                                                                                                       BTB REIT (BTB.UN-T – $4.07) ............................................................ 21
Currency Exchange International Corp. (CXI-T – $13.51) ....................3
                                                                                                       Firm Capital Property Trust (FCD.UN-V – $6.57) ............................... 22
Exro Technologies Inc. (EXRO-V – $4.44) ............................................3
                                                                                                       Fronsac REIT (FRO.UN-V – $7.20) ..................................................... 22
Guru Organic Energy Corp. (GURU-T – $16.90) ..................................4
                                                                                                       InterRent REIT (IIP.UN-T – $15.23) ..................................................... 23
K-Bro Linen Inc. (KBL-T – $40.17)..........................................................4
                                                                                                       Killam REIT (KMP.UN -T – $17.78)...................................................... 23
NFI Group Inc. (NFI-T – $29.02) ............................................................ 5
                                                                                                       Mainstreet Equity Corp. (MEQ -T – $81.59) ........................................ 24
Vicinity Motor Corp. (VMC-V – $8.01) ....................................................5
                                                                                                       PRO REIT (PRV.UN-T – $6.40) ........................................................... 24
DAY 2: INDUSTRIALS
Aecon Group Inc. (ARE-T – $19.97) ......................................................7              Appendix I – Coverage Universe ...................................................... 25
Bird Construction Inc. (BDT-T – $9.07) ..................................................7             Appendix II – Disclosures .................................................................. 26
H2O Innovation Inc. (HEO-V – $2.51) ....................................................8
Héroux Devtek Inc. (HRX-T – $16.46)....................................................8
IBI Group Inc. (IBG-T – $10.88) ..............................................................9
Russel Metals Inc. (RUS-T – $27.41) .....................................................9
SNC-Lavalin Group Inc. (SNC-T – $27.11)..........................................10
Stantec Inc. (STN-T – $57.35) ..............................................................10
Stella-Jones Inc. (SJ-T – $50.81)..........................................................11
DAY 3: DIVERSIFIED TECHNOLOGY
5N Plus Inc. (VNP-T – $4.60) ................................................................13
Alithya Group Inc. (ALYA-T; ALYA-O – $2.86) ............................................13
Calian Group Ltd. (CGY-T – $58.75) ...................................................14
CloudMD Software & Services Inc. (DOC-V – $2.15) .........................14
Converge Technology Solutions Corp. (CTS-T – $5.32) ....................15
Docebo Inc. (DCBO-T; DCBO-O – $59.87) .........................................15
Dialogue Health Technologies Inc. (CARE-T – $17.83) .....................16
Kinaxis Inc. (KXS-T – $156.37) .............................................................16
mdf Commerce Inc. (MDF-T – $11.72) ................................................17
Savaria Corporation (SIS-T – $17.95) ..................................................17
TECSYS Inc. (TCS-T – $46.89)............................................................18
The Descartes Systems Group Inc. (DSG-T; DSGX-O – US$64.98) .18                                        All prices are as of April 12, 2021 close, unless otherwise stated.
WELL Health Technologies Corp. (WELL-T – $7.66) .........................19

APRIL 2021                                                                                        ii
2021 CONFERENCE RECAP - INSTITUTIONAL INVESTOR
APRIL 2021   1
2021 CONFERENCE RECAP - INSTITUTIONAL INVESTOR
Company Profile                                                                                    ABC Technologies Holdings Inc. (ABCT-T)
   ABC Technologies Holdings provides custom, engineered, technical                                   Rating: Not Rated – Target: N/A; Price: $8.16
   plastics and light weighting solutions to the light vehicle industry. The                          We summarize key points from ABC’s presentation at our conference.
   company covers all facets of the plastics processing technologies,
   systems and components for the global automotive industry, Fluid                                          Focused on value-add engineering products. ABCT remains
   Management, HVAC Distribution Systems, Flexible Products,
   Interior and Exterior Systems and Air Induction Systems. It was
                                                                                                              focused on creating innovative parts for the automotive industry through
   founded in 1974 and is based in Toronto, Canada.                                                           its proprietary integrated machine and equipment building process, so
                                                                                                              that it can command higher margins, outperform the industry, and
   Market and Company Data                                                                                    increase content per vehicle (CPV).
                                                                                                             EV ready. 90% of ABCT products are powertrain agnostic with 40–50 new
    Ticker                ABCT-T                                    Shares O/S (M)       52.5
    Rating                N/A                                       Market Cap (M)      $429                  contract wins from high volume EV platforms. New regulations on improving
    Risk                  N/A                                         Float O/S (M)      11.0                 fuel economy and EV’s desire to increase range provide tailwinds to ABCT’s
    Price                 $8.16                                     Float Value (M)       $90
    1-Yr Target           Not Rated                           Avg Daily Volume (K)       40.6                 light-weight solutions as OEMs try to reduce vehicle weights.
    Dividend              N/A                                  Enterprise Value (M) USD 740
    Yield (%)             N/A                                      Control Blocks:                           Entrenched Customer Relations. In some cases, ABCT has multi-
    1-Yr ROR
    52 Wk High-Low        $10.38 - $7.91
                                                                        Manag & Dir
                                                                        CPPIB & CDP
                                                                                                              decade (45+ years) customer relations, as partnering with OEMs in the
    BVPS                  USD 1,937                                   Net Debt/Cap     69.9%                  early stages of product development allows long product cycles with
    Valuation                                                      Next Reporting
    Year End
                          -
                          30-Jun
                                                                                      May-21
                                                                                                              opportunities to increase CPV over time.
                                                                                                             Strong balance sheet provides M&A opportunities. Low leverage
    Adjusted EBITDA (US$'M)                                                                                   and a normalized FCF yield of ~10%+ allow ABCT to go after distressed
                Q1           Q2                 Q3                Q4          Annual     EV/EBITDA
    F2019A      $33   A     $47            A   $47        A      $43        A $170.4         4.3x             suppliers or acquisition targets looking for an exit.
    F2020A      $42   A     $48            A   $30        A     ($31)       A $89.0          8.3x
    F2021A      $41   A     $44            A          -                 -                    N/A
    Source: Company reports; Bloomberg; LBS.

   Company Profile                                                                                    Boyd Group Services Inc. (BYD-T)
   Boyd Group is the largest corporate-owned multi-location operator                                  Rating: Not Rated – Target: N/A; Price: $225.12
   in North America’s $30-40B collision repair industry, with locations                               We summarize key points from Boyd’s presentation at our conference.
   in Canada and the United States. Boyd currently operates three
   brands as well as an auto glass repair referral network. Repair                                           Expensive repairs to offset volume declines. Advanced driver-
   services are offered to commercial and individual vehicle owners
   and focused heavily on insurance repair claims.
                                                                                                              assistance systems (ADS) result in fewer accidents but average repair
                                                                                                              costs are increasing from: 1) shift in mix towards higher maintenance
                                                                                                              SUVs and cross-over vehicles vs. sedans; 2) higher part costs and
   Market and Company Data                                                                                    repair complexity; and, 3) new labour operations such as calibration,
    Ticker                BYD-T                                               Year End      Dec. 31           which is required for ADS repairs.
    Rating                N/A                                   FD Shares O/S (M)             21.5
    Risk
    Price
                          N/A
                          $225.12
                                                               Market Cap (fd) (M)
                                                                        Float O/S (M)
                                                                                            $4,833
                                                                                              20.2
                                                                                                             Leveraging location network to increase service offering. As the
    1-Yr Target           Not Rated                                 Float Value (M)         $4,547            sophistication of collision repair increases, Boyd can adopt its network,
    Dividend
    1-Yr ROR
                          $0.56
                          N/A
                                                              Avg Daily Volume (k)
                                                              Enterprise Value (M)
                                                                                              88.3
                                                                                            $5,519
                                                                                                              e.g. certain locations have unique capabilities; a Tesla cannot be
    52 Wk High-Low $166.00-$245.00                                Net Debt/EBITDA              0.9x           repaired in all locations but Boyd can leverage its network to transfer it
    Valuation             N/A                                      Next Reporting           May-21
                                                                                                              to a location that can service Tesla or any other sophisticated job.
    Adjusted EPS FD
                     Q1             Q2               Q3                 Q4     Annual        P/E             Fragmented industry provides M&A growth opportunities.
    2018
    2019
                  $1.05 A
                  $1.42 A
                                $1.07 A
                                $1.18 A
                                               $1.03 A
                                               $1.04 A
                                                                 $1.16 A
                                                                 $1.20 A
                                                                                $4.31 A
                                                                                $4.83 A
                                                                                            52.2x
                                                                                            46.6x
                                                                                                              Management reiterated its target to double the business over the next
    2020A         $0.95   A     ($0.33) A      $1.02 A           $0.98 E        $2.60 E     86.6x             five years (vs. 2019), with M&A the primary driver, as Top 3 players only
    Adj. EBITDA ($M)
                                                                                                              account for 20% of revenue market share. Boyd will continue to prefer
                     Q1             Q2               Q3                 Q4     Annual EV/EBITDA               single-shops, MSOs, and brown/greenfield opportunities where the first
    2018
    2019
                  $42.1 A
                  $78.3 A
                                $42.5 A
                                $80.1 A
                                               $41.2 A
                                               $77.4 A
                                                                 $47.6 A       $173.4 A
                                                                 $84.1 A $319.9 A
                                                                                            14.7x
                                                                                            12.6x
                                                                                                              two options are not suitable. For single-shops, management targets
    2020A         $81.4 A       $49.2 A        $84.5 A           $78.4 E       $293.6 E     17.5x             25% pre-tax ROIC.
    Source: Company reports; Thomson; Bloomberg; LBS estimates.

APRIL 2021                                                                                                2
2021 CONFERENCE RECAP - INSTITUTIONAL INVESTOR
Company Profile                                                                                   Currency Exchange International Corp. (CXI-T)
   Currency Exchange International, Corp. (CXI) is a provider of foreign                             Rating: Not Rated – Target: N/A; Price: $13.51
   currency banknotes and related services to wholesale clients                                      We summarize key points from CXI’s presentation at our conference.
   (financial institutions and non-financial corporates) through its
   Exchange Bank of Canada subsidiary; as well as to retail clients                                         Payment business provides revenue diversification. Currency
   (through wholly-owned retail outlets and affiliate relationships) in
   North America.
                                                                                                             Exchange International is focused on its B2B payment business for
                                                                                                             growth as it provides greater opportunity following the pandemic, while
                                                                                                             the currency business faces secular headwinds. The payment business
   Market and Company Data                                                                                   now contributes ~18% of total revenue and has added 759 new bank
    Ticker                CXI-T                                             Year End       Oct. 31           and corporate relationships in 2020.
    Rating                N/A                                  FD Shares O/S (M)          6,415.3
    Risk                  N/A                                 Market Cap (fd) (M)          $86.7            Technology provides a competitive advantage. Proprietary CEIFX
    Price                 $13.51                                       Float O/S (M)          6.4
    1-Yr Target           Not Rated                               Float Value (M)          $86.6
                                                                                                             technology platform (Compliance Verification System, CVS) is based
    Dividend              $0.00                              Avg Daily Volume (k)             7.7            around consumer activity with transactions being updated live, as
    1-Yr ROR              N/A
    52 Wk High-Low $8.80-$13.69
                                                             Enterprise Value (M)
                                                                  Next Reporting
                                                                                            $31.2
                                                                                          May-21
                                                                                                             compared to other platforms that update transactions overnight. Being
    Valuation             N/A                                           Fisacal Year          Oct            live allows CXI customers to have better risk management on
    U$ EPS FD                                                                                                transaction limits.
                     Q1             Q2              Q3             Q4        Annual         P/E
    F2018         $0.05 A       $0.08 A          $0.37 A        $0.16 A       $0.66 A      15.5x            Strategic priorities. 1) Expand FX business with U.S. Banks and Credit
    F2019       ($0.03) A       $0.08 A          $0.28 A        $0.12 A       $0.46 A      22.5x
                                                                                                             Unions with an integrated platform; 2) Expand wholesale banknote
    F2020         $0.02   A     ($0.46) A        ($0.35) A     ($0.54) A      ($1.33) A    N/A
    EBITDA (US$000's)
                                                                                                             business, globally; 3) Scale Corporate International Payments; 4) Maximize
                     Q1             Q2              Q3             Q4        Annual EV/EBITDA                Direct-to-Consumer offering; and, 5) Optimize corporate infrastructure,
    F2018
    F2019
                $1,964 A
                  $390 A
                                $1,310 A
                                $1,287 A
                                                $3,682 A
                                                $3,177 A
                                                               $1,824 A
                                                               $2,076 A
                                                                             $8,780 A
                                                                             $6,931 A
                                                                                           14.9x
                                                                                           16.6x
                                                                                                             including updating customer relationship management system.
    F2020       $1,426 A ($2,073) A             ($1,243) A ($3,032) A ($4,921) A           N/A
    Source: Company reports; Thomson; Bloomberg; LBS estimates.

   Company Profile                                                                                   Exro Technologies Inc. (EXRO-V)
   Exro Technologies Inc. is a Calgary headquartered clean technology                                Rating: Not Rated – Target: N/A; Price: $4.44
   company offering patented, advanced control technology for self-                                  We summarize, below, key points from Exro Technologies’ participation in
   optimizing electric motors and generators to improve efficiency of
   rotating electrical machines.                                                                     our Industry Panel Discussion “The Road Ahead for Electric Vehicles”.
                                                                                                            Pace of EV adoption varies with equipment. Electric bikes or large
   Market and Company Data                                                                                   EV fleets are expected to have faster EV adoption where building
                                                                                                             infrastructure, such as having an in-house charging depot, is easier as
    Ticker                EXRO-V                                   Shares O/S (M)          117.5
    Rating                N/A                                      Market Cap (M)         $521.5             compared to mass-scale EV adoption. Right now, the focus for EVs is
    Risk
    Price
                          N/A
                          $4.44
                                                                     Float O/S (M)
                                                                   Float Value (M)
                                                                                             25.3
                                                                                          $112.2
                                                                                                             to get to the market but the next generations should focus on costs and
    1-Yr Target           Not Rared                          Avg Daily Volume (K)           1077             ROIs, which is where Exro can provide value-add.
    Dividend              $0.00                               Enterprise Value (M)          $474
    Yield (%)
    1-Yr ROR
                          0.0%
                          N/A
                                                                  Control Blocks:
                                                                                                 -
                                                                                                            Government funding helps in bridging the gap. Indirect funding to
    52 Wk High-Low        $7.55 - $0.29                                                          -           Exro’s potential customers can help towards green transition while any
    BVPS                  $0.41                                    Net Debt/Cap              0.8%
    Valuation             N/A                                     Next Reporting            Jul-21           direct funding to Exro should help in its R&D efforts. Although Exro is
    Year End              31-Dec                                                                             not dependent on any grants, such support can help the company to
    Adjusted EPS (FD)                                                                                        accelerate its product innovation efforts.
                Q1                  Q2        Q3        Q4      Annual                     P/E
    2018A     ($0.02)       A     ($0.01) A ($0.02) A ($0.02) A ($0.06) A                  N/A              Costs improving with newer modules. Focus remains on working with
    2019A     ($0.02)       A     ($0.02) A ($0.02) A ($0.02) A ($0.07) A                  N/A
    2020A     ($0.02)       A     ($0.03) A ($0.03) A ($0.04) A ($0.12) A                  N/A               partners to introduce new modules of Exro’s patented inventor technology
    Adjusted EBITDA ($M)                                                                                     to improve costs and increase efficiencies. Partnerships across multiple
    2018A
                Q1
               (0.7)   A
                                    Q2
                                   (0.7)    A
                                                  Q3
                                                 (0.8)   A
                                                                Q4
                                                               (0.9)    A
                                                                            Annual EV/EBITDA
                                                                              (3.2) A  N/A
                                                                                                             industries (bikes, boats, and vehicles) allow Exro to demonstrate that the
    2019A      (1.0)   A           (1.0)    A    (1.1)   A     (1.5)    A     (4.6) A  N/A                   product is scalable and the next step is to commercialize the product on the
    2020A      (1.5)   A           (2.1)    A    (3.0)   A     (4.0)    A    (10.5) A  N/A
                                                                                                             back of a new facility that will be ready next year.
    Source: Company reports; Bloomberg; LBS.

APRIL 2021                                                                                               3
2021 CONFERENCE RECAP - INSTITUTIONAL INVESTOR
Company Profile                                                                                Guru Organic Energy Corp. (GURU-T)
   Guru Organic Energy Corp. offers natural, organic, plant-based                                 Rating: Hold – Target: $19.00; Price: $16.90
   energy drinks under the brand name “Guru”. The company has a                                   Nauman Satti, Diversified Analyst
   large presence in the Quebec market but plans to expand in Canada
   and the U.S.                                                                                   We summarize key points from Guru’s presentation at our conference.
                                                                                                         A differentiated product and brand. Guru is the third-largest brand in
   Market and Company Data                                                                                Quebec (13% market share). It looks to disrupt the energy drink market
    Ticker                GURU-T                                      Year End         31-Oct             by offering differentiated plant-based organic energy drinks vs. the
    Rating                Hold                            FD Shares O/S (M)             29.5              incumbents that use synthetic products. The company is also branding
    Risk                  High                           Market Cap (fd) (M)            $498
    Price                 $16.90                                  Float O/S (M)         29.2              itself differently, with a focus on authenticity and progressiveness that is
    1-Yr Target
    Dividend
                          $19.00
                          $0.00
                                                             Float Value (M)
                                                        Avg Daily Volume (k)
                                                                                        $494
                                                                                        41.0
                                                                                                          in-line with popular trends of environment and social issues.
                                                                                                          Aggressive growth targets. A recent equity raise has given Guru
    1-Yr ROR              12.4%                         Enterprise Value (M)            $484
    52 Wk High-Low        $23.48 - $7.60                   Net Debt/EBI TDA                 N/A   
    Valuation             13x 2022 EV/Sales                  Next Reporting            Jun-21             ~$30M of liquidity to pursue its growth targets: doubling sales in Quebec
    Sales ($MM)                                                                                           over the next 4–5 years; replicating Quebec’s growth model in the rest
                     Q1             Q2          Q3            Q4       Annual         EV/S
    2019            N/A A           N/A A      N/A A         N/A A       $17.5 A       N/A                of Canada (targeting 10% market share in next 4–5 years); targeting
    2020
    2021E
                    N/A A
                   $6.6 A
                                    N/A A
                                   $6.3 E
                                              $6.6 A
                                              $8.4 E
                                                            $6.1 A
                                                            $8.8 E
                                                                         $22.1 A
                                                                         $30.2 E
                                                                                      21.6x
                                                                                      16.2x
                                                                                                          expansion in the U.S. (California), and investing more in the online
    2022E          $9.0 E          $8.6 E    $11.5 E      $11.9 E        $41.0 E      12.1x               channel as it becomes increasingly important.
    2023E         $11.6 E         $11.1 E    $14.8 E      $15.4 E        $52.9 E      9.4x

    Adj. EBI TDA ($'MM)                                                                                  Product innovation remains a key. After two successful product
    2019
                     Q1
                    N/A A
                                    Q2
                                    N/A A
                                                Q3
                                               N/A A
                                                              Q4
                                                             N/A A
                                                                       Annual
                                                                          $1.6 A
                                                                                   EV/EBI TDA
                                                                                       N/A
                                                                                                          launches last year, including Yerba Mate, Guru looks to launch new
    2020            N/A A           N/A A     $1.8 A       ($0.4) A       $1.4 A     334.9x               products around plant-based ingredients with an element of
    2021E
    2022E
                  ($0.4) A
                  ($0.9) E
                                  ($1.1) E
                                  ($0.9) E
                                             ($1.4) E
                                             ($1.1) E
                                                           ($2.2) E
                                                           ($1.2) E
                                                                         ($5.1) E
                                                                         ($4.1) E
                                                                                      NMF
                                                                                      NMF
                                                                                                          “functionality” branding. Guru’s Yerba Mate Energy is inspired by a
    2023E         ($0.1) E        ($0.1) E   ($0.1) E      ($0.2) E      ($0.5) E     NMF                 popular South American plant and caffeine-rich drink. It is becoming a
                                                                                                          top-ranked product for Guru since its launch in November 2020.
    Source: Company reports; Thomson; LBS estimates.

   Company Profile                                                                                K-Bro Linen Inc. (KBL-T)
   K-Bro is the largest owner and operator of laundry and linen                                   Rating: Not Rated – Target: N/A; Price: $40.17
   processing facilities in Canada. The company provides a range of                               We summarize key points from K-Bro Linen’s presentation at our
   services to healthcare institutions, hotels and other commercial
   accounts that include the processing, management and distribution                              conference.
   of general linen and operating room linen.
                                                                                                         Established long-term, exclusive contracts. K-Bro has well-
                                                                                                          established relationships with big brands such as Hilton, Sheraton, Four
   Market and Company Data                                                                                Seasons, Alberta Health Services, Trillium Health and SickKids, with typical
    Ticker                KBL-T                                       Year End       Dec. 31              service contracts of 10 years and retention rates in the high 90s. A high
    Rating                N/A                             FD Shares O/S (M)             10.7              share of revenue mix from multi-year contracts provides revenue stability.
    Risk                  N/A                            Market Cap (fd) (M)           $429
    Price                 $40.17                                  Float O/S (M)         10.5             Revenue diversification. K-Bro’s revenue diversity between
    1-Yr Target                                              Float Value (M)
    Dividend
                          Not Rated
                          $1.20                         Avg Daily Volume (k)
                                                                                       $422
                                                                                        41.0
                                                                                                          Hospitality (45%) and Healthcare (55%) based on 2019 results provides
    1-Yr ROR              N/A                           Enterprise Value (M)            $513              a cushion against industry headwinds, as seen during COVID, where
    52 Wk High-Low $24.00-$42.87                           Net Debt/EBITDA              1.0x
                                                                                                          Healthcare revenue grew by 9% YoY while Hospitality revenue dropped
    Valuation             N/A                                Next Reporting          May-21
                                                                                                          by 60% in 2020.
    Adjusted EPS FD
                    Q1              Q2          Q3           Q4        Annual         P/E                Strong balance sheet provides growth flexibility. Financial leverage
    2018
    2019
                  $0.06 A
                  $0.05 A
                                $0.25 A
                                $0.34 A
                                             $0.18 A
                                             $0.44 A
                                                          $0.10 A
                                                          $0.21 A
                                                                         $0.59 A
                                                                         $1.03 A
                                                                                     68.4x
                                                                                     38.9x
                                                                                                          of 1.0x (LTM) and available credit of $58M provide growth opportunities
    2020          $0.09 A       $0.15 A      $0.32 A     ($0.20) E       $0.36 E     111.6x               via M&A or new greenfield wins. Despite COVID-19 headwinds,
    Adj. EBITDA ($M)                                                                                      management reduced long-term debt by 35% to $40.7M in 2020.
                    Q1              Q2          Q3           Q4        Annual     EV/EBITDA
    2018          $6.2 A          $8.5 A      $8.3 A       $6.6 A        $29.6 A     17.3x
    2019          $9.1 A        $12.7 A      $14.6 A      $11.1 A        $47.6 A     10.8x
    2020          $9.3 A        $10.1 A      $12.7 A       $6.2 E        $38.2 E     13.4x
    Source: Company reports; Thomson; Bloomberg; LBS estimates.

APRIL 2021                                                                                            4
2021 CONFERENCE RECAP - INSTITUTIONAL INVESTOR
Company Profile                                                                                      NFI Group Inc. (NFI-T)
   NFI Group is a manufacturer of transit buses and motor coaches,                                      Rating: Buy – Target: $39.00; Price: $29.02
   based in Winnipeg, Manitoba, Canada. The company has also                                            Nauman Satti, Diversified Analyst
   ventured into the electric bus market and operates multiple brands:
   New Flyer, ADL, ARBOC, MCI, NFI Parts, Carfair, and Plaxton.                                         We summarize below key points from NFI Group’s participation in our
                                                                                                        Industry Panel Discussion “The Road Ahead for Electric Vehicles”.
   Market and Company Data                                                                                     EV evolution; not revolution. Transit buses are funded by government
    Ticker                   NFI-T                                 Shares O/S (M)                  71           dollars. The average bus age in North America is ~9 yrs. This should make
    Rating
    Risk
                             Buy
                             High
                                                                   Market Cap (M)
                                                                       Float O/S (M)
                                                                                           C$2,059
                                                                                              54.6%
                                                                                                                EV adoption gradual as economic value is too high to retire low age ICE
    Price                    C$29.02                               Float Value (M)         C$1,123              buses. Furthermore, the initial capital required for EVs is high because of
    1-Yr Target
    Dividend
                             C$39.00
                             2.9%
                                                                Avg Daily Volume
                                                              Enterprise Value (M)
                                                                                            325,979
                                                                                           C$3,081
                                                                                                                higher upfront bus costs and related indirect infrastructure costs, such as
    1-Yr ROR                 37.3%                                                                              charging depots. There is also a need to ramp up energy to meet EV demand.
    52 Wk High-Low           C$32.74 - C$12.92                              Year-End            Dec
    BVPS
    Valuation
                             $9.92
                             9.5x EV/EBITDA (2022)
                                                                       Net Debt/Cap
                                                                   Next Reporting
                                                                                               54%
                                                                                           May 2021
                                                                                                               Platform agnostic, breadth of products, global footprint, and
    Adj. EPS (FD)                                                                                               customer relationships provide a competitive advantage. NFI is
                                                                                                                platform agnostic, which means it can adjust to any demand from the
                   Q1                 Q2          Q3             Q4             Annual       P/E
    2018A         $0.57      A     $0.82     A   $0.57   A     $0.70        A   $2.67        8.4x
    2019A
    2020A
                  $0.26
                  ($0.01)
                             A
                             A
                                   $0.42
                                   ($0.97)
                                             A
                                             A
                                                 $0.24
                                                 $0.09
                                                         A
                                                         A
                                                               $0.72
                                                               $0.13
                                                                            A
                                                                            A
                                                                                $1.64
                                                                                ($0.75)
                                                                                            13.6x
                                                                                             N/A
                                                                                                                battery, fuel cells, or traditional ICE vehicles, unlike pure-play EVs. NFI
    2021E         ($0.15)    E     $0.01     E   $0.25   E     $0.32        E   $0.43       51.8x               also benefits from a long history of operations and relationships with
    2022E         $0.23
    Adjusted EBI TDA ($M)
                             E     $0.49     E   $0.36   E     $0.74        E   $1.81       12.3x
                                                                                                                transit agencies as transit buses are highly customized to the needs of
                   Q1                 Q2          Q3             Q4             Annual EV/EBI TDA               customers, which vary with different geographies.
    2018A          $74       A      $91      A   $70     A      $80         A   $315         7.5x
    2019A
    2020A
                   $60
                   $56
                             A
                             A
                                    $81
                                    ($24)
                                             A
                                             A
                                                 $77
                                                 $61
                                                         A
                                                         A
                                                                $104
                                                                $65
                                                                            A
                                                                            A
                                                                                $322
                                                                                $158
                                                                                             7.4x
                                                                                            15.0x
                                                                                                               Focused on de-leveraging. The focus is on deleveraging the balance
    2021E          $34       E      $46      E   $70     E      $76         E   $227        10.5x               sheet and becoming a more integrated company with multiple brands.
    2022E          $64    E    $87     E     $72         E      $109        E   $332         7.1x
    *All numbers in US, unless otherwise stated                                                                 Meanwhile, its ADL brand provides the required scale to expand in new
    Source: Company reports; Eikon; LBS.
                                                                                                                geographies.

   Company Profile                                                                                      Vicinity Motor Corp (Grande West Transportation) (VMC-V)
   Vicinity Motor Corp., previously Grande West Transportation Group                                    Rating: Not Rated – Target: N/A; Price: $8.01
   Inc., is a Canada-based leading supplier of mid-size transit vehicles                                We summarize key points from Vicinity Motor Corp.’s (Grande West
   for both public and commercial enterprise use in North America. The
   Company focuses on Vicinity branded transit buses in clean diesel,                                   Transportation Group) presentation at our conference.
   electric, gas and CNG drive systems.
                                                                                                               Expanding into the U.S. 90% of revenue is currently coming from
                                                                                                                Canada. Management wants to change that mix towards the U.S. The
   Market and Company Data                                                                                      company is setting up an assembly plant in Washington State while
    Ticker                  VMC-V                                  Shares O/S (M)               29.3
                                                                                                                leveraging a third-party network for sales.
    Rating                  N/A                                    Market Cap (M)              $235
    Risk                    N/A                                      Float O/S (M)              25.3           Competitive on price. VMC’s 28 Electric Vicinity bus is being priced at
    Price                   $8.01                                  Float Value (M)             $202
    1-Yr Target             Not Rated                        Avg Daily Volume (K)             150.7             US$299K to be competitive in the marketplace. To remain competitive,
    Dividend
    Yield (%)
                            $0.00
                            0.0%
                                                              Enterprise Value (M)
                                                                  Control Blocks:
                                                                                               $243
                                                                                                                management is opting for off-the-shelf parts for the buses which: 1)
    1-Yr ROR                N/A                                                                   -             provides lower costs given a lack of product customization; and, 2)
    52 Wk High-Low          $10.45 - $0.24                                                        -
    BVPS                    $0.78                                  Net Debt/Cap                28%              offers an asset-light model.
    Valuation               N/A                                   Next Reporting             Apr-21
    Year End                31-Dec                                                                             Over $50M in backlog. VMC is in the process of delivering over 100
    Adjusted EPS (FD)                                                                                           buses before the end of 1H/21. The company had raised to $8.7M in
    2018A
                Q1
               $0.01 A
                                    Q2
                                  $0.03
                                                 Q3        Q4      Annual
                                             A ($0.00) A ($0.02) A $0.01
                                                                                             P/E
                                                                                             N/A
                                                                                                                November 2020 to strengthen its balance sheet, as it benefits from an
    2019A     ($0.03) A          ($0.02)     A ($0.09) A ($0.07) A ($0.21)                   N/A                acceleration of the replacement cycle to EVs and the related
    2020A     ($0.07) A          ($0.03)     A ($0.05) A ($0.02) A ($0.17)                   N/A
                                                                                                                government incentives.
    Adjusted EBITDA ($M)
                Q1                    Q2          Q3            Q4          Annual        EV/EBITDA
    2018A       1.7   A              2.9     A    0.6    A      0.0     A     5.2             N/A
    2019A      (0.2) A               0.3     A   (1.8)   A     (0.8)    A    (2.4)            N/A
    2020A      (1.3) A              (0.5)    A   (0.7)   A     0.2      A    (2.3)            N/A
    Source: Company reports; Bloomberg; LBS.

APRIL 2021                                                                                                  5
APRIL 2021   6
Company Profile                                                                                       Aecon Group Inc. (ARE-T)
   Aecon Group Inc. is a construction company that is based in Canada                                    Rating: Buy – Target: $22.00; Price: $19.97
   and derives a majority of its revenue domestically. The company                                       Mona Nazir, Industrials Analyst
   services both private and public sector clients through its
   construction and concessions arms. The company is involved in JV                                      ARE continues to deliver strong financial performance despite a challenging
   and P3 contract structures and given its construction exposure it                                     COVID backdrop. Future performance is supported by a strong backlog,
   offers end-to-end customer solutions. Approximately 50% of                                            population growth, and resumption of travel activities. CEO, Jean-Louis
   revenue stems from fixed price contracts.                                                             Servranckx was on our panel, “Building Blocks of Our Communities”.
   Market and Company Data                                                                                      Diversified approach. While road and bridgework continue to be the
                                                                                                                 “bread and butter,” Urban Transportation, Nuclear and Utilities provide
                                                                                                                 a balanced operational portfolio and deliver consistent financial results.
    Ticker                ARE-T                                        S hares O/S (M)          60.0
    Rating                Buy                                          Market Cap (M)         $1,198
    Risk                  Medium                                           Float O/S (M)        58.5
    Price
    1-Yr Target
                          $19.97
                          $22.00
                                                                       Float Value (M)
                                                               Avg Daily Volume (K)
                                                                                              $1,169
                                                                                               261.6            Well-positioned. With the backlog up ~60% over the last three years
    Dividend
    Yield (%)
                          $0.64
                          3.2%
                                                               Enterprise Value (M)
                                                                   I nsider Ownership
                                                                                                1,481
                                                                                                2.1%
                                                                                                                 and demand for construction continuing to build, Aecon is well-
    1-Yr ROR              13.4%
    52 W k High-Low $20.44-$13.03
                                                                                   BVPS
                                                                       Next Reporting
                                                                                                $6.60
                                                                                               Apr-21
                                                                                                                 positioned. Greater control over client selection and delivering high
    Valuation             6.5x EV/EBITDA (2022)                                   Year End    Dec. 31
                                                                                                                 quality, ultimately decreases overall project risk and prevents cost
                                                                                                                 erosion, which should, in turn, lead to higher profitability.
    Adjusted EPS (FD)
                  Q1                      Q2           Q3             Q4          Annual        P/E
    2018A       (0.32)        A         $0.14     A    $0.60   A     $0.42    A    $0.95       21.1 x

                                                                                                                 ESG not client-requested at this point; industry change required.
    2019A       (0.16)        A         $0.31     A    $0.60   A     $0.31    A    $1.12       17.8 x
    2020A       (0.19)        A         (0.10)    A    $0.99   A     $0.46    A    $1.29       15.4 x    
                                                                                                                 ESG ratings and adoption have been picking up steam in the investment
    2021E       (0.19)        E         $0.14     E    $0.49   E     $0.45    E    $0.97       20.6 x
    2022E                                                                          $1.18       16.9 x

    Adjusted EBI TDA ($M)
                  Q1                      Q2            Q3            Q4          Annual EV/EBI TDA
                                                                                                                 community; on the client-side, a public company approach to ESG is not a
    2018A
    2019A
                  3.7
                  11.9
                              A
                              A
                                         41.4
                                         57.2
                                                  A
                                                  A
                                                       89.5
                                                       91.2
                                                               A
                                                               A
                                                                     72.4
                                                                     61.7
                                                                              A
                                                                              A
                                                                                   207.0
                                                                                   222.0
                                                                                               7.2 x
                                                                                               6.7 x
                                                                                                                 key consideration in winning work. ARE released its Sustainability Report last
    2020A
    2021E
                  19.2
                  24.7
                              A
                              E
                                         24.4
                                         49.0
                                                  A
                                                  E
                                                       137.2
                                                       83.1
                                                               A
                                                               E
                                                                     83.6
                                                                     79.4
                                                                              A
                                                                              E
                                                                                   264.5
                                                                                   236.2
                                                                                               5.6 x
                                                                                               6.3 x
                                                                                                                 year. Environmental considerations are being factored into the build process.
    2022E
    Source: Company reports; Thomson Eikon; LBS.
                                                                                   250.6       5.9 x             They were successful in achieving 0% erosion and 0% sedimentation in the
                                                                                                                 construction of a 180km pipeline in B.C. at multiple river cross points.

   Company Profile                                                                                       Bird Construction Inc. (BDT-T)
   Bird Construction is a Canadian general contractor. Following the                                     Rating: Buy – Target: $11.00 Price: $9.07
   recent acquisition of Stuart Olson proforma revenue is ~$2.5B and                                     Mona Nazir, Industrials Analyst
   headcount sits at 5,000 employees. Projects fall into three
   categories: industrial, commercial and institutional sectors. Bird                                    CEO and President, Terrance McKibbon, was part of our panel discussion,
   provides a comprehensive range of construction services from new                                      “Building Blocks of Our Communities”. With the recent addition of Stuart
   construction to industrial maintenance, repair and operations                                         Olson, we believe that the company is set up for considerable growth in the
   services, heavy civil construction, and contract surface mining; as well                              coming 12–18 months.
   as vertical infrastructure including, electrical, mechanical, and trades.
                                                                                                                Why buy? In 5–10 years’ time, competitive advantages are expected to
   Market and Company Data                                                                                       be the company’s project portfolio and geographic diversity, resilient
    Ticker                        BDT-T                                 S hares O/S (M)         53.04
                                                                                                                 earnings and strong annual shareholder returns. Greater productivity
    Rating
    Risk
                                  Buy
                                  High
                                                                        Market Cap (M)
                                                                            Float O/S (M)
                                                                                              $481.1
                                                                                              100.0%
                                                                                                                 and collaboration at the management level that has increased as a
    Price
    1-Yr Target
                                  $9.07
                                  $11.00
                                                                     Avg Daily Volume
                                                                   Enterprise Value (M)
                                                                                             191,924
                                                                                              $457.3
                                                                                                                 result of COVID, is expected to stay.
    Dividend                      $0.39                                     Net Debt/Cap       25.5%
    Dividend yield
    1-Yr ROR
                                  4.3%
                                  26%
                                                                                    BVPS
                                                                        Next Reporting
                                                                                               $4.01
                                                                                              May-21
                                                                                                                Bird moving forward with tracking ESG metrics and relaying
    52 W k High-Low
    Valuation
                                  $9.95 - $4.59
                                  6.5x 2022 EV/EBITDA
                                                                                                                 information. Bird is making good progress in the ESG arena. There has
    Adj. EPS (FD)                                                                                                been a greater emphasis on tracking emissions on-site and plans are in
                                                                                                                 place to release more detailed data in its sustainability report.
                    Q1                    Q2           Q3            Q4           Annual       P/E
    2018A         ($0.15)         A     ($0.13)   A   $0.10    A    $0.15     A   ($0.02)      N/A
    2019A         ($0.15)         A     $0.02     A   $0.16    A    $0.19     A    $0.22      40.7x

                                                                                                                 Acquisition growth similar to organic growth. Mr. McKibbon
    2020A         $0.03           A     $0.15     A   $0.20    A    $0.41     A    $0.78      11.6x
    2021E         $0.12           E     $0.21     E   $0.27    E    $0.20     E    $0.80      11.3x      
                                                                                                                 identified some key focus areas for the company. With construction
    2022E         $0.18                 $0.26         $0.34         $0.26          $1.04       8.7x
    Adjusted EBI TDA ($M)

                                                                                                                 being at a very “crucial phase”, investments in technology are expected
                    Q1                    Q2           Q3            Q4           Annual    EV/EBI TDA
    2018A              (5.4) A             (4.7) A       9.0   A      12.1    A      10.9     41.9x

                                                                                                                 to yield results and are much needed. Secondly, the company continues
    2019A              (3.1) A             5.4    A     14.1   A      15.8    A      32.3     14.2x
    2020A               7.6       A       12.3    A     18.2   A      40.0    A      78.1      5.9x

                                                                                                                 to look for investment opportunities within the service industry,
    2021E           14.8          E       20.4    E     25.6   E      20.4    E      81.2      5.6x
    2022E           17.4          E       24.1    E     28.1   E      23.0    E      92.6      4.9x
    Source: Company reports; Eikon; LBS.
                                                                                                                 specifically on the utility and renewable side.

APRIL 2021                                                                                                   7
Company Profile                                                                                H2O Innovation Inc. (HEO-V)
   H2O Innovation is a leader in customized water and wastewater                                  Rating: Not Rated – Target: $N/A; Price: $2.51
   treatment solutions using membrane technologies. The company                                   Co-founder, CEO and President, Frédéric Dugré, shared with us H2O’s 20-
   designs and fabricates state-of-the-art, integrated water treatment
   systems for municipal, industrial and commercial users and                                     year history and his vision for how the company can address the global issue
   specializes in applications for drinking water, water reuse,                                   of water contamination while taking part in industry consolidation.
   wastewater treatment and industrial process water.
                                                                                                         “Intimacy” in customer relationships. Given long lead times to build
                                                                                                          and establish relationships, there is a certain level of “intimacy” and trust
   Market and Company Data                                                                                that is required. H2O has been able to harness that, with both its municipal
    Ticker
    Rating
                          HEO-V
                          -
                                                                 Shares O/S
                                                                 Market Cap
                                                                               (M)
                                                                               (M)
                                                                                         80.67
                                                                                          $202            end market (60% of the mix) and industrial clients (40% of the mix).
    Risk                  -                                        Float O/S   (M)         61.8
    Price
    1-Yr Target
                          $2.51
                          -
                                                                 Float Value
                                                          Avg Daily Volume (K)
                                                                               (M)        $155
                                                                                         138.0
                                                                                                         US$4–$5B of addressable market, largely in Canada and the U.S.
    Dividend
    Yield (%)
                          -
                          -
                                                           Enterprise Value (M)
                                                               Control Blocks:
                                                                                          $224
                                                                                                          Globally, 1.8M people die from water pollution annually, according to the
    1-Yr ROR
    52 Wk High-Low
                          -
                          $3.70 - $0.63
                                                                    Manag & Dir
                                                                    CPPIB & CDP
                                                                                             -
                                                                                             -
                                                                                                          Lancet Commission on Pollution and Health. Examples such as water
    BVPS
    Valuation
                          $0.86                                  Net Debt/Cap
                                                               Next Reporting
                                                                                          30%
                                                                                        May-21
                                                                                                          contamination in Flint, Michigan, hit close to home. Significant
    Year End              30-Jun                                                                          opportunities exist in North America due to decaying water systems.
    Revenue ($M)                                                                                          H2O can provide its membrane filtration technology and is moving more
                                                                                                          into recycling waste-water opportunities.
               Q1                 Q2           Q3            Q4          Annual       EV/Sales
    2018A     $22.6       A      $25.8    A   $26.7   A     $24.5    A    $99.7         2.3x
    2019A     $24.4       A      $29.4    A   $32.3   A     $31.9    A   $118.0         1.9x
    2020A
    2021E
              $28.2
              $35.0
                          A
                          A
                                 $33.3
                                 $35.0
                                          A
                                          A
                                              $36.1
                                                -
                                                      A
                                                      E
                                                            $36.0
                                                              -
                                                                     A
                                                                     E
                                                                         $133.6
                                                                            -
                                                                                        1.7x
                                                                                          -              Doubling of revenue and 11% EBITDA margins in 3-years’ time. A
    Adjusted EBI TDA ($M)                                                                                 significant portion of growth is expected to stem from M&A, without
    2018A
                 Q1
                $0.1   A
                                  Q2
                                 $1.4     A
                                              Q3
                                              $0.9    A
                                                            Q4
                                                            $1.0     A
                                                                         Annual
                                                                           $3.4
                                                                                     EV/EBI TDA
                                                                                        66.0x
                                                                                                          dilution. The pipeline of target is sitting close to 30, at this point in time.
    2019A
    2020E
                $1.1
                $1.5
                       A
                       A
                                 $1.4
                                 $2.3
                                          A
                                          A
                                              $2.1
                                              $3.5
                                                      A
                                                      A
                                                            $1.9
                                                            $4.6
                                                                     A
                                                                     A
                                                                           $6.5
                                                                          $11.9
                                                                                        34.5x
                                                                                        18.9x
                                                                                                          With tuck-ins averaging $10–$20M in purchase price, investors can
    2021E       $3.2   A         $3.5     A    -      E      -       E      -             -
                                                                                                          likely expect 3–4 acquisitions over the next three years. Average
    Source: Company reports; Bloomberg; LBS.
                                                                                                          purchase price multiples stand at 5–9x (excluding potential synergies).

   Company Profile                                                                                Héroux Devtek Inc. (HRX-T)
   Héroux Devtek Inc. specializes in the design, development,                                     Rating: Buy – Target: $20.00; Price: $16.46
   manufacture, repair, and overhaul of systems and components for                                Mona Nazir, Industrials Analyst
   the Aerospace sector. The company is one of the largest landing
   gear firms in the world supplying both the commercial and defence                              CFO, Stephane Arsenault, and Corporate Controller, Patrick Gagnon, joined
   sectors. The firm's head office is located in Longueuil, Quebec.                               a fireside chat to discuss how the company has generated positive CF
                                                                                                  throughout the pandemic, its pivot to defence and key end markets.
   Market and Company Data                                                                               High degree of uncertainty in predicting end market ebbs and flows
    Ticker
    Rating
                           HRX-T
                           Buy
                                                              Shares O/S (M)
                                                              Market Cap (M)
                                                                                         36.2
                                                                                       $596.0
                                                                                                          on a quarterly basis, but a plethora of key end market indicators
    Risk                   Medium                                Float O/S (M)          88.1%             exist. Key indicators that may be useful for investors include Boeing
    Price
    1-Yr Target
                           $16.46
                           $20.00
                                                              Float Value (M)
                                                           Avg Daily Volume
                                                                                       $525.1
                                                                                       46,557
                                                                                                          and Airbus backlogs, OEM production rates, the 20-year long term
    Dividend               n/a                        Enterprise Value (M)             $783.2             market outlook for Boeing (40,000 aircraft expected over 20 years),
    1-Yr ROR               21.5%                             Control Blocks:                              defence budgets and new programs (i.e. new fighter jet in Iraq).
    52 Wk High-Low         $21.50- $8.56                           Manag & Dir:         11.9%
    BVPS
    Valuation
                           $9.80
                           10.5x EBITDA (2022)
                                                              Next Reporting
                                                                        Year End
                                                                                       May-21
                                                                                        Mar-31
                                                                                                         Well-positioned for M&A. With stellar financial performance
    Adj. EPS (FD)                                                                                         throughout the pandemic, despite its 100% aerospace exposure, HRX
    F2019A
                   Q1
                  $0.10
                                   Q2
                              A $0.12
                                              Q3
                                          A $0.26
                                                            Q4
                                                      A $0.36       A
                                                                         Annual
                                                                          $0.84
                                                                                        P/E
                                                                                       19.7x
                                                                                                          is well-positioned for acquisition growth. Currently, the focus is to remain
    F2020A        $0.18       A $0.18     A $0.24     A $0.38       A     $0.97        16.9x              in key product categories, including landing gear and/-or actuation
    F2021E
    F2022E
                  $0.09
                  $0.21
                              A $0.17
                              E $0.21
                                          A $0.24
                                          E $0.30
                                                      A $0.28
                                                      E $0.32
                                                                    E
                                                                    E
                                                                          $0.59
                                                                          $1.05
                                                                                       27.9x
                                                                                       15.7x
                                                                                                          systems. Management has studied over 300 targets. One area that
    Adjusted EBI TDA ($M)                                                                                 stands out as complementary, is the single-aisle aircraft market.
                   Q1              Q2         Q3            Q4           Annual EV/EBI TDA
    F2019A        $12.2       A $13.2     A $22.9     A $25.9       A     $74.2        10.6x             Strong corporate culture. HRX’s strong, jovial culture is apparent and the
    F2020A        $21.5       A $21.5     A $24.6     A $28.6       A     $96.2        8.1x
    F2021E        $18.4       A $21.2     A $23.7     A $23.9       E     $87.2        9.0x               team is very much united. Management is constantly looking to improve
    F2022E        $20.3       E $20.2     E $23.6     E $24.3       E     $88.6        8.8x               margin profile by reducing parts costs, eliminating unprofitable business, and
    Source: Company reports; Bloomberg; LBS.
                                                                                                          employing cross-selling initiatives (HRX on Boeing’s preferred supplier list).

APRIL 2021                                                                                            8
Company Profile                                                                                     IBI Group Inc. (IBG-T)
   IBI is a leading, international, multi-disciplinary provider of a broad range                       Rating: Buy – Target: $12.50; Price: $10.88
   of professional services focused on the physical development of cities with                         Mona Nazir, Industrials Analyst
   over 2,900 employees in 76 offices around the world. IBI focuses on four
   main segments of development: Urban Land, Facilities, Transportation                                CEO, Scott Stewart, joined our panel, “Building Blocks of Our Communities”.
   and Systems. The professional services provided by IBI include planning,                            Out of our coverage universe, IBI has seen the most stock price appreciation
   design, implementation, analysis of operations and other consulting                                 from its 52-week low. Upside exists via its Technology arm.
   services related to these four main areas of development.
                                                                                                              Intelligence and technology inherent in IBI’s 30-year history.
   Market and Company Data                                                                                     Technology has seemingly become a focus area for E&C companies
                                                                                                               over the last 12–18 months; however, it has been part of IBI’s DNA for
                                                                                                               over 30 years. While its Intelligence arm has largely operated as a
    Ticker                  IBG-T                     S hares O/S (M)                      37.8
    Rating                  Buy                      Market Cap* (M)                     $411.7

                                                                                                               stand-alone entity, management referenced changes in the engineering
    Risk                    Medium                      Float O/S (M)                      24.2
    Price                   $10.88                    Float Value (M)                    $263.5
    1-Yr Target             $12.50              Avg Daily Volume (K)                       46.1
    Dividend
    Yield (%)
                            $0.00
                            0.0%
                                                 Enterprise Value (M)
                                                     Control Blocks:
                                                                                         $480.7                and consulting business model due to technology development. By
    1-Yr ROR
    52 W k High-Low
                            14.9%
                            $10.90 - $3.66
                                                          Manag & Dir                          36%             capitalizing on this symbiotic relationship, IBI expects to double its
    BVPS
    Valuation
                            $1.67
                            8x EV/EBITDA (2022)
                                                        Net Debt/Cap
                                                     Next Reporting
                                                                                           63%
                                                                                         May-21
                                                                                                               Intelligence revenue according to its five-year plan.
    Year End                31-Dec

    Adjusted EPS                                                                                              Strong design coupled with constant innovation. Despite operating
                                                                                                               in an industry that is typically not characterized by rapid change or
                Q1          Q2                   Q3           Q4             Annual       P/E
    2018A     $0.11   A $0.08               A   $0.13   A    $0.06       A    $0.38      28.9x

                                                                                                               constant innovation, Mr. Stewart stated that his vision for the company
    2019A     $0.14   A $0.15               A   $0.18   A    $0.03       A    $0.49      22.3x
    2020A     $0.19   A $0.16               A   $0.16   A    $0.01       A    $0.51      21.3x
    2021E     $0.14   E $0.22               E   $0.16   E    $0.15       E    $0.67      16.2x
    2022E
    Adjusted EBI TDA ($M)
                                                                              $0.72      15.0x                 over the next 5–10 years is for continued growth, innovation, and a
    2018A
                Q1
                9.1   A
                            Q2
                           9.1              A
                                                 Q3
                                                10.2    A
                                                               Q4
                                                              8.2        A
                                                                             Annual
                                                                              36.6
                                                                                      EV/EBI TDA
                                                                                         13.1x
                                                                                                               “need to pivot.” Strength lies in its strong design capability and
    2019A
    2020A
               10.7
               10.4
                      A
                      A
                          12.2
                          13.1
                                            A
                                            A
                                                12.3
                                                12.7
                                                        A
                                                        A
                                                               6.8
                                                              10.6
                                                                         A
                                                                         A
                                                                              42.0
                                                                              46.9
                                                                                         11.4x
                                                                                         10.2x
                                                                                                               employees, constructing buildings across Canada, the U.S, Europe, and
    2021E
    2022E
               15.6   E   19.3              E   16.4    E     15.7       E    67.1
                                                                              68.6
                                                                                          7.2x
                                                                                          7.0x                 internationally.
    Source: Company reports; Bloomberg; LBS.

   Company Profile                                                                                     Russel Metals Inc. (RUS-T)
   Russel Metals is a metals distribution and processing company,                                      Rating: Buy – Target: $28.00; Price: $27.41
   focused on steel products. The Company operates through three                                       Mona Nazir, Industrials Analyst
   segments: metals service centers, energy products and steel
   distributors. Processing and distribution services are provided to a                                John Reid, President and CEO, joined us in a fireside chat to discuss macro
   base of over 35,000 end customers via a network of 140 locations                                    demand drivers, Russel’s drive to growth — M&A and margin expansion,
   across North America. Product variety carried by Russel varies in                                   and ESG.
   size, shape and specifications and includes carbon hot rolled and
   cold finished steel, pipe and tubular products, stainless steel,                                           What is driving strong pricing environment. In addition to iron ore
   aluminum and other non-ferrous specialty metals.                                                            supply-side issues, increased or pent-up demand in China and other
                                                                                                               emerging markets and infrastructure stimulus spending, restrictions on
   Market and Company Data                                                                                     scrap steel have driven up the price of steel. Tailwinds are not expected
    Ticker                  RUS-T                                  S hares O/S (M)              62.2           to subside in the near-term, with gross profit margins expanding 200–
                                                                                                               400bps+ into H1/2021.
    Rating                  Buy                                    Market Cap (M)          $1,704
    Risk                    Medium                                    Float O/S (M)             61.4
    Price                   $27.41                                 Float Value (M)       $2,556.6
    1-Yr Target             $28.00                          Avg Daily Volume (K)            288.6
    Dividend
    Yield (%)
                            $1.52
                            5.5%
                                                            Enterprise Value (M)*
                                                                      Net Debt/Cap
                                                                                           $1,972
                                                                                            22.3%
                                                                                                              Highly transactional business — end market fragmented. Due to the
    1-Yr ROR
    52 W k High-Low
                            7.7%
                            $27.59-$13.20
                                                                   Next Reporting
                                                                           Year End
                                                                                           May-21
                                                                                           31-Dec              nature of the metals distribution industry, operations are highly
                                                                                                               transactional. Russel has over 40,000 customers, with no customer
    BVPS                    $13.91
    Valuation               9.5x EV/EBITDA (2021)

    Diluted EPS
                                                                                                               equating to more than 3% of the top-line mix. The U.S. market presents
    2019A
                    Q1
                   $0.55    A
                                     Q2
                                   $0.50   A
                                                Q3
                                                $0.29   A
                                                              Q4
                                                             -$0.11    A
                                                                             Annual
                                                                              $1.23
                                                                                         P/E
                                                                                        22.3 x                 the most significant growth opportunity. Looking at its most recent
                                                                                                               acquisition of Sanborn, there was a relationship in place as Sanborn
    2020A          $0.17    A      $0.07   A    $0.29   A    -$0.14    A      $0.39     69.6 x
    2021E          $0.47    E      $0.40   E    $0.30   E    $0.26     E      $1.42     19.3 x
    2022E                                                                     $1.37     20.0 x

    Adjusted EBI TDA ($M)
                                                                                                               was a customer of Russel’s. The owner was at a retirement age with no
    2019A
                    Q1
                   $71.9    A
                                     Q2
                                   $64.8   A
                                                Q3
                                                $48.7   A
                                                              Q4
                                                             $17.6     A
                                                                             Annual
                                                                             $203.0
                                                                                      EV/EBI TDA
                                                                                        9.7 x                  succession plan in place, and the facility was 25 miles from RUS’s
                                                                                                               Milwaukee facility with an opportunity to increase the value-add service
    2020A          $39.2    A      $31.5   A    $47.7   A    $40.6     A     $159.0     12.4 x
    2021E          $61.4    E      $56.6   E    $48.5   E    $45.6     E     $212.0     9.3 x

                                                                                                               offering. Russel is to remain highly disciplined in its M&A strategy.
    2022E                                                                    $212.3     9.3 x

    Source: Company reports; Thomson Eikon; LBS.

APRIL 2021                                                                                                 9
Company Profile                                                                        SNC-Lavalin Group Inc. (SNC-T)
   SNC-Lavalin (SNC) is one of the leading engineering and                                Rating: Buy – Target: $31.50; Price: $27.11
   construction companies in the world and the largest E&C firm in                        Mona Nazir, Industrials Analyst
   Canada. The company provides engineering and construction
   expertise, operations and maintenance services, as well as                             Jeff Bell, CFO, and Phil Hoare, based out of the U.K. and Head of EDPM,
   investments in infrastructure concessions.                                             joined us in our panel, “Building Blocks of Our Communities”.
                                                                                                  Number of high-growth areas. With the planned US$2T in
   Market and Company Data                                                                         infrastructure spending south of the border, SNC is anticipating growth
    Ticker               SNC-T                           Shares O/S (M)             176
    Rating               Buy                             Market Cap (M)           4,759            from this key focus market. Other verticals where the company is seeing
    Risk                 Medium                            Float O/S (M)            175
    Price                $27.11                          Float Value (M)          4,756            increased demand include the nuclear side and the renewable energy
    1-Yr Target          $31.50                    Avg Daily Volume (K)             480
    Dividend             $0.08                      Enterprise Value (M)          5,882            space. In spite of end-market challenges as a result of COVID, Atkin’s
    1-Yr ROR             16.5%                          Control Blocks:
    52 Wk High-Low       $29.72 - $17.50                    Manag & Dir          0.1%              performance has remained resilient throughout and expectations were
    BVPS                 $14.63                          Next Reporting         May-21
    Valuation            Sum-of-the-Parts                      Year End         Dec. 31            set for organic growth to be in the order of “GDP++” within Atkins. Public
    PS&PM EPS        Q1         Q2         Q3         Q4        Annual
    2019A        ($0.08) A ($1.71) A $0.41       A   $0.45 A      ($0.93)                          sector spending remains a good indicator for business growth and
    2020A        ($0.02) A ($0.22) A ($0.33)     A ($1.53) A      ($2.10)
    2021E         $0.40 E $0.39 E $0.39          E   $0.45 E       $1.63                           increases have driven upticks in the backlog.
    2022E                                                          $1.70
    PS&PM Adjusted EBI TDA ($M)
    2019A           $79 A ($152) A       $185    A      $167 A        $279                        As de-risking continues, investors can expect the M&A tap to turn
    2020A           $85 A      $40 A      $73    A     ($282) A       ($85)
    2021E          $162 E $156 E         $159    E      $171 E       $647                          back on. As SNC continues to re-shift the model and the inherent risk
    2022E                                                             $655
    Cons. EPS        Q1         Q2         Q3              Q4      Annual       P/E                reduces with the return to positive cash flow, investors can expect a return
    2019A         $0.34 A ($1.34) A $0.71        A      $0.56 A      $0.28     98.3x
    2020A         $0.15 A ($0.18) A ($0.19)      A     ($1.34) A    ($1.56)   -17.4x               to M&A. Management is expected to roll out a broad strategic plan later this
    2021E         $0.47 E $0.45 E $0.52          E      $0.57 E      $2.00     13.5x
    2022E                                                            $2.21     12.3x               year. Technology was already cited as a key investment and focus area.
    Adjusted EBI TDA ($M)                                                  EV/EBI TDA
    2019A          $137 A     ($89) A    $225    A      $193 A       $465      12.7x               Furthermore, with greater stimulus spending and the U.S. being identified
    2020A          $120 A      $51 A     $103    A     ($245) A        $29    206.1x
    2021E          $174 E $169 E         $183    E      $193 E       $719       8.2x               as a key market, we could see acquisition activity south of the border, along
    2022E                                                             $752      7.8x
    Source: Company reports; Bloomberg; LBS.                                                       with small and medium-size transactions in core U.K. end markets.

   Company Profile                                                                        Stantec Inc. (STN-T)
   Stantec provides professional consulting services in planning,                         Rating: Buy – Target: $56.00; Price: $57.35
   engineering, architecture, interior design, landscape architecture,                    Mona Nazir, Industrials Analyst
   surveying, environmental sciences, project management, and
   project economics for infrastructure and facilities projects. The                      CEO and President, Gord Johnston, joined our panel discussion along with
   company offers its services to public and private sector clients in a                  EVP Water, John Take.
   diverse range of markets. Stantec has 22,000 employees operating
   and more than 380 offices in North America, Europe, Asia, South                                ESG approach and metrics important criteria for all stakeholders.
   America and Africa.                                                                             While a firm’s ESG score and strategy are not a consideration for
                                                                                                   general contractors, for pure-play consulting firms, it is increasingly
   Market and Company Data                                                                         important in project selection and client relationships. Mr. Take
    Ticker
    Rating
                        STN-T
                        Buy
                                                           S hares O/S (M)
                                                           Market Cap (M)
                                                                                 112.4
                                                                                $6,446
                                                                                                   highlighted that, in a client meeting related to a specific water project,
    Risk
    Price
                        Medium
                        $57.35
                                                             Float O/S (M)
                                                           Float Value (M)
                                                                                 111.2
                                                                                $6,376
                                                                                                   more than half of the allotted time was spent on Stantec’s ESG initiative
    1-Yr Target
    Dividend
                        $56.00
                        $0.66
                                                     Avg Daily Volume (K)
                                                      Enterprise Value (M)
                                                                                 273.2
                                                                                $6,842             and evolution. With the company ranked Number 1 in North America by
                                                                                                   Corporate Knights and having a strong ESG rating across multiple rating
    Yield (%)           1.2%
    1-Yr ROR            -1.2%                             Control Blocks:

                                                                                                   agencies, we believe its positioning should yield results in regard to
    52 W k High-Low     $57.44 - $36.60                      Manag & Dir          1.1%
    BVPS                $17.20
    Valuation           11x EV/EBITDA (2022)               Net Debt/Cap           18%
    Year End            31-Dec                            Next Reporting        May-21
                                                                                                   revenue generation and cross-selling opportunities.
    Adjusted EPS (FD)

    2018A
                 Q1
                $0.42   A
                              Q2
                            $0.41    A
                                          Q3
                                         $0.44   A
                                                       Q4
                                                      $0.40   A
                                                                   Annual
                                                                    $1.82
                                                                                 P/E
                                                                                31.6x
                                                                                                  “GDP++” organic growth and continued acquisition activity.
    2019A
    2020A
                $0.45
                $0.49
                        A
                        A
                            $0.50
                            $0.52
                                     A
                                     A
                                         $0.59
                                         $0.62
                                                 A
                                                 A
                                                      $0.47
                                                      $0.60
                                                              A
                                                              A
                                                                    $2.02
                                                                    $2.22
                                                                                28.4x
                                                                                25.8x              Regarding M&A, Stantec continues to target medium-size firms (under
                                                                                                   1,000 employees) with M&A growth easily surpassing organic growth in
    2021E       $0.50   E   $0.54    E   $0.62   E    $0.66   E     $2.33       24.6x
    2022E                                                           $2.71       21.1x

                                                                                                   a given year. Targeted geographies include Canada, the U.S. and the
    Adjusted EBI TDA ($M)
                 Q1         Q2            Q3           Q4          Annual    EV/EBI TDA
    2018A       90.4   A  94.4       A   99.9    A    84.2    A     392.5        17.4x
    2019A
    2020A
               127.1
               139.4
                       A 145.4
                       A 142.5
                                     A
                                     A
                                         159.1
                                         158.2
                                                 A
                                                 A
                                                      142.8
                                                      138.5
                                                              A
                                                              A
                                                                    574.4
                                                                    578.6
                                                                                 11.9x
                                                                                 11.8x
                                                                                                   U.K., as well as Australia and New Zealand (focus on U.S./ U.K.).
    2021E
    2022E
               140.2      141.0      E   148.1   E    152.1   E     581.4
                                                                    604.0
                                                                                 11.8x
                                                                                 11.3x             Organic growth in the historical low single-digit range is expected to
    * Note: Q4/18, F2019 and F2020 are based on continuing operations
    Source: Company reports; Bloomberg; LBS.                                                       increase to “GDP++” supported by strong federal funding initiatives.

APRIL 2021                                                                                    10
Company Profile                                                                     Stella-Jones Inc. (SJ-T)
   Stella-Jones Inc. is a leading North American producer and marketer                 Rating: Buy – Target: $56.50; Price: $50.81
   of treated wood products, specializing in the production of pressure                Mona Nazir, Industrials Analyst
   treated railway ties and timbers, as well as wood poles supplied to
   electrical utilities and telecommunications companies. It also treats               Eric Vachon, CEO and President of SJ, joined us for a fireside chat
   and supplies marine and foundation pilings, construction timbers,                   discussing its end markets, indicators, M&A, and customer relationships.
   highway guardrail posts and treated wood for bridges. Stella-Jones
   operates 34 plants across Canada and the U.S.                                               M&A expected to be key top-line growth driver; US$300-US$400M
                                                                                                in acquisitions. While acquisition growth tempered over the last few
   Market and Company Data                                                                      years, investors can expect significant 15–20% top-line growth from
    Ticker             SJ-T                            Shares O/S (M)          67.2
                                                                                                acquisition activity in the coming years. Greater opportunities exist in
    Rating
    Risk
                       Buy
                       Medium
                                                       Market Cap (M)
                                                         Float O/S (M)
                                                                           $3,413.2
                                                                               67.2             the utility pole side based on the number of potential targets. With the
    Price
    1-Yr Target
                       $50.81
                       $56.50
                                                       Float Value (M)
                                                 Avg Daily Volume (K)
                                                                           $3,413.2
                                                                              136.0             acquisition of Kansas City Southern by CP, there may be an opportunity
    Dividend
    Yield (%)
                       $0.72
                       1.42%
                                                  Enterprise Value (M)
                                                         Net Debt/Cap
                                                                           $4,026.2
                                                                               31%              for SJ to purchase KCS’s standalone tie manufacturing facility. From our
    1-Yr ROR
    52 W k High-Low
                       12.6%
                       $52.27 - $30.32
                                                      Next Reporting
                                                              Year End
                                                                            May-21
                                                                             31-Dec             internal notes SJ has had its eye on this facility for well over 5–7 years.
    BVPS               $20.74
    Valuation          16x P/E (2022)
                                                                                               SJ’s ability to service residential lumber customers during COVID
    Adj. EPS (FD)
                 Q1          Q2           Q3          Q4         Annual       P/E
                                                                                                pandemic should drive growth in 2021 and beyond. Mr. Vachon is
    2018A
    2019A
               $0.33
               $0.43
                       A
                       A
                           $0.69
                           $0.76
                                   A
                                   A
                                         $0.66
                                         $0.78
                                                 A
                                                 A
                                                     $0.30
                                                     $0.41
                                                             A
                                                             A
                                                                  $1.98
                                                                  $2.37
                                                                             25.6x
                                                                             21.4x              anticipating continued growth from residential lumber as a result of the
    2020A
    2021E
               $0.42
               $0.56
                       A
                       E
                           $1.02
                           $1.09
                                   A
                                   E
                                         $1.18
                                         $1.09
                                                 A
                                                 E
                                                     $0.51
                                                     $0.58
                                                             A
                                                             E
                                                                  $3.12
                                                                  $3.32
                                                                             16.3x
                                                                             15.3x              company pulling all strings possible, throughout the last year, to satisfy
    2022E      $0.61   E
    Adjusted EBI TDA ($M)
                           $1.14   E     $1.14   E   $0.62   E    $3.52      14.4x
                                                                                                end customer requests and skyrocketing demand. SJ is witnessing
    2018A
                 Q1
               42.2    A
                           Q2
                          79.5     A
                                          Q3
                                         77.2    A
                                                      Q4
                                                     54.4    A
                                                                 Annual
                                                                  253.3
                                                                          EV/EBI TDA
                                                                             15.9x
                                                                                                volume increases on the utility pole side and overall network safety
    2019A
    2020A
               59.7
               70.2
                       A  95.7
                       A 120.0
                                   A
                                   A
                                         97.5
                                         132.0
                                                 A
                                                 A
                                                     59.5
                                                     70.0
                                                             A
                                                             A
                                                                  312.4
                                                                  392.2
                                                                             12.9x
                                                                             10.3x
                                                                                                should provide support in the tie segment. Furthermore, continued
    2021E
    2022E
               76.8
               81.0
                       E 122.3
                       E 126.1
                                   E
                                   E
                                         121.8
                                         125.3
                                                 E
                                                 E
                                                     76.7
                                                     79.3
                                                             E
                                                             E
                                                                  397.6
                                                                  411.7
                                                                             10.1x
                                                                              9.8x
                                                                                                innovation, including wrapped utility poles and advances on the tie side,
    Source: Company reports; Bloomberg; LBS.                                                    should put organic growth ahead of GDP.

APRIL 2021                                                                                 11
APRIL 2021   12
Company Profile                                                                          5N Plus Inc. (VNP-T)
   Montreal-based 5N Plus Inc. is a fully integrated primary / secondary                    Rating: Buy – Target: $5.50; Price: $4.60
   leading refiner of commercial / ultra-high purity metals and                             Nick Agostino, Diversified Technology Analyst
   compounds used in the pharmaceutical, electronic, industrial and
   solar markets. Its pending AZUR Space acquisition offers epitaxy IP,                     Key takeaways from our fireside chat:
   allowing VNP to grow its TAM to US$1.5-3B, in part by entering the
   Wide Band-Gap Semiconductor market.                                                              Clear targets. VNP expects to see strong organic growth from its Electronic
                                                                                                     Materials (EM) segment, particularly in Aerospace/Satellite, Security, Sensing
   Market and Company Data                                                                           and Imaging. The company’s advent in specialty semiconductors and launch
                                                                                                     of new products (e.g. INZBE3), within the aforementioned sub-segments,
    Ticker
    Rating
                       VNP-T
                       Buy
                                                   Shares-basic O/S (M)
                                                     Shares-FD O/S (M)
                                                                                     88.0
                                                                                     88.7
                                                                                                     should drive 7-10% organic growth while yielding healthy margins with a long-
    Risk
    Price
                       High
                       $4.60
                                                     Market Cap (US$M)
                                                           Float O/S (M)
                                                                                   $322.3
                                                                                     50.2
                                                                                                     term EM EBITDA margin target of 30%+; the Eco-Friendly EBITDA margin
    1-Yr Target        $5.50                       Avg Daily Volume (K)             286.0            target stands at 20%+. VNP’s goal is to become a top player in specialty
    Yield              0.0%                     Enterprise Value (US$M)            $411.1
    1-Yr ROR           19.6%                               Cash (US$M)               $1.3            semiconductors and a leader in specialty pharmaceuticals.
    52 Wk High-Low     $5.01 - $1.25                   Net Debt (US$M)              $88.8

                                                                                                     AZUR timing was ideal. VNP disclosed it had been engaged in
    Valuation          10x 2022 EV/EBITDA                     Ownership
    Year End           Dec. 31                              Manag. & Dir.            3%     
    Next Reporting     May-21                                  Institutional
                                                     Net Debt/Total Cap
                                                                                    52%
                                                                                    37%              negotiations with AZUR for ~2 years and pressed ahead with the
    EPS (FD, US$)                                                                                    acquisition once valuation multiples became more normalized (VNP
    F2019A
               Q1
              $0.00    A
                             Q2
                           $0.03    A
                                         Q3
                                        $0.01    A
                                                      Q4
                                                     $0.01     A
                                                                   Annual
                                                                    $0.06
                                                                                   P/E
                                                                                  65.6x
                                                                                                     paid ~12x EBITDA, in-line with its trading multiple). The company
    F2020A
    F2021E
              $0.01
              $0.04
                       A   $0.04
                           $0.04
                                    A   $0.04
                                        $0.04
                                                 A   $0.02
                                                     $0.04
                                                               A    $0.10
                                                                    $0.16
                                                                                  35.3x
                                                                                  22.2x
                                                                                                     believes the market/potential for epitaxy and wide band-gap
    F2022E                                                          $0.21         17.7x              semiconductors applications is in the early stages and set to thrive.
    EBI TDA (US$ M)
                Q1           Q2           Q3           Q4          Annual      EV/EBI TDA           Moving away from the past. VNP continues to significantly reduce its
    F2019A
                                                                                                     metals exposure, looks to exit certain sub-segments (Catalytic/Extractive
               $5.6    A    $5.9    A    $6.0    A    $4.5     A    $22.0          18.7x
    F2020A     $6.9    A    $7.6    A    $7.7    A    $6.5     A    $28.8          14.3x
    F2021E
    F2022E
               $7.9         $8.0         $9.6         $9.7          $35.2
                                                                    $43.4
                                                                                   11.7x
                                                                                    9.5x             and Industrial) and increase its higher margin specialty offerings — helping
    Source: Company reports; Bloomberg; LBS estimates.                                               close the valuation gap to peers.

   Company Profile                                                                          Alithya Group Inc. (ALYA-T; ALYA-O)
   Montreal-based Alithya Group Inc. offers IT services and consulting                      Rating: Not Rated – Target: N/A; Price: $2.86
   including Microsoft Solutions for ERP, CRM, business analytics and Azure;                Key takeaways from our fireside chat:
   Oracle Cloud Solutions for EPM, ERP, EBS and business analytics, and
   Custom Solutions such as remote digital solutions, and system integration                        Digital transformation leads IT rebound. With a 6.2% rebound in
   and development. Clients cover an array of sectors such as banking,
   insurance, energy, manufacturing, retail, communications, transportation,
                                                                                                     worldwide IT spending forecasted by Gartner for 2021, digital
   professional services, healthcare and government.                                                 transformation is expected to be at the forefront of the recovery,
                                                                                                     following a -3.2% slump in 2020. Trends — including remote work,
   Market and Company Data                                                                           increased need for cybersecurity, big data/analytics and ML/AI — are
                                                                                                     forcing corporations of all sizes to utilize software to enhance internal
    Ticker
    Rating
                        ALYA-T, ALYA-O
                        n/a
                                          Shares-basic O/S (M)
                                            Shares-FD O/S (M)
                                                                                    58.2
                                                                                    58.2
                                                                                                     processes such as ERP, supply chain, HR and the like, yielding growing
    Risk
    Price
                        n/a
                        $2.86
                                            Market Cap (US$M)
                                                  Float O/S (M)
                                                                                  $166.6
                                                                                    37.0
                                                                                                     demand for players such as ALYA.
    1-Yr Target         n/a               Avg Daily Volume (K)                     118.8
    Yield
    1-Yr ROR
                        n/a
                        n/a
                                       Enterprise Value (US$M)
                                                  Cash (US$M)
                                                                                  $229.0
                                                                                    $9.4
                                                                                                    R3D a good fit. With its focus on high-end consulting and digital projects,
    52 W k High-Low     $6.91 - $2.00         Net Debt (US$M)                      $62.5             R3D was the perfect addition to ALYA’s product/service offering. The
    Valuation           n/a                          Ownership
    Year End            Mar-31                     Manag. & Dir.                  36.4%              acquisition brings a minimum guaranteed backlog of $600M over the next
    Next Reporting      Jun-21                       Institutional
                                            Net Debt/Total Cap
                                                                                  40.7%
                                                                                     n/a             10 years: an extremely uncommon but desirable feature in today’s IT
    Sales (US$M)                                                                                     consultancy market. With a combined run-rate of $400M, expected cost
    2019A
              Q1
             $34.0
                            Q2
                        A $33.1
                                       Q3
                                    A $58.2
                                                   Q4
                                                A $72.6
                                                               Annual
                                                             A $197.9
                                                                               EV/Sales
                                                                                 1.2x
                                                                                                     synergies and a healthy EBITDA margin contribution from R3D (12–14%),
    2020A
    2021E
             $72.2
             $70.7
                        A $67.4
                        A $68.4
                                    A $66.3
                                    A $70.6
                                                A $73.2
                                                A
                                                             A $279.0            0.8x
                                                                                                     ALYA views this as a transformative deal.
    EBI TDA (US$M)
                Q1          Q2         Q3          Q4            Annual EV/EBI TDA
                                                                                                    More M&A on the way. ALYA continues to scan the market for industry
    2019A      $1.3     A $2.8      A $0.0      A $1.1       A    $5.2      44.4x                    players failing to reach critical mass and aims to expand its service
    2020A
                                                                                                     offering further through M&A (particularly SAP).
               $2.3     A $2.1      A $2.4      A ($1.0)     A    $5.8      39.8x
    2021E     ($0.0)    A ($2.4)    A ($0.5)    A
    Source: Company reports; LBS estimates

APRIL 2021                                                                                      13
Company Profile                                                                                  Calian Group Ltd. (CGY-T)
   Calian provides products, business services and solutions to a range                             Rating: Buy – Target: $72.50; Price: $58.75
   of government, defense, and commercial customers. The company                                    Nick Agostino, Diversified Technology Analyst
   is segmented into four operating units: Advanced Technologies,
   Health, Learning and IT, offering services in healthcare, defence,                               Key takeaways from our fireside chat:
   training, cybersecurity, aerospace, engineering, and IT. Calian is
   active in M&A and currently has >4,400 employees.                                                        Diversity remains a key strength. CGY continues to see promising
                                                                                                             growth prospects from all four segments, including: (i) opportunities with
   Market and Company Data                                                                                   MDA and 5G rollouts, alongside expansion into the U.S. and Europe in
     Ticker               CGY-T                            Shares-basic O/S (M)             11.3
                                                                                                             Advanced Technologies; (ii) continuing PSP program expansion in the
     Rating               Buy                                Shares-FD O/S (M)              11.5             U.S. and Europe in Health; (iii) pandemic-driven demand from
     Risk
     Price
                          Medium
                          $58.75
                                                                Market Cap ($M)
                                                                    Float O/S (M)
                                                                                          $678.0
                                                                                            11.2             municipalities, provinces, and corporations for Learning solutions, and;
     1-Yr Target
     Dividend
                          $72.50
                          $1.12
                                                           Avg Daily Volume (K)
                                                           Enterprise Value ($M)
                                                                                            25.8
                                                                                          $630.9
                                                                                                             (iv) growth in the Canadian mid-market and cybersecurity opportunities
     1-Yr ROR             25.3%                                         Cash ($M)          $87.1             in IT. We believe the convergence of different business segments in
     52 W k High-Low                                               Net Debt ($M)
                                                                                                             service delivery will further spotlight CGY’s diversity.
                          $71.91-$40.12                                                    -$47.1
     Valuation            12.5x 2022E EBITDA                            Ownership
     Year End             Sept. 30                           Mgmt., Dir. & Insiders         0.9%
     Next Reporting       May-21                                        Institutional
                                                             Net Debt/Total Cap
                                                                                           47.8%
                                                                                          -14.2%
                                                                                                            M&A playbook continues to evolve. CGY continues to remain on the
     Adjusted EPS FD                                                                                         lookout for lucrative M&A opportunities, potentially at a transformative
     2019
                     Q1
                   $0.48 A
                                     Q2
                                $0.49 A
                                                      Q3
                                                $0.54 A
                                                                   Q4
                                                              $0.73 A
                                                                           Annual
                                                                             $2.41
                                                                                           P/E
                                                                                          24.4x
                                                                                                             scale, with ideal target characteristics including: (i) a solid financial track
     2020
     2021E
                   $0.67 A
                   $0.69 A
                                $0.76 A
                                $0.82 E
                                                $0.58 A
                                                $0.78 E
                                                              $0.59 A
                                                              $0.85 E
                                                                             $2.59
                                                                             $2.95
                                                                                          22.7x
                                                                                          19.9x
                                                                                                             record; (ii) a strategic fit with CGY’s vision, and; (iii) a cultural fit. We
     2022E         $0.91 E      $1.05 E         $0.99 E       $1.07 E        $4.03        14.6x              note the company does not have any particular segment preference
     Adj. EBI TDA ($M)
                     Q1              Q2               Q3           Q4      Annual EV/EBI TDA
                                                                                                             when it comes to acquisition plans.
     2019          $5.7 A         $6.6 A         $6.7 A        $8.1 A        $27.1        10.0x
     2020          $8.4 A       $10.2 A          $9.0 A        $9.2 A        $36.8        14.3x             Entry into new customer-led markets. CGY’s continuing geographical
                                                                                                             expansion into Europe and the U.S. is being driven by existing
     2021E         $10.4 A      $12.2 E         $12.6 E       $13.4 E        $48.6        12.0x
     2022E      $13.7 E     $15.7 E       $14.8 E             $16.0 E        $60.1         9.4x
     Source: Company reports; LBS estimates
                                                                                                             customers requesting the company’s expertise in these regions.

   Company Profile                                                                                  CloudMD Software & Services Inc. (DOC-V)
   CloudMD Software & Services Inc. is a Vancouver-based provider                                   Rating: Buy – Target: $5.00; Price: $2.15
   of longitudinal medical services through its network of 14 family,                               Nick Agostino, Diversified Technology Analyst
   specialist and rehabilitation Clinic Services and 2 Pharmacies
   located throughout B.C., Ontario and the U.S. DOC is supported by                                Key takeaways from our healthcare panel discussion:
   a growing digital technology suite encompassing SaaS Digital
   Services and Enterprise Health Solutions.                                                                Patient data monetization could become viable. While DOC
                                                                                                             recognizes the extremely sensitive nature of patient data, the company
   Market and Company Data                                                                                   believes that if the power resides in the hands of the patient and they
                                                                                                             are able to extract value out of the process, this could allow data
    Ticker
    Rating
                          DOC-V
                          Buy
                                                      Shares-basic O/S (M)
                                                        Shares-FD O/S (M)
                                                                                           212.7
                                                                                           238.5
                                                                                                             monetization to become a reality. This could, in turn, lead to better
    Risk
    Price
                          High
                          $2.15
                                                           Market Cap ($M)
                                                              Float O/S (M)
                                                                                         $457.3
                                                                                           202.7
                                                                                                             health outcomes, for instance by providing employers valuable data to
    1-Yr Target
    Yield
                          $5.00
                          0.0%
                                                      Avg Daily Volume (K)
                                                      Enterprise Value ($M)
                                                                                        1,845.1
                                                                                         $434.7
                                                                                                             shape their employee benefits programs.
    1-Yr ROR              132.6%                                  Cash ($M)                $29.1
    52 W k High-Low       $3.25 - $1.68                      Net Debt ($M)                -$22.6            Tech will drive additions to comprehensive care. As DOC continues
    Valuation             7x 2022 EV/Sales                       Ownership
    Year End              Dec-31                        Mgmt., Dir. & Insiders             4.7%              to build a continuity of care model, it is of the view that technological
    Next Reporting        Apr-21                                  Institutional              n/a
                                                        Net Debt/Total Cap                   n/a             improvements will only serve the company better in providing a unified,
    Sales ($M)                                                                                               holistic solution. DOC also highlighted that, following its observations
                                                                                                             from the pandemic, the fragmented healthcare delivery model will
                  Q1            Q2             Q3           Q4          Annual          EV/Sales
    2019A        $1.1     A   $1.1        A   $2.2     A   $2.4     A    $6.8            64.2x
    2020E
    2021E
                 $3.1
                 $9.0
                          A   $2.8
                              $18.8
                                          A   $3.4
                                              $32.1
                                                       A   $5.2
                                                           $32.2
                                                                         $14.4
                                                                         $92.2
                                                                                         30.2x
                                                                                          4.7x               struggle to exist as the balance of power shifts to the patient.
    2022E                                                               $153.8            2.8x

    EBI TDA ($M)                                                                                            Telehealth will become a permanent piece in triaging. DOC believes
    2019A
               Q1
              ($0.9)
                              Q2
                          A ($0.4)
                                              Q3
                                          A ($0.1)
                                                           Q4
                                                       A ($0.3)
                                                                     Annual
                                                                    A ($1.7)
                                                                                     EV/EBI TDA
                                                                                          n/a
                                                                                                             the quick adoption of telehealth will only persist in the long-run, with
    2020E
    2021E
              ($0.9)
              ($0.5)
                          A ($1.0)
                             $0.4
                                          A ($1.4)
                                             $2.0
                                                       A ($1.0)
                                                          $1.8
                                                                      ($4.3)
                                                                       $3.8
                                                                                          n/a
                                                                                        114.8x
                                                                                                             positive virtual experiences for patients only spurring demand for a
    2022E                                                             $13.8              31.5x               hybrid care model, going forward.
    Source: Company reports; LBS estimates

APRIL 2021                                                                                              14
You can also read