NSW Smash Repair Review - February 2014
←
→
Page content transcription
If your browser does not render page correctly, please read the page content below
NSW Smash Repair
Review

February 2014
NSW Smash Repair Review
Contents
Glossary ..................................................................................................................................... i
Executive Summary.................................................................................................................... i
1 Introduction .................................................................................................................... 1
2 Defining the smash repair industry .................................................................................. 3
2.1 Industry participants ......................................................................................................... 3
2.2 Variety of business models ................................................................................................ 4
2.3 Products ........................................................................................................................... 5
2.4 Markets ............................................................................................................................ 5
3 Economic relationships and incentives ............................................................................ 7
4 Trends in smash repairs ................................................................................................ 15
4.1 Demand and supply of smash repairs .............................................................................. 15
4.2 The state of play in smash repairs ................................................................................... 22
4.3 International comparisons .............................................................................................. 25
4.4 The repairer of the future ............................................................................................... 26
5 Motor vehicle insurance market.................................................................................... 29
5.1 Price competition............................................................................................................ 29
5.2 Market concentration ..................................................................................................... 33
5.3 Barriers to entry .............................................................................................................. 34
5.4 Availability of substitutes ................................................................................................ 35
5.5 Dynamic characteristics................................................................................................... 35
5.6 Vertical integration ......................................................................................................... 36
5.7 Implications for consumers ............................................................................................. 36
6 Legislation of insurer/repairer relationships .................................................................. 38
6.1 The legislation................................................................................................................. 38
6.2 The economic impact of the legislation ........................................................................... 39
Conclusions............................................................................................................................. 46
References .............................................................................................................................. 47
Limitation of our work ............................................................................................................... 50
Charts
Chart 4.1 : Significance of issues .............................................................................................. 15
Chart 4.2 : Fatal accidents rates, selected states ..................................................................... 16
Liability limited by a scheme approved under Professional Standards Legislation.
Deloitte refers to one or more of Deloitte Touche Tohmatsu Limited, a UK private company limited by guarantee, and its networ k
of member firms, each of which is a legally separate and independent entity.
Please see www.deloitte.com/au/about for a detailed description of the legal structure of Deloitte Touche Tohmatsu Limited and
its member firms.
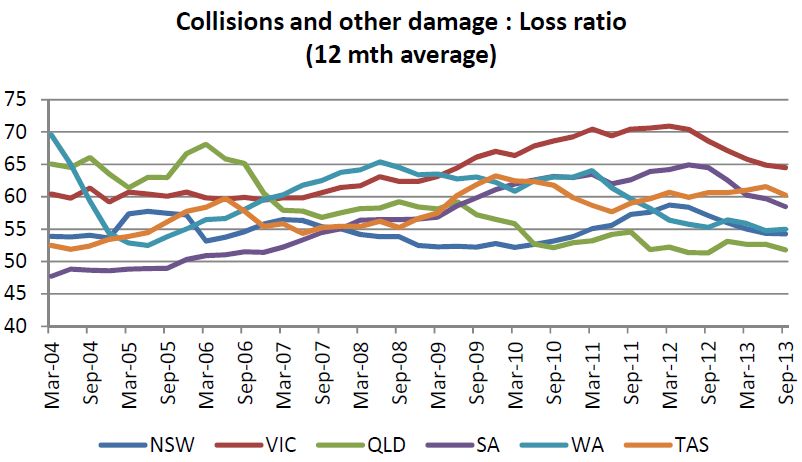
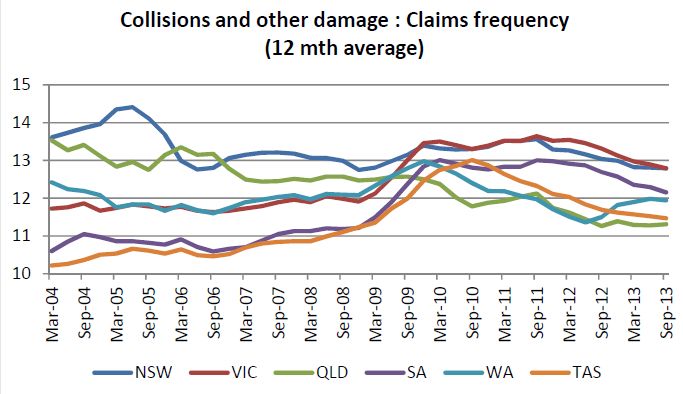
© 2014 Deloitte Access Economics Pty LtdChart 4.3 : Evolution of the smash repair sector ...................................................................... 27 Chart 5.1 : Average comprehensive motor vehicle premiums, 2004-2013 ............................... 30 Chart 5.2 : Premium affordability (average premium/AWOTE), 2004-2013 .............................. 30 Chart 5.3 : Components of cost per policy, NSW, 2004-2013 ................................................... 31 Chart 5.4 : Average claim size, collisions (12 month average), 2004-2013 ................................ 32 Chart 5.5 Claim frequency, collisions (12 month average), 2004-2013 ..................................... 32 Chart 5.6 : Loss ratio, collisions (12 month average), 2004-2013 ............................................. 33 Tables Table 3.2 : Incentives under recommendation and decision .................................................... 10 Table 4.2 : Revenue and wages ............................................................................................... 24 Figures Figure 2.1 : Smash repair relationships ...................................................................................... 4 Figure 2.2 : Sub-markets within the smash repair industry ........................................................ 6 Figure 3.1 : Typical smash repair flow of services ...................................................................... 7 Figure 3.2 : Typical decision process in PSR model ..................................................................... 9 Figure 3.3 : Typical decision process in choice model .............................................................. 10 Figure 3.4 : Decision tree – insurer recommendation model ................................................... 12 Figure 4.1 : New smash repair models ..................................................................................... 21 Figure 4.2 : Employment in the smash repair industry ............................................................. 22 Figure 4.3 : Distribution of smash repair establishment locations ............................................ 23 Figure 4.4 : Industry value added ............................................................................................ 25 Figure 6.1 Choice of repairer –quotes from selected product disclosure statements ............... 41
NSW Smash Repair Review

Glossary

ABR                         Automotive Business Research
ACCC                        Australian Competition and Consumer Commission
AMO                         Automotive Management Online
APRA                        Australian Prudential Regulation Authority
CPI                         Consumer Price Index
DAE                         Deloitte Access Economics
DRP                         Direct Repair Program
HVLI                        High volume, low impact
ICA                         Insurance Council of Australia
ISA                         Insurance Statistics Australia
OECD                        Organisation for Economic Cooperation and Development
OEM                         Original equipment manufacturer
OFT                         Office of Fair Trading
PC                          Productivity Commission
PSR                         Preferred smash repairer
SMART                       Small- to medium-area repair techniques

Deloitte Access Economics
Executive Summary
       The smash repair industry in NSW has been experiencing significant change in recent years.
       The ultimate beneficiaries of these changes are consumers. Most consumers do not use
       smash repair services often enough to develop sufficient expertise to distinguish the most
       appropriate repairer for their needs. As such, the market is characterised by consumers
       who are not well informed.

       Insurers’ active role in the consumer decision making process is an effective way of
       ensuring that quality smash repair services are provided efficiently. Given the extent of the
       changes to the industry, however, the government has commissioned the Inquiry into
       Motor Vehicle Repairer and Insurer Relationship.

       The Insurance Council of Australia (ICA) has commissioned Deloitte Access Economics (DAE)
       to prepare an independent research report examining some of the issues raised through
       the Inquiry’s Terms of Reference.

       Main trends driving smash repairers
       The smash repair industry is undergoing consolidation. Historically, it has taken the form of
       a “cottage industry”, comprised of disaggregated, small general repair shops. This has
       begun to change as a result of competition within the industry. Production line style large
       high-volume repair shops, complemented by small-medium specialist repairers, are
       outcompeting traditional repairers.

       Many of these changes are being driven and facilitated by new technologies. Demand has
       decreased, as safer cars require fewer repairs. On the other hand, more complex cars (e.g.
       electronics), require more complex (expensive) equipment and higher-skilled workers to
       repair. Technology has also led to the development of new repair techniques and business
       models.

       Similar trends have been seen overseas. The UK, for example, is a leading indicator.
       Consolidation and technology have led to more efficient repairers with new models. The
       Australian industry is likely to follow the same path.

       Consumers will benefit from these trends through lower prices for repairs. As the process
       of consolidation continues, there will be some reduction in information asymmetries, as it
       will be easier to assess quality in a less fragmented market.

       Technology and competition has raised barriers to entry for some small smash repairers,
       who need increasing amounts of capital and scale to compete. However this is an inevitable
       process seen in many industries (e.g. manufacturing). Business models will continue to
       evolve, and more efficient repairers will thrive. There will be a continued role for flexible,
       high quality repairers.

       Insurance
       There are four main motor vehicle insurers operating in the NSW market. They support a
       variety of brands and business models. To account for information asymmetries in the
Deloitte Access Economics                                                                           i
market, insurers and car manufacturers are taking an active role in customer decision
making. This involves:
managing the repair more closely;
providing customers with information about repairers; and
checking and/or guaranteeing the quality of repairs.
In their role as information brokers, insurers offer varying degrees of advice and
information. Repairers who value their reputations highly have an incentive to undertake
high quality repairs. Insurers develop long-term understandings of the quality of repairers,
and advise consumers accordingly. Consumers may decide on the extent to which they
choose to follow this advice.
This has had significant benefits for consumers by partially solving the information problem
for uninformed customers. Insurance prices decrease as scale allows insurers to negotiate
more favourable terms. Consumers who decide not to follow the advice of their insurer still
can ask the insurer to consider a non-preferred repairer. Depending on the policy, insurers
may accept this alternative subject to the completeness and competitiveness of the quote.
These models reinforce consolidation in the smash repair industry, as preferred repairers
secure higher volumes of work from insurers. However, some repairers choose to remain
unaligned to PSR schemes, and continue to maintain strong businesses.
Legislation of insurer/repairer relationships
Some international jurisdictions have introduced legislation to govern relationships
between insurers and repairers. These are aimed at addressing perceived abuse of power in
relationships by levelling the playing field between the insurance industry and small, locally
owned shops.
The mandatory Industry Code of Conduct in NSW already addresses many of these
concerns. For example, insurers are required to offer policyholders the ability to choose a
non-preferred repairer, subject to certain caveats. The PSR system means that repairers
compete and have reputational concerns, so that insurer intervention helps to mitigate the
information asymmetry. Innovation in the smash repair industry appears to be driven in
Australia by insurers competing for customers by driving change in the repair industry. This
is to the ultimate benefit of consumers, increasing efficiency in the industry.
There is evidence to suggest that legislation similar to that introduced overseas would not
be best suited to the NSW context. Enforcing consumer choice increases search costs for
customers. It does not address information problem. By forcing uninformed consumers to
choose problems may be exacerbated. Consumers may be guided instead by market
participants who have no reputational concerns or undeclared financial interests.
By reducing insurers’ influence over repair costs and quality, it can result in increased
premiums. Evidence from the UK shows that removing insurers’ ability to contain costs by
using preferred repairers increases premium prices. In Germany, a survey found that
reputation, technical competence and competition reduced the likelihood that repairers
would overcharge.
Deloitte Access Economics iiConclusions
Consumers benefit from a well-functioning industry where they can meet their preferences
for choice or convenience and certainty. Those who prefer the latter are well served by the
role insurers play in helping them to navigate the smash repair system. An Australia-wide
survey undertaken by Newspoll Market & Social Research in 2013 found that 69% of drivers
preferred their insurer to handle their claim from end to end, including managing the repair
and working with the smash repairer on their behalf (Suncorp).
Industry consolidation in the smash repair industry is inevitable. However, this is being
driven by competition between repairers and technology, rather than pressure from
insurers. Relationships between insurers and repairers are well governed by the Industry
Code of Conduct and it does not appear that further regulation would benefit consumers.
Deloitte Access Economics
Deloitte Access Economics iiiNSW Smash Repair Review
1 Introduction
The smash repair industry has undergone a series of changes in recent years. This change is
challenging to the industry, but has arisen naturally. New repair technologies allow more
efficient small- and medium- area repairs, but require significant capital investment. Newer
vehicles have fewer collisions yet, with more complex electronics components, require
different and deeper skills within the workforce. These are the primary factors driving
consolidation in the industry; competitive pressures on less efficient and smaller repair
shops are increasing.
Competitive markets find solutions to these challenges. In the smash repair industry,
however, the ability of the market to solve these problems is impacted by information
asymmetries. Consumers must be able to make informed decisions to ensure the effective
operation of the market.
There can be significant variation in the price and quality of repairs. While prices are
observable, it is difficult for consumers to identify and assess variations in quality due to a
lack of technical expertise. For consumers, this variation combined with the infrequent
nature of interaction with repairers, means consumers generally are not able to make
informed decisions, unlike for most other purchases they make. This can result in
suboptimal outcomes for consumers.
The market has evolved a method of dealing with this. In response to consumer demand,
insurers have developed a role as information brokers, becoming more active in the
consumer decision making process. This helps to mitigate information asymmetries.
Insurers and repairers are developing business relationships and partnerships which
harness potential gains from these developments. For example, some repairers have
contractual arrangements with insurers which guarantee higher volumes of work in return
for containing repair costs.
However, not all stakeholders are comfortable with the impacts of the trends in smash
repairs and, hence, there has been an increase in regulatory focus on the industry, in NSW
and Australia and overseas. In Australia, following a 2005 Productivity Commission report, a
voluntary industry code of conduct was implemented. It was made mandatory and
incorporated into legislation in NSW (sections 51-53 Fair Trading Act 1987).
Around the world legislators are seeking to protect consumer interests and promote
competition. However, this should be considered in context. As the OECD notes:
“There is broad agreement among competition agencies from OECD countries
that the purpose of competition policy is to protect competition, not
competitors”
- OECD 2011
Deloitte Access Economics 1NSW Smash Repair Review
The NSW Government is now re-considering the issue. It has commissioned the Inquiry into
Motor Vehicle Repairer and Insurer Relationship. The terms of reference for the Inquiry are
broad:
smash repair work and whether it is being carried out to adequate safety and quality
standards;
the current Motor Vehicle Insurance and Repair Industry Code of Conduct, its
governance structure and dispute resolution mechanisms and whether it is effective at
regulating the relationship between repairers and insurers, and in serving consumer
interests;
consumer choice, consumer protection and consumer knowledge in respect of
contracts and repairs under insurance policies;
the business practices of insurers and repairers, including vertical integration in the
market, the transparency of those business practices and implications for consumers;
and
alternative models of regulation, including in other jurisdictions.
The Insurance Council of Australia (ICA) has commissioned Deloitte Access Economics (DAE)
to prepare an independent research report examining the last two of these issues, focusing
on the economics and aspects of the regulation of the smash repair industry.
The analysis of the economics draws upon publicly available information, including Smash
Repair Industry (DAE, 2011) and the IBISWorld Industry Report into Motor Vehicle Body,
Paint and Interior Repair in Australia (IBISWorld, 2013), as well as industry information
provided by the ICA. The discussion of smash repair industry regulation was informed by an
extensive on-line search of relevant legislation and academic literature, and insights from
industry practitioners.
The report proceeds as follows:
Chapter 2 provides background on the smash repair industry, describing the constituent
players and their relationships to one another, the products and the markets.
Chapter 3 presents a summary of the key trends affecting smash repairers today and into
the future.
Chapter 4 examines the motor vehicle insurance industry. Competition in the industry is
assessed against standard benchmarks.
Chapter 5 explores the key decisions that are made by smash repairers and insurers that
affect consumer welfare.
Chapter 6 assesses efforts of legislators to secure better outcomes for consumers and
supporting competition.
Deloitte Access Economics 2NSW Smash Repair Review
2 Defining the smash repair industry
The smash repair industry is characterised by a complex value chain. Services are provided
to customers by various players, who are connected through a network of relationships.
The smash repair industry can be defined in terms of its participants, products and markets.
2.1 Industry participants
A diverse range of players are involved in the smash repair industry. They perform a range
of roles – they may participate directly in the value chain, influence consumer decisions, or
do both. They are described below:
Repairer – an enterprise, mostly a single establishment at one location that repairs
damage or upgrades, to the body, mechanical and electrical systems. Repairers may
receive up to 80% of their business from insurer referrals, but also from other sources
including tow-truck operators, mechanics, car manufacturers and dealers and by word
of mouth.
Insurer – a general motor vehicle insurer. Funds repairs depending on the coverage
purchased by a consumer. They may operate under different business models.
• In a “preferred smash repairer” (PSR) model, the consumer has limited choice
of repairer. The insurance company recommends a local repairer who has a
pre-existing relationship with the insurer, although the consumer can
nominate other repairers also to quote for the work.
• The alternative model is “user choice”. This allows consumers to choose any
repairer to quote. If they are uncertain or ambivalent, the insurer may
recommend a specific repairer.
In both cases, the insurer authorises the most complete and competitive quote.
Vehicle manufacturer. Some manufacturers have PSR arrangements, similar to those
offered by insurers. They may dis-incentivise the use of repairers that do not use parts
supplied by the original equipment manufacturer (OEM) through the use of warranty
conditions. For example, car warranties or other guarantees might be voided if a non-
OEM part fitted after manufacture fails. Where ‘authorised repairers’ are not part of an
insurer’s PSR network, conflicts over insurance and repair could result. These
arrangements are most common for premium car marques.
Parts supplier. Spare parts frequently are required for smash repairs. Suppliers may
offer different types of parts – those from the OEM, or after-market crash parts. This
depends on the supplier’s relationship with the manufacturer. The type of parts that
are used can be determined by the repairer or specified by the insurer.
Tow truck operator. Where the vehicle has been significantly damaged, a tow truck will
take the vehicle to a repairer. Tow truck operations tend to have established
relationships with certain smash repairers. Thus the choice of tow truck operator can
determine the ultimate repairer.
Deloitte Access Economics 3NSW Smash Repair Review
The relationships between these players is summarised in the diagram below. The lines
indicate where commercial relationship can exist between the two parties. Uniquely, the
smash repairers may have relationships with any one of the other stakeholders groups.
Figure 2.1: Smash repair relationships
Insurer
Parts
Consumer
supplier
Smash
repairer
Tow truck Vehicle
operator manufacturer
Car
retailer
Source: Deloitte Access Economics 2011
2.2 Variety of business models
As noted in section 1, insurers have evolved as information brokers within the smash repair
industry. Repeated interactions with repairers allow them to dynamically assess the value
offered by various repairers, both in terms of price and quality of service.
Section 3 explains that insurers are the primary consumers of smash repair services. They
have developed multiple types of purchasing arrangements with their suppliers. These
range from one-off interactions to long-term contractual relationships and equity
involvement. Some operate open tenders, while others direct work to preferred
contractors.
Similarly, the variety of models within the smash repair industry has increased significantly
in recent years. Technology, competition and new relationship structures have facilitated
this process. They now take a number of different forms, including:
High-volume low-impact repairers;
Traditional repairers; and
Premium marque repairers.
These are described in more detail in later sections.
Deloitte Access Economics 4NSW Smash Repair Review
Repairer relationships with insurers vary – some have no ongoing relationships, while
others have relationships with more than one insurer.
2.3 Products
The smash repair industry in Australia is mainly comprised of small privately-owned
businesses. The main services provided are post-collision repair of motor vehicles,
although repairers also upgrade undamaged motor vehicles. Smash repair activity breaks
down into the primary activities of the industry (IBISWorld, 2013):
vehicle body repairing, including panel beating (52.2% of industry value);
automotive spray painting (20.6%);
windscreen repair (14.5%);
automotive trimming and interior repair (9.6%); and
other services, including rustproofing and undercoating (1.4%).
2.4 Markets
The Australian and state markets can be broken down as shown in Figure 2.2:
urban repair shops face a different set of consolidating forces compared to regional
smash repairers, due to the proximity of competition;
within these markets, there is a division between the premium car repairers and those
which service all other cars. Premium repairers tend to specialise in a particular
premium marque and, as such, cannot be substituted by general repairers; and
these general repairers can also be broken down into major and minor damage sectors.
Some businesses specialise in repairing a higher volume of vehicles requiring relatively
minor repair – known as high volume, low impact or (HVLI) – compared to the other
end of the spectrum where high-value repairs require both more skilled labour and
specialised equipment.
Deloitte Access Economics 5NSW Smash Repair Review
Figure 2.2: Sub-markets within the smash repair industry
All smash
repairers
Urban Regional
Premium Other
cars cars
Major Minor
repairs repairs
Source: Deloitte Access Economics.
Deloitte Access Economics 6NSW Smash Repair Review
3 Economic relationships and
incentives
The process of repairing a damaged vehicle can be best understood as a value chain.
Assuming that an individual is insured, it evolves as follows:
Figure 3.1: Typical smash repair flow of services
Repairer Insurer Consumer
Source: DAE
In this simplified view, repairers are the ultimate suppliers. They produce repair services
using their labour, skills, capital and purchased parts. Insurers purchase these services on
behalf of their customers. They are well-informed buyers, who regularly interact with
repairers. Where allowed, they will select their suppliers on the basis of price and quality.
Insurers, in turn, supply insurance services to consumers. These services take different
forms. For instance, the level of coverage and choice can vary between products.
Consumers buy these insurance products. This will be informed by preferences, price,
reputation etc.
Chapters 3 and 5 show that the smash repair and insurance industries are both competitive.
Competitive industries increase consumer welfare by reducing prices and/or increasing the
value of services. Thus, as long as the structure of the system allows for appropriate
decision making, there will be benefits for consumers.
Effective decision making within the structure of the industry relies on three elements:
the incentives of players;
the decision making process; and
the flow of information.
For simplicity, assume that consumers buy insurance. Each of the key parties acts in their
self-interest:
consumers have short-sighted preferences. They do not perceive the cost of the repair,
because they do not directly pay for it. As such, insured consumers have an incentive to
secure the best possible repair, regardless of price.
insurers have a profit motive. This creates conflicting incentives:
• decrease costs. This could involve accepting only repairers who offer low
prices.
• increase revenues. Retaining and attracting market share requires a strong
reputation, amongst other factors. This provides incentive to only accept high
quality repairs.
Deloitte Access Economics 7NSW Smash Repair Review
smash repairers have a profit motive. This creates conflicting incentives:
• decrease costs. This could be achieved through increasing efficiency or
“cutting corners”.
• increase revenues. Individual repairers can improve revenue by increasing the
quantity of service. Attracting more business from insurers requires an
attractive offering in terms of price and quality of repair.
• manage liability. Repairers are liable for faulty repairs under the Australian
Consumer Law (Commonwealth, 2010). This can be costly. As such repairers
have an incentive to ensure that services are carried out with “due care and
skill”.
Each party will make decisions based on these incentives. The strength of these incentives
will vary depending on the structure of the system and business models. For example, in
PSR business models, some insurers have introduced a guarantee on repairs in order to
increase their market share. This introduces an additional incentive for insurers to manage
their liability.
As noted in section 2, the structure of the market can take two forms, depending on
whether the consumer:
follows the insurer’s recommendation; or
decides to make their own choice.
The structure of decision making under each of these models is summarised below.
Deloitte Access Economics 8NSW Smash Repair Review
Figure 3.2: Typical decision process in PSR model
1. Consumer decides whether to be insured
2. Consumer chooses an insurer
3. Smash occurs
4. Consumer decides whether or not to claim on their insurance
5. Insurer assesses vehicle
6. Repairers are asked to tender on fixing the faults identified in the
assessment
7. Insurer selects a repairer
8. Repairer assesses the damage (may not concur with the insurer)
a. If they do not agree, repairer may negotiate a change in scope with
the insurer
9. Repairer conducts the repair
10. Consumer receives the repaired vehicle
a. If faults re-appear, consumer may contact either the repairer or
insurer
11. Repeat
Source: DAE
Deloitte Access Economics 9NSW Smash Repair Review
Figure 3.3: Typical decision process in choice model
1. Consumer decides whether to be insured
2. Consumer chooses an insurer
3. Smash occurs
4. Consumer decides whether or not to claim on their insurance
5. Insurer assesses vehicle
6. Consumer identifies their preferred repairers, and obtains quotations
7. Insurer selects a repairer from amongst these, or requests additional
quotations
8. Repairer assesses the damage (may not concur with the insurer)
a. If they do not agree, repairer may negotiate a change in scope with
the insurer
9. Repairer conducts the repair
10. Consumer receives the repaired vehicle
a. If faults re-appear, consumer contacts repairer
11. Repeat
Source: DAE
The key difference between the two models is step 6 – who makes the decision on which
repairer should be used. This difference also changes the incentives for players. These are
summarised in Table 3.2.
Table 3.2: Incentives under recommendation and decision
Insurer recommendation Consumer decision
Stronger reputation incentive to
ensure high quality repairs
(consumers associate insurer Reputation incentive is
Insurer with repair) comparatively weaker, since
Introduction of an additional consumer decides on repairer.
incentive to ensure high quality
through voluntary guarantees
Reputation develops slowly,
Reputation develops quickly, as
as most customers do not get
repairers deal repeatedly with
repairs often
Repairer insurer
Less incentive to compete on
Incentive to price more
price, since tendering is less
competitively
open
Source: DAE
Deloitte Access Economics 10NSW Smash Repair Review
These differences in incentives can significantly alter outcomes for customers. Under a
consumer decision option, for example, Schneider (2012) tested several repair shops. Even
when he posed as a potential repeat customer, he found that repairers did not care about
their reputations:
“I find no evidence, however, that a mechanic’s pursuit of a good reputation
affects repair recommendations, improves service quality, or limits
inefficiencies in a meaningful way”
- Schneider, 2012
The consequences of this for consumer benefits – as well as the industry overall – were
severe:
“I find that completely unnecessary repairs were present in 27 per cent of visits
and represented 61 per cent of all charges. I also find that serious under-
treatment occurred in 77 per cent of visits, and that defects that could
generate much larger problems in the future were often overlooked… During
both high and low-reputation visits, the quality of diagnoses was often poor,
and the type and amount of repairs were highly inconsistent... a back-of-the-
envelope calculation [shows] that agency problems in the U.S. auto-repair
market generate a welfare loss of approximately… 22 per cent of industry
revenue”
- Schneider, 2012 [emphasis added]
As discussed previously, a majority of NSW consumers select an insurer recommendation
type of process. This is preferred due to information asymmetries. Most consumers are ill-
equipped to distinguish between repairers. They prefer the convenience and assurance of
having their insurer do this on their behalf.
The remainder of this chapter considers key decisions and incentives under the insurer
recommendation model, given its relative importance.
Deloitte Access Economics 11NSW Smash Repair Review
Figure 3.4: Decision tree – insurer recommendation model
C
Choose insurer
N
Crash
I
Assess right Assess wrong
R R
Agree Disagree Assess correctly Agree
R R R R
Disagree Disagree
R R
Raise w insurer Raise w insurer
Find new repairer Find new repairer Nothing
Repair Repair happens
I I
Reject Accept Accept Reject
R R R R
Cancel Continue Repair Repair Continue Cancel
R I R R I R
HQ LQ HQ LQ HQ LQ HQ LQ
C C C C C C C C
C
C
Choose insurer
Source: DAE, 2013
Figure 3.4 depicts the decision tree in more detail. It shows that there are several ways that
the process can unfold. However, there are three areas where the relationship between the
insurer and repairer are critical which should be examined in more depth.
Accurate assessments
Under an insurer recommendation model, insurers have more incentive to assess a repair
correctly. Incorrect assessments could lead to unexpected increases in costs in the short
term, as – if an insurer accepts the repairer’s contention – they may be required to pay the
repairer an additional amount to fix the undiagnosed damage. There are long-term
consequences if insurers do not adjust incorrect assessments as necessary. Consumers who
experience faulty repairs will apportion at least some blame to the insurer who authorised
Deloitte Access Economics 12NSW Smash Repair Review
and organised it. This negatively impacts on the insurer’s reputation. As such, insurers have
incentives to accurately assess damage.
Liability and reputational concerns under the PSR model mean that repairers have the
incentive to correctly assess damage. Given that insurers regularly interact with repairers, it
is likely that incorrect assessments will be detected. This may result in loss of PSR status,
and thus loss of revenue.
Given that both repairers and insurers have incentive to assess the correctly, this is likely to
be the most common outcome.
Incentive for quality
Outcomes for consumers are ultimately dependent on whether repairers choose to conduct
the repair to an acceptable standard. Once a vehicle is repaired, it is generally returned to
the consumer. As such, insurers cannot directly monitor the quality of repairs. Consumers
do not have the expertise to assess a repair immediately.
Sub-standard repairs will result in faults in the vehicle in the medium term. Thus, they will
eventually be detected by consumers and insurers. Sub-standard repairs would have a
negative impact on the reputation of the insurer. Where insurers offer guarantees on
repairs, it could also result in additional costs. For these reasons, insurers will remove sub-
standard repairers from their PSR network as they are identified.
This will result in a significant loss of revenue for a repairer. The insurer recommendation
model acts as an accreditation system. By creating long-term repeated interactions
between insurers and repairers, it makes reputation a more important concern for
repairers. Compounded with liability concerns, this means that, in a long-term repeated
game, repairers always have an incentive to complete repairs to an appropriate standard.
Differing assessments
As noted above, both repairers and insurers have incentive to assess vehicles correctly
under the insurer recommendation model. However, situations may arise where an insurer
mistakenly does not identify the full extent of the damage.
If this is picked up by the repairer, they may go back to the insurer with a revised quotation.
The insurer can choose to accept the revision or adhere to their initial assessment.
Again, the repeated nature of interactions helps to re-align incentives between parties. In a
single interaction, an insurer would fear that the repairer was over-diagnosing in a bid to
secure additional revenue. This would lead the insurer to reject the repairer’s claim.
However, the insurer recommendation model helps to alleviate this problem. Guarantees
and reputational concerns mean that insurers have an incentive to maintain quality.
Further, they can assume that the repairer also cares about their reputation, and as such
has less incentive to over-diagnose.
This will lead to co-operative outcomes that improve consumer welfare. Insurers have
reason to re-assess the vehicle or trust their preferred repairers in the short term. If
assessments continue to differ, the insurer will look to the quality of their own
assessments. As noted above, they are incentivised to ensure that this is correct.
Deloitte Access Economics 13NSW Smash Repair Review
Consumers as the ultimate feedback loop
The current structure of the motor vehicle insurance industry in NSW means that consumer
choice of insurer provides an important counterbalance. Assuming that a consumer has
chosen to be insured, their selection of repairer will be based on price and reputation.
Reputation could be developed through word-of-mouth or personal experience. If
consumers feel that insurer-authorised repairs are not of an appropriate standard, they will
select a different insurer in future, with yearly insurance renewals making switching easy.
Quality of repair has emerged as a point of competition between insurers. This is
demonstrated through some insurers voluntarily introducing guarantees on all repairs
conducted by their PSRs. This shows how consumer preferences have shaped the
development of insurance products under PSR models. Insurers face implicit and explicit
costs if their suppliers (the repairers) do not perform. Competition between insurers for
customers means that the incentives of all players are more closely aligned to the needs of
customers.
Deloitte Access Economics 14NSW Smash Repair Review
4 Trends in smash repairs
This section looks at the factors impacting the supply of and demand for smash repairs and
what they reveal about the likely future of smash repair and the impact on consumers.
Briefly, they are automobile technology and safety, regulation and financial and economic
considerations.
The factors relevant to present and future operations of the Australian smash repair
industry are summarised Chart 4.1 (Automotive Business Research (ABR) 2011). Compiled
from a survey of 36 smash repair businesses in Sydney, Brisbane and Melbourne, the key
factors that affect repair businesses production (i.e. volume of repairs) and range of
services are positioned according to their importance – the further away from an axis, the
more important they are. Consequently, while skill shortages have a large impact on
production levels, they have a moderate impact on the range of services provided. Overall,
issues with insurers and vehicle manufacturers, and parts suppliers entering and exiting the
market were judged the most significant issues by the smash repairers in the survey. These
issues are explored in greater depth in the remainder of the report.
Chart 4.1: Significance of issues
Production level Skills shortages Insurer issues
Government policies Suppliers enter/exit market
Vehicle manufacturers
Economy Regulation
Industry over/under capacity Write-offs
Road traffic Accident frequency
Vehicle safety
Age of vehicle fleet
Levels of vehicle Interest rates
ownership Green issues/environment
Fuel prices
Range of services
Source: ABR, 2011
4.1 Demand and supply of smash repairs
4.1.1 Automobile technology and safety
Demand for smash repairs is directly related to the number of motor vehicle crashes on
roads. Improvements in driver safety through policing, education and improvements of the
safety of road have led to a decline in the number of crashes.
Deloitte Access Economics 15NSW Smash Repair Review
Bureau of Infrastructure, Transport and Regional Economics data shows that the rate of
fatal accidents (as an indicator for the overall rate of accidents) has decreased by 50% or
more in recent decades, as shown in Chart 4.2. Official estimates of the number of crashes
of all types are not available, but incidents requiring repairs are believed to be on a similar
path, although with a smaller decrease.
Chart 4.2: Fatal accidents rates, selected states
0.18
0.16
Fatal accidents per 1,000 residents
0.14
0.12
0.10
0.08
0.06
0.04
0.02
0.00
1990
2013
1989
1991
1992
1993
1994
1995
1996
1997
1998
1999
2000
2001
2002
2003
2004
2005
2006
2007
2008
2009
2010
2011
2012
NSW VIC QLD
Source: BITRE, 2013
Over the last twenty years improvements in construction and materials used in cars have
changed significantly. Critically, the safety rating of cars has been increased through the use
of high-strength steel. Modern cars also sacrifice structure in a collision to protect
occupants. The development of technology to prevent crashes including anti-locking
braking systems, electronic stability control and automatic braking has also been
introduced. Taken together, these technologies have reduced both the likelihood of
collision and the severity of collisions that do occur, both of which have associated
implications for the smash repair industry.
Technology has also mitigated the risk and effect of minor-impact collisions. Modern
vehicles can include parking sensors which warn the driver when approaching an object,
thus reducing the likelihood and severity of low-speed collisions which would have
otherwise created demand for minor repairs.
Other factors that have driven down demand for smash repairs include the superior
technology and declining cost of newer cars which have increased the propensity of
individuals to simply write off cars following a major collision. Modular construction now
also allows some parts to be replaced completely in lieu of repairs.
Deloitte Access Economics 16NSW Smash Repair Review
The development of hybrid and electric cars is unlikely to impact the smash repair market
significantly. Their cost has so far prevented mass market sales, as evidence by lower than
expected demand for hybrid vehicles (DAE, 2011). While electric cars are different from
fuel based vehicles, electric car designs tend to protect the battery pack and electric motor
from collisions and are therefore unlikely to be damaged in low-impact collisions. The
electric components of such cars have therefore not increased to the cost of repair.
Since the GFC, consumer confidence has increased, resulting in more frequent car
purchases – new car sales have reached new highs, peaking at 96,450 vehicles sold in Nov
2012 – which has in turn caused the average age of the Australian car fleet to decline over
time. Newer cars require fewer repairs to maintain them and are safer to drive.
Going against the trend towards fewer smashes, in terms of demographics, individuals most
likely to be involved in car accidents are aged 18-25 years, are less experienced, and often
probationary, motorists. Over the past five years, there has been an increase in the
population of these risky drivers, which should have contributed to an increase in the
likelihood of motoring accidents.
4.1.2 Business models, repair types and techniques
The smash repair industry is moving away from general smash repair services provided by
businesses that could undertake repairs on most vehicles towards an industry with large,
specialised repairers. This is driven by the need for greater capital and skilled labour to
repair vehicles as a direct result of the increasingly advanced technology – notably
electronic systems - used in cars. This is likely to accelerate industry consolidation and drive
differentiation between the remaining repair businesses.
As a result of these developments, the market is moving towards two types of businesses;
the factory shop businesses which conduct a high volume of low value repairs, and the
specialist shop businesses which focus on high value structural or marquee repairs. These
business models are placing competitive pressure on general repair shops in major
population centres to increase efficiency or specialisation.
4.1.2.1 Minor repairs
The distribution of car accidents itself affects the minor repair business. A majority of car
accidents occur at low speed and are caused by misjudgement. For example,
approximately 25% of all car accidents occur in car parks. The minor repairs resulting from
such accidents do not require significant technology and represent the damage from over
80% of car accidents (DAE, 2011).
These repairs are ideally dealt with using HVLI facilities. These facilities focus on minimising
cycle time and wastage and avoid capital and/or labour intensive repairs. Instead, they
generate profit through a high volume, low margin strategy. These facilities are able to
achieve economies of scale through the use of larger factory style workshops, located in
metropolitan areas.
The number of HVLI shops is growing nationally. These shops are characterised by using
innovative techniques to shorten repair times for minor collisions up to one half or one
Deloitte Access Economics 17NSW Smash Repair Review
third of the repair times with other business models. These shops focus on securing regular,
high volume work from insurers (Capital SMART, 2011).
4.1.2.2 Major repairs
About 15% of accidents result in major structural damage, usually from high-speed
collisions. A majority of the cars involved in such accidents are written off due to the high
cost of repair, leaving only 2-5% of insurance claims to involve structural repairs, something
usually reserved for premium vehicles (DAE, 2011). As a result of the use of high-strength
steel, structural repairs now require capital-intensive equipment as regular welding
weakens high-strength steel and compromises its properties.
To satisfy this demand, specialist shops have emerged with the necessary capital and labour
to undertake such repairs. There is a shortage for high skilled tradesman who can perform
these tasks, resulting in qualified staff being paid a premium.
On the other end of the labour market, repair shops which do not provide structural repair
services hire lower skilled workers who are used to remove and replace parts quickly.
4.1.2.3 Premium marquees
When compared to regular vehicles, premium cars are unique in that the value of a repair,
as a percentage of the cost of a car is lower. This induces insurers to prefer repairs of write-
offs, for premium cars and thus drives demand for niche premium car repairers.
Repairing premium cars will be beyond the capacity of most repairs shop operators due to
the accreditation regimes run by car manufacturers, the specialised equipment and training
required and the need to use original parts. Repair shops that do have this capacity though
are virtually guaranteed supply by manufacturers’ seeking to honour their warranties.
4.1.2.4 Metro vs. Regional
Major population centres, by virtue of their size, allow for grater specialisation. In small
regional towns, the volume of work is likely to be able to support one smash repair shop at
best, catering to both minor and major repairs.
Regional centres face a combination of skill shortages and higher cost of parts (driven by
distance from major centres and low work volumes) all of which threaten the viability of
repair shops. It can now be cheaper to transport cars from regional areas to cities and back
for repairs rather than having cars repaired locally. For example, this already occurs in
Townsville where it is currently cheaper to transport cars to Brisbane for repairs than it is to
have them repaired locally.
4.1.3 Regulation
The relationship between smash repairers and insurers is regulated at many levels.
Separately from those regulations, smash repairers are also subject to a variety of other
regulations.
In 2006, a voluntary national code was established as a result of the Productivity
Commission Inquiry into Smash Repair and Insurance. The code was meant to provide a
Deloitte Access Economics 18NSW Smash Repair Review
governance structure to manage the relationship between smash repairers and insurers. In
particular, it aimed to provide fair trading, transparency and efficiency while avoiding the
need for a national licensing system for repairers. This code was made mandatory in NSW
in 2007.
In addition, Federal Work Health Safety (WHS) regulation requires safe working conditions
and equipment to minimise physical strain on workers. As smash repairers are usually small
establishments, the fixed costs associated with the implementation of these regulations can
be substantial and deter expansion or investment.
Consumer protection laws also regulate the relationships between smash repairers and
insurers, particularly in terms of the quality of service and transparency in operations. This
holds true even when consumers are third parties to the selection and repair process.
Local councils regulate waste disposal and can thus increase the cost of smash repairs for
repairers with significant waste. Town planning regulations, and relatedly, land prices, also
affect the location of repairers within residential and industrial areas and restrict the size of
such operations.
The demand for smash repairs is also affected, and potentially reduced, by the introduction
and enforcement of road traffic laws including drink driving laws and speed limits which
reduce the number and seriousness of accidents.
Environmental regulations also affect the operation of the industry by regulating water, air
and noise pollution. These in turn affect the hours of operation of and processes used by
smash repair businesses. For example, the use of water based paints can require a change
in infrastructure and application techniques.
Europe has introduced requirements that manufacturers build cars that can largely be
recycled. While this has yet to be introduced in Australia, regulations that increase the
scrap value of cars make them more disposable and thus reduce the volume of repairs.
4.1.4 Competition
Smash repairers compete on the basis of price and quality. However, the overall
competitiveness of the industry is driven by a variety of factors. The framework used to
analyse competition in this report is based on the ACCC’s Merger Guidelines. The relevant
areas which the ACCC considers are:
Market concentration (as an initial indicator);
Barriers to entry and ease of exit;
Availability of substitutes;
Dynamic characteristics of the market; and
Vertical integration.
4.1.4.1 Price competition
A significant barrier to price competition has been the phenomenon of ‘funny time funny
money’ (FTFM). FTFM relies on insurers paying fixed hourly rates for particular repairs
which are significantly below the actual cost incurred. Repairers, in response, simply inflate
Deloitte Access Economics 19NSW Smash Repair Review
the number of hours charged for the repairs. Some hourly rates are also calculated to
include the cost of materials while others are not.
This system is highly problematic as it fails to reflect the costs to repairs, distorts the
relative prices of various stages of the repair process, induces repairers to use lower quality
materials, reduces the ability of insurers to negotiate for lower prices and is very
misleading, particularly to third parties (Productivity Commission, 2005).
This system has begun to change. The Motor Vehicle Insurance and Repair Industry Code of
Conduct states that “the parties acknowledge ongoing changes in the Industry in relation to
the development of realistic times and rates”. The MTA notes that “real time, real rates”
charging is now accepted by most major insurers:
“The information that MTA has received from the major insurance companies
to date is that NRMA Insurance will only accept RTRM quotes from 1st June
2009. AAMI are currently accepting RTRM quotes. Suncorp GIO will commence
RTRM from 1st January 2010. Allianz, Lumley, QBE and Zurich are looking at
moving to using a realistic times and rates methodology and are accepting
quotes written in this format.”
- MTA NSW, n.d.
The emergence of HVLI repairers on the other hand has introduced a greater degree of
price competition in the repairer market. HVLIs represent businesses that have made
significant capital investments to expand capacity and lower variable costs. As a result of
the efficiencies associated with HVLI, smaller cottage repairers are being driven out of the
market through price competition.
When compared on price, tendered repairs appear to have a lower average cost when
compared to non-tendered repairs. This reduction in cost however, is not simply driven by
competition. There is some indication that smash repairers are subsidising tendered repairs
by charging higher prices on jobs that are not tendered (DAE, 2011). This suggests that
while increased competition may exert downward pressure on prices, the current prices
charged for tendered jobs is likely to be lower than the equilibrium price for smash repairs.
4.1.4.2 Concentration
Despite the strong trend towards consolidation, concentration in the industry remains low.
However, the industry has been undergoing gradual consolidation over the last decade with
the number of establishments shrinking at a rate of 0.64% per annum and the number of
enterprises shrinking at a rate of 1.57% per annum (IBISWorld, 2013). The faster rate of
reduction of enterprises suggests that it enterprises with a fewer establishments than the
industry average are more likely to be exiting the market. This comports with the overall
trend of industry consolidation both in the scale of establishments and in the number of
enterprises.
4.1.4.3 Barriers to entry
There do not appear to be significant barriers to entry into the smash repair industry. There
are however, significant capital costs in terms of repair equipment as well as necessary
investments in training and skills. As the make and models of cars are constantly changing,
it is also necessary for businesses to make ongoing expenditures to remain competitive.
Deloitte Access Economics 20NSW Smash Repair Review
Figure 4.1: New smash repair models
New smash repair models are emerging in the NSW market and Australia more
broadly. One example is the Gemini group. Founded in the UK, they opened
their first shop in Australia in 2009. Since then, they have grown to include
over 40 repair shops across five states and territories.
The Gemini group focuses on HVLI-type repair operations. Its website explains
its mission “…dedicated to achieving new standards of excellence in all that we
do. Using the latest technologies, environmentally friendly products, and new
advances in repair equipment we aim to create a fresh and modern approach
to accident repair.”
The group’s success illustrates that barriers to entry in the market are fairly
low. New players with appropriate experience and effective business models
are able to enter into the market. Further, their rapid expansion shows that
effective competitors can succeed in the market.
Source: Gemini (n.d.)
4.1.4.4 Substitutes
The price of smash repairs is ultimately capped by the cost of purchasing a new car less the
cost of scrapping a damaged vehicle. As insurers and individuals can simply write off a
vehicle as a substitute for repairs, factors that either increase the scrap value of cars (such
as increases in the price of metals) or decrease the cost a new vehicle will reduce demand
for smash repairs.
4.1.4.5 Dynamic characteristics
As mentioned above, the long run trends affecting competition among smash repairers are
the declining rate of accidents, the decreasing cost of parts, the increasing economies of
scale associated with HVLIs and the increasing geographic reach of individual repair
businesses.
4.1.4.6 Vertical integration
Vertical integration between smash repairers and insurers will be dealt with in section 5.6.
Smash repairers have the capacity to vertically integrate with other related businesses that
can potentially refer work to a smash repairer. This includes vertical integration with tow
truck operators, local mechanics, car manufacturers or even car dealerships. While vertical
integration can be beneficial, smash repairers rely on insurers for up to 80% of their work,
and hence are most fundamentally concerned with relationships such as PSR arrangements.
Vertical integration between smash repairers and other downstream service providers
including tow truck operators have been marked by a lack of transparency in the past.
Consumers were often unaware of the presence and nature of financial relationships
between parties providing recommendations and smash repairers, thus blunting incentives
for price competition.
Deloitte Access Economics 21You can also read