Design, optimization, and analysis of large DNA and RNA nanostructures through interactive visualization, editing, and molecular simulation - bioRxiv
←
→
Page content transcription
If your browser does not render page correctly, please read the page content below
bioRxiv preprint doi: https://doi.org/10.1101/2020.01.24.917419. The copyright holder for this preprint (which was not peer-reviewed) is the
 author/funder. It is made available under a CC-BY-ND 4.0 International license.

Design, optimization, and analysis of large DNA and RNA nanostructures
through interactive visualization, editing, and molecular simulation
 Erik Poppleton,1 Joakim Bohlin,2 Michael Matthies,1 Shuchi Sharma,1 Fei Zhang,1, 3 and Petr Šulc1, a)
 1)
 School of Molecular Sciences and Center for Molecular Design and Biomimetics,
 The Biodesign Institute, Arizona State University, 1001 South McAllister Avenue, Tempe, Arizona 85281,
 USA
 2)
 Department of Physics, Clarendon Laboratory, University of Oxford, Parks Road, Oxford OX1 3PU,
 United Kingdom
 3)
 Department of Chemistry, Rutgers University-Newark, 73 Warren St, Newark, NJ 07102,
 USA
 This work seeks to remedy two deficiencies in the current nucleic acid nanotechnology software environment: the
 lack of both a fast and user-friendly visualization tool and a standard for common structural analyses of simulated
 systems. We introduce here oxView, a web browser-based visualizer that can load structures with over 1 million
 nucleotides, create videos from simulation trajectories, and allow users to perform basic edits to DNA and RNA
 designs. We additionally introduce open-source software tools for extracting common structural parameters to
 characterize large DNA/RNA nanostructures simulated using the coarse-grained modeling tool, oxDNA, which has
 grown in popularity in recent years and is frequently used to prototype new nucleic acid nanostructural designs,
 model biophysics of DNA/RNA processes, and rationalize experimental results. The newly introduced software
 tools facilitate the computational characterization of DNA/RNA designs by providing multiple analysis scripts,
 including mean structures and structure flexibility characterization, hydrogen bond fraying, and interduplex angles.
 The output of these tools can be loaded into oxView, allowing users to interact with the simulated structure in
 a 3D graphical environment and modify the structures to achieve the required properties. We demonstrate these
 newly developed tools by applying them to in silico design, optimization and analysis of a range of DNA and RNA
 nanostructures.

I. INTRODUCTION free-form editing available in Maya. Adenita combines the
 functionality of CAD converters with free-form design, al-
 The field of nucleic nanotechnology1 uses DNA and RNA as lowing users to load structures from a variety of sources
building blocks to construct nanoscale structures and devices. with additional editing tools available in the SAMSON inter-
Using the high programmability of pairing combinations face. DAEDALUS and PERDIX are software that facilitate
between oligonucleotides, it is possible to construct 2D and conversion of meshes designed in CAD software into DNA
3D nanostructures up to several thousand nucleotides. Over representations. Currently, the nanotechnology field lacks a
the past three decades, designs of increasing complexity universal method for assembling structures made in different
have been proposed, such as DNA/RNA tiles and arrays2 , design tools, especially if small changes need to be made.
DNA multi-bundle origamis3 , wireframe nanostructures4,5 Continued development of tools is thus necessary to integrate
single-stranded tile (SST) nanostructures6 , single-stranded the previous efforts and enable design of more complex DNA
DNA (ssDNA) and RNA (ssRNA) origami structures7 , and and RNA nanostructures. Additionally, with the exception of
larger multi-origami tile assemblies8 . The nanostructures Tiamat, all available tools focus only on DNA nanostructure
have promising applications ranging from photonic devices9 designs.
to drug delivery10 . Molecular simulations have proved indispensable in the
 There are many available nucleic acid nanotech- field of nucleic acid nanotechnology, providing detailed in-
nology design tools, including CaDNAno11 , Tiamat12 , formation about bulk structural characteristics19,20 , folding
vHelix13,14 , Adenita15 , MagicDNA16 , and the CAD convert- pathway kinetics21,22 , conformational space and kinetics of
ers DAEDALUS17 and PERDIX18 . CaDNAno is frequently complex nanostructures23–25 , and active devices such as DNA
used to design very large structures on either a square or walkers26,27 . Due to the size of the designed nanostructures
hexagonal lattice, which requires components be made of and the laboratory timescales involved, traditional fully atom-
parallel helices. Tiamat is an intuitive lattice-free design tool istic simulation methods are often infeasible for nucleic acid
that supports both DNA and RNA. MagicDNA is a Matlab- nanotechnology applications. To remedy this, several coarse-
based tool that specializes in the design of large 3D structural grained models have been developed28–36 , each of which with
components on a 3D cubic lattice using CaDNAno-like par- a unique focus on a specific part of the DNA nanostruc-
allel DNA bundles as the base unit of each edge. VHelix and tural design and characterization pipeline. In particular,
Adenita are DNA design plugins for the commercial design the oxDNA/oxRNA models have grown in popularity in
platforms Maya and SAMSON. VHelix facilitates conver- recent years and have been used for studying DNA/RNA
sion of polyedral meshes to DNA sequences, with further nanostructures and devices23,32,37–39 as well as RNA/DNA
 biophysics30,40,41 . The models represent each nucleotide as a
 single rigid body, where the interactions between nucleotides
 are empirically parameterized to reproduce basic structural,
a) Electronic mail: psulc@asu.edu mechanical and thermodynamic properties of DNA and RNA
bioRxiv preprint doi: https://doi.org/10.1101/2020.01.24.917419. The copyright holder for this preprint (which was not peer-reviewed) is the
 author/funder. It is made available under a CC-BY-ND 4.0 International license.

 2

 feedback using oxView. Finally, oxView implements rigid-
 body dynamics code so that individual parts of the structures
 can be selected and interactively rearranged. The structure
 will then be relaxed on-the-fly using rigid-body dynamics to
 a conformation which can be used as an initial structure in
 simulations.
 The second tool introduced here is a set of standardized
 structure-agnostic geometry analysis scripts for oxDNA/RNA
 which cover a number of common molecular simulation use
 cases. Many groups that work with oxDNA/RNA have de-
 veloped their own analysis tools in-house, resulting in many
 duplicate functionalities and scripts that are limited to single
 experiments. To facilitate the simulation-guided design of
 DNA/RNA nanostructures and lower the barrier of entry into
FIG. 1. The oxDNA model. A DNA duplex as modeled in the simulation field, we have developed a toolkit that is easy
oxDNA with labels corresponding to the coarse-grain potentials to use, generically applicable to numerous studied systems,
defining the force field. OxDNA is a ”two-bead” model with and extensible. The tool set includes the following: 1) calcu-
each nucleotide represented as two beads with specific interaction lation of mean structure and root-mean squared fluctuations
sites that approximate the geometry and interactions of the 20+ to quantify structure flexibility; 2) hydrogen-bond occupancy
atoms that make up each nucleotide. The coarse-grained force to quantify fraying and bond breaking during the simulation;
field is parameterized to reconstruct the structural and dynamic 3) angle and distance measurements between respective du-
properties of both single- and double-stranded DNA and RNA.
 plex regions in a nanostructure; 4) a covariance-matrix based
 principle component analysis tool for identification of nanos-
 tructure motion modes; and 5) unsupervised clustering of
(Fig. 1). sampled configurations based on structural order parameters
 However, the standalone simulation package only provides or global difference metrics.
simulation trajectory with recorded 3D positions of all nu- We demonstrate the versatility of the analysis tools and
cleotides in the simulation. Users usually have to develop visualization platform functionality by analyzing simulations
in-house evaluation tools that post-process the simulation of previously published structure and a few novel designs. In
trajectory to extract desired properties of the studied nanos- particular, we study two RNA tiles, a Holliday junction, the
tructures. tethered multi-fluorophore structure, two wireframe DNA
 In this paper, we present two open-source tools to fill origamis, and a single-stranded RNA origami nanostructure.
these unmet needs in the field of DNA/RNA nanotechnol- We make no custom modifications to the analysis tools for
ogy and illustrate their use for design and optimization of each of the designs to demonstrate their versatility and gen-
DNA and RNA nanostructures. The first tool we introduce eral utility for distinct nanostructures. The visualization and
here is oxView, a browser-based visualization and editing analysis software developed in this work is freely available
platform for DNA and RNA structural design and analysis under a public license.
of nanostructures simulated in oxDNA/oxRNA. The tool
is able to accommodate nanostructures containing over a
 II. MATERIALS AND METHODS
million nucleotides, which is beyond the reach of most other
visualization tools. It allows the user to load multiple large
nanostructures simultaneously and edit them by addition or A. System and software requirements
deletion of individual nucleotides or entire regions, providing
a way to create new, more complex designs from smaller, The analysis tools were written and tested using the follow-
individually designed subunits, even from different design ing dependencies: Python 3.7 (minimum version 3.6), NumPy
tools. All of the previously mentioned design tools can be 1.1643 , MatPlotLib 3.0.3 (minimum version 3.0)44 , BioPy-
converted to the oxDNA format using either built-in tools thon 1.7345 , SciKitLearn 0.21.246 Pathos 0.2.347 , oxDNA
(Adenita, MagicDNA, vHelix), the TacoxDNA webserver42 6985 (minimum version June 2019)31,32,48 .
(CaDNAno, Tiamat, vHelix), or by converting first to PDB OxView will run as-is on any modern web browser with We-
using built-in tools and then to oxDNA using TacoxDNA bGL support; though, we note that Google Chrome performs
(DAEDALUS, PERDIX). The visualization tool is integrated best at very large structure sizes. To make modifications to
with oxDNA/oxRNA simulations and loads long simulation the code, the following dependencies are required: JavaScript
trajectories quickly (including files which are tens of giga- ES6, Typescript 2.9.0
bytes in size) for interactive analysis and video export of
nanostructure dynamics. It can also load data overlays from
the analysis scripts introduced in this paper, allowing users B. OxDNA input and output files format
to interactively explore features such as hydrogen bond occu-
pancy and structure flexibility and then use this information As the analyses discussed here process the data from
to iteratively redesign nanostructures based on simulation oxDNA files, it warrants a brief description of the file types
bioRxiv preprint doi: https://doi.org/10.1101/2020.01.24.917419. The copyright holder for this preprint (which was not peer-reviewed) is the
 author/funder. It is made available under a CC-BY-ND 4.0 International license.

 3

encountered when running and analyzing oxDNA files. This ics (MD) simulation with the DNA2 or RNA2 force field.
will mitigate confusion as to why certain files are used in This bypasses checks of backbone bond length and allows for
each case. The three most important files are the input faster relaxation due to the CUDA implementation of the
parameter file, the topology file and the trajectory file. The MD method in oxDNA49 . This simulation was run until the
input file is a text file with the simulation’s parameter names energy stabilized between −57.98 and −62.13 pN nm (−1.4
and values separated by equal signs. This file defines simula- and −1.5 oxDNA energy units respectively). At which point,
tion and physical parameters such as temperature, the force the external forces and backbone force limitations were re-
field used, and file I/O information. Input files will be used leased and a production simulation run was performed using
by any analysis that calculates energy (primarily those con- the same force field for 109 steps with a stepsize of 15.15
cerned with hydrogen bonds) or is optimized by writing its fs (0.005 oxDNA time units). This corresponds to a total
most computationally-intensive operations distributed and run time in the microsecond range; however, previous work
compiled with the oxDNA code. Topology files define the with the oxDNA model37,50 suggests, in part, due to the
nucleotides present in the simulation. It is a text file with the increased diffusion coefficient, this direct conversion is an
extension .top and contains a header line with the number underestimate of the corresponding experimental time. How-
of nucleotides and the number of strands separated by a ever, as is the problem with all coarse-grained models, it is
space. Following the header, each line defines a nucleotide impossible to establish a direct correspondence between the
with four values: the strand number, the base identity, 3’ simulation and experimental time because different processes
covalent connection, and 5’ covalent connection (note that in a coarse-grained simulation can scale to the experiment
oxDNA numbers bases 3’-5’, the reverse of the biochemistry with different ratios. The production simulations were per-
convention). Strand ends have a value of −1. The trajectory formed at 20 ∘ C using an Andersen-like thermostat51 , and
file contains the position, orientation and velocity of every configurations were saved for analysis every 5 × 10⁵ steps,
nucleotide at each timepoint, based on the interval specified resulting in 2000 separate configurations used in each anal-
in the input file. Each configuration in the trajectory begins ysis. The RNA tile, used as an example of the clustering
with a three-line header, defining the temperature, simulation algorithm, was exported from a Tiamat design as described
box dimensions, and kinetic, potential, and total energies of above. However, the production run was a parallel-tempered
the system. Each subsequent line defines one nucleotide with simulation run in virtual-move Monte Carlo (VMMC)52 with
15 parameters: position, orientation defined by two orthog- umbrella sampling. Simulations with eight parallel replicas
onal vectors, translational velocity and rotational velocity. were performed with the temperatures set from 25 to 60 ∘ C
All parameters are in XYZ coordinates. The TacoxDNA at 5 degree increments. Replicate exchange was attempted
webserver42 has a variety of conversion tools from popular every 1000 steps. To facilitate calculation of the energy bar-
nanotechnology design tools and simulation formats into the rier between the formed crossover and the broken crossover,
oxDNA format. Once converted, these files can be visualized a weight file was created to bias the simulation towards
and edited using oxView or simulated using oxDNA/oxRNA. transition states between the two states.
However, for large and/or long simulations, these files can
become quite unwieldy, requiring tens of gigabytes of storage
and therefore are impossible to open and read in a single III. RESULTS
reading frame. Therefore, all analyses and visualizations
described here read trajectory files in a stream, allowing A. OxView - Web browser visualization, analysis and editing
reading of files that would not otherwise fit in the computer’s of nanostructures
RAM.
 We introduce oxView, a JavaScript app built on the
 Three.js visualization library to provide fast, user-friendly,
C. Example Simulations and flexible visualization capabilities with low technical over-
 head (Fig. 2). OxView uses hardware instancing to offload
 The simulations given as examples here were run using most calculation of object geometry to the computer’s GPU,
the oxDNA code (June 2019 version). Structures were orig- allowing it to smoothly visualize structures containing mil-
inally obtained in either Tiamat12 or CaDNAno11 format lions of nucleotides (Fig. 2a). Standard Three.js scenes en-
and then exported to oxDNA format using the TacoxDNA counter a bottleneck in the rate of CPU draw calls with only
webserver42 . Structures were relaxed in two steps. First, a few thousand objects on the screen. By using instanced
a brief Monte-Carlo (MC) simulation was performed using materials and custom properties written into the WebGL
the DNA relax or RNA relax force fields to remedy over- shaders, oxView bundles many objects with similar geome-
lapping particles. After this initial relaxation, mutual traps tries into a single draw call that calculates edges and vertices
based on the intended design were applied to enforce relax- in the compiled shader code.
ation to the intended design. For designs exported from Loading a simulation is as simple as dragging and dropping
Tiamat, mutual trap files are produced by TacoxDNA; for a trajectory/topology file pair onto a browser window with
other structures, these files were produced using the force file the app running. OxView will run in any modern web
generation script described in the ”other utilities” section browser. Though, we note that Google Chrome tends to have
after the MC relax. A further relaxation was performed the best performance for very large structures due to a better
using the max backbone force option in a molecular dynam- WebGL implementation. Simulation trajectory files can be
bioRxiv preprint doi: https://doi.org/10.1101/2020.01.24.917419. The copyright holder for this preprint (which was not peer-reviewed) is the
 author/funder. It is made available under a CC-BY-ND 4.0 International license.

 4

stepped through using onscreen buttons or the keyboard, a)
and the trajectory movie can also be downloaded as a video
file. Available formats are .webm, .gif, and .jpg/.png image
archives.
 In addition to visualization, oxView also has basic editing
capabilities (Fig. 2b). Particles can be selected individually,
or whole strands and systems can be selected as a whole. Box
selection, range selection (shift+click) and cluster selection
are also available. Clustering can be done automatically us-
ing a Density-Based Spatial Clustering of Applications with
Noise (DBSCAN) algorithm53 or can be assigned manually
from other selection methods. Briefly, DBSCAN compares
distances between points and classifies groups of points meet- b)
ing a specified minimum size and within a specified mutual
minimum distance as members of the same cluster. It also
characterizes points as central or peripheral, with central
points having at least the minimum number of neighbors
in the cluster and peripheral points being within the cutoff
distance of one or more, but fewer than the specified number
of central points. When manually selecting nucleotides, hold-
ing the control key while making a selection will combine
the new and previous selections. Selected particles can be
translated and rotated, and the topology can be edited via
strand extension and creation, nicking, deletion, and liga-
tion. Edits can be undone and redone using the standard
 FIG. 2. Screenshots from usage of oxView. a) 100 configu-
ctrl-z/ctrl-shift-z keyboard shortcuts. Strand extensions will
 rations from an oxDNA simulation of design 24 from18 merged
attempt to approximate either an A-form or B-form helix into a single file and loaded into oxView; illustrating the ability to
depending on the parent nucleotide’s identity: RNA or DNA. smoothly visualize over 106 nucleotides. The origami design has
The final edited version can be downloaded as an oxDNA 11 382 nucleotides, resulting in a combined file containing 1 138 200
file pair for further simulation or as a CSV sequence list for nucleotides, which renders as 5 691 000 individual objects in the
experimental validation. scene. b) Using oxView to assemble a simulation of the tethered
 We envision this tool being used to prototype DNA/RNA multiflourophore (TMF) structure used in54 . Each of the subunits
nanostructural designs in an iterative process before realiza- is a separate CaDNAno file converted into oxDNA format using42 .
tion in the lab. The structure can be simulated for a short The two subunits and the algorithmically generated tether had
time, analyzed for defects, and then iteratitively modified in to be ligated prior to simulation.
the viewer and returned to simulation to verify success. This
tool is also useful as a neutral ground between structures
designed in other editing tools, allowing researchers to merge
together structures from many sources to realize a complex allows interaction with structural units as a group. Addition-
vision. ally, each system contains a set of data arrays that define
 oxView also allows the creation of mutual trap external the positions, orientations, sizes, and colors of every particle.
force files for oxDNA/RNA. These files define artificial pair- These arrays are passed into a custom implementation of the
wise spring potentials between nucleotides that can be loaded WebGL Lambert shader, where they are compiled on the
in an oxDNA simulation and be very helpful when simulat- GPU and drawn as a single object. This scheme allows load-
ing the relaxation of a complex structure, assembled from ing of over 1 million nucleotides into a single scene (Fig. 2a
multiple components, or when relaxing a structure imported and Supplementary video 1).
from the CaDNAno format. Selection is handled through a GPU-picker, which avoids
 the need for computationally-expensive raycaster intersection
 calculation. Briefly, each nucleotide has a mesh with a color
1. Implementation details corresponding to its global ID at the same position as its
 backbone site which is rendered in an invisible scene. The
 The underlying architecture of oxView has two parallel color of this mesh can quickly be determined via the x-y
data streams. The first mirrors the physical arrangement coordinates of the mouse on the screen. When the color is
of nucleic acid monomers into strands, with each configura- converted from the hexadecimal color to the corresponding
tion/topology pair representing a system. This data structure decimal value, it returns the ID of the nucleotide under
contains the topological information relating to particle iden- the mouse pointer. As the arrays passed to the shader are
tities, connectivity, and relation to the system. Monomers, of constant-size, new nucleotides added to the scene after
strands and systems all inherit from the Three.js Group ob- initialization, are placed in a temporary system object with
ject and are related through an inheritance hierarchy, which its own instancing arrays.
bioRxiv preprint doi: https://doi.org/10.1101/2020.01.24.917419. The copyright holder for this preprint (which was not peer-reviewed) is the
 author/funder. It is made available under a CC-BY-ND 4.0 International license.

 5

 Editing a simulation topology via nicking, ligation, addi- simulation. For origami structures consisting of multiple
tion, and deletion can leave gaps in the strand and nucleotide origami blocks, connected by initially stretched backbone
numbering. Because of how oxDNA allocates memory, such bonds, rigid-body manipulation has previously been used to
gaps will cause exported simulations to crash. Therefore, arrange the converted oxDNA structure into a more realistic
prior to exporting files from scenes with edited topology, initial configuration55 . The translation and rotation tools
the ”pre-organize strands” option must be selected in the in oxView allow users to select and rearrange blocks of nu-
”Download Output Files” dialog (illustrated in Supplemen- cleotides as rigid bodies. Furthermore, oxView also includes
tary video 2). This option will re-organize strands from a rigid-body dynamics (RBD)56 mode, that automatically
longest to shortest, ensuring that all numbering is contigu- transforms groups of nucleotides based on a simple force
ous, and oxDNA will be able to read the edited file. This field. It is also possible to drag and rotate groups during
also reinitializes the data arrays, merging the scene into a RBD, allowing the user to nudge the design into the desired
single system. topology. Groups can either be created manually via the
 selection interface or through the implemented DBSCAN
 algorithm53 that automatically identifies and categorizes spa-
2. Data overlays in oxView tially separated groups of particles. The latter option works
 particularly well with designs developed in CaDNAno.
 Many of the simulation analysis scripts introduced in this Each group is represented as a rigid body with a position
work output overlay files that can be viewed in oxView. This and an orientation. The groups are held together with spring
allows interactive visualization of different properties (such forces at each shared backbone bond, with a magnitude of
as flexibility, discussed in Fig. 4) of respective parts of the
structure obtained from simulations. These are JSON-format spr = ( − ),
files that define the name of the overlay and the data. There
are three types of overlays recognized by oxView. The most where is a spring constant, is the current bond length
frequently used is the color overlay. These files contain one and is the constant relaxed bond length. To avoid overlaps,
value per particle. When dragged and dropped into oxView, a simple linear repulsive force, of magnitude
along with the corresponding configuration/topology pair, (︂ (︂ )︂ )︂
the color overlay file will create a superimposed colormap on
 rep = 1 − ,0
the structure based on the value associated with each particle. +
All 256-value colormaps from Matplotlib44 are available in
addition to the default Three.js colormaps. The displayed is added between the center of each group, where is a
colormap can be altered via a simple API implemented in repulsion constant, is the distance between the two centers
the browser console. In addition to per-nucleotide coloring, of mass, and + is the sum of the group radii (the greatest
oxView can also read two JSON formats corresponding to distance they can be while still overlapping). An example
arrows drawn on the scene. The first is a three-component of the dynamics in action can be seen in Fig. 3 and Supple-
vector for each nucleotide, which is produced by the principal mentary video 3, where each side of a DNA icosahedron57 is
component analysis script and draws a vector, emanating automatically arranged into the intended shape.
from each particle, using the magnitude and orientation
defined in the overlay file. The second format, which can
contain any number of vectors, takes pairs of three-component B. General-purpose analysis tools
vectors and draws arrows of the corresponding position and
orientation on the scene. Popular molecular simulation tools programs, such as
 GROMACS58 , not only perform molecular simulations, but
 also include analysis tools for common use-cases. The access
3. Relaxing structures using rigid body dynamics to reliable and maintained tools, as part of the distribution,
 allows for standardization between many researchers using
 There has been a recent push to develop software that the core tool, as well as simplifying the learning curve for new
converts structures designed in the various design tools to researchers working with the tool. At this time, although
simulation formats42 . Due to the lattice-based drawing plat- there are over a hundred publications using oxDNA/RNA, no
form with parallel helices used by CaDNAno, exported struc- standardized set of tools for structural analysis has emerged.
tures can be very difficult to relax to a physically reasonable We present here a set of tools covering many common struc-
state in oxDNA. Initial configurations imported from CaD- ture analyses: mean structure, root mean squared fluctua-
NAno (shown in Fig. 3a) will generally be planar with highly tions (RMSF), hydrogen bond occupancy, interaction energy,
stretched bonds between individual structural units. Thus, interduplex angles, contact mapping, the distance between
without 3D information on how to reorient the helices, neither nucleotides, and principal component analysis of structure
MC nor MD simulations are able to find the relaxed arrange- motion. These are primarily written in Python, with some
ment. This can also lead to topological impossibilities, where portions embedded in the oxDNA C++ code for enhanced
structures are knotted in a nonphysical manner. Addition- speed. Moreover, we provide additional utilities including
ally, starting simulations from a state with very stretched a parallelization scheme for analyses, trajectory alignment,
bonds can result in numerical instabilities that crash the and unsupervised clustering based on data outputs.
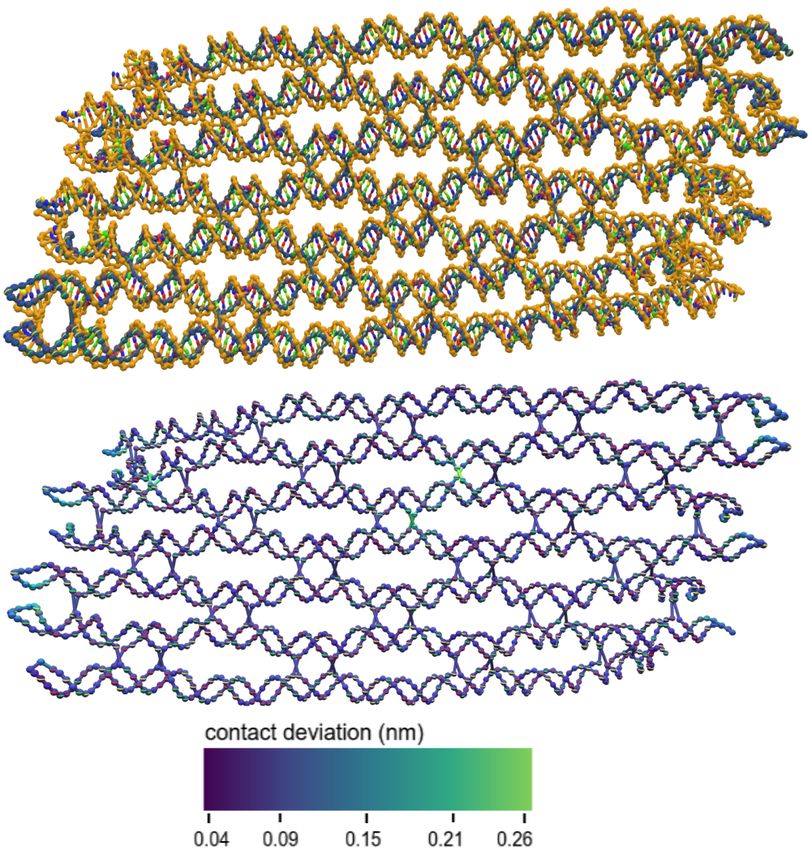
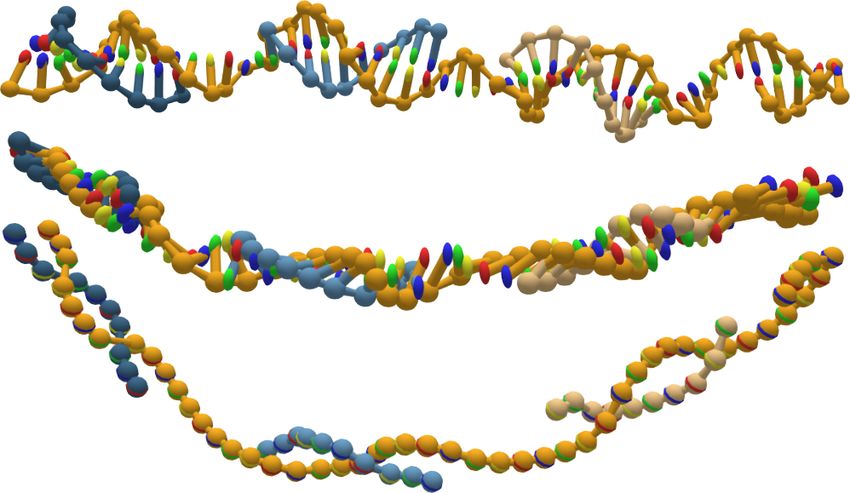
bioRxiv preprint doi: https://doi.org/10.1101/2020.01.24.917419. The copyright holder for this preprint (which was not peer-reviewed) is the
 author/funder. It is made available under a CC-BY-ND 4.0 International license.

 6

 a) b) c)

FIG. 3. Rigid-body dynamics of clusters. Snapshots from the automatic rigid-body relaxation of an icosahedron, starting with
the configuration converted from caDNAno a), through the intermediate b) where the dynamics are applied, and c) the final resulting
relaxed state.

1. Mean structure determination and RMSFs average structure is computed for this design, the entire
 structure collapses into a linear blob that does not have any
 resemblance to any of the individual configurations. This
 This package includes two methods for determining the is because the average position for these flexible particles
mean structure. One utilizes the Biopython45 singular value is drawn towards the center. For such structures, another
decomposition (SVD)-based structure superimposer. This is mean structure calculation based on interparticle distance is
a popular method59 that finds a translation and rotation to employed.
superimpose two distinct conformations on top of each other The second option for mean structure determination uses
to minimize the the root mean square distance between their a common machine learning technique, multidimensional
components. A random configuration in the trajectory is scaling (MDS)60 , to reconstruct a mean structure from local
selected as the reference structure. In the example structures contact maps. MDS is one of a class of algorithms known
displayed here, this choice was found to have little impact on collectively as manifold learning, which are traditionally used
the final outcome. Each configuration is then superimposed to perform dimensionality reduction in high-dimensional
onto the reference, and the average position of each nucleotide datasets. MDS takes a set of pairwise distances between
is calculated by taking the mean of each particle’s coordinates points in an arbitrary number of dimensions, as an input.
in the aligned reference frame. To find the per-particle RMSF, The algorithm then uses eigenvalue decomposition to find
a second script uses the mean structure produced by the distances in the embedded space that minimize
first script as the reference configuration for alignment. The
squares of the distances between the alignment and the mean
 ∑︁
structure for each nucleotide are then summed and divided ( , ) = (⟨ ⟩ − )2 ,
by the total number of configurations. The square root is , =1
then taken to find the RMSF per particle in nanometers. The where N is the number of data points, ⟨ , ⟩ is the mean
final output from this script is a .json format color overlay distance between centers of mass of nucleotides and
that can be loaded into oxView. (averaged over the whole simulated trajectory) and , is
 As noted in23 , averaging methods that use full structure their embedded distance46 . In the implementation presented
alignment work very well for rigid structures; However, there here, pairs of nucleotides, where average distance ⟨ , ⟩ is
are some caveats. Large planar structures frequently appear longer than the cutoff of cut = 2.07 (approximately
to have the smallest RMSF in a ring midway between the the interhelix gap in an origami), are not considered in the
center and the edge (Fig. 4b). This does not correspond to embedding. The MDS-based mean structure calculation uses
lower flexibility, but instead reveals an artifact of the single- the MDS algorithm61 , implemented in the Python machine
value decomposition. If a structure can bend in two possible learning toolkit, SciKit-Learn46 , to reconstruct these local
directions, the stationary point in the oscillation will appear distances into a three-dimensional embedded representation.
to have very low flexibility. Highly flexible regions tend to col- This method loses orientation data, and thus, nucleotides are
lapse towards a center line, which is particularly problematic simply visualized as spheres at their centers of mass (Fig. 5).
for rigid structures connected by a flexible linker, exempli- Once a mean structure (in the embedded space) is calculated,
fied by the interrupted duplex shown in Fig. 5a. When the the script then calculates the mean deviation in distance
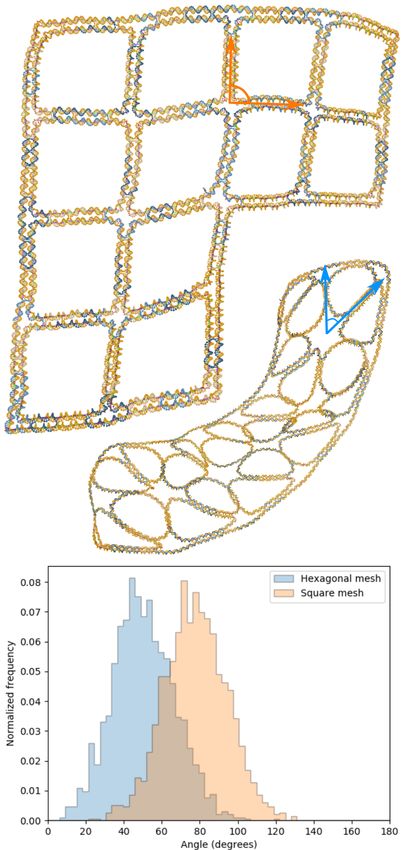
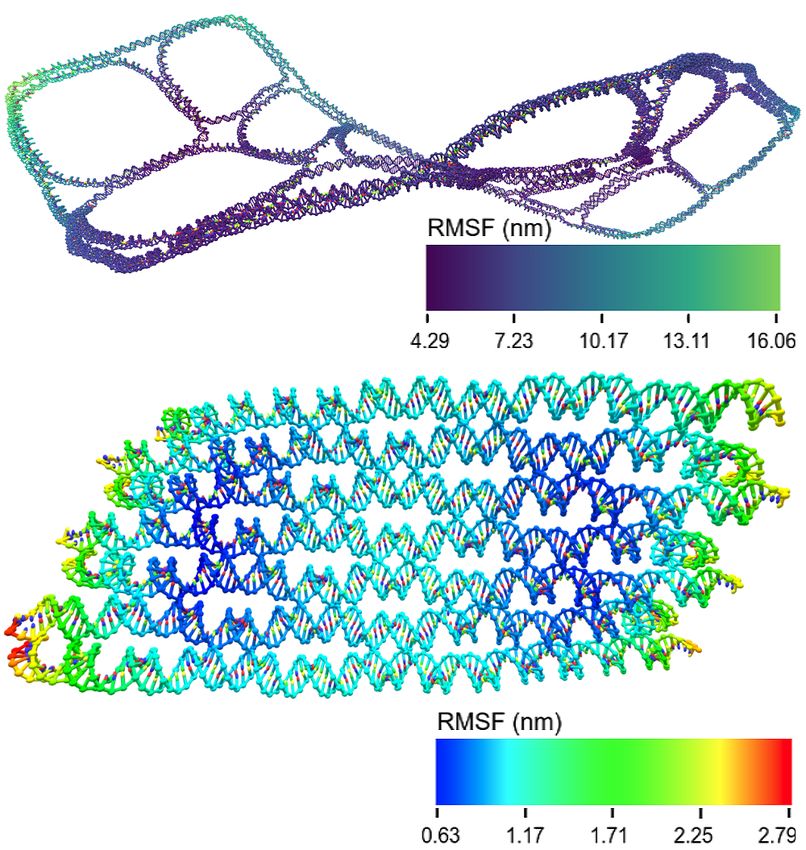
bioRxiv preprint doi: https://doi.org/10.1101/2020.01.24.917419. The copyright holder for this preprint (which was not peer-reviewed) is the
 author/funder. It is made available under a CC-BY-ND 4.0 International license.

 7

between each particle and its nearest neighbors and outputs a)
an oxView color overlay file to quantify the flexibility.
 We used the SVD-based mean structure script to study flex-
ibility and curvature in large wireframe origami structures18 .
In the original research, these structures were visualized using
atomic force microscopy (AFM), which tends to overestimate
the flatness of structures due to electrostatic interactions
between the mica surface and the DNA origami4 . Though
the wireframes appear flat in the published AFM results, our
simulations suggest that in solution they would be more crum- b)
pled or have some degree of global helical twist. Particularly
striking is the helical shape of the mean structure of design
number 19 from18 (shown in Fig. 4a and Supplementary
video 4). OxDNA was parameterized to correctly reproduce
the global twist of large 3D DNA structures48,62 , suggesting
that this twist is likely significant while in solution. We note,
however, that the global twist of 2D DNA nanostructures
in the bulk remains a topic of active research63 , and more
experimental data is needed to establish a better comparison
of oxDNA parametrization with experimentally determined
structures. Mean structures are also the best method to
compare simulation results to cryo-EM maps. Both produce
an averaged structure over thousands of individual snapshots.
Thus, converting mean structures to PDB format using exist- FIG. 4. Mean structures and RMSF. a) The mean and
ing conversion tools42 for use with cryo map fitting software, deviations scripts were used to compute the mean structure and
such as can be found in Chimera64 , is a method to correlate RMSFs of design 19 from18 . In the initial report of these designs,
simulations and experimental data. they were characterized by AFM, showing complete, flat struc-
 Because of the limitations of SVD-based mean structure tures. In the simulations here, the structures were stable; however,
calculation, the MDS approach was also used to determine the mean structure shows a significant right-handed global twist.
the mean structure and deviations. Unfortunately, because b) To demonstrate the patterns that appear in RMSF calculations,
 this is the mean structure of a single-stranded RNA origami65
average distance data is noisy and does not precisely map
 with the RMSF shown using a colormap with high spectral con-
to a single configuration, this method does not work for trast. The center of the origami appears to have an RMSF twice
structures larger than a few thousand particles. In all tests as high as the surrounding regions. This is simply an artifact of
of the algorithm at origami scales, every particle was placed the alignment and not an accurate characterization of particle
at the origin, a trivial solution that is a known issue of motion.
manifold learning methods. However, at smaller scales, this
method provides a reasonable mean structure, that respects
the geometry of the double helix, and a measure of deviation
that reveals areas of flexibility without global artifacts due using oxView’s selection feature. This method can compare
to fitting (Fig. 6). angles either within or between structures.
 Determining the angle between two duplexes can be useful
 in assessing design outcomes as well as quantifying twist
2. Geometric parameters: interduplex angles and distances within nanostructures. The output from the angle script
 is a list of all duplexes found in each configuration of the
 The simplest structural unit of nanotechnology structures trajectory. This output can then be fed into the partnered
is the duplex – antiparallel strands of sequentially bonded nu- visualization script along with the starting nucleotide IDs
cleotides. We have implemented a script that automatically of the duplex. The output will be the median, mean and
determines the duplexes present in each configuration within standard deviation of the angle between the two duplexes,
a trajectory and fits a vector through the axis of the duplex. as well as the fraction of analyzed configurations in which
This is trivial for DNA, where the center points of each base that pair of duplexes are both present. This number is an
pair lie roughly co-linear and the axis can be defined by indication of both how stable the structure is and whether or
a linear regression through the points in the center of the not the chosen duplex is representative of the entire trajectory.
duplex. For RNA, the A-form helix is slightly more difficult The script will also provide a histogram and/or trajectory of
to characterize. The duplex is defined by the normal vector the angle over the course of the simulation. Here, we show an
to an average plane fit through the displacements along the example of the angle script again using the wireframe origami
backbones as described in31,66 . This script creates a text file designs from18 . Each origami has a designed junction angle
that contains information about all duplexes found at each corresponding to the number of arms joined at each junction
step. This can be visualized using a separate script, which (Fig. 7). Deviation from this designed angle is a measure
uses the ID of nucleotides at the edge of the duplex, found of strain and how non-planar the structure is in simulation.
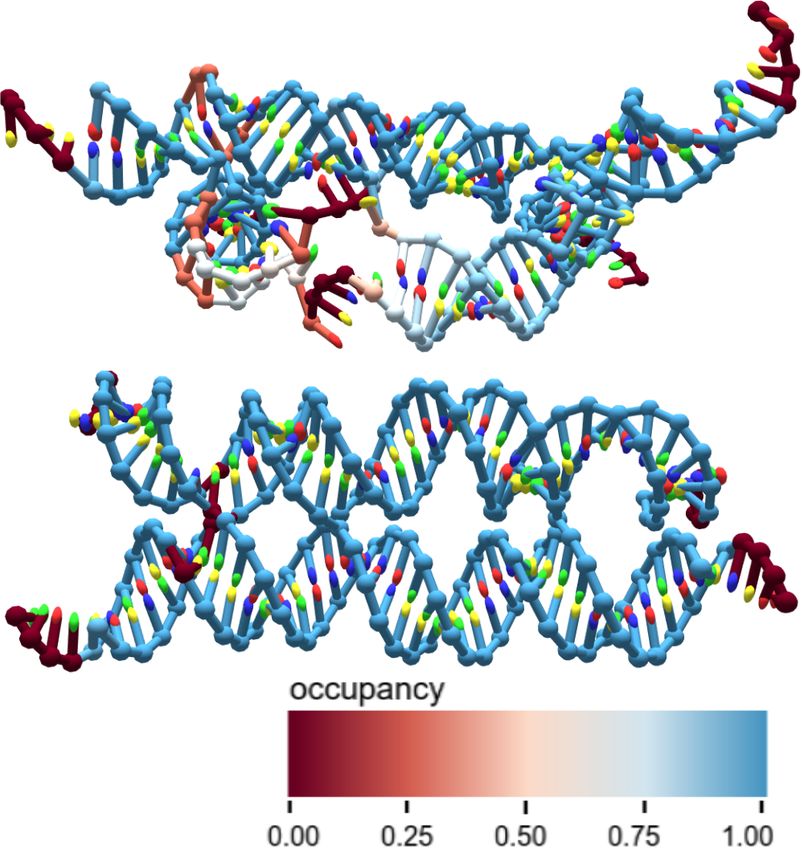
bioRxiv preprint doi: https://doi.org/10.1101/2020.01.24.917419. The copyright holder for this preprint (which was not peer-reviewed) is the
 author/funder. It is made available under a CC-BY-ND 4.0 International license.

 8

a) a)

b)

c)

 b)

FIG. 5. Improving mean structures of flexible designs.
a) The initial configuration of a 50-nucleotide duplex interrupted
with 5 nucleotide gaps, created using the editing tools in oxView.
Each individual configuration encountered during simulation dis-
played helical geometry. b) The mean structure computed using
SVD of the whole simulation. Because of the high backbone and
rotational flexibility of this structure, it collapses into a linear
shape that has little correspondence to the double helix geometry
that is maintained throughout the simulation, c) The mean struc-
ture computed using MDS. In this case, since only local contacts
are used to construct the mean structure, the helical geometry
 FIG. 6. Mean structures computed via multidimensional
is maintained. MDS comes at the cost of losing nucleotide orien-
 scaling. a) The mean structure of a single-stranded RNA origami
tation information, however. Thus, the visualization only shows
 from65 computed both by SVD (yellow) and MDS (blue). Because
the center of mass for each nucleotide.
 MDS does not preserve orientation data, the nucleotides are
 visualized simply as spheres at their center of mass, rather than
 having distinct base/backbone sites. b) The deviation in local
 contacts from the mean structure calculated in a. This measure
This can be particularly revealing in combination with the shows most of the structure to be homogeneously stable, with
mean structure, showing that an on-average flat structure higher flexibility at helix ends and at junctions capable of sliding.
has a significant degree of flexibility over the course of the
simulation.
 The Tethered Multi-fluorophore (TMF) structure from54
was used as a demonstration of the distance script. This
structure is used to measure binding kinetics through the
large change in radius of gyration induced by binding and
unbinding of compatible sequences near the ends of the
 pairing potential of a base pair in a duplex. The script com-
double-stranded tether. Fig. 8 shows end-to-end distance of
 pares the hydrogen bonds in a simulation with a provided
the tether in both the bound and unbound states. Know-
 list of pairs present in the intended design. The fraction of
ing the end-to-end distance of this structure can be used
 the configurations in which the intended bonds are formed
in predicting the radius of gyration for various states of
 are reported as an oxView overlay file, with color coding
the structure, which is useful in corroborating experimental
 intensity corresponding to the fraction of the time where the
results.
 bonds are formed. Bonding is considered 0 for nucleotides
 without designed complements.
3. Base pair occupancy
 Since the structures exported from design tools represent
 The hydrogen bonds defining Watson-Crick base-pairing an idealized form, deviations from the original vision imply
are the single most important parameter defining DNA/RNA unmet design constraints. In Fig. 9, we use this script to
nanotechnology geometries. Since structures are designed explore a poorly-formed RNA tile structure. We first sim-
towards a theoretical global free-energy minimum that maxi- ulated the original tile design, as shown in Fig. 9a. The
mizes hydrogen bonds, deviations from the designed struc- hydrogen bond occupancy data revealed intense stress in
tures point to regions of significant topological strain or that a single duplex, with individual bonds ranging from 0-60%
have found a kinetically trapped structure distinct from the occupancy. This introduced considerable flexibility to the
intended design. OxDNA/RNA defines hydrogen bonds be- structure, disrupting the intended planar design. When the
tween base-paired nucleotides as a base-pairing potential duplex was redesigned to extend it by one base pair, it no
between two base particle beads less than -0.1 kb T, about longer suffered from the same disruption, and the intended
10% of the magnitude of the equilibrium value of the base design was observed in the simulation (Fig. 9b).
bioRxiv preprint doi: https://doi.org/10.1101/2020.01.24.917419. The copyright holder for this preprint (which was not peer-reviewed) is the
 author/funder. It is made available under a CC-BY-ND 4.0 International license.

 9

a) a)

 b)

 FIG. 8. Distance between origami units of TMF. a) The
 final configuration from a simulation of the TMF structure used
 in DNA kinetics experiments54 . Separate simulations were per-
 formed with the sticky ends in both the bound and free config-
 urations. b) The distribution of distances between the origami
 units at opposite ends of the tether.

b) 4. Principal Component Analysis of Nanostructure Motion
 Modes

 Principal component analysis (PCA) is a common method
 for analyzing molecular simulation data that extracts the
 largest sources of deviation from the dataset67 . First, using
 SVD, each configuration is aligned to a mean configuration
 (produced by either SVD or MDS) to remove rotations and
 translations from the data. Each nucleotide’s deviation from
 its reference position in x- y- and z-coordinates is stored
 as its difference matrix. A covariance matrix is then con-
 structed from the difference matrices, and the eigenvalues
 and eigenvectors are found through eigenvalue decomposition.
 These are then sorted in descending order with the highest
 eigenvalues representing the largest sources of variation in
 the structure. The eigenvectors generated by PCA represent
FIG. 7. Comparing angles in wireframe lattices. a) The an orthogonal basis for the reconstruction of every structure
mean structures of design 23 (top) and design 20 (bottom) from18 . visited during the trajectory, and these reconstructions can
The structures are designed to have a square and hexagonal lattice then be used for clustering of distinct sampled conformations.
pattern, respectively. b) The distribution of angles between two Finally, the PCA script outputs a .json file for the oxView
arms of a junction showing variation around the designed junction tool, which displays arrows on the structure corresponding
angle. For the hexagonal lattice, the observed angle is lower than to the sum of a user-defined number of components weighted
the designed angle of 60∘ because the structure has significant by their respective eigenvalues.
out-of-plane curvature in the simulation.
 To demonstrate the principal component analysis of
 DNA/RNA structures developed in this work, we ran it
 on a simulation of a Holliday junction (Fig. 10). As one
 would expect for this structure, PCA reveals strong collec-
 tive motion for the junction arms. The motion grows stronger
 at the ends of duplexes, while the crossover point shows little
 motion.
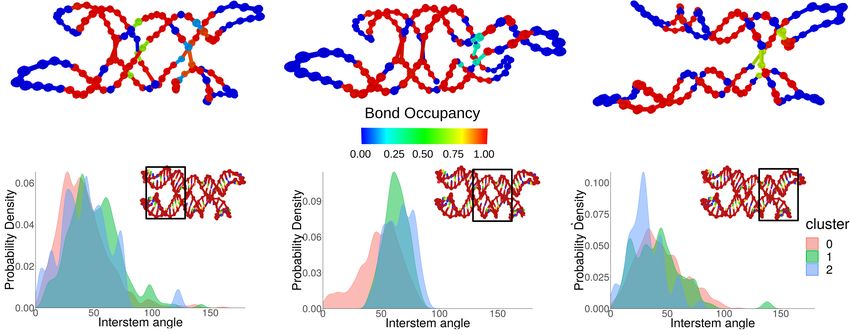
bioRxiv preprint doi: https://doi.org/10.1101/2020.01.24.917419. The copyright holder for this preprint (which was not peer-reviewed) is the
 author/funder. It is made available under a CC-BY-ND 4.0 International license.

 10

a)

b)

 FIG. 10. Principal Component Analysis of a Holliday
 junction. Principal component analysis of a Holliday junction
 visualized on oxView. Shown here is the top mode, which cor-
 responds to a scissoring motion in the junction, with the arm
 ends having significantly higher average displacement than the
 crossover point.

FIG. 9. Bond occupancy of an RNA tile. a) The hydrogen
bond occupancy during an oxRNA simulation, overlaid on a
structure of an RNA tile. The structure was known to form
poorly in the lab, and the simulation revealed significant strain on
one duplex. The structure used here is the centroid of a trajectory
based on the global fitting parameters discussed later. This was multiple distinct densities are observed.
used as a visualization instead of the mean structure, as the
unpaired duplex made the structure so flexible that the mean
 To demonstrate the utility of clustering using structural
structure collapsed. b) The broken duplex from the structure in
a was extended by one base pair, and the simulation was re-run. order parameters, we analyzed a simulation of an RNA tile
Shown here are the hydrogen bond occupancies overlaid on the structure (Fig. 11), that is known to form two distinct struc-
mean structure. In simulation, this significantly improved rigidity. tural isomers in experiment (unpublished results). In the
 simulation, two states were encountered, the correctly-folded
 structure, with three crossovers, and an unfolded structure, in
 which the paranemic cohesion68 between two of the crossovers
5. Unsupervised clustering of configurations encountered in is lost, leaving essentially a Holliday junction (Fig. 11). There
simulation are many potential order parameters that can be used to
 separate out these two structures. In this case, we chose
 The trajectories produced in an oxDNA/RNA simulation to work with the most aggregate data: each configuration’s
can be tens of gigabytes in size and explore an expansive position in principal component space.
amount of the configuration space available to the structure.
In cases where multiple metastable states are visited during The components produced by PCA represent a linearly
the trajectory, aggregate structural data, such as mean struc- independent basis for describing structures relative to the
tures or base pair occupancy, might not be representative of provided mean structure. This also means that every config-
the ensemble. This is due to the presence of these distinct uration used to compute the components can be mapped to
metastable states. Here, we once again use the DBSCAN a unique point in 3N-6 dimensional space. When applying
clustering algorithm53 , as implemented in SciKit Learn46 , to DBSCAN to the positions of configurations in this space, the
automatically extract geometrically distinct structures from distinct conformational isomers can be separated without
large trajectories and save them as new trajectory files that further processing. In addition to the two expected configura-
can be analyzed independently. The clustering algorithm tions, this method also separated out another cluster (cluster
can take any matrix of positions as an order parameter, 1 in Fig. 11) of structures where the paranemic cohesion
whether that be principal component coefficients of each was correctly formed, but stacking was interrupted at the
configuration, or simply the distance between two particles. nick point, resulting in a non-planar kinked structure. The
The DBSCAN algorithm is particularly good at clustering clustering script automatically produces separate trajectories
molecular simulation data where metastable states tend to for each of the identified clusters; these were further analyzed
form distinct clusters separated by a large energy barrier, using the angle script, identifying the distinct interduplex
such that observing transition states is relatively rare and angles between each duplex in the structures (Fig. 11b).
bioRxiv preprint doi: https://doi.org/10.1101/2020.01.24.917419. The copyright holder for this preprint (which was not peer-reviewed) is the
 author/funder. It is made available under a CC-BY-ND 4.0 International license.

 11

 Cluster 0 Cluster 1 Cluster 2
 a)

 b)

FIG. 11. Unsupervised clustering to isolate isomers of an RNA tile a) The three clusters found in a simulation of a
single-stranded RNA tile. The mean structure of each cluster was determined using MDS, and the hydrogen bond occupancy compared
with the original design was used as an overlay. b) Histograms of the angles found in each cluster showing the distinct structures found
in each cluster. The black frame on the tile snapshot indicates pairs of double-stranded RNA regions that were used to calculate the
interstem angle.

6. Other Utilities identifying properties or defects in a given design. Addi-
 tionally, we have found the visualization option useful for
 identifying excluded volume clashes during relaxations of
 In addition to the specific structural measures discussed
 large structures, as these cause extremely high total energies,
here, this package also contains additional utility functions
 which visually pop in oxView.
for processing and displaying data. The first are two scripts
 There are two further scripts that work with base pairs.
that utilize the SVD superimposer from Biopython45 for
 One takes the current arrangement of base pairs in the
improving visualizations. The superimposing script takes
 structure and generates either the designed pairs file used by
multiple configuration files that share the same topology and
 the base pair analysis script, or an oxDNA mutual trap force
returns them with their translations and rotations removed
 file, which can be used to enforce a particular base pairing
relative to the first configuration provided. We find this very
 configuration during relaxation. This can be particularly
helpful for comparing mean structures of similar designs or of
 helpful when relaxing multi-component structures edited in
the same design under different simulation conditions. There
 oxView, as the forces pulling stretched bonds back together
is also an alignment script, which takes a trajectory file and
 can cause unwanted fraying of base pairs in otherwise stable
aligns all configurations to the first one in the file. This
 structures. The second script converts oxDNA force files
makes for a much smoother visualization experience when
 into a designed pair file. The Tiamat converter from42 can
exploring trajectories in oxView or when making movies of a
 produce force files as part of the conversion process, and this
trajectory.
 script can convert those force files into the format needed for
 We have found the alignment scripts to be very useful for the duplex angle script.
producing figures and movies (see Supplementary video 5 and Finally, we provide a parallelization scheme for analyzing
Fig. 6a) and for making comparisons between designs. These oxDNA trajectories. The parallelization module breaks down
scripts are limited, however, by the need to align discrete a trajectory into a number of chunks equal to the number of
units. Therefore, the structures must have the same number CPUs you have available, and uses the Pathos Multiprocess-
of particles in mostly the same position. Thus, the scripts ing library47 to map trajectory chunks, CPUs, and functions.
are best used for comparing simulation conditions, changing If the user has enough computational resources available,
sequences, and changing crossover positions in designs. this facilitates analysis of even very large structures or long
 There is also a utility that reports the energy contribution trajectories in a matter of minutes. The implementation of
of every interaction in the model. This has options of a parallel functions is standardized across all scripts used here,
text output to check specific values, as well as an oxView and users are encouraged to follow the example given here
overlay showing the average energy of all nucleotides over the in developing further analyses specific to their own designs.
course of a simulation. Checking the base pairing or stacking Most of the analysis discussed fall into the class of tasks
interactions of specific nucleotides can be very helpful in known as ”embarrassingly parallel”, where there is no com-
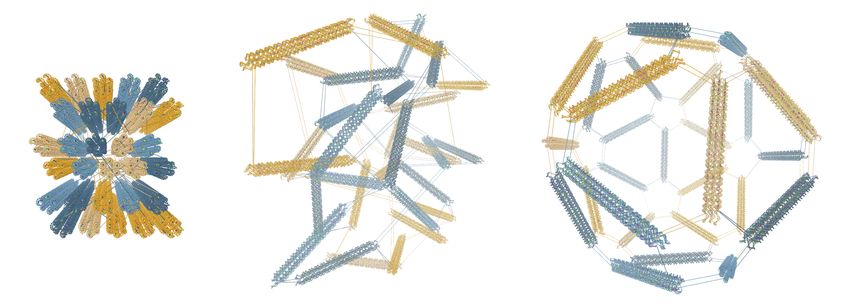
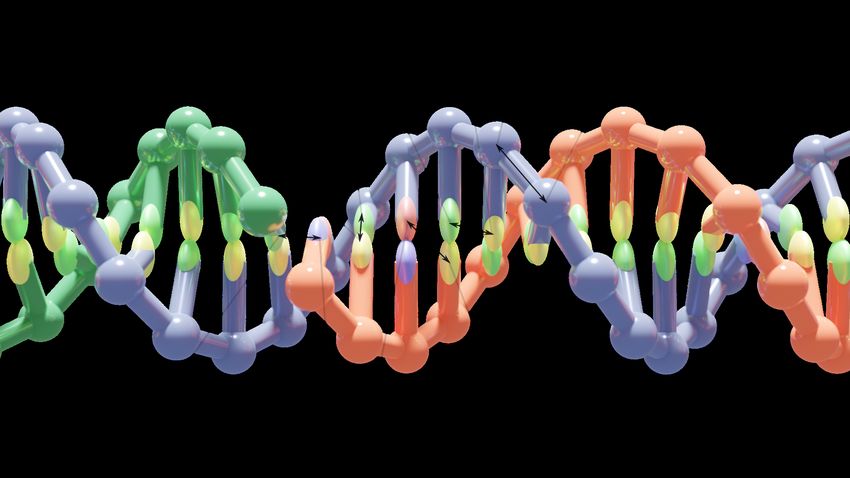
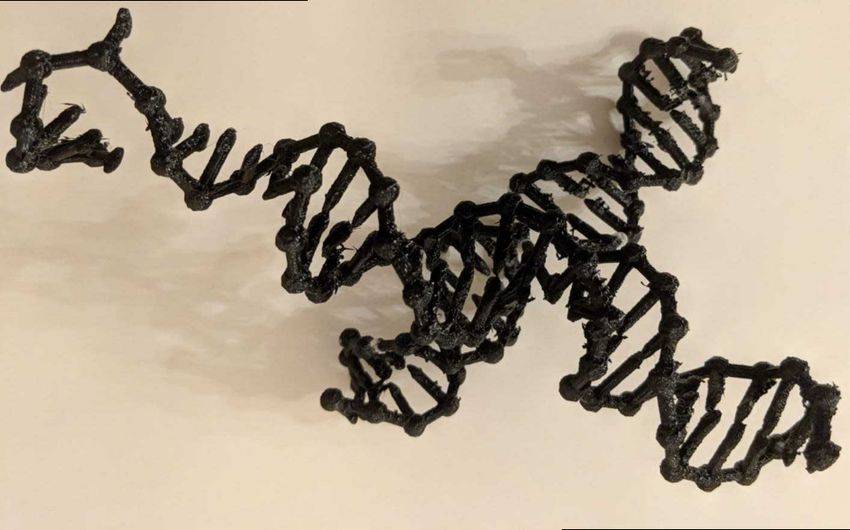
bioRxiv preprint doi: https://doi.org/10.1101/2020.01.24.917419. The copyright holder for this preprint (which was not peer-reviewed) is the
 author/funder. It is made available under a CC-BY-ND 4.0 International license.

 12

munication required between processes, and the final joining
step is relatively easy. For all structure analysis algorithms
described here, each configuration can be calculated indepen-
dently of all the others. The only limitations to paralleliza-
tion come from calculating split points in the trajectory and
if a data trajectory is required, combining the outputs to-
gether in the proper order. As an example, we benchmarked
parallelizing the computation of the mean structure of two
structures: one with 423 nucleotides, and the other with
11 385. In both cases, runtime decreased by more than a
factor of 10 when run on 30 CPUs compared with a single
CPU, with diminishing returns past that point.

IV. DISCUSSION FIG. 12. 3D printed Holliday junction exported from
 oxView. OxView supports export to GLTF format that can
 be opened in a 3D rendering tool Blender and exported to 3D
 We developed this collection of tools to remedy two gaps printers or used for creation of more artistic 3D figures of DNA
that we have perceived in the oxDNA software environment. and RNA nanostructures.
First is the lack of an all-in-one visualizer that loads files
within a reasonable timeframe, has a user-friendly UI, and
performs edits on structures that could then be further sim-
ulated. All-atom simulations have such tools in the form
of VMD, Chimera and PyMol. While tools exist to convert Hydrogen bond occupancy is a good proxy measure for the
between all-atom and oxDNA formats, this is a cumbersome amount of stress built up in a structure. Even with the speed
process that we felt could be remedied by the development and level of coarse-graining that oxDNA provides, modelling
of oxView. The use of hardware instancing allows oxView to assembly pathways for large structures remains out of reach
load structures of unprecedented sizes and facilitates our work for all but the most ambitious simulations69 . Because of this
on million-nucleotide oxDNA simulations of multi-origami limitation, we perform simulations with the assumption that
structures. Furthermore, because oxView is built using the the structure forms as designed, and initiate the simulation
open-source 3D library Three.js, opens the possibilities for with all hydrogen bonds present. Designed pairs that become
features from other Three.js projects to be added to oxView. unbonded or find different partners, particularly at junction
For example, virtual reality oxDNA visualization was easily points, are a good indication for points in the design that are
added by following the Three.js WebXR examples. Similarly, stressed and would benefit from iterative design. In general,
it is easy to export the visualized scene to other 3D formats, we found that successfully published structures had near
such as GLTF, for photorealistic rendering (Fig. 1) or 3D 100% bond occupancy, while those that were proving difficult
printing (Fig. 12). to obtain in the lab had regions with low occupancy.
 The features of oxView and simulation analysis tools are We demonstrated the functionality and versatility of these
designed to help researchers in DNA and RNA nanotech- tools by applying them to a range of DNA and RNA nanos-
nology to prototype in silico their structures, simplify the tructures, such as DNA and RNA origamis, as well as opti-
design and optimization process, and better understand the mizing and analyzing an RNA tile.
functioning of the designed structures. We demonstrated the
 All software discussed here is open-source and freely avail-
utility and versatility of the visualization and analysis tools
 able through our GitHub under the GNU Public License.
on multiple DNA and RNA nanostructure designs, ranging
 Pull requests, bug reports and feature suggestions are wel-
in size from hundreds to multiple thousands of nucleotides
 come, as we hope that these will provide fundamental support
per structure. We also demonstrated that the tools can, in
 long into the future. All tools that were introduced here are
principle, handle structures of sizes over a million nucleotides.
 documented on their respective GitHub repositories, with
 These tools, particularly mean structure calculation and
 examples of use.
hydrogen bond occupancy, provide significant utility for it-
erative design of nanostructures. In many structures where
unbounded growth is a goal, global curvature of the nanos-
tructure due to subtleties in crossover placement is a sig-
nificant bottleneck, that is difficult to solve using rational V. DATA AVAILABILITY
design principles. We have found that the curvature of mean
structures calculated from oxDNA simulations (unpublished
results) is a good predictor of lattice formation in the labora- The oxDNA simulation code is available online on the
tory. We also note that mean structures are the best proxy for oxDNA webpage dna.physics.ox.ac.uk. OxView is available
comparing simulations with cryo-EM structures, which have as a web-based application on github.com/sulcgroup/oxdna-
become important characterizations for 3D nanostructures viewer. The analysis package can be downloaded from
in the nucleic acid nanotechnology field. github.com/sulcgroup/oxdna analysis tools.
You can also read