2020 Fashion Industry Benchmarking Study - Technofashion ...
←
→
Page content transcription
If your browser does not render page correctly, please read the page content below
2020 Fashion Industry
                          Benchmarking Study
                                             — July 2020 —

                                                    By
                                               Dr. Sheng Lu
                                   Associate Professor
                          Department of Fashion & Apparel Studies
                                 University of Delaware

                                        in collaboration with the
                     United States Fashion Industry Association

1730 Rhode Island Avenue NW, Suite 312, Washington, D.C. 20006 | 202-419-0444 | www.usfashionindustry.com | @usfashion

                                         Fashion made possible by global trade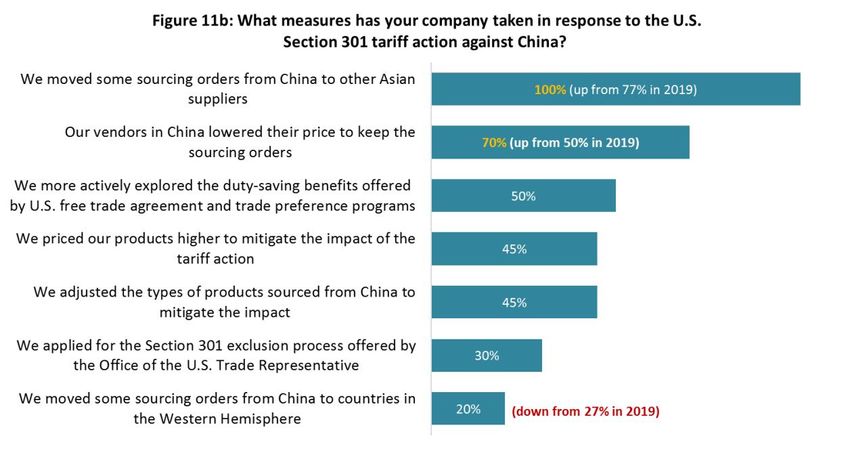
2020 Shakes Up the Sourcing and Business Outlook for the Fashion Industry

For everyone who is working from home, and spending the day at Zoom meetings, it will be no
surprise that the key findings of the 2020 Benchmarking Survey reflect the uncertainty facing all of
us every day. This is the seventh annual USFIA Fashion Industry Benchmarking Survey. This year
respondents are dealing with the economic and personal impact of the COVID-19 global pandemic as
well as expanding trade wars.

One of the questions in the survey every year asks brands and retailers what they think about the
five-year outlook for the fashion industry. This year we see the lowest level of confidence in the five
year outlook, and the highest number of respondents who are pessimistic. But even today, with so
much uncertainty about the future, more than one-half (57%) of respondents say they are optimistic
or somewhat optimistic. I see that number as a reflection of the confidence among sourcing
executives that we can navigate these difficult times and remain connected with our customers.

A major contribution to this confidence in the long-term outlook for the fashion industry remains the
essential partnerships between brands, retailers and suppliers around the world. The current global
crises highlights something that we have talked about for years – the need for real partnerships
throughout the supply chain. Every fashion company is faced with supply chain disruptions. Many
companies have restructured, or are in the process of restructuring. And of course many well-loved
brands and retailers are working through bankruptcy. Manufacturers around the world face the
same issues and disruptions. So it is more important than ever for fashion companies to work with
their suppliers to meet the key sourcing goals of speed-to-market, flexibility and agility, sourcing cost
control and low compliance risks.

Our mission at USFIA remains to support the fashion industry with analysis, education and training,
and also to advocate for trade policy that supports Fashion Made Possible with Global Trade.
These days we are holding virtual meetings and only see each other via Zoom, but we continue to
provide key insights and analysis about the issues facing the fashion industry.

Thanks to Dr. Sheng Lu, Associate Professor in the University of Delaware’s Department of Fashion &
Apparel Studies, for his hard work to analyze the data and develop these important conclusions. And
special thanks to the sourcing executives who shared your views and your insights.

With best regards,

Julia K. Hughes
President
U.S. Fashion Industry Association
Executive Summary

The overwhelming majority of respondents report “economic and business impacts of the
coronavirus (COVID-19)” as their top business challenge in 2020. The business difficulties
caused by COVID-19 will not go away anytime soon, and U.S. fashion companies have to
prepare for a medium to the long-term impact of the pandemic.
• COVID-19 has caused severe supply chain disruptions to U.S. fashion companies. The disruptions
   come from multiple aspects, ranging from a labor shortage, shortages of textile raw materials,
   and a substantial cost increase in shipping and logistics.
• COVID-19 has resulted in a widespread sales decline and order cancellation among U.S. fashion
   companies. Almost all respondents (96 percent) expect their companies’ sales revenue to
   decrease in 2020.
• As sales drop and business operations are significantly disrupted, not surprisingly, all
   respondents (100 percent) say they more or less have postponed or canceled sourcing orders.
   Nearly half of self-identified retailers say the sourcing orders they canceled or postponed go
   beyond the 2nd quarter of 2020. Another 40 percent expect order cancellation and postponement
   could extend further to the fourth quarter of 2020 or even beyond. The order cancellation or
   postponement has affected vendors in China, Bangladesh, and India the most.
• Respondents say they are trying multiple approaches to mitigate the financial impact of COVID-
   19 as much as they can, including exploring alternative sourcing options, leveraging free trade
   agreement or trade preference programs, and taking advantage of customs rules like duty
   drawback and first sale for export.

Affected by COVID-19 and the worsened business environment, respondents are more
conservative about the outlook of the fashion industry in the next five years.
• Those who feel optimistic or somewhat optimistic about the next five years swiftly fell from 65.3
    percent in 2019 to a new low of 57.9 percent. In comparison, nearly one-third of respondents
    hold a pessimistic or somewhat pessimistic view about the future of the fashion industry, the
    highest since we launched the survey in 2014.
• The job market appears to be the sole positive aspect of the U.S. fashion industry during the
    pandemic. Nearly 90 percent of respondents still plan to increase hiring in the next five years,
    which is similar to the results last year and much higher than around 80 percent during 2014-
    2017.

COVID-19, together with the escalating U.S. trade war with China, has exerted significant and
broad impacts on U.S. fashion companies’ sourcing practices.
• The “increasing production and sourcing cost” is ranked as the 4th top business challenge facing
   respondents in 2020. Notably, for the second year in a row, respondents say “shipping and
   logistics” is their top cost concern in 2020. Further, as high as 90 percent of respondents
   explicitly say, the U.S. Section 301 action against China has increased their company’s sourcing
   cost in 2020, up from 63 percent last year.
• COVID-19 and the trade war are pushing U.S. fashion companies to reduce their “China exposure”
   further. While “China plus Vietnam plus Many” remains the most popular sourcing model among
   respondents, around 29 percent of respondents indicate that they source MORE from Vietnam
   than from China in 2020, up further from 25 percent in 2019.
• As U.S. fashion companies are sourcing relatively less from China, they are moving orders mostly
   to China’s competitors in Asia. All respondents (100 percent) say they have “moved some
   sourcing orders from China to other Asian suppliers” this year, up from 77 percent in 2019.

                                            Page 1 of 49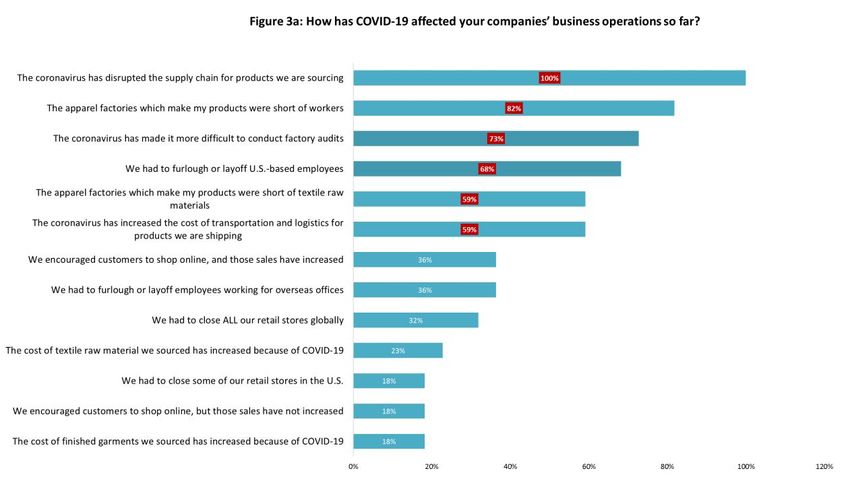
• However, no clear evidence suggests that U.S. fashion companies are sourcing more from the
Western Hemisphere because of COVID-19 and the U.S.-China trade war.
U.S. fashion companies are NOT ignoring sustainability in sourcing despite facing unpresented
financial and operational challenges during the pandemic.
• Over 70 percent of respondents this year say they plan to allocate MORE resources to the area of
sustainability and social compliance through 2022, which is even higher than 63 percent in our
2019 survey.
• Reflecting companies’ commitments to sourcing in sustainable and socially compliant ways, the
vast majority of respondents say their company maps the supply chains (i.e., keep records of
name, location, and function of suppliers.)
• Respondents identify “suppliers not being fully cooperative or willing to share information,” “the
special nature of the textile and apparel industry makes it not practical to gain visibility beyond
the 1st tier supplier,” and “insufficient internal budget/staff to map supply chain” as the top
challenges for mapping supply chains.
• All respondents say they audit their suppliers. Around 65 percent of respondents say they use
BOTH third-party certification programs and companies’ in-house compliance team, a notable
increase from last year (50 percent).
• U.S. fashion companies are actively exploring new approaches to improve sustainability and
social compliance in sourcing, including contributing to the building of a circular economy.
In response to the changing business environment, U.S. fashion companies will continue to
adjust their sourcing bases and sourcing practices.
• Sourcing diversification is slowing down, and more U.S. fashion companies are switching to
consolidate their existing sourcing base. Close to half of the respondents say they plan to “source
from the same number of countries, but work with fewer vendors,” up from 40 percent in last
year’s survey.
• Companies will continue to adjust their sourcing bases but on a more modest scale than in the
past. For the first time since we launched the survey in 2014, NONE of the respondents plans to
substantially increase sourcing volume from ANY particular country or region in the world. This
extraordinary result reminds us of the severity of the current economic crisis facing U.S. fashion
companies and suggests the post-COVID economic recovery could be a long slow climb.
• China most likely will remain a critical sourcing base for U.S. fashion companies. However, non-
economic factors, such as the reported forced labor in Xinjiang, could complicate companies’
sourcing decisions.
• Benefiting from U.S. fashion companies’ reduced sourcing from China, Vietnam and Bangladesh
are expected to play a more significant role as primary apparel suppliers for the U.S. market.
• Given the supply chain disruptions experienced during the pandemic, U.S. fashion companies are
more actively exploring “Made in the USA” sourcing opportunities to improve agility and
flexibility and reduce sourcing risks. Around 25 percent of respondents expect to somewhat
increase sourcing locally from the U.S. in the next two years, which is the highest level since 2016.
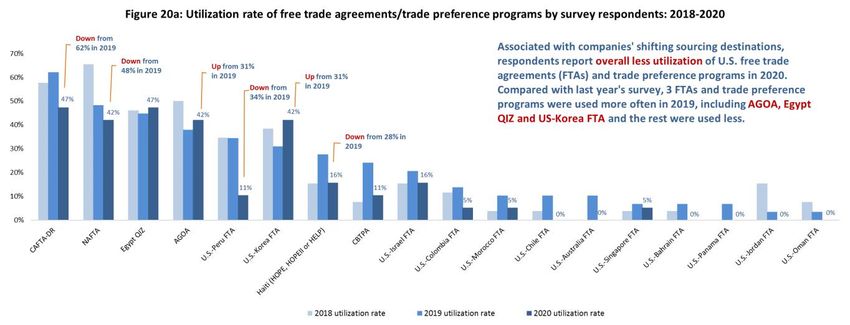
Associated with companies' shifting sourcing patterns, respondents report overall less
utilization of U.S. free trade agreements (FTAs) and trade preference programs so far in 2020.
• Compared with last year's survey, only three FTAs and trade preference programs were used
more often, including the African Growth and Opportunity Act (AGOA), Egypt Qualifying
Industrial Zones (QIZ), and the U.S.-Korea Free Trade Agreement (KORUS).
• One major factor contributing to the less usage of FTAs and preference programs this year is U.S.
fashion companies’ reduced sourcing volume from these FTAs and preference program members.
Page 2 of 49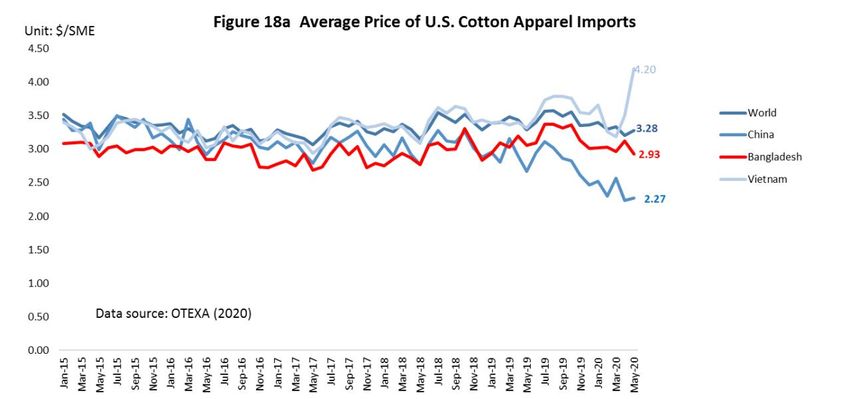
Nationwide, the share of U.S. apparel imports entering under FTAs dropped to only 15.1 percent
    in the first five months of 2020, the lowest since 2008.
•   We still find that some U.S. fashion companies, for whatever reason, do not always claim the duty-
    free benefits even when sourcing from member countries of a free trade agreement or trade
    preference program. The restrictive rules of origin (ROO) remain the most cited reason why U.S.
    fashion companies do not use FTAs more often for apparel sourcing purposes.

Respondents demonstrate more readiness and interest in using the US-Mexico-Canada
Trade Agreement (USMCA) for apparel sourcing purposes in this year’s survey.
• For companies that were already using NAFTA for sourcing, the vast majority (77.8 percent) say
   they are “ready to achieve any USMCA benefits immediately,” up more than 31 percent from
   2019.
• Even for respondents who were not using NAFTA or sourcing from the region, about half of them
   this year say they may “consider North American sourcing in the future” and explore the USMCA
   benefits.
• Some respondents expressed concerns about the rules of origin changes. These worries seem to
   concentrate on denim products in particular.

Respondents’ enthusiasm for using the African Growth and Opportunity Act (AGOA) and
sourcing from sub-Saharan African (SSA) countries rebound.
• Close to 37 percent of respondents say they have been sourcing MORE textile and apparel from
   the SSA region since its renewal in 2015, a substantial increase from 27 percent in the 2019
   survey.
• More than 40 percent of respondents say AGOA and its “third-country fabric provision” are
   critical for their sourcing from the SSA region.
• However, respondents still demonstrate a low level of interest in investing in the SSA region
   directly. Around 27 percent of respondents say the temporary nature of AGOA and the
   uncertainty associated with the future of the agreement have discouraged them.
• With AGOA’s expiration date quickly approaching, the discussions on the future of the agreement
   and the prospect of sourcing from SSA begin to intensify. Among the various policy options to
   consider, “Renew AGOA for another ten years with no major change of its current provisions” and
   “Replace AGOA with a permanent free trade agreement that requires reciprocal tariff cut and
   continues to allow the third-country fabric provision” are the most preferred by respondents.

                                            Page 3 of 49
I. Business Environment in the U.S. Fashion Industry

Top Business Challenges in 2020

Table 1: Top Business Challenges for the U.S. Fashion Industry: Rank in 2020 vs. 2019
Top Business Challenges for the U.S. Fashion Industry in 2020                                 Rank in 2019 Rank in 2020 vs. in 2019
#1 Economic and business impacts of the coronavirus disease (COVID-19)                               /        New challenge
#2 Managing supply chain risks                                                                       3        No major change
#3 Protectionist trade policy agenda in the United States                                            2        No major change
#4 Increasing production or sourcing cost                                                            1        Less important
#5 Economic outlook in developed economies                                                          11        More important
#6 Finding a new sourcing base other than China                                                      5        No major change
#7 Compliance with trade regulations                                                                12        More important
#8 Investing in and updating technology                                                              4        Less important
#9 Meeting consumers’ demand                                                                         8        No major change
#10 Market competition from E-commerce                                                               6        Less important
#11 Economic outlook in emerging markets                                                            10        No major change
#12 Market competition in the United States from brick and mortar stores                             7        No major change
#12 Political tensions in developing countries                                                      15        No major change
#12 Market competition in markets other than the United States                                      14        No major change
#12 Protectionist trade policy agendas in countries other than the United States                     9        Less important
#12 Protecting your company’s intellectual property                                                 17        No major change
#12 Human resources (HR) issues, including talent recruitment and retention                         16        No major change
#18 Currency value and impact of exchange rates on competitiveness or profitability                 13        Less important
Note: Total score for each business issue is calculated based on weighted average as follows: 1 st importance =5 points, 2 nd importance =4
points, 3 rd importance=3 points, 4 th importance=2 points and 5 th importance=1 point.

                                                             Page 4 of 49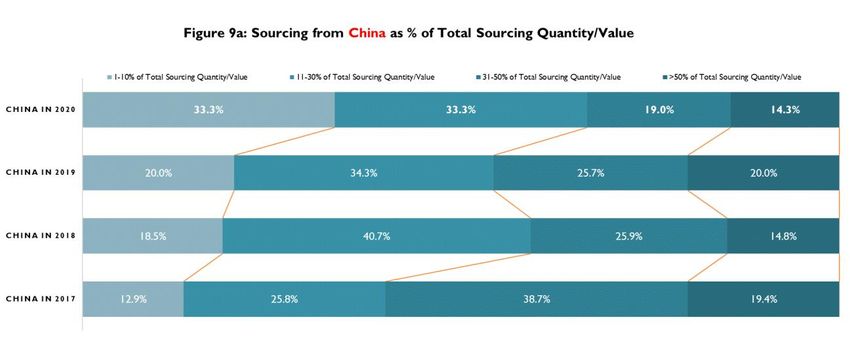
Every year, we ask respondents to select the top five challenges facing their businesses and rank
these issues in order of significance. As shown in Figure 1 and Table 1, the results in 2020 reveal the
unpresented challenge of the coronavirus (COVID-19) and the ongoing trade tensions on fashion
companies’ business operations. Specifically:

First, the overwhelming majority of respondents report “economic and business impacts of
the coronavirus (COVID-19)” as their top business challenge in 2020. As much as 54 percent of
respondents rate the issue as their 1 st or 2nd top business challenge this year, which far exceeds the
concerns for other topics on the list. This result echoes the daunting official economic data: the value
of U.S. Gross Domestic Product (GDP) decreased at an annual rate of 4.8 percent in the first quarter of
20201. Clothing retail sales in the U.S. shrank by over 40.8 percent in the first five months of 2020
compared with a year ago; 2Also, from January to May 2020, the value of U.S. apparel imports
decreased by 27.8 percent year over year, which has been much worse than the performance during
the 2008-2009 global financial crisis (down 11.8 percent).3 Several other recent studies also suggest
that COVID-19 could be the most severe threat to the world economy since the 1930’s great
depression, and fashion apparel is one of the sectors that have been hit the hardest. 4

Second, for three years in a row, respondents rate “the protectionist trade policy agenda in
the United States” as one of their top three business challenges. Notably, since we released our
last Benchmarking Study in July 2019, the Trump Administration has taken numerous new trade-
restrictive measures that have affected textile and apparel products directly. For example, U.S.
fashion companies paid $1,424 million more import duties in 2019 than 20185 because of the U.S.
Section 301 tariff action against imports from China, and the U.S. retaliatory tariffs on imports from
the European Union (EU).6 Other unilateral trade restrictions, such as the U.S. Section 232 action on
steel and aluminum imports, have also intensified the U.S. trade relations with its major trading
partners and created new uncertainties for fashion companies’ global operations.7

Third, several other top concerns to U.S. fashion companies in 2020 reflect the joint effect of
COVID-19 and the protectionist U.S. trade policy measures against imports. For example,
consistent with the results last year, respondents rate “Managing supply chain risk” and
“increasing production and sourcing cost” as their 2nd and 4th top business challenge in 2020,
respectively. Likewise, “findings a sourcing base other than China” and “compliance with trade
regulations” are also among the top business challenges this year. In comparison, some conventional
business challenges are regarded as relatively less pressing this year, such as market competition
and the urgency of investing and updating technologies.

1 U.S. Bureau of Economic Analysis, BEA (2020). Gross domestic product, 1st quarter 2020. Retrieved from
https://www.bea.gov/news/2020/gross-domestic-product-1st-quarter-2020-advance-estimate
2 U.S. Census Bureau (2020). Monthly retail trade. Retrieved from https://www.census.gov/retail/index.html
3 Office of Textiles and Apparel, OTEXA (2020). U.S. imports and exports of textiles and apparel. Retrieved from
https://otexa.trade.gov/msrpoint.htm
4 Antonella Teodoro and Luisa Rodriguez. (2020). Textile and garment supply chains in times of COVID-19: Challenges
for developing countries. United Nations Conference on Trade and Development (UNCTAD). Retrieved from
https://unctad.org/en/pages/newsdetails.aspx?OriginalVersionID=2380 ;
International Labor Organization. (2020). COVID-19 and the textiles, clothing, leather and footwear industries.
Retrieved from https://www.ilo.org/sector/Resources/publications/WCMS_741344/lang--en/index.htm
5 U.S. International Trade Commission, USITC (2020). Dataweb. Retrieved from https://dataweb.usitc.gov/trade
6 Office of the US Trade Representative, USTR (2020). 2020 trade policy agenda and 2019 annual report. Retrieved
from https://ustr.gov/sites/default/files/2020_Trade_Policy_Agenda_and_2019_Annual_Report.pdf
7 Ibid

                                                  Page 5 of 49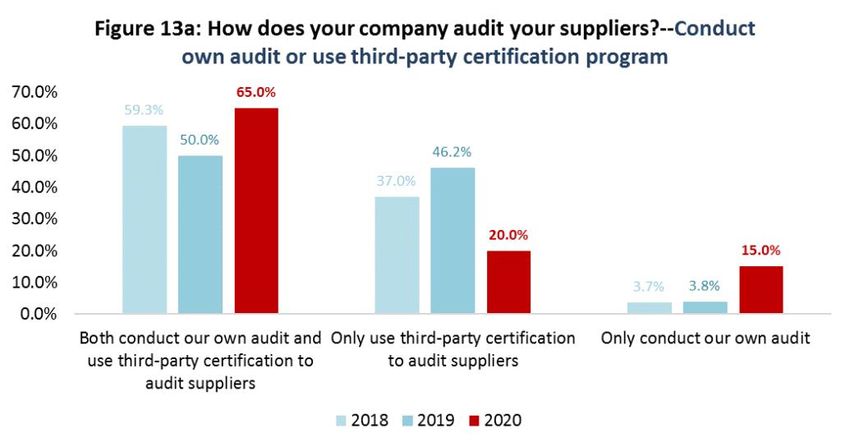
Industry Outlook for the Next Five Years

Affected by COVID-19 and the worsened business environment, respondents are more
conservative about the outlook of the fashion industry in the next five years. Specifically,
those who feel optimistic or somewhat optimistic about the next five years swiftly fell from 64.3
percent in 2019 to a new low of 57.9 percent (Figure 2). In comparison, nearly one-third of
respondents hold a pessimistic or somewhat pessimistic view about the future of the U.S. fashion
industry, the highest since we launched the survey in 2014. The result suggests that U.S. fashion
companies anticipate COVID-19, and possibly trade tensions, too, will have a long-term impact
on their business operations.

Impact of COVID-19 on U.S. Fashion Companies’ Business Operations

                                           Page 6 of 49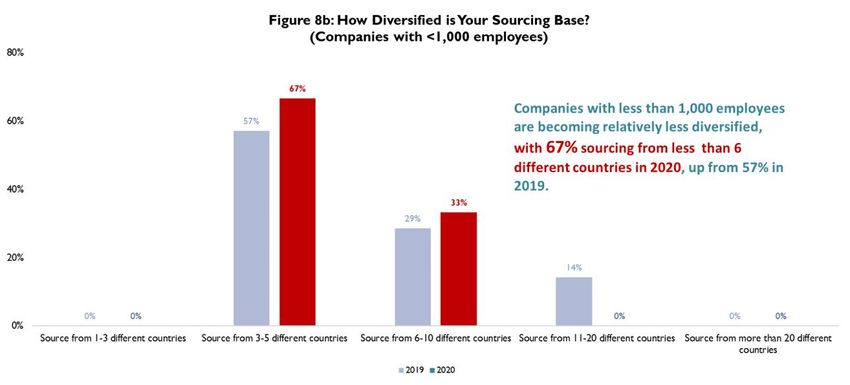
Respondents suggest that COVID-19 has exerted immense pressure on their companies’
business operations in 2020. Specifically:

First, COVID-19 has caused severe supply chain disruptions to U.S. fashion companies. As
detailed in Figure 3a, respondents unanimously (100 percent) report “supply chain disruption” as
the most significant impact of COVID-19 on their business operations. Notably, the supply chain
disruption caused by COVID-19 comes from multiple aspects. For example, over 80 percent of
respondents say the garment factories that make their products were struggling with a labor
shortage. Another 73 percent of respondents say they had difficulty in conducting regular factory
audits because of COVID-19. Further, 59 percent of respondents say their contracted garment
factories were short of textile raw materials or facing a substantial cost increase in shipping and
logistics. As one respondent commented, “Securing textile raw materials and production capacity has
been highly challenged due to the need to implement extended payment terms, etc.” Another said,
“Coronavirus (COVID-19) has limited us to continue fabric collections we've developed in past seasons as
ongoing fabrics were limited or unavailable due to mill closures. This is important for our business as we
often base our collections off of these stories.”

Second, COVID-19 has resulted in a widespread sales decline and order cancellation among
U.S. fashion companies. As shown in Figure 3b, almost all respondents (96 percent) expect their
companies’ sales revenue to decrease in 2020, reflecting the across the board impact of COVID-19 on
the U.S. fashion industry. Regarding the extent of sales decline in 2020, around half of the
respondents report an 11-30 percent drop, and another 40 percent expect sales revenue to contract
by more than 30 percent. However, there is no clear pattern between the size of the company and
the anticipated sales decline.

As sales drop and business operations significantly disrupted, not surprisingly, all
respondents (100 percent) say they more or less have postponed or canceled sourcing orders.
Two patterns are worth noting: On the one hand, the extent of order cancellation or
postponement seems to be modest so far. As shown in Figure 4a, the majority (over 60 percent)
of self-identified retailers say they have only canceled or postponed less than 30 percent of their total
sourcing orders due to COVID-19. Meanwhile, around 50 percent of self-identified fashion brands
and wholesalers also confirm that less than 30 percent of their shipping orders got canceled or

                                              Page 7 of 49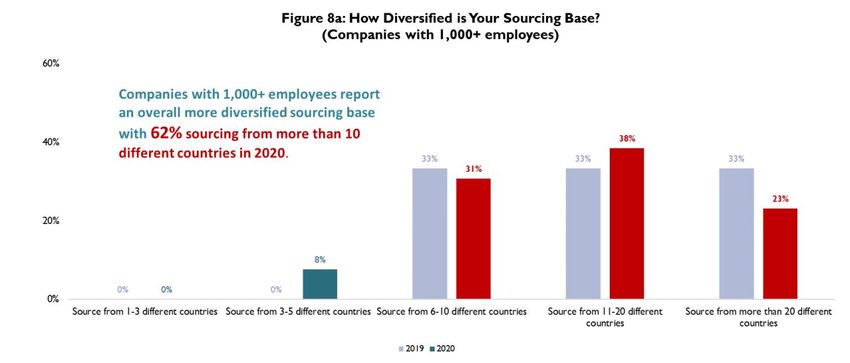
postponed as of early June 2020. This result is consistent with the findings of other recent industry
surveys, which suggest that in the first five months of 2020, textile and apparel factories worldwide,
on average, suffered around 30-40 percent order cancellation. 8

On the other hand, as shown in Figure 4b, nearly half of self-identified retailers say the sourcing
orders they canceled or postponed go beyond the 2 nd quarter of 2020. Another 40 percent expect
order cancellation and postponement could extend further to the fourth quarter of 2020 or even
beyond. The result reminds us that the business difficulties caused by COVID-19 will not go
away anytime soon, and U.S. fashion companies have to prepare for a medium to the long-
term impact of the pandemic.

8International Textile Manufacturers Federation, ITMF (2020). 4th ITMF-survey about the impact of the Corona-
pandemic on the global textile industry. Retrieved from https://www.itmf.org/images/dl/press-
releases/2020/Corona-Survey-4th-2020.06.18-Press-Release.pdf
                                                 Page 8 of 49
(note: the numbers in Figure 4c only include those respondents that have canceled/postponed sourcing
orders or plan to do so)
Third, the results show that U.S. fashion companies’ order cancellation or postponement has
affected vendors in China, Bangladesh, and India the most. As indicated in Figure 4c, over 60
percent of respondents say they have canceled or postponed sourcing orders from these three
sourcing destinations, compared with 45-10 percent of other regions of the world. Two factors could
be related to the phenomenon. One is the size effect—as the top apparel suppliers to the U.S. market,
these three countries are often used to fulfill large-volume sourcing orders. In the current situation,
however, fashion brands and retailers are most likely to cancel these large-quantity orders.
Meanwhile, U.S. apparel imports from these three countries currently cover almost all major product
categories – which makes them, particularly China, the most exposed to order cancellation. 9 It is also
interesting to note that respondents seem to be more “careful” about canceling orders coming from
Vietnam, which is widely regarded as the “Next China” for apparel sourcing.10 (Note: Please check
the second part of the report, which provides a detailed analysis of the impact of COVID-19 on U.S.
fashion companies’ sourcing strategies.)
Fourth, as a reflection of the resilience of the U.S. fashion industry, respondents say they are
trying multiple approaches to mitigate the financial impact of COVID-19 as much as they can.
As shown in Figure 4d, the most commonly adopted strategies include exploring alternative sourcing
options (68 percent), leveraging free trade agreement or trade preference programs (45 percent),
and taking advantage of customs rules like duty drawback and first sale for export (41 percent).
However, very few respondents (only 5 percent) say they have benefited from the Trump
Administration’s 90-day import duty-deferral program launched in April 2020 due to its restrictive
eligibility criteria and short window for application.11 Furthermore, over 40 percent of respondents
9 Lu, Sheng. (2020). Covid-19 – The worst-case scenarios for apparel sourcing. Just-Style. Retrieved from
https://www.just-style.com/analysis/covid-19-the-worst-case-scenarios-for-apparel-sourcing_id138428.aspx
10 Textile Outlook International. (May 2020). Editorial: The global textile and apparel industry post-lockdown. No.203,
4-17. Textile Intelligence Limited.
11 On April 18, 2020, President Trump signed an Executive order, which announced to offer a 90-day deferment
period on certain payments for importers who have “faced a significant financial hardship due to COVID-19.”
Page 9 of 49say they have been trying three or more different approaches to mitigate the financial impacts of
COVID-19. No single measure alone seems to be sufficient enough to help companies survive the
pandemic.
Table 2 How Does Your Company Plan to Deal With Obsolete Products?
Plans %
My company has thought about this and will likely sell obsolete inventory to 41%
liquidators like TJ Maxx at some point
My company has thought about this and is planning extreme sales (70%-85% off 32%
the regular selling price) once stores reopen
My company has not given this much thought but is looking for ideas 23%
My company will likely send the goods back to vendors 5%
Additionally, U.S. fashion companies have been exploring ways to deal with their unsold or
obsolete products caused by COVID-19 store closures. As shown in Table 2, the most popular
approach among respondents is to “sell obsolete inventory to liquidators like TJ Maxx” (41 percent).
Another 32 percent of respondents say they are planning “extreme sales” (i.e., 70-85 percent off the
regular selling price) to clear the stock and improve their cash flows. Around one-fourth of
respondents say they are still open for ideas.
Demand for Human Talents in the Next Five Years
The job market appears to be the sole positive aspect of the U.S. fashion industry during the
pandemic. Nearly 90 percent of respondents still plan to increase hiring in the next five years,
which is similar to the results last year and much higher than around 80 percent during 2014-2017.
Respondents’ hiring plan also reveals their overall confidence in the post-COVID economic recovery
in the near and medium-term, should we control the pandemic later this year.
However, imports subject to U.S. trade remedy measures, including anti-dumping, section 301, section 201 and
section 232 are not eligible. For more, please see https://www.cbp.gov/newsroom/national-media-
release/treasury-and-cbp-announce-deferment-duties-and-fees-certain
Page 10 of 49However, as we find in the past, companies’ hiring plans continue to be quite unequal between
different types of positions. As shown in Figure 5, five types of positions, including
sustainability/social compliance related specialists or managers, market analysts, supply
chain (including logistics) specialists, sourcing specialists, and data scientists, will be most in-
demand over the next five years. Meanwhile, fashion companies are least likely to hire sewing
machine operators and general management administrators in the same time frame. In
particular, a record high of 21 percent of respondents plans to cut positions for general
administrators through 2025, compared with only 11 percent in the last two years’ surveys.
Overall, the contrasting demand for different types of talent reflects companies’ business priorities in
the years ahead and illustrates the changing nature of the U.S. fashion industry, which is
becoming ever more globalized, supply-chain based, technology-intensive, and data-driven. 12
As companies continue to invest in new digital technologies and innovate their business models by
leveraging tools such as big data, further structural change in the fashion job market can be highly
expected.
12 Imran Amed, Anita Balchandani, Achim Berg, Saskia Hedrich, Shrina Poojara, and Felix Rölkens. (2019). The State
of Fashion 2020: Navigating uncertainty. Mckinsey & Company. Retrieved from
https://www.mckinsey.com/industries/retail/our-insights/the-state-of-fashion-2020-navigating-uncertainty
Page 11 of 49II. Sourcing Practices in the U.S. Fashion Industry
Sourcing base and sourcing portfolio
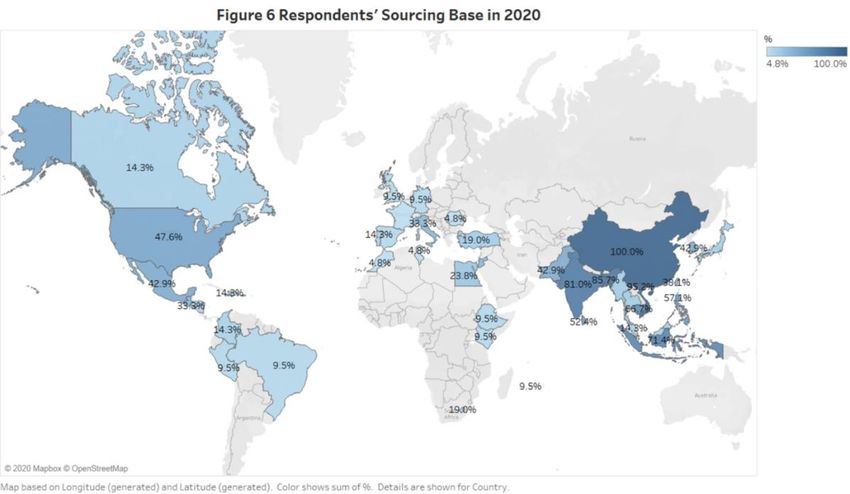
Note: Respondents were asked to select all sourcing destinations they are currently using. The utilization rate shown in
the above map is calculated by dividing the frequency of each country’s utilization by the total number of respondents.
Reflecting the U.S. fashion industry’s global reach, respondents report sourcing from as many
as 45 countries or regions in 2020, close to 48 in 2019 (Figure 6). Matching with the official U.S.
trade statistics, China (100 percent of respondents), Vietnam (95.2 percent of respondents) and
Bangladesh (85.7 percent of respondents) are the top three most-utilized sourcing destinations,
followed by India (81.0 percent), Indonesia (71.4 percent), Cambodia (66.7 percent), Philippines
(57.1 percent) and Sri Lanka (52.4 percent).
Page 12 of 49Despite the changing business environment, Asia’s position as the dominant sourcing base for
U.S. fashion companies remains unshakeable. As shown in Figure 7, the same as what we found in
the past three years, almost all the top ten most-utilized sourcing destinations in 2020 are Asian
countries, except the United States (rank #9) and Mexico (rank #10). Several of these top Asian
sourcing destinations also see a higher utilization rate in 2020 than a year ago, including Vietnam
(up 9.5 percentage points), Bangladesh (up 25.7 percentage points), Sri Lanka (up 4.8 percentage
points), and Cambodia (up 3.8 percentage points).
Sourcing diversification and sourcing portfolio
U.S. fashion companies typically source from multiple countries to balance the needs for sourcing
cost, speed, reliability, flexibility, and risk control.13 This year, we find respondents’ sourcing
diversification strategies include both continuities and changes:
13Gereffi, G. (2019). The regional dynamics of global trade: Asian, American, and European models of apparel
sourcing. In The Dialectics of Globalization (pp. 31-62). Routledge.
Page 13 of 49First, most respondents continue to maintain a relatively diverse sourcing base, with 42.1
percent currently sourcing from 10+ different countries or regions. However, this figure was notably
lower than the last three years (57.1 percent in 2019, 60.7 percent in 2018, and 57.6 percent in
2017), suggesting some U.S. fashion companies are switching to consolidate their sourcing bases as
part of their corporate business strategy in response to the changing market environment.14
Second, larger companies, in general, continue to be more diversified in sourcing than smaller
companies. As shown in Figures 8a and 8b, around 60 percent of respondents with 1,000+
employees report sourcing from 10+ different countries or regions in 2020, including 23 percent
importing from 20+ different countries or regions. Meanwhile, the vast majority (67 percent) of
respondents with less than 1,000 employees report sourcing from only 3-5 different countries
or regions. None of these relatively small companies is sourcing from 10+ different countries or
regions in 2020, down from 14 percent last year.
Table 3 What Does Your Company's Sourcing Portfolio Look Like in 2020?
>50% of 31-50% of 11-30% of 1-10% of
Total Sourcing Total Sourcing Total Sourcing Total Sourcing
Sourcing Destinations Quantity/Value Quantity/Value Quantity/Value Quantity/Value Do Not Source There
USA 0% 0% 0% 43% 57%
China 14% 19% 33% 33% 0%
Vietnam 10% 10% 52% 29% 5%
Bangladesh 5% 5% 48% 33% 10%
Elsewhere in Asia 5% 5% 43% 43% 5%
Europe 0% 0% 14% 14% 71%
Turkey 0% 5% 5% 14% 76%
Canada 0% 0% 0% 10% 90%
Mexico 0% 0% 10% 29% 62%
South & Central America 0% 0% 0% 55% 45%
Africa 0% 0% 0% 33% 67%
Middle East 0% 0% 0% 43% 57%
14Achim Berg, Saskia Hedrich, Patricio Ibanez, Sara Kappelmark, and Karl-Hendrik Magnus. (2019). Fashion’s new
must-have: Sustainable sourcing at scale. Mckinsey & Company. Retrieved from
https://www.mckinsey.com/industries/retail/our-insights/fashions-new-must-have-sustainable-sourcing-at-scale
Page 14 of 49Third, “China plus Vietnam plus Many” remains the most popular sourcing model among
respondents. However, the details of this model continue to evolve, as shown in Table 3 and Figures
9a and 9b. Specifically:
• China and Vietnam combined now typically account for 40-60 percent of U.S. fashion
companies’ total sourcing value or volume. Notably, while China remains the most utilized
sourcing base, the country is no longer always the top supplier for U.S. fashion companies.
Around 29 percent of respondents indicate that they source MORE from Vietnam than
from China in 2020, up further from 25 percent in 2019.
• Other than China and Vietnam, U.S. fashion companies also source from a few other countries,
and each additional country, including the United States, typically accounts for less than 10
percent of a company’s total sourcing value or volume (Table 3). This practice has stayed stable
since 2016.
Impact of COVID-19 and the U.S.-China Trade War on Sourcing
Results show that COVID-19, together with the escalating U.S. trade war with China,15 has exerted
significant and broad impacts on U.S. fashion companies’ sourcing practices.
15As of July 2020, the Trump Administration has taken five major Section 301 tariff actions against China.
Approximately two-thirds of U.S. imports from China are subject to increased Section 301 tariffs, ranging from 7.5%-
25%. For details, please see Andres Schwarzenberg. (2020). Section 301 of the Trade Act of 1974. Congressional
Research Service. Retrieved from https://crsreports.congress.gov/product/pdf/IF/IF11346
Page 15 of 49First, COVID-19 and the trade war have increased U.S. fashion companies’ sourcing costs,
especially regarding shipping and logistics. The “increasing production and sourcing cost” is
ranked as the 4th top business challenge facing respondents this year (was #1 in 2019). As shown in
Figure 10a, the overall cost pressure in 2020 is less overwhelming than last year, thanks to the
relatively lower price of textile raw materials, such as cotton16 and polyester.17 However, the cost
pressure is NOT gone—still, as much as 71 percent of respondents expect their production and
sourcing cost will continue to rise in 2020. As one respondent commented, “Trade war increased cost
in China and created uncertainty. Coronavirus really didn't cause a shift in strategy, it was already in
place due to the cost of tariffs.”
As shown in Figure 10b, respondents identify “shipping and logistics cost,” “labor cost,” and
“cost related to compliance with the factory, social and environmental standards” as the top
three factors that lead to the increase of sourcing costs in 2020. Notably, for the second year in a
row, respondents say “shipping and logistics” is their top cost concern in 2020. Around one-third of
respondents expect their shipping and logistics costs to “substantially increase” in 2020, which is
even worse than the case last year (was 10 percent).
16 Cotton Incorporated. (2020). Cotton market fundamentals & price outlook (July 2020). Retrieved from
https://www.cottoninc.com/wp-content/uploads/2020/07/2020-07-Monthly-Economic-Letter.pdf
17 Federal Reserve Bank of St. Louis. (2020). Producer price index by commodity for textile products and apparel:
Polyester fibers. Retrieved from; https://fred.stlouisfed.org/series/WPU031502411
Page 16 of 49The unusual shipping and logistics cost increase this year is related to COVID-19 directly. For
example, according to media reports, shipping companies are applying surcharges for some
international shipping during the pandemic, which adds to the sourcing costs of U.S. fashion
companies18. More often than not, companies also have to switch to a more expensive shipping
route or modality due to quarantine measures and port closures.19
The U.S.-China trade war is another primary factor behind companies’ sourcing cost
increase this year. As of July 2020, around $30 billion of U.S. textile, apparel, and home textile
products imports from China (or nearly 90 percent of the total) are subject to a 7.5% punitive Section
301 tariff on top of the regular most-favored-nation (MFN) tariff rate. 20 Understandably, as high as
90 percent of respondents explicitly say, the U.S. Section 301 action has increased their
company’s sourcing cost in 2020, up from 63 percent last year (Figure 11a). Further, 75 percent
of respondents also report a negative impact of the U.S. Section 301 action on their financials this
year, a substantial increase from only 23 percent in 2019. Further, around 40 percent of respondents
say China’s retaliatory tariff and non-tariff barriers in response to Section 301 have hurt their
businesses too. This result supports the findings of some recent analysis, which also suggests that
U.S. textile and apparel companies overall suffer from reduced exports and higher import costs
(including for needed textile raw materials) due to the trade war with China.21
18 Matt Grossman. (May 22, 2020). The Covid surcharge: Companies confront the unforgiving economics of
coronavirus. Wall Street Journal. Retrieved from https://www.wsj.com/articles/the-covid-surcharge-companies-
confront-unforgiving-economics-of-coronavirus-11590139802
19 Keith Bradsher and Niraj Chokshi. (February 27, 2020). Virus disrupts China’s shipping, and world ports feel the
impact. New York Times. Retrieved from https://www.nytimes.com/2020/02/27/business/economy/china-
coronavirus-shipping-ports.html
20 Office of the U.S. Trade Representative, USTR. (2020). Section 301-China. Retrieved from https://ustr.gov/issue-
areas/enforcement/section-301-investigations/section-301-china
21 Lu, Sheng. (2019). Does the U.S.-China tariff war benefit or hurt the U.S. textiles and apparel industry?,
International Textile and Apparel Association Annual Conference Proceedings. Retrieved from
https://doi.org/10.31274/itaa.8245
Page 17 of 49Second, COVID-19 and the trade war are pushing U.S. fashion companies to reduce their
“China exposure” further. As early as in our 2014 benchmarking study, we found U.S. fashion
companies had begun to look for alternative sourcing destinations to China and build a more
diversified sourcing base. 22 The U.S.-China trade war and COVID-19, together with other factors,
such as China’s increasing labor cost23, seem to have accelerated U.S. fashion companies’
process of moving out of China.24 As illustrated in Figure 9a, this year, only about one-third of
respondents say more than 30 percent of their total sourcing value or volume comes from China,
down from 45.7 percent in 2019 and substantially lower than nearly 60 percent back in 2017.
As U.S. fashion companies are sourcing relatively less from China, they are moving orders
mostly to China’s competitors in Asia. As shown in Figure 11b, when asked about the specific
measures companies have taken in response to the U.S. Section 301 action, all respondents (100
percent) say they have “moved some sourcing orders from China to other Asian suppliers,” up from
77 percent in 2019. Figure 11c further shows that, in the first five months of 2020, measured by
value, China lost its position as the top apparel supplier to the U.S. market and China’s market
share plummeted from nearly 30 percent in 2019 to a historic low of 19.3 percent.25 Consistent with
the result in Figure 11b, most of China’s lost market shares have been taken by other Asian suppliers,
particularly Bangladesh and members of the Association of Southeast Asian Nations (ASEAN), such
as Vietnam, Cambodia, and Indonesia.26
22 Please see the U.S. Fashion Industry Benchmarking Study from 2014 to 2019:
https://www.usfashionindustry.com/resources/research-reports/research-reports/usfia-fashion-industry-
benchmarking-study
23 Fung Business Intelligence. (2020). China sourcing update: Labor Cost (May 2020). Retrieved from
https://www.fbicgroup.com/sites/default/files/China%20Sourcing%20Update%20Labour%20Cost%20MAY%202
020.pdf
24 Lu, Sheng. (2020). US apparel sourcing patterns are changing. Here’s how. Just-Style. Retrieved from
https://www.just-style.com/analysis/us-apparel-sourcing-patterns-are-changing-heres-how_id138122.aspx
25 Office of Textiles and Apparel, OTEXA. (2020). U.S. imports of textile and apparel. Retrieved from
https://otexa.trade.gov/msrpoint.htm
26 U.S. International Trade Commission, USITC. (2019). Shifts in U.S. merchandise trade, 2018—Textiles and apparel
(Investigation No. 332-345). Retrieved from
https://www.usitc.gov/research_and_analysis/trade_shifts_2018/textiles.htm
Page 18 of 49Table 4 Percentage of U.S. Apparel Imports from the Western Hemisphere
By quantity
Sourcing 2019 2020 2020 vs. 2019
destinations 2018 2019 2018 vs.2019 (Jan-May) (Jan-May) (Jan-May)
Western Hemisphere 15.6% 15.6% -0.1% 16.0% 14.0% -2.1%
CAFTA-DR 10.7% 10.7% -0.1% 10.8% 9.1% -1.7%
NAFTA (USMCA) 3.2% 3.0% -0.2% 3.3% 3.2% -0.1%
By value
Sourcing 2019 2020 2020 vs. 2019
destinations 2018 2019 2018 vs.2019 (Jan-May) (Jan-May) (Jan-May)
Western Hemisphere 17.1% 17.1% 0.0% 17.3% 15.3% -2.0%
CAFTA-DR 10.1% 10.3% 0.2% 10.2% 9.1% -1.1%
NAFTA (USMCA) 4.8% 4.5% -0.3% 4.7% 4.0% -0.7%
Data source: Office of Textiles and Apparel (OTEXA), U.S. Department of Commerce (2020)
Third, no clear evidence suggests that U.S. fashion companies are sourcing more from the
Western Hemisphere because of COVID-19 and the U.S.-China trade war. In recent years, near-
sourcing from the Western Hemisphere, particularly members of the North American Free Trade
Agreement (NAFTA)27 and the Dominican Republic-Central America Free Trade Agreement (CAFTA-
DR) is growing in popularity, as non-cost factors such as speed to market are given more weight in
fashion companies’ sourcing decisions. 28
However, both the survey results and official trade statistics suggest otherwise. For example,
only 20 percent of respondents say they have “moved sourcing orders from China to Western
Hemisphere” in response to the Section 301 tariff action, which is even fewer than 27 percent in
2019 (Figure 11b). Likewise, as summarized in Table 4, both in quantity and value terms, U.S. fashion
companies have been importing LESS from countries in the Western Hemisphere since 2019. NAFTA
and CAFTA-DR members continued to lose market shares in the U.S. apparel import market so far in
2020 (January to May). 29 Several factors could be related to the phenomenon:
• First, U.S. fashion companies source products from Asia (including China) and the Western
Hemisphere for different purposes. In general, US companies tend to source either price-
sensitive or more sophisticated items from Asia, where factories overall have higher productivity
and more advanced production techniques. Meanwhile, the Western Hemisphere is typically used
to source products that require faster speed-to-market or more frequent replenishments during
the selling season. Some studies further show that there is more divergence in the products
imported into the United States from Asian countries and the Western Hemisphere from 2015 to
2019. In contrast, over the same period, China, ASEAN, and Bangladesh appear to be exporting
increasingly similar products to the United States.30 This explains why Asian suppliers, rather
than NAFTA and CAFTA-DR members, saw their apparel exports to the U.S. increased because of
COVID-19 and the US-China tariff war.
27 NAFTA is replaced by the U.S.-Mexico-Canada Trade Agreement (USMCA) on July 1, 2020.
28 Achim Berg, Lara Haug, Saskia Hedrich, and Karl-Hendrik Magnus. (2020). Time for change: How to use the crisis to
make fashion sourcing more agile and sustainable. Mckinsey & Company. Retrieved from
https://www.mckinsey.com/industries/retail/our-insights/time-for-change-how-to-use-the-crisis-to-make-
fashion-sourcing-more-agile-and-sustainable
29 Office of Textiles and Apparel, OTEXA. (2020). U.S. imports of textile and apparel. Retrieved from
https://otexa.trade.gov/msrpoint.htm
30 Lu, Sheng. (2020). US apparel sourcing patterns are changing. Here’s how. Just-Style. Retrieved from
https://www.just-style.com/analysis/us-apparel-sourcing-patterns-are-changing-heres-how_id138122.aspx
Page 19 of 49• Second, the apparel production capacity in the Western Hemisphere has been hit hard by
COVID-19 as well. Industry sources report that due to the spread of COVID-19 in the region,
garment factories in North, South, and Central America have been struggling with factory
lockdowns, quarantine measures, and worker shortages. As of July 2020, most Western
Hemisphere countries have yet to allow garment factories to reopen fully. 31
• Third, with an unprecedented high level of unemployment, U.S. consumers are becoming ever
more price-sensitive in clothing shopping.32 However, as an apparel sourcing base, the Western
Hemisphere, in general, is regarded as less price competitive than Asian suppliers.33 In other
words, the higher production and sourcing cost could disadvantage Western Hemisphere
as a preferred apparel-sourcing base for U.S. fashion companies during the pandemic.
Rating sourcing destinations
Table 5 Strength and Weakness as a Sourcing Base
Risk of labor Risk of
Sourcing Flexibility and
Region Speed to market Sourcing cost and social environmental
destination agility
compliance compliance
USA 4.0 1.5 3.0 4.0 4.0
Western Mexico 3.5 3.0 3.0 3.0 3.0
Hemisphere CAFTA-DR 3.5 3.0 3.0 3.0 3.0
Colombia 3.0 3.0 3.0 3.0 3.0
China 3.5 3.5 4.0 3.0 3.0
Vietnam 3.0 3.5 3.5 3.0 3.0
Bangladesh 2.0 4.5 3.0 2.0 2.0
Asia Indonesia 2.5 3.5 3.0 2.5 2.5
India 2.5 3.5 3.0 2.0 2.5
Sri Lanka 2.5 3.5 3.0 3.0 2.5
Cambodia 2.5 3.5 3.0 2.5 2.0
Europe 3.0 2.0 2.5 4.0 4.0
Turkey 2.5 3.0 3.0 3.0 3.0
Rest of the world
AGOA 2.0 3.0 2.5 2.5 2.5
Egypt 2.5 3.5 3.0 3.0 3.0
Note: The results are based on respondents’ average rating for each country on a scale of 1 (much lower performance
than the average) to 5 (much higher performance than the average). In the table, means strength as a sourcing base
(rating score between 5.0-4.0); means average performance (rating score between 3.0-3.9); means weakness as a
sourcing base (rating score between 1.0-2.9). However, the results do NOT reflect the author’s evaluation of each
country.
To understand the strengths and weaknesses of each primary sourcing destination, this year, we
again asked respondents to rate them against five criteria with the most significant impact on
sourcing decisions.
31 Just-Style. (2020). Timeline – How coronavirus is impacting the global apparel industry. Retrieved from
https://www.just-style.com/news/timeline-how-coronavirus-is-impacting-the-global-apparel-industry-free-to-
read_id138313.aspx
32 Harriet Torry. (June 10, 2020). Coronavirus continues to weigh on U.S. consumer prices. Wall Street Journal.
Retrieved from https://www.wsj.com/articles/coronavirus-continues-to-weigh-on-u-s-consumer-prices-
11591793399
33 Lu, Sheng. (2018). What will happen to the U.S. textile and apparel industry if the NAFTA goes? Margin: The
Journal of Applied Economic Research, 12(2), 113-137.
Page 20 of 49• Speed to Market: 1) The United States, Mexico, and CAFTA-DR members continue to
demonstrate substantial competitiveness in lead time due to their geographic proximity to the
U.S. market. 2) Highly consistent with what we found in the past two years, China and Vietnam
again scored higher in speed to market than most of their Asian and African competitors in 2020.
This result can be attributed to these two countries’ overall higher efficiency in supply chain
management based on their more sophisticated and advanced local textile and apparel industries.
34 3) Respondents say sourcing from the EU, in general, can offer a shorter lead time than many
Asian suppliers. This result is reasonable as textile and apparel mills in many developed EU
countries have actively adopted modern digital and automation technologies to improve their
speed to market capabilities.35 On the other hand, shipping from the EU to the U.S. is also shorter
in the distance than from Asia.
• Sourcing Cost: 1) Consistent with the survey results from 2017 to 2019, respondents this year
again say Bangladesh offers the most competitive price, followed by Vietnam, Indonesia,
Cambodia, India, and Sri Lanka. Outside Asia, Egypt is regarded as a sourcing base that can offer a
relatively competitive price too. 2) Respondents say sourcing from Asia overall will incur a lower
cost than from the Western Hemisphere and other parts of the world. In addition to the factor of
lower labor cost, more accessibility to cheaper textile raw materials (such as yarns and fabrics)
produced locally is another critical competitive advantage of Asian apparel manufacturers.36 3)
As apparel manufacturing remains mostly labor-intensive, not surprisingly, respondents say
sourcing from the United States and the EU, where the wage level is among the highest in the
world, will be most expensive.
• Flexibility and agility: 1) Regarding the capability of quickly adjusting the delivery, volume, and
product of the sourcing order upon requests of customers, China scored the highest again this
year based on its unparalleled production capacity and integrated production networks. 37A
recent study further shows that few countries can compete with China in terms of the great
variety of apparel products it produces for the U.S. market.38 2) Meanwhile, respondents see
other primary sourcing bases have similar performance in flexibility and agility, except EU and
members of the African Growth and Opportunity Act (AGOA), which received the lowest rating
score.
• Risk of labor and social compliance: 1) According to respondents, the United States and the EU
demonstrate a notable competitive edge against other sourcing destinations in terms of labor and
social compliance. 2) Respondents still regard sourcing from Bangladesh involves relatively
higher compliance risks in general, with the rating score for the country stood at 2.0, the same as
last year. Some respondents explicitly expressed their concerns about the dissolution of the
Alliance for Bangladesh Worker Safety (Alliance) and the Accord on Fire and Building Safety in
34 Sara Andersson, Alix Machiels and Charles Bodwell. (2019). Securing the competitiveness of Asia’s garment sector:
A framework for enhancing factory-level productivity. International Labor Organization (ILO). Retrieved from
https://www.ilo.org/asia/publications/WCMS_732907/lang--en/index.htm
35 Euratex. (2020). Facts and key figures of the European textile and clothing industry. Retrieved from
https://euratex.eu/wp-content/uploads/EURATEX-Facts-Key-Figures-2020-LQ.pdf
36 Lu, Sheng. (2019). Regional Comprehensive Economic Partnership (RCEP): Impact on the Integration of Textile
and Apparel Supply Chain in the Asia-Pacific Region. In Fashion Supply Chain Management in Asia: Concepts, Models,
and Cases (pp. 21-41). Springer.
37 Hassen Saheed. (2019). Prospects for the textile and apparel industry in China. Textile Outlook International,
No.200, 98-151. Textile Intelligence Limited.
38 Lu, Sheng. (2019). How the tariff war is shifting 'Made in China' sourcing strategy for U.S. apparel retailers.
Apparel Magazine (RIS). Retrieved from https://risnews.com/how-tariff-war-shifting-made-china-sourcing-
strategy-us-apparel-retailers
Page 21 of 49Bangladesh (Accord), a move that is widely viewed as not helpful with building more confidence
in Bangladesh’s social responsibility practices. 39
• Risk of environmental compliance: 1) Respondents see the risk of environmental compliance
and labor & social compliance highly correlated. 40 In some U.S. fashion companies, the same
department or program handles both issues.41 As one respondent commented, “(we) set up a
dedicated sustainability team to focus on various company initiatives.” 2) In general, respondents
see sourcing from developed countries, such as the United States and EU countries, involves a
relatively low risk of environmental compliance. In comparison, respondents see the
environmental compliance risk relatively higher when sourcing from developing Asian countries,
such as Bangladesh, and Cambodia, and AGOA members. 3) Two contributing factors could be
related to the rating scores. One is that more restrictive environmental regulations and effective
enforcement mechanisms, in general, are implemented in the developed economies.42 On the
other hand, developing countries have to bear a more substantial burden of managing and
reducing the environmental impact of the fashion industry, as most apparel are produced there
today.43
Further, respondents say their rating for the risk of compliance is primarily based on field
experience working with vendors in respective countries. For example, one respondent rated
sourcing from Bangladesh as “high risk” in social and labor compliance. According to that
respondent, “My answers are based specifically on my experience of visiting factories and meeting with
factory managers - their opinions on caring about specific issues and how great their record-keeping
usually is.” Respondents also say that external factors, such as international news reporting, may
affect their perception of compliance risks in respective countries too.
In conclusion, the results suggest that no sourcing destination is perfect, which helps explain why
U.S. fashion companies typically use a mix of sourcing bases to balance speed to market, sourcing
cost, flexibility, and compliance risk. On the other hand, China, Vietnam, CAFTA-DR members, and
Mexico overall are regarded as the most balanced sourcing destinations against all the five
criteria, which offers these countries and regions unique competitive advantages as preferred
sourcing destinations.
39 Elizabeth Paton. (March 1, 2020). After factory disaster, Bangladesh made big safety strides. Are the bad days
coming back?. New York Times. Retrieved from https://www.nytimes.com/2020/03/01/world/asia/rana-plaza-
bangladesh-garment-industry.html
40 Burns, Leslie. (2019). Sustainability and Social Change in Fashion. Bloomsbury publishing: New York.
41 Patagonia. (2020). Working with factories. Retrieved from https://www.patagonia.com/our-footprint/working-
with-factories.html
42 Muthu, S. S. (2020). Assessing the environmental impact of textiles and the clothing supply chain. Woodhead
publishing: Cambridge, United Kingdom.
43 Dicken, P. (2015). Global shift: Mapping the changing contours of the world economy (7 th ed). SAGE Publications Ltd.
Page 22 of 49You can also read