Drivers of concentrated predation in an Antarctic marginal-ice-zone food web - Nature
←
→
Page content transcription
If your browser does not render page correctly, please read the page content below
www.nature.com/scientificreports

            OPEN           Drivers of concentrated predation
                           in an Antarctic marginal-ice-zone
                           food web
                           Benjamin T. Saenz1,5 ✉, David G. Ainley2, Kendra L. Daly1, Grant Ballard3, Erin Conlisk2,6,
                           Megan L. Elrod3 & Stacy L. Kim4
                           Predators impact preyscapes (3-D distribution of forage species) by consuming prey according to
                           their abilities or by altering prey behavior as they avoid being consumed. We elucidate prey (Antarctic
                           silverfish[Pleuragramma antarctica] and crystal krill[Euphausia chrystallorophias]) responses to
                           predation associated with the marginal ice zone (MIZ) of the McMurdo Sound, Antarctica, polynya.
                           Prey abundance and habitat was sampled across a 30 × 15 km area by remotely-operated vehicle,
                           and included locations that were accessible (ice edge) or inaccessible (solid fast ice) to air-breathing
                           predators. Prey and habitat sampling coincided with bio-logging of Adélie penguins and observations of
                           other air-breathing predators (penguins, seals, and whales), all of which were competing for the same
                           prey. Adélie penguins dived deeper, and more frequently, near the ice edge. Lowered abundance of krill
                           at the ice edge indicated they were depleted or were responding to increased predation and/or higher
                           light levels along the ice edge. Penguin diet shifted increasingly to silverfish from krill during sampling,
                           and was correlated with the arrival of krill-eating whales. Behaviorally-mediated, high trophic transfer
                           characterizes the McMurdo Sound MIZ, and likely other MIZs, warranting more specific consideration in
                           food web models and conservation efforts.

                           In the marginal ice zone (MIZ) of the Southern Ocean, where sea ice-covered waters transition to open ocean,
                           a combination of both biotic and abiotic habitat features and processes lead to elevated abundance in biological
                           communities relative to adjacent habitat. Melting ice floes create a freshwater lens that increases stratification,
                           reduces surface mixing, and increases light reaching the water column due to decreasing ice cover, all of which
                           encourages blooms of diatoms1–4. The MIZ is defined by this melt water lens, extending out on either side of
                           the ice edge. The physical processes determine phytoplankton abundance and species composition, forming the
                           base of the MIZ food web and providing bottom-up influence toward higher trophic levels5–8. The zooplankton
                           and micronekton grazers (e.g. krill Euphausia spp.)9,10 can be abundant in the MIZ, even though their elevated
                           biomass is often maximal beneath the ice cover back from the ice edge9,11,12. This indicates that the MIZ may not
                           just be facilitating increased grazer abundance, but may also provide a refuge from air breathing predators under
                           heavier ice cover further into the MIZ. Concurrently, in the outer, open-water portion of the MIZ, predators may
                           have depleted the grazers (see below). In this way, a mid-trophic organism’s location in the MIZ is part of a game
                           of risk, where seeking food must be balanced by predator avoidance9,11–14. Part of this game of being consumed
                           or being a consumer is evident at the smaller scale in the patchiness of grazer aggregations and their predators
                           within MIZs15–19. Important in that aspect of the game are inter- and intra-specific competition between preda-
                           tors, i.e. a top-down influence. This interaction can negatively affect prey availability where predators overlap their
                           foraging5,20,21, if predators are abundant enough to have a measurable impact13.
                               Overall, MIZs constitute a significant Southern Ocean habitat. Antarctica is entirely encircled by a band of
                           sea ice several hundred kilometers wide, its outer circumference constituting the longest MIZ on the planet.
                           This larger-scale MIZ has received appreciable multidisciplinary research attention, with phytoplankton3,4,9, graz-
                           ers9–12, and upper trophic levels22,23, investigated simultaneously. Within that large-scale band of sea ice, however,
                           occur pools of persistent open water or less concentrated ice, called polynyas. These mesoscale features are found
                           especially along the continental margin and coast7,8,24. Around each polynya is also an MIZ that exhibits enhanced

                           1
                            College of Marine Science, University of South Florida, St. Petersburg, FL, USA. 2HT Harvey and Associates, Los
                           Gatos, CA, USA. 3Point Blue Conservation Science, Petaluma, CA, USA. 4Moss Landing Marine Laboratories, Moss
                           Landing, CA, USA. 5Present address: Biota.earth, Berkeley, CA, USA. 6Present address: Point Blue Conservation
                           Science, Petaluma, CA, USA. ✉e-mail: blsaenz@gmail.com

Scientific Reports |   (2020) 10:7282 | https://doi.org/10.1038/s41598-020-63875-y                                                              1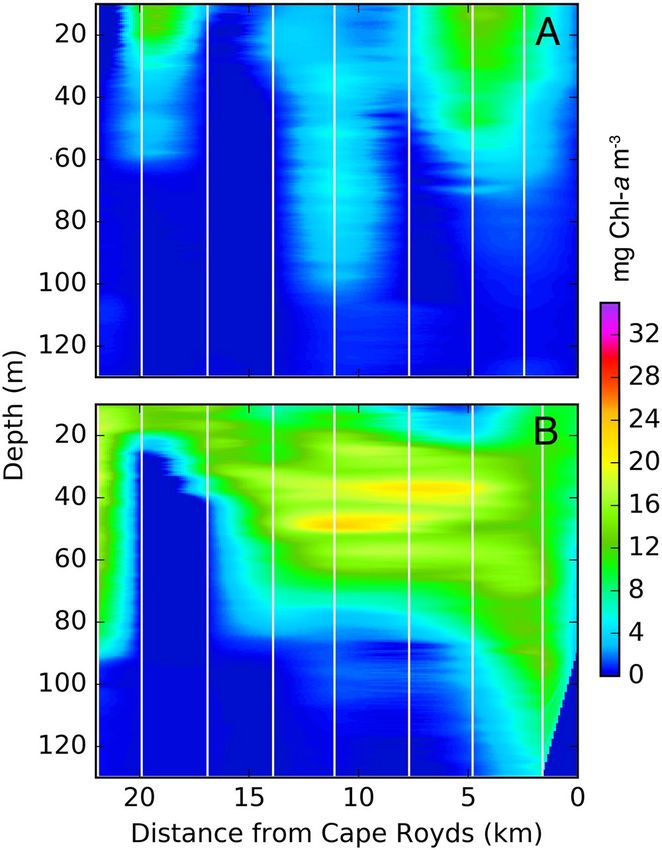
www.nature.com/scientificreports/                                                                www.nature.com/scientificreports

                           productivity and high concentrations of grazer organisms. The trophic importance of polynyas and their MIZs
                           can be further judged by the high densities of top- and mesopredators found there, including seabirds22,25,26,
                           seals27–29, and whales20,30. Another important supporting indicator is the significant association of penguin colo-
                           nies with polynyas24,31,32.
                               The Southern Ocean MIZs of coastal polynyas have received less of the integrated, multidisciplinary research
                           needed to establish ecological linkages and food web dynamics. Apparent ecological linkages have primarily been
                           inferred, based on coincident enhanced productivity and abundance1,2,10,20,26,33. In part, this is a result of logisti-
                           cal difficulties required to make simultaneous observations of predators and the preyscape (3-D distribution of
                           middle trophic levels), along with their immediate environment, especially in the somewhat remote Antarctic.
                           However, recent studies utilizing both established and new technology have directly examined predator forag-
                           ing in relation to prey availability in comparable areas of the Southern Ocean where sea ice is at least season-
                           ally present3,4,34,35. These studies have shown, by inference, the impact of predator abundances and behaviors
                           on small-scale occurrence patterns of prey5,13,15,19,36; however the influence of predation and top-down trophic
                           impacts in polynya habitats has not been systematically examined5.
                               In this paper, for the MIZ of the McMurdo Sound, Antarctica, polynya, we address questions of how the prey-
                           scape, i.e. 3-D prey availability and forage potential, is influenced by A) animal behaviors, specifically predator
                           avoidance behaviors by the prey, and predation pressure, through resource or interference competition among
                           predators; and by B) physical characteristics of the environment. This MIZ exhibits trophic qualities observed in
                           larger-scale MIZs, including high seasonal primary productivity associated with the polynya and fast ice edge7,8,24,
                           and large numbers of predators including penguins5,21,37, seals38,39, and whales20,40,41 (Figs. 1, 2). We synthesize
                           direct prey and predator observations that together constitute a natural predator-exclusion experiment in a
                           before-and-after sequence to quantify the change in prey distribution as a consequence of predation.

                           Additional Background
                           Using what is essentially a natural experiment, we compare the preyscape unavailable to air breathing predators
                           (under the interior fast ice) to the preyscape available to predators in immediately adjacent waters (fast ice edge).
                           The project was organized around a focal predator, the well-studied Adélie penguin (Pygoscelis adeliae). While
                           measuring the preyscape, we also measured seasonal change in diet, foraging location and behaviors, and popula-
                           tion and breeding dynamics, all of which should contribute importantly to the foraging pressure upon two main
                           prey species, crystal krill (Euphausia crystallorophias) and Antarctic silverfish (Pleuragramma antarctica)42–45.
                           Adélie penguins nesting at Cape Royds, located where the fast ice edge meets Ross Island (Fig. 1), exhibit breeding
                           success equivalent to colonies elsewhere and greater chick growth rates, when the adjacent polynya is open46,47.
                           The foraging area of Cape Royds penguins does not expand seasonally as observed at other, larger colonies in
                           the region37,48,49, indicating high availability of prey relative to colony size (and thus low total colony foraging
                           pressure). Typically, Adélie penguins at Cape Royds and elsewhere on Ross Island switch from feeding primar-
                           ily on crystal krill in the early season (~100%) to a diet containing more silverfish later in the season (40–80%
                           fish5,21,42; Fig. 2). The switch to more silverfish is closely related to the arrival of whales, especially minke whales
                           (Balaeoptera bonaerensis), a baleen species that also feeds on crystal krill5,21,50. Prior to the arrival of minke
                           whales, Weddell seals (Leptonychotes weddellii) and emperor penguins (Aptenodytes forsteri) predominate along
                           the fast ice edge, where they prey heavily on silverfish, 80% and 20–100% of diet, respectively10,50.
                               In this context, we evaluate the extent to which prey availability (krill and silverfish) to penguins in the
                           McMurdo Sound MIZ is driven by physical processes (such as tides, light and sea ice cover), and also by foraging
                           pressure through trophic competition (penguins, whales, seals, and silverfish). Specifically, we hypothesize that
                           predation pressure will alter the preyscape, the predators affecting the availability of their prey by means of their
                           predation (indexed by predators’ abundance along the ice edge). Prey should be depleted where accessible to
                           predators, or prey should occur deeper in the water column, compared to where predators have no access under
                           the ice. In the process, we address the question of why the Adélie penguin diet shifts from one almost entirely of
                           krill to one in which silverfish are prominent, co-incident with the arrival of cetaceans. We provide a 3-D exami-
                           nation of the McMurdo Sound preyscape as it evolved during the spring of 2014–2015.

                           Hypotheses Tested
                           (1) Krill and fish depth distribution corresponds with seasonal phytoplankton distribution within the bloom, i.e.
                           shallow in the water column, to enhance foraging13; (2) krill and fish are more prevalent higher in the under-ice
                           water column in the fast ice interior compared to the ice edge, where predators abound5,12; (3) Adélie penguins
                           forage where there is reduced light in the MIZ, from shading of sea ice cover5,51–53; (4) Adélie penguins from Cape
                           Royds, responding to changing prey distributions, change their foraging strategy (distance from colony and depth
                           of foraging) as the chick-provisioning period progresses37,48; and (5) the diet of Adélie penguins changes to one
                           with more fish due to competition upon the arrival of minke whales, i.e. whales are capable of foraging deeper
                           than the penguins and cause a disappearance of krill at shallow depths5,21.

                           Results
                           Preyscape and prey availability. Phytoplankton concentrations rapidly increased during the first period
                           of sampling (3–19 December; Fig. 3A), and subsequently reached >15 mg Chl-a m−3 over much of the top 60 m
                           of the water column (after 19 December; Fig. 3B). Despite high variance, extrapolations from fluorescence data
                           indicated that depth of the 1% light level became shallower by pass 3 (20 December-7 January), due to high
                           phytoplankton concentrations, and decreased from a mean of 44 m to 7–22 m for the remainder of fluorescence
                           sampling (until 4 January; Table 1).
                               Over all fast ice sampling stations, including interior and edge, silverfish observations became severely
                           reduced in the upper 200 m of the water column over time; in linear terms, the energy backscatter from silverfish

Scientific Reports |   (2020) 10:7282 | https://doi.org/10.1038/s41598-020-63875-y                                                               2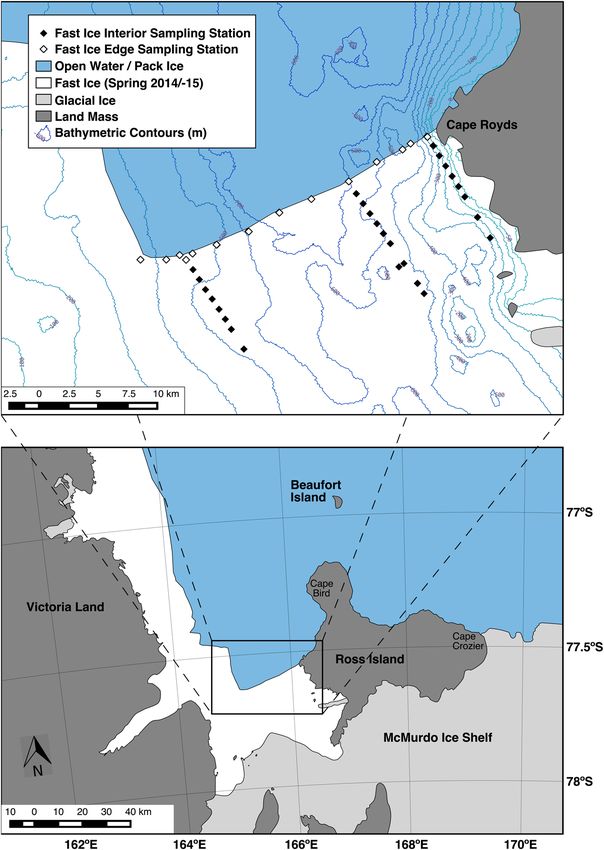
www.nature.com/scientificreports/                                                              www.nature.com/scientificreports

                           Figure 1. The typical fast ice cover of McMurdo Sound in spring-summer, with the edge extending from Cape
                           Royds across to where it abruptly turns northward (an “L” shape; see inset map). Also shown is the preyscape
                           sampling grid (diamonds), composed of drilled holes through which acoustic and fluorometric sensors
                           were deployed. Adélie penguin colonies occur at capes Royds, Bird, and Crozier, as well as Beaufort Island.
                           Bathymetric contours are at 50 m increments.

                           was 17 times greater before than after 24 December. In contrast, the linear backscatter energy from krill aggrega-
                           tions increased, and was 28 times higher during the last preyscape sampling period compared to the first.
                              Among interior fast ice stations (Fig. 1), silverfish detections were reduced after the first sampling period
                           (mean acoustic backscatter decreased below −80 dB; Table 2). The average detection depth of silverfish was
                           80–100 m. In contrast, krill detection at interior stations increased over time (from a low of −88.7 dB before 20
                           December, to a high of −73.0 dB after 4 January; Table 2), and their mean detection depth decreased (37.4 m
                           before 20 December to 24.6 m after 4 January). At ice edge stations, silverfish aggregations were detected during
                           two of the five sampling periods, while krill were detected more frequently. We could not infer separate trends
                           over time in silverfish or krill abundance or depth distribution at the ice edge due to the smaller number of sta-
                           tions (Fig. 1) and patchiness of the acoustic detections.
                              Permutation tests indicated that ice edge stations had lower krill abundance compared to interior locations, at
                           depths of 10–40 m (Table 3, Fig. 4). In contrast, detected silverfish aggregations had largely the opposite pattern,
                           with more silverfish found at the fast ice edge compared to the interior at 10–30 m depth.

Scientific Reports |   (2020) 10:7282 | https://doi.org/10.1038/s41598-020-63875-y                                                           3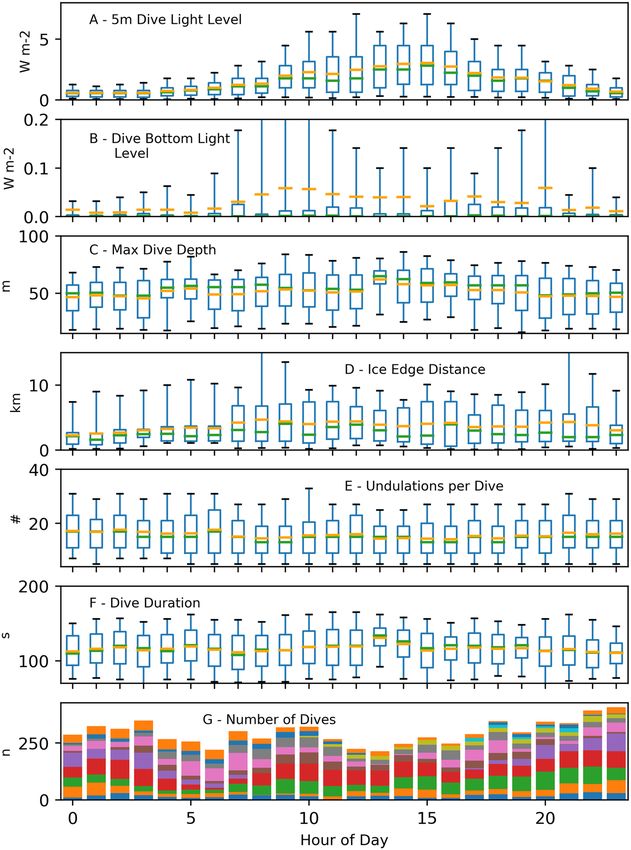
www.nature.com/scientificreports/ www.nature.com/scientificreports
Figure 2. Schematic emphasizing that portion of Ross Sea food web pertinent to the McMurdo Sound
MIZ10,44,45, and the natural experiment being reported herein. Labeling denotes when in the project’s sampling
period each predator is most abundant along ice edge; thick arrows indicate the primary diet or trophic transfer
pathway in McMurdo Sound.
Figure 3. Fluorescence from preyscape sampling at ice edge stations during Pass 2 (A; 3–19 December) and
Pass 3 (B; 20 December – 7 January). Extent of the dense phytoplankton bloom that appeared along the fast ice
edge stretched from Cape Royds to the fast ice “L” in the west (Edge stations; Fig. 1). Single, Individual Chl-a
profiles were located at the white vertical lines within each of the two periods shown, and data were interpolated
horizontally.
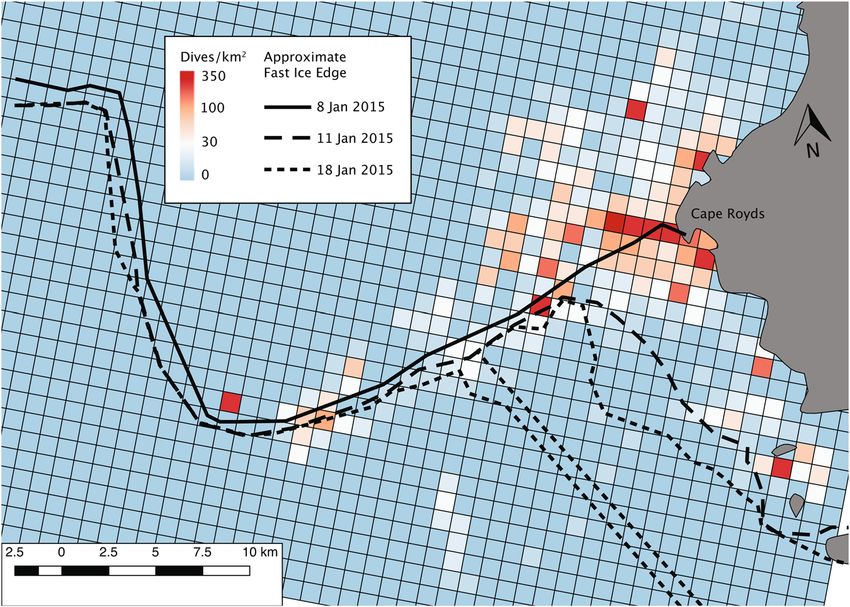
Penguin foraging in the marginal ice zone. Satellite-tagged penguins foraged within ~15 km of the
Cape Royds colony; mean penguin foraging trip distance among tagged penguins ranged 10.3–11.9 km. Foraging
was more concentrated along the fast ice edge (Figs. 1, 5), than in more open water and pack ice farther north.
Minke whales also foraged along the edge42. In early January, the pack ice was blown north, leaving mostly
open water along the fast ice edge; sequential break out of the fast ice followed, especially in the eastern Sound
near the penguin colony54. As the fast ice broke away, penguins (and whales) foraged in the leads, following the
southward-receding fast ice edge (Fig. 5). As judged from instrumented penguins, the greatest number of for-
aging dives were made within about 2 km of the ice edge. Greater accuracy was not possible in satellite-derived
assessment of the fast ice edge position because of the intermittent presence of dense pack ice, which was indis-
tinguishable from fast ice in the satellite imagery.
Scientific Reports | (2020) 10:7282 | https://doi.org/10.1038/s41598-020-63875-y 4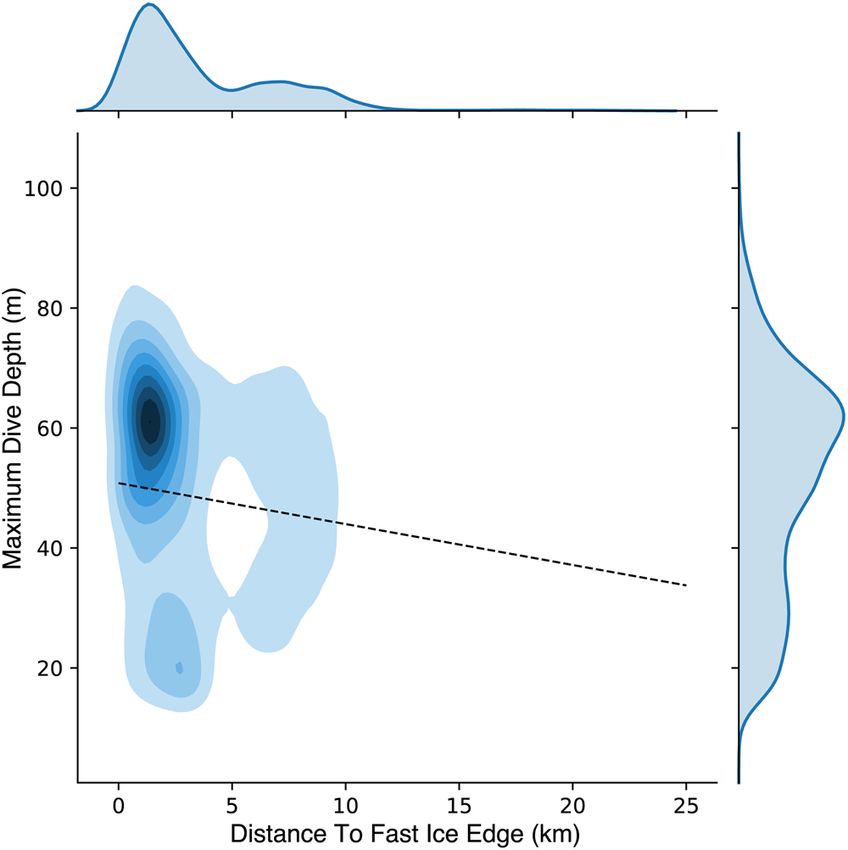
www.nature.com/scientificreports/                                                                                                             www.nature.com/scientificreports

                                                                                                                     Mean
                                     5–6 day                                                                         foraging                                                       Minke
                                     diet               Period           Proportion        Proportion                distance          Mean foraging Mean trip                      presence/       Depth 1%
                                     period             start date       fish in diet      krill in diet             (km)              depth (m)     duration (hr)                  absence         light (m)
                                     1                  14-Dec           7.4 (25.0)        83.9 (36.4)               n.d.              n.d.                  n.d.                   0               44 (41)
                                     2                  20-Dec           19.0 (39.2)       81.0 (39.2)               10.3 (1.3)        47.4 (17.3)           13.3 (5.8)             0               15 (27)
                                     3                  25-Dec           33.8 (45.4)       62.3 (46.7)               12.2 (2.0)        52.9 (14.6)           19.1 (8.6)             1               7 (3)
                                     4                  30-Dec           45.2 (49.8)       54.8 (49.8)               11.9 (3.4)        49.5 (17.1)           16.2 (6.8)             1               22 (28)
                                     5                  4-Jan            50.0 (52.2)       50.0 (52.2)               11.9 (5.0)        46.7 (21.1)           16.9 (9.4)             1               12 (5)
                                     6                  9-Jan            55.9 (44.1)       44.1 (44.1)               10.9 (6.2)        54.0 (18.6)           26.7 (12.2)            1               n.d.
                                     7                  14-Jan           47.9 (43.2)       52.1 (52.1)               10.8 (8.3)        50.6 (18.3)           12.0 (4.3)             1               n.d.
                                     8                  19-Jan           44.5 (51.3)       55.5 (51.2)               n.d.              n.d.                  n.d.                   1               n.d.

                                    Table 1. Habitat features and characteristics of foraging by Adélie penguins from the Cape Royds colony,
                                    divided into 5–6 d diet-sampling periods, 14 December 2014 to 22 January 2015. Periods are identified as the
                                    first date of a 5–6 d span. “No data” is abbreviated as “n.d.” Standard deviations are given in parentheses.

                           Fast Ice Interior Stations                                                                  Fast Ice Edge Stations
                                                   Mean silverfish                               Mean krill                                     Mean silverfish
                           Mean silverfish Sv      depth, m               Mean krill Sv          depth, m              Mean silverfish Sv       depth, m            Mean krill Sv          Mean krill depth, m
              1 (14 Dec)   −80.2 (−80.4, −80.0)    81.9 (80.1, 83.6)      −88.7 (−89.8, −87.7)   37.4 (33.3, 41.9)     −80.6 (−81.6, −79.5)     84.8 (74.4, 93.8)   −81.8 (−81.9, −81.7)   91.4 (90.7, 92.0)
              2 (20 Dec)   −98.4 (−99.7, −97.1)    16.3 (13.4, 19.3)      −82.0 (−82.3, −81.6)   32.6 (29.4, 37.5)     none                     none                −80.6 (−80.8, −80.4)   89.8 (89.6, 90.1)
              3 (25 Dec)   −92.6 (−92.7, −92.4)    126 (124, 127)         −75.1 (−75.2, −75.0)   29.0 (28.8, 29.2)     none                     none                −88.3 (−88.6, −87.9)   24.9 (24.0, 26.2)
              4 (30 Dec)   −94.3 (−94.7, −93.9)    77.5 (73.7, 81.2)      −93.8 (−94.2, −93.4)   58.6 (55.3, 61.6)     −95.0 (−95.5, −94.5)     25.2 (24.8, 25.7)   −98.4 (−99.5, −97.4)   23.0 (21.9, 24.2)
              5 (4 Jan)    none                    none                   −73.0 (−73.3, −72.6)   24.6 (23.1, 26.0)     none                     none                −78.4 (−78.6, −78.1)   50.1 (49.1, 51.1)

                                    Table 2. Characteristics of the contribution to the preyscape by crystal krill and Antarctic silverfish, with
                                    sampling passes two and three divided into shorter periods. Boostrap-calculated 95% confidence internals
                                    (10000 replications) are shown in parentheses. Sv = mean acoustic volume backscattering strength (dB re m−1;
                                    smaller values (e.g., −100) indicate weaker backscatter than larger values (e.g., −83).

                                                   Krill                                     Silverfish
                                     Depth                           location of greater                    location of greater
                                     Interval      p-value           backscatter             p-value        backscatter
                                     0–10 m        0.19              —                       0.16           —
                                     10–20 m       0.04**            interior                0.06*          edge
                                     20–30 m       0.04**            interior                0.04**         edge
                                     30–40 m       0.07*             interior                0.13           —
                                     40–50 m       0.48              —                       0.43           —
                                     50–60 m       0.21              —                       0.65           —
                                     60–70 m       0.05*             edge                    0.77           —
                                     70–80 m       0.19              —                       0.58           —
                                     80–90 m       0.42              —                       0.58           —
                                     90–100 m 0.40                   —                       0.56           —

                                    Table 3. Permutation test results evaluating acoustic backscatter from krill and silverfish, at ice edge and
                                    interior as affected by depth, 14 December 2014 to 7 January 2015. Shown are p-values found using eqn. 1
                                    (Methods), where an even distribution of prey would produce a value of 0.5. Significance at the 95% level is
                                    indicated by **, and marginal significance at the 90% level is indicated by *. Edge and Interior locations indicate
                                    sampling from stations found along the fast ice edge or interior (>1 km from the fast ice edge), respectively
                                    (Fig. 1). Comparisons below 100 m were not calculated due to declining detectability with depth, and high
                                    variance of abundance.

                                        Maximum dive depths were positively related to proximity to the fast ice edge (Table 4). As penguins foraged
                                    farther north into the polynya (up to 20 km from ice edge), maximum dive depths grew shallower by up to 14 m
                                    (Fig. 6). In addition, the number of undulations per dive (indicating prey capture behavior) decreased signifi-
                                    cantly with increasing distance from the edge (Table 4), equivalent to drop of ~2 per dive between the ice edge
                                    and 20 km distant, a drop of 13% from the mean of 15.7. Diving behavior clustered around deeper diving depths
                                    (~60 m) within 5 km of the edge (Fig. 6). Beyond 5 km, foraging dives had more evenly distributed maximum
                                    depths. There was also a smaller, secondary cluster of diving with a peak centered at 20 m depth within 5 km of
                                    the ice edge (Fig. 6).

Scientific Reports |         (2020) 10:7282 | https://doi.org/10.1038/s41598-020-63875-y                                                                                                                         5
www.nature.com/scientificreports/ www.nature.com/scientificreports
Figure 4. Depth distribution of krill and silverfish at fast ice edge vs fast ice interior (non-edge) stations during
sampling passes 2 and 3. Values are mean Sv (acoustic backscatter dB re 1 m−1) by 10-m depth bins; smaller
values indicate weaker backscatter than higher values. Note that Sv values indicate relative abundance within
taxa, but do not measure relative biomass of krill compared to silverfish. Error bars indicate the bootstrap-
calculated (10000 iterations) 95% confidence interval of the mean.
Figure 5. Locations of foraging dives of tagged Adélie penguins nesting at Cape Royds, 20 December 2014–13
January 2015. Penguin foraging activity southward of the 8 January ice edge shows penguins tracking its
southward retreat. Dives southward of the 18 January edge (i.e. several cells inside the ice edge) are likely due to
erroneous dive geolocation, which may contain inaccuracies of a few kilometers.
Daily, penguin dive behaviors were significantly correlated with a 24 h period sinusoid (Table 5). Near-surface
light (at 5 m) during foraging dives varied sinusoidally across the day, following idealized solar availability at ~77°
S, and bottom light during foraging dives followed the same pattern with more intense light found on dives closer
to local noon (Fig. 7). Penguins made slightly deeper dives (~2.5 m deeper; Table 5) when more light was avail-
able during the middle of the day, but fewer undulations occurred per dive during this period (~2 undulations).
Interestingly, penguins dove ~2 km farther away (generally northward) from the ice edge during mid-day (Fig. 7).
Neither dive duration, nor the number of foraging dives had meaningful model effects (i.e. small coefficients),
although the models showed significant correlations (Table 5).
The average maximum depths of penguin foraging ranged 47.4–54.0 m (Tables 1, 4) during 5–6 d periods,
with an overall mean of 50.2 ± 0.25 SE m. Foraging trip duration averaged 17.3 ± 1.6 SE hr. The shortest durations
occurred at the start of chick feeding and the longest occurred near the end, but we did not detect a linear trend
(range of average per 5 d diet period, 13.3–26.7 hr; Tables 1, 4). Neither did we detect trends across time among
the diving light levels, dive bottom time, or undulations per dive during the ~5 weeks in which penguin foraging
was investigated.
Scientific Reports | (2020) 10:7282 | https://doi.org/10.1038/s41598-020-63875-y 6www.nature.com/scientificreports/ www.nature.com/scientificreports
Random Random
Mean Coefficient Marginal Intercept Residual Within ID
Criterion (S.D.) (S.E.) Z P>|Z| r2
Variance (S.D.) Variance (S.D.) Correlation
Mean light at dive 2.8 (1.4)
0.035 (0.003) 11.899www.nature.com/scientificreports/ www.nature.com/scientificreports
Figure 7. Boxplots of hourly variability in penguin diving parameters. Box top and bottom boundaries show
upper and lower quartiles of the dive parameters, while the whiskers represent the 5th and 95th percentile of
the parameter. Green and orange lines show the median and mean, respectively of the hourly dive parameters.
The different colors in the stacked bar plot (G) correspond to the number of dives recorded from individual
penguins. Maximum diving depth (C), proximity to the ice edge (D), and dive undulations (F) varied according
to a daily sinusoid, and corresponding to light availability at 5 m depth (A), and light at the bottom of dives (B).
Dive duration (F), and the number of foraging dives attempted (G), showed significant correlations also, but the
model effects were inconsequential.
Helicopter surveys along the fast ice edge indicated 211 fish-eating emperor penguins were present during
the first flight in mid-November (Fig. 9). That number rapidly decreased until very few were seen after the first
week of December, when these penguins left the study area to molt. Similarly, fish-eating Weddell seals were pres-
ent in November but disappeared in early December along the fast ice edge; more than 1,000 remained present
in the interior of the fast ice, spreading out from their main eastern Sound breeding area after the last week of
November37.
Relationship between penguin diet, preyscape, and competitors. Consistent with observa-
tions made in previous years at Cape Royds21,42,43,46, at the start of the 2014 penguin chick rearing period
(mid-December), crystal krill dominated penguin diet, but over the next two weeks, 14 to 30 December, the
proportional composition of the diet included more Antarctic silverfish (Fig. 10; Table 1). Once krill and fish
contributed equally to the diet, that ratio continued over the following four weeks.
To test for relationships between diet and the preyscape, data were assembled into 5–6 d period means
(Table 1), complementing the prey availability data (Table 2). Emperor penguins and Weddell seals were decreas-
ing rapidly along the ice edge during the start of Adélie penguin biologging. Since killer whale and minke whale
Scientific Reports | (2020) 10:7282 | https://doi.org/10.1038/s41598-020-63875-y 8www.nature.com/scientificreports/ www.nature.com/scientificreports
Figure 8. Observations of cetaceans at Cape Royds. Data acquired by using binoculars from a 30 m high,
coastal hill, once or twice per day weather permitting, 20 November 2014–18 January 2015. X-axis ticks indicate
days when observations were made; asterisk (*) indicates dates with verification by helicopter survey.
Figure 9. Numbers of silverfish-eating emperor penguins and Weddell seals hauled out along the McMurdo
Sound fast ice edge. Counted by helicopter, 2014–15.
presence corresponded temporally, we included a single presence/absence variable to represent whales, both
species, as a potential factor in penguin diet change (Table 6; also5,21). As a proxy for water clarity, which could
potentially influence diet by affecting the penguins’ ability to locate and pursue prey, we included mean depths
of 1% light level calculated from fluorescence profiles using a model of light transmission (Fig. 3). The penguin
foraging characteristics tested included period means of foraging trip distance and maximum dive depths (as a
potential difference in prey prevalence by depth). Amongst these preyscape variables (shown in Tables 1–3), the
only variable that had any effect on change in penguin diet was the presence of whales (Table 6).
Discussion
The results presented above, based on a natural experiment, represent an effort to quantify seasonal changes in
the preyscape of the McMurdo Sound Polynya MIZ, and to understand what processes were responsible for the
changes. We have described several relationships, some of which have been inferred or described previously but
not simultaneously, that relate specific features of the MIZ to prey abundance and distribution, and predator
activity. Taken together, we interpret these results as support for behavioral, or top-down, forcing as a mediator
of trophic interactions. In particular, decreased krill abundance in the upper water column, and the prediction of
penguin diet change by whale presence, indicate that prey and predator behavior alter the preyscape, within the
context of the McMurdo Sound ice edge.
Reduced krill abundance in the near surface layers (10–40 m depth) at the fast ice edge corresponds to where
penguins were foraging, overlapping the average recorded dive profiles of penguins (average maximum depths on
foraging dives ranged 47–54 m). Simultaneously, minke whales were foraging persistently and on average to 72 m
(range 19–130 m)41. Thus contracting krill abundance could be due to local depletion by predation, or because of
predation avoidance behavior by krill (moving either deeper or further under the fast ice). Either case constitutes
a behavioral modification of prey availability. In a mini-natural experiment evident in the 2019–20 summer, the
Cape Royds penguins had exhibited their shift from krill to fish with arrival of whales (n = 80 diet observations,
13 December-7 January, eventually 65% fish). Then, when a 2 km wide band of fast ice (5 km along the outer edge,
adjacent to Cape Royds) suddenly broke away, penguin diet switched immediately to 69% krill (n = 22, 8–12
January), followed by a switch back to fish (n = 88%, 15–20 January) with arrival of more minke whales (DGA,
pers. obs.). As demonstrated in the present project results, it appears that the krill had been avoiding being too
close or had become depleted near the fast ice edge.
Scientific Reports | (2020) 10:7282 | https://doi.org/10.1038/s41598-020-63875-y 9www.nature.com/scientificreports/ www.nature.com/scientificreports
Figure 10. The average composition of the diet fed to chicks beginning when ~5% of the nests contained
chicks. Values grouped into 5–6 d intervals (identified by initial date) centered to correspond with the prey
sampling. Numbers along the top indicate sample size of parental feeds observed; error bar is the period
standard deviation of the diet component.
Kendall n observations
tau p-value (periods)
Foraging depth 0 1 6
Foraging distance 0 1 6
Foraging duration 0.2 0.598 6
Silverfish backscatter, all 0.333 0.505 5
Silverfish depth, all 0 1 4
Krill backscatter, all −0.4 0.332 5
Krill depth, all 0.527 0.213 5
Krill backscatter, edge 0 1 5
Krill depth, edge 0.6 0.149 5
Depth 1% light 0.4 0.332 5
Whale presence −0.655 0.046* 8
Table 6. Correlations between preyscape variables and the fractional contribution of krill to the penguin diet
(Holm-Bonferroni-corrected). Asterisk (*) significant p-value at the 5% alpha level.
Given the large vertical extent of the phytoplankton bloom observed during the study, it is likely that con-
ditions were optimal for krill foraging in terms of food resources. Michaelis-Menton curves fitted to Antarctic
krill (E. superba) growth (length) compared to environmental Chl-a levels show half-saturation constants of just
0.33–0.5 µg Chl-a L−1 55-57; insofar as crystal krill (a smaller krill species) growth saturation rates are not appre-
ciably faster, Chl-a concentrations should have been saturating for crystal krill over at least the top 100 m of the
water column during our study (Fig. 3). Given that food resources were sufficient down to 100 m, krill would
be expected to reduce their high risk of predation in shallower waters by moving deeper in the water column or
under the fast ice. While observed krill distributions match this risk-reward theory (confirming Hypothesis 2),
we did not observe any locations that could be classified as unsuitable for krill foraging in the vertical dimension.
Therefore we were not able to precisely evaluate whether krill distributions where associated with their foraging
resources (Hypothesis 1). The vertical distributions of silverfish aggregation patterns likewise could not be effec-
tively compared to the phytoplankton bloom due to its almost complete overlap with our acoustic observation
range.
Following from the risk-reward theory, if foraging opportunities for krill were not restricting, then other fac-
tors besides risky prey behavior made the McMurdo MIZ a hotspot for penguin and whale foraging during our
study period. Heavy pack ice cover associated with the fast ice edge, a stark boundary of both light availability and
predator exclusion, may lead to greater prey prevalence nearer the surface, given the light-avoidance behavior
exhibited by both krill and silverfish to avoid visual predation52,58,59. Marine predators often aggregate at frontal
zones where habitat changes abruptly22,60, where they take advantage of prey species’ transitional behaviors as they
Scientific Reports | (2020) 10:7282 | https://doi.org/10.1038/s41598-020-63875-y 10www.nature.com/scientificreports/ www.nature.com/scientificreports
move between environmental conditions61. Confirming Hypothesis 3, penguins in this study made deeper, darker
dives and performed more undulations (indicative of prey capture) while concentrating foraging at the McMurdo
Sound fast ice edge, similar to penguins in the Ross Sea that apparently encounter more prey during darker
dives62. Typically snow-covered, McMurdo Sound fast ice transmitswww.nature.com/scientificreports/ www.nature.com/scientificreports
species. All data collection activity and field study was performed in accordance with these permits and additional
relevant ACA guidelines and regulations.
Study area. We conducted this study, from early December 2014 through late January 2015, in the outer fast
ice region of McMurdo Sound (Fig. 1). McMurdo Sound is especially suited to further investigation of a mesos-
cale MIZ preyscape, due to its physical attributes and the logistical support available. The Sound is a U-shaped,
southern extension of the Ross Sea, 55 × 55 km, >3000 km2 in area and >700 m deep (Fig. 1). For a large part
of the year, its southern half is covered by fast ice (sea ice attached to land, Ross Island to the east, McMurdo Ice
Shelf to the south and Victoria Land to the west), with the ice edge established in winter almost always occurring
at the same location adjacent to Cape Royds, and extending westward54. The northern portion of the Sound is
occupied by the McMurdo Sound Polynya, which is a latent heat polynya kept open by prevailing southerly wind
continuously advecting sea ice8. Depending on wind strength and direction, the polynya may be completely open,
or may be covered by various concentrations of pack ice.
Lacking an oceanographic research vessel, we investigated a marine preyscape using tracked vehicles to access
a sampling grid set up on and through the McMurdo Sound fast ice, driving out from McMurdo Station in the
southern Sound (Fig. 1). In order to compare a preyscape relatively insulated from predation (fast ice interior)
with one in which predators are abundant (ice edge), the sampling grid was composed of 25 cm diameter holes
drilled through the fast ice, from its interior out to its edge. Through these holes we repeatedly deployed an
acoustic- and flourometric-equipped remotely-operated vehicle (ROV). We made three passes covering the entire
sampling grid: pass 1, 16 November-2 December; pass 2, 3–19 December; pass 3, 20 December-7 January. Up to
four stations were completed each day.
Sea ice cover was monitored using MODIS visible-band imagery (from the 250 m resolution Corrected
Reflectance[True Color] layers of the NASA Worldview website (http://worldview.earthdata.nasa.gov/; down-
loaded for 2014–2015); as well as daily records kept at our camp at Cape Royds. The distance from foraging loca-
tions to the fast ice edge was found as the minimum distance to the ice edge upon a particular date54. (Changes
to the ice edge occurred 3 times that we could distinguish from satellite images during the study period; Fig. 5).
Preyscape and water column data acquisition. To assess the temporal and spatial variability of the
preyscape, we sampled the grid (Fig. 1) three times with an acoustic-capable ROV (SCINI)73,74. Ice edge stations
were located within ca. 50 m of the ice edge during Pass 1, prior to ice edge retreat. The remaining stations were
1 km apart along three transects from the edge into the fast ice interior; along the edge stretching for 30 km,
stations were 3 km apart. We report on the latter two of these passes (grid samplings) that overlap with penguin
biologging and whale abundance surveys. We began to deploy data loggers on the foraging adult penguins after
20 December, as by that time, chicks had hatched and penguins were foraging much more frequently than earlier
in the study. Details of biologging are provided below.
Krill and fish were sampled acoustically and visually using the tethered SCINI ROV66. SCINI contained cam-
eras and thrusters, and towed a sensor package consisting of a WET Labs fluorometer (ECO-AFL/FL) and a
single-beam Biosonics 120 kHz DT-X echosounder74. The echosounder operated at a nominal ping rate of 1 ping
s−1; however, this rate was occasionally adjusted if false bottom signals were observed. The general profile of
a dive included a surface transect of ~300 m horizontal distance, where the acoustic transducer faced down-
ward, and also a dive to ~120 m if conditions allowed. Our surveys characterized the surface 200 m because the
signal-to-noise ratio of the transducer allowed resolving −80 dB targets at ~ 100 m range.
Raw acoustic data were analyzed using Echoview software75. Echogram data were saved to a depth of 500 m,
and background noise was removed76. All acoustic aggregations >4 pings wide were manually delineated, and
acoustic energy of the aggregations was integrated into bins of 6 s wide by 1 m in depth. To ground truth acoustic
signals, coincident visual targets were identified to the lowest taxonomic classification possible. Where visual
targets were not identifiable, acoustics were verified by comparing aggregation target strength, shape, density, and
texture and depth to a set of aggregations with positive visual classification.
Acoustic returns are presented as integrated acoustic energy (volume backscattering strength[Sv], in units of
dB re m−1). We did not attempt to transform integrated acoustic energy into biomass, since there was not enough
size class information to construct acoustic models of identified organisms. Therefore, with the assumption that
krill and silverfish body size distributions did not change substantially over the 8-week sampling period, the
acoustic values reported are comparable within the classified groups of krill or silverfish, but not between these
two groups.
Water column properties were measured at each ROV sampling station using a Seabird Electronics 19+ CTD
that measured salinity, temperature and fluorescence. The depth of the 1% light level penetrating into the water
column was calculated using the depth-binned chlorophyll concentrations fed into an optical model77 that utilizes
the thicknesses and types of snow, sea ice, and water column properties to calculate underwater irradiances.
Adélie penguin diet and foraging. We assessed the overall diet being consumed by penguins in the Cape
Royds colony by observing the color and consistency of food as it passed from parents to chicks during feeds
observed on a daily basis; this was easily seen by using binoculars for a side view of feeding events5,21,46. The per-
centage of krill, fish and “other” was estimated in each observation. Previous ground-truthing, by stomach pump-
ing, revealed that entirely pink paste was crystal krill (100%), and gray, chunky paste was silverfish (100%)21,42,46,47.
Previous work also showed that chick diet represented quite well that of the adults/parents42,43. Diet observations
began on 14 December 2014 (when approximately 5% of chicks had hatched) and continued until 22 January
2015. To obtain adequate sample size, diet observations were grouped into 5–6 d periods, centered to coincide
with the start of the second pass of prey sampling (i.e., 20 December; see below).
Scientific Reports | (2020) 10:7282 | https://doi.org/10.1038/s41598-020-63875-y 12www.nature.com/scientificreports/ www.nature.com/scientificreports
Once sufficient numbers of chicks hatched thus to make their parents easily available (20 December), we
equipped randomly 18 selected parents with SPLASH tags (wildlifecomputers.com). Parents with chicks forage
intensely, and are also easily located upon return to the colony. The tags recorded depth, light, and temperature
each second, and determined position using ARGOS satellites (see below). The tags, applied to the lower back
just forward of the tail, weighed 62 g (1.6% of a 4-kg Adélie penguin) and had a cross-sectional area of 3.2 cm2
(1.0–1.6% of a penguin’s cross-sectional area). We attempted to retrieve the tags after one or two foraging trips
(this was not always possible) and attach them, using tape, to the next set of individuals78. Only one parent was
instrumented from a particular nest. Up to three penguins were instrumented at a given time; penguins recorded
from 1–7 foraging trips per deployment.
The tags were set to transmit locations every 45 s for the first eight successive transmissions and then switched
to once every 90 s, with up to 1440 transmissions allowed per day. They turned off if they were dry for 6 h (pen-
guin out of water) in order to conserve batteries. Diving data were downloaded from the tags after retrieval.
We used data from all trips for which both dive data and location data were available, except for cases in which
locations indicated errors5,48,79. Because of different temporal resolution between dive (1 s) and accepted location
data (15 min, after interpolation), we used temporal proximity to assign each dive an approximate geographic
location, as we have done previously5,62. We assumed that the follow-on interpolated positions were adjacent in
space and time from a temporally known position (TKP). We removed highly interpolated positions (>30 min
TKP), which allowed more dives to be included in the analysis, while reducing the locational errors. In total, the
data set included information from 18 tagged penguins making 50 foraging trips.
Dive data were initially processed using the program divesum (v.7.5.5; G. Ballard, unpublished software). This
program computed several dive parameters, such as maximum dive depth, time spent at the bottom phase of each
dive, and number of undulations (changes in depth >1 m, from ascent to descent). Divesum also classified dives
into three types: foraging, exploratory, and other5,48,79. Foraging dives contain undulations in the bottom phase,
with undulations considered to represent prey capture attempts; exploratory dives were just up and down with
no time spent at depth and “other” were shallow, traveling dives62,80. Divesum also summarized light recorded
during foraging dives into means of light levels at ~ 5 m depth (indicating surface light availability) and light levels
during the dive bottom phase (indicating light levels during foraging). Light levels were log-transformed before
performing statistical tests81.
Predator/competitor abundance. To provide more ecological context, we investigated the prevalence of
various potential penguin competitors. Due to inability to assess presence of these species in the open waters of
the polynyas, we assessed abundance along the ice edge as an index to prevalence. The occurrence of cetaceans
in McMurdo Sound for several years, including the study year, has been detailed in publications elsewhere20,41.
We obtained an index to whale presence by visual observations (telescope and binoculars) once or twice per day,
weather permitting, from a coastal hill at Cape Royds 30 m above sea level20,21. Observation periods lasted for an
hour. We could effectively scan along the ice edge out to about 3 km, as well as adjacent open or pack-ice-covered
waters. Observations were made between 20 November and 26 January, with gaps during 22–26 December, 29
December-9 January, and 19–25 January, in part related to poor visibility.
To ground-truth the abundance of whales, and assess abundance of seals and emperor penguins along the
entire cross-Sound ice edge, we counted these species by helicopter at several-day intervals, mid-November to
mid-January, weather permitting. Flights were made 20 November, 2, 8 and 27 December, and 10 January. The
flights followed the fast ice edge in both directions between Cape Royds as well as a few kilometers north, i.e. both
arms of the fast ice “L” (Fig. 1;54).
Statistical analysis. Penguin dive data were tested for a relationship to the fast ice edge using regres-
sion analysis in the R computing environment82, controlling for individual penguin as a random effect using
the “lmer” function within the {lme4} package as part of the maximum likelihood method (REML)83. To test
for relationships or correlations among penguin dive parameters, mixed-effect models were evaluated with the
distance to the fast ice edge as the single fixed-effect, and individual penguin as a random effect. To test for
sinusoidal variability in penguin dive parameters, similar models were constructed predicting dive parameters
(treatment) using a cosine function with wavelength of one day and phase shift of pi/6 (i.e. the peak of the cosine
function set to 14:00 daily) as the fixed effect and individual penguin as a random effect. Individual tests were
performed for each fixed-effect. Light-related variables and the distance of foraging penguins to the fast ice edge
were log-transformed to normalize their distributions.
Kendall rank correlations were calculated between penguin diet fractions and preyscape variables, with mul-
tiple tests accounted for with Holm-Bonferroni corrections (also using R). We assumed that penguin diet obser-
vations and dive data were representative of the colony population as a whole. This approximation is acceptable
given that individual penguins did not forage in completely independent areas37,48, and diet observations were
randomized as opportunistic encounters.
To test for difference in prey distribution at the ice edge, volume backscattering values were pooled into edge
(still beneath fast ice but within 1 km of open water, the likely excursion distance of a minke whale foraging
under the ice41; see Fig. 1) and interior (>1 km under the fast ice edge). We then binned the acoustic returns into
10 m-depth intervals, and tested whether krill abundance differed, across depths, between edge sites – where
penguins (and minke whales) could access krill – and interior sites under the ice – where penguins (and minke
whales) could not access krill. Across deployments, abundance measurements were typically zero with occa-
sional aggregations of krill or silverfish. Where krill occurred, they usually spanned multiple depths, thus krill
abundance was not independent across depths for a given date and site of deployment. The patchiness of krill
aggregations meant that hypothesis testing with typical parametric tests would have violated test assumptions.
Scientific Reports | (2020) 10:7282 | https://doi.org/10.1038/s41598-020-63875-y 13www.nature.com/scientificreports/ www.nature.com/scientificreports
Thus, we performed a permutation test84. For each permutation, the designation of ice edge versus interior
was reassigned keeping the number of edge and interior deployments constant at 30 and 54. The difference in
mean krill abundance between edge versus interior sites, xj, was recorded for each of B = 10,000 permutations.
The p-value for observing the recorded difference, X = [depth at edge] –[depth at interior sites], was calculated
using the following equation82:
1 + ∑ Bj =1I (xj ≤ X )
P=
B+1
where I is the indicator function that takes the value one when the argument is true and zero when it is false. Note
that for depths 10–60 m (the standard foraging depth range of Adélie penguins) we expect that xj < X for prey
species, which would be indicative of lower prey concentrations at edge sites.
Graphics and plotting. Figures 1 and 5 were produced using QGIS85 geographic information system soft-
ware. Data used for coastlines and glacial ice are derived from the SCAR Antarctic Digital Database86 available
through the QAntarctica87 package, and bathymetry data is from Antarctica New Zealand and GNS Science88.
Figures 3, 4, 6, and 7 were producing using the Matplotlib89 graphical package, with Fig. 6 using the additional
seaborn90 package. Figures 2, 8, 9, and 10 were made using Microsoft Office 2016.
Data availability
Except where otherwise noted in the text, all data for this paper are hosted at BCO-DMO, in project ‘Food web
dynamics in an intact ecosystem: the role of top predators in McMurdo Sound’ (http://www.bco-dmo.org/
project/665131). Data on penguin foraging and whale censuses are available at California Avian Data Center
(CADC) hosted by Point Blue Conservation Science and metadata are registered with the “Antarctic Master
Directory” (http://gcmd.nasa.gov/KeywordSearch/Home.do?Portal=amd&MetadataType=0). Data are and will
be available at CADC: http://data.prbo.org/apps/penguinscience/.
Received: 24 January 2019; Accepted: 3 April 2020;
Published: xx xx xxxx
References
1. Smith, W. O. & Nelson, D. M. Phytoplankton bloom produced by a receding ice edge in the Ross Sea: spatial coherence with the
density field. Science 227, 163–166 (1985).
2. Jones, R. M. & Smith, W. O. Jr. The influence of short-term events on the hydrographic and biological structure of the southwestern
Ross Sea. J. Mar. Syst. 166, 184–195 (2018).
3. Joy-Warren, H. et al. Light is the primary driver of early season phytoplankton production along the western Antarctic Peninsula. J.
Geophys. Res. Oceans 124, https://doi.org/10.1029/2019JC015295 (2019).
4. Saba, G. K. et al. Winter and spring controls on the summer food web of the coastal West Antarctic Peninsula. Nature
Communications 5, 4318, https://doi.org/10.1038/ncomms5318 (2014).
5. Ainley, D. G. et al. Trophic cascades in the western Ross Sea, Antarctica: revisited. Mar. Ecol. Prog. Ser. 534, 1–16 (2015).
6. Montes-Hugo, M. et al. Recent changes in phytoplankton communities associated with rapid regional climate change along the
western Antarctic Peninsula. Science 323, 1470–1473 (2009).
7. Arrigo, K. R. & van Dijken, G. L. Annual changes in sea-ice, chlorophyll a, and primary production in the Ross Sea, Antarctica.
Deep-Sea Res. II 51, 117–138 (2003).
8. Arrigo, K. R., van Dijken, G. L. & Strong, A. L. Environmental controls of marine productivity hot spots around Antarctica. J.
Geophys. Res. Oceans, https://doi.org/10.1002/2015JC010888 (2015).
9. Daly, K. L. & Macaulay, M. C. Influence of physical and biological mesoscale dynamics on the seasonal distribution and behavior of
Euphausia superba in the Antarctic marginal ice zone. Mar. Ecol. Prog. Ser. 79(1-2), 37–66 (1991).
10. Smith, W. O. Jr., Ainley, D. G., Cattaneo-Vietti, R. & Hofmann, E. E. The Ross Sea continental shelf: Regional biogeochemical cycles,
trophic interactions, and potential future changes in Antarctic Ecosystems: An Extreme Environment in a Changing World (eds.
Rogers, A. D., Johnston, N. M., Murphy, E. J. & Clarke, A.) 213-242 (Blackwell Publishing, 2012).
11. Daly, K. L. & Macaulay, M. C. Abundance and distribution of krill in the ice edge zone of the Weddell Sea, austral spring 1983. Deep-
Sea Res. 35, 21–41 (1988).
12. Brierley, A. S. et al. Antarctic krill under sea ice: elevated abundance in a narrow band just south of ice edge. Science 295, 1890–1892
(2002).
13. Cimino, M. A., Moline, M. A., Fraser, W. R., Patterson-Fraser, D. L. & Oliver, M. Climate-driven sympatry may not lead to foraging
competition between congeneric top-predators. Sci. Rep. 6, 18820, https://doi.org/10.1038/srep18820 (2016).
14. Hamner, W. M. & Hamner, P. P. Behavior of Antarctic krill (Euphausia superba): schooling, foraging, and antipredatory behaviour.
Can. J. Fish. Aquat. Sci. 57, 192–202 (2000).
15. Bernard, K. S. & Steinberg, D. K. Krill biomass and aggregation structure in relation to tidal cycle in a penguin foraging region off
the Western Antarctic Peninsula. ICES J. Mar. Sci. 70, 834–849 (2013).
16. Santora, J. A. et al. Krill space: a comparative assessment of mesoscale structuring in polar and temperate marine ecosystems. ICES
J. Mar. Sci., https://doi.org/10.1093/icesjms/fss048 (2012).
17. Loeb, V. J. & Santora, J. A. Climate variability and spatiotemporal dynamics of five Southern Ocean krill species. Prog. Oceanogr.
https://doi.org/10.1016/j.pocean.2015.01.002 (2015).
18. Ribic, C. A. et al. Water masses, ocean fronts, and the structure of Antarctic seabird communities: Putting the eastern Bellingshausen
Sea in perspective. Deep-Sea Res. II 58, 1695–1702 (2011).
19. Bernard, K. S. et al. Factors that affect the nearshore aggregations of Antarctic krill in a biological hotspot. Deep-Sea Res. I 126,
139–147, https://doi.org/10.1016/j.dsr.2017.05.008 (2017).
20. Ainley, D. G. et al. Spatio-temporal occurrence patterns of cetaceans near Ross Island, Antarctica, 2002-2015: implications for
foodweb dynamics. Polar Biol. 40, 1761–1775 (2017).
21. Ainley, D. G., Ballard, G. & Dugger, K. M. Competition among penguins and cetaceans reveals trophic cascades in the Ross Sea,
Antarctica. Ecology 87, 2080–2093 (2015).
22. Ribic, C. A. et al. Water masses, ocean fronts, and the structure of Antarctic seabird communities: putting the eastern Bellingshausen
Sea in perspective. Deep-Sea Res. II 58, 1695–1709 (2011).
Scientific Reports | (2020) 10:7282 | https://doi.org/10.1038/s41598-020-63875-y 14www.nature.com/scientificreports/ www.nature.com/scientificreports
23. Ainley, D. G., Smith, W. O., Sullivan, C. W., Torres, J. J. & Hopkins, T. L. Antarctic mesopelagic micronekton: evidence from seabirds
that pack ice affects community structure. Science 232, 847–850 (1986).
24. Arrigo, K. R. & van Dijken, G. L. Phytoplankton dynamics within 37 Antarctic coastal polynya systems. J. Geophys. Res. 108 (C8),
3271, https://doi.org/10.1029/2002JC001739.
25. Fraser, W. B. & Ainley, D. G. Ice edges and seabird occurrence in Antarctica. BioScience 36, 258–263 (1986).
26. Karnovsky, N., Ainley, D. G. & Lee, P. The impact and importance of production in polynyas to top-trophic predators: three case
histories in Polynyas (eds. Smith, W.O. Jr. & Barber, D. G.) 391-410 (Elsevier Publishers, 2007).
27. van Franeker, J. A. Top predators as indicators for ecosystem events in the confluence zone and marginal ice zone of the Weddell and
Scotia Seas, Antarctica, November 1988 to January 1989 (EPOS Leg 2). Polar Biol. 12, 93–102 (1992).
28. Rau, G. H., Ainley, D. G., Bengtson, J. L., Torres, J. J. & Hopkins, T. L. 15N/14N and 13C/12C in Weddell Sea birds, seals, and fish:
implications for diet and trophic structure. Mar. Ecol. Prog. Ser. 84, 1–8 (1992).
29. Hopkins, T. L., Ainley, D. G., Torres, J. J. & Landcraft, T. M. Trophic structure in open waters of the marginal ice zone in the Scotia-
Weddell confluence region during spring (1983). Polar Biol. 13, 389–397 (1993).
30. Ribic, C. A., Fraser, W. R. & Ainley, D. G. Habitat selection by marine mammals in the marginal ice zone. Antarc. Sci. 3, 181–186
(1991).
31. Ainley, D. G. The Adélie Penguin: Bellwether of Climate Change (Columbia Univ. Press, 2002).
32. Massom, R. A., Harris, P. T., Michael, K. J. & Potter, M. J. The distribution and formative processes of latent-heat polynyas in East
Antarctica. Ann. Glaciol. 27, 420–426 (1998).
33. Deibel, D. and K. L. Daly. Zooplankton Processes in Arctic and Antarctic Polynyas. In, Smith, W.O., Jr. and D. Barber (eds.),
Polynyas: Windows into Polar Oceans. Elsevier Oceanogr. Ser. 74, 271-322 (2007).
34. Parkinson, C. L. A 40-y record reveals gradual Antarctic sea ice increases followed by decreases at rates far exceeding the rates seen
in the Arctic. Proc. Natl. Acad. Sci., https://www.pnas.org/cgi/doi/10.1073/pnas.1906556116 (2019).
35. Bronselaer, B. et al. Change in future climate due to Antarctic meltwater. Nature, https://doi.org/10.1038/s41586-018-0712-z (2018).
36. Oliver, M. J. et al. Adélie Penguin foraging location predicted by tidal regime switching. PLoS ONE 8(1), e55163, https://doi.
org/10.1371/journal.pone.0055163 (2013).
37. Ainley, D. G. et al. Geographic structure of Adélie Penguin populations: size, overlap and use of adjacent colony-specific foraging
areas. Ecol. Monogr. 74, 159–178 9 (2004).
38. Stirling, I. Distribution and abundance of the Weddell seal in the western Ross Sea, Antarctica. N.Z. J. Mar. Freshwater Res. 3,
191–200 (1969).
39. Ainley, D. G., LaRue, M. A., Stirling, I., Stammerjohn, S. & Siniff, D. B. An apparent population decrease, or change in distribution,
of Weddell seals along the Victoria Land coast. Mar. Mamm. Sci. 31, 1338–1361 (2015).
40. Pitman, R. L., Fearnbach, H. & Durban, J. W. Abundance and population status of Ross Sea killer whales (Orcinus orca, type C) in
McMurdo Sound, Antarctica: evidence for impact by commercial fishing? Polar Biol., https://doi.org/10.1007/s00300-017-2239-
42018 (2018).
41. Ainley, D. G. et al. Foraging patterns of Antarctic minke whales in McMurdo Sound and effects on prey and competitors. Antarc.
Sci., in revision.
42. Ainley, D. G. et al. Spatial and temporal variation of diet composition and quality within a presumed metapopulation of Adélie
Penguins. Condor 105, 95–106 (2003).
43. Ainley, D. G. et al. Diet and foraging effort of Adélie penguins in relation to pack-ice conditions in the southern Ross Sea. Polar Biol.
20, 311–319 (1998).
44. Hopkins, T. L. Midwater food web in McMurdo Sound, Ross Sea, Antarctica. Mar. Biol. 96, 93–106 (1987).
45. Eastman, J. T. Pleuragramma antarcticum (Pisces, Nototheniidae) as food for other fishes in McMurdo Sound, Antarctica. Polar
Biol. 4, 155–160 (1985).
46. Ainley, D. G. et al. Post-fledging survival of Adélie penguins at multiple colonies: chicks raised on fish do well. Mar. Ecol. Prog. Ser.
601, 239–251 (2018).
47. Whitehead, A. L. et al. Factors driving Adélie penguin chick size, mass and condition at colonies of differing size in the southern
Ross Sea. Mar. Ecol. Prog. Ser. 523, 199–213 (2015).
48. Ford, R. G. et al. Testing assumptions of central place foraging theory: a study of Adélie penguins Pygoscelis adeliae in the Ross Sea.
J. Avian Biol. 46, 193–206 (2015).
49. Ballance, L. T., Ainley, D. G., Ballard, G. & Barton, K. An energetic correlate between colony size and foraging effort in seabirds, an
example of the Adélie penguin Pygoscelis adeliae. J. Avian Biol. 40, 279–288 (2009).
50. Ballard, G., Jongsomjit, D., Veloz, S. D. & Ainley, D. G. Coexistence of mesopredators in an intact polar ocean ecosystem: The basis
for defining a Ross Sea marine protected area. Biol. Conserv. 156, 72–82 (2012).
51. Regular, P. M., Hedd, A. & Montevecchi, W. A. Fishing in the dark: a pursuit-diving seabird modifies foraging behaviour in response
to nocturnal light levels. PLoS ONE 6(10), e26763, https://doi.org/10.1371/journal.pone.0026763 (2011).
52. Fuiman, L. A., Davis, R. W. & Williams, T. M. Behaviour of midwater fishes under the Antarctic ice: observations by a predator. Mar.
Biol. 140, 815–822 (2002).
53. Cronin, T. W. et al. Coping with copepods: do right whales (Eubalaena glacialis) forage visually in dark waters? Phil. Trans. Roy. Soc.
B 372, 20160067, https://doi.org/10.1098/rstb.2016.0067 (2017).
54. Kim, S., Saenz, B., Scanniello, J., Daly, K. & Ainley, D. Local climatology of fast ice in McMurdo Sound, Antarctica. Antarc. Sci. 30(2),
125–142 (2018).
55. Ross, R. M., Quetin, L. B., Baker, K. S., Vernet, M. & Smith, R. C. Growth limitation in young Euphausia superba under field
conditions. Limnol. Oceanogr. 45, 31–43 (2000).
56. Atkinson, A., Shreeve, R. S. & Hirst, A. G. Natural growth rates in Antarctic krill (Euphausia superba): II. Predictive models based
on food, temperature, body length, sex, and maturity stage. Limnol. Oceanogr. 51(2), 973–987 (2006).
57. Schmidt, K. & Atkinson, A. Feeding and food processing in Antarctic Krill (Euphausia superba Dana) in (ed. Siegel, V.) Biology and
Ecology of Antarctic Krill (Advances in Polar Ecology) 175-224 (Springer, Cham, 2016).
58. Kaufmann, R. S. et al. Temporal patterns in the distribution, biomass and community structure of macrozooplankton and
micronekton within Port Foster, Deception Island, Antarctica. Deep-Sea Res. II 50(10), 1765–1785 (2003).
59. Robison, B. H. What drives the diel vertical migrations of Antarctic midwater fish? J. Mar. Biol. Assoc. UK 83, 639–642 (2003).
60. Bost, C. A. et al. The importance of oceanographic fronts to marine birds and mammals of the southern oceans. J. Mar. Syst. 78(3),
363–376 (2009).
61. Waggitt, J. J. et al. Combined measurements of prey availability explain habitat selection in foraging seabirds. Biol. Lett. 14, 20180348,
https://doi.org/10.1098/rsbl.2018.0348 (2018).
62. Ballard, G. et al. Fine-scale oceanographic features characterizing successful Adélie penguin foraging in the SW Ross Sea. Mar. Ecol.
Prog. Ser. 608, 263–277 (2019).
63. Palmisano, A. C. & Sullivan, C. W. Sea ice microbial communities (SIMCO) 1. Distribution, abundance, and primary production of
ice microalgae in McMurdo Sound, Antarctica in 1980. Polar Biol. 2, 171–177 (1983).
64. Soohoo, J. B. et al. Spectral light absorption and quantum yield of photosynthesis in sea ice microalgae and a bloom of Phaeocystis
pouchetii from McMurdo Sound, Antarctica. Mar. Ecol. Prog. Ser. 39, 175–189 (1987).
Scientific Reports | (2020) 10:7282 | https://doi.org/10.1038/s41598-020-63875-y 15You can also read