Contacting domains segregate a lipid transporter from a solute transporter in the malarial host-parasite interface - Nature
←
→
Page content transcription
If your browser does not render page correctly, please read the page content below
ARTICLE
                  https://doi.org/10.1038/s41467-020-17506-9                OPEN

                  Contacting domains segregate a lipid transporter
                  from a solute transporter in the malarial
                  host–parasite interface
                  Matthias Garten 1, Josh R. Beck 2, Robyn Roth3, Tatyana Tenkova-Heuser1, John Heuser1, Eva S. Istvan                                                    4,

                  Christopher K. E. Bleck 5, Daniel E. Goldberg 4,6 ✉ & Joshua Zimmerberg 1,6 ✉
1234567890():,;

                  The malaria parasite interfaces with its host erythrocyte (RBC) using a unique organelle, the
                  parasitophorous vacuole (PV). The mechanism(s) are obscure by which its limiting mem-
                  brane, the parasitophorous vacuolar membrane (PVM), collaborates with the parasite plasma
                  membrane (PPM) to support the transport of proteins, lipids, nutrients, and metabolites
                  between the cytoplasm of the parasite and the cytoplasm of the RBC. Here, we demonstrate
                  that the PV has structure characterized by micrometer-sized regions of especially close
                  apposition between the PVM and the PPM. To determine if these contact sites are involved in
                  any sort of transport, we localize the PVM nutrient-permeable and protein export channel
                  EXP2, as well as the PPM lipid transporter PfNCR1. We find that EXP2 is excluded from, but
                  PfNCR1 is included within these regions of close apposition. We conclude that the host-
                  parasite interface is structured to segregate those transporters of hydrophilic and hydro-
                  phobic substrates.

                  1 Sectionon Integrative Biophysics, Eunice Kennedy Shriver National Institute of Child Health and Human Development, National Institutes of Health,
                  Bethesda, MD 20892, USA. 2 Department of Biomedical Sciences, Iowa State University, Ames, IA 50011, USA. 3 Department of Cell Biology and Physiology,
                  Washington University School of Medicine, St. Louis, MO 63110, USA. 4 Departments of Medicine and Molecular Microbiology, Washington University
                  School of Medicine, St. Louis, MO 63110, USA. 5 Electron Microscopy Core Facility, National Heart, Lung and Blood Institute, National Institutes of Health,
                  Bethesda, MD 20892, USA. 6These authors jointly supervised this work: Daniel E. Goldberg, Joshua Zimmerberg. ✉email: dgoldberg@wustl.edu;
                  zimmerbj@mail.nih.gov

                  NATURE COMMUNICATIONS | (2020)11:3825 | https://doi.org/10.1038/s41467-020-17506-9 | www.nature.com/naturecommunications                                 1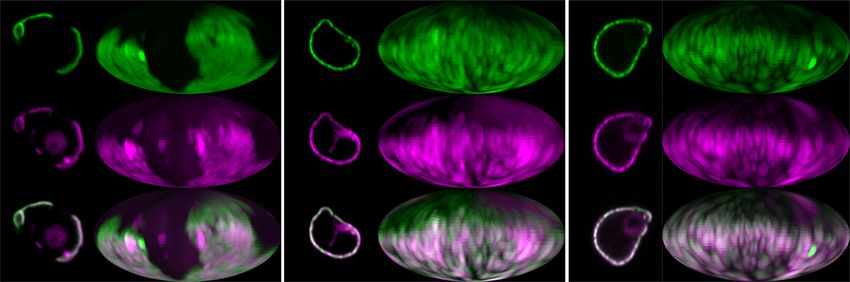
ARTICLE                                                                 NATURE COMMUNICATIONS | https://doi.org/10.1038/s41467-020-17506-9

M
          orbidity and mortality in malaria are due to the api-              domains in living parasites and to control for chemical fixation
          complexan Plasmodium spp. replicating within the host              artefacts, a parasite line bearing a C-terminal mNeonGreen
          RBC. During its initial invasion of the erythrocyte, the           (mNG) fusion to the endogenous copy of EXP2 (EXP2-mNG)
parasite invaginates the RBC plasma membrane to form the PV                  was examined14. In these parasites, the mNG signal also was
as a second barrier1,2. The parasite must install its own, unique            found in continuous patches, interrupted by stretches of PVM
transport systems in order to import and export everything it                devoid of mNG (Fig. 2b). To quantify and visualize these
needs for its survival and proliferation3–5. Understanding the               apparent domains of EXP2, we developed a simple tool: a pro-
underlying transport mechanisms between the parasite and its                 jection of the maximum fluorescence intensity from the inside of
host is useful to identify drug targets. Yet, these crucial transport        the parasite onto a sphere. This results in a map of the fluores-
systems remain incompletely understood for both hydrophilic                  cence signal of the periphery of the parasite (Fig. 2c–e). Both
and hydrophobic substances.                                                  techniques show a protein domain coverage on the order of 50%
   A PVM channel, permeable to water-soluble nutrients like                  around the parasite (Supplementary Fig. 1).
monosaccharides and amino acids3, is formed by the “exported                    Two physically independent techniques to visualize
protein 2” or EXP26. EXP2 also facilitates protein export, by                EXP2 spatial organization indicate its domain structure. Thus,
serving as the protein-permeant pore for the “Plasmodium                     EXP2-mNG can serve as a robust and readily detected marker for
translocon of exported proteins” (PTEX)7. A number of PPM                    such PVM domains, labeling regions of protein export and
channels, including several that are specific for particular nutri-           transport of small water-soluble molecules.
ents have been identified and studied8,9. However, it is not known
how lipidic substances are transported across the PV, since the
                                                                             EXP2 co-localizes with PV lumen. The EM-findings of two
two limiting membranes have never been seen to connect or to
                                                                             regions with distinct PVM-PPM separation-distances and the
transport membrane vesicles between each other4. The PPM
                                                                             light microscopy findings of domains for protein export and
resident protein “Plasmodium Niemann-Pick C1-related protein”
                                                                             nutrient import represented by EXP2 led us to hypothesize that
(PfNCR1) is essential for lipid homeostasis10 but it is unknown
                                                                             these features could be correlated.
how it functions. It is not clear how the PV is organized, in order
                                                                                To determine the distribution of the EXP2-domains relative to
to support the transport of such a large variety of substrates.
                                                                             PV domains with distinct lumenal space, their localization was
   Here we show that the structure of the PV is built such that it
                                                                             carefully mapped. Thus, a fluorescent label for the PV lumen was
can support direct exchange of lipids across the PV space, directly
                                                                             required that could be compared with the distribution of EXP2-
between the PPM and PVM, in regions that can be defined as
                                                                             mNG. To this end, mRuby3 was targeted to the PV lumen using
membrane contact sites (MCS)11. While MCS between intracel-
                                                                             the signal peptide of HSP101 (PV-mRuby3)15,16. To verify that
lular organelles are abundant11, and cell-cell junctions are clas-
                                                                             PV-mRuby3 would serve as a genuine label of the PV lumen,
sically defined12, very little is known about the contacts between
                                                                             correlative light/electron microscopy after cryo-thin sectioning
membranes that delimit extracellular junctions within cells, such
                                                                             was performed17. PV-mRuby3 was indeed found to localize to the
as those of chloroplasts and intracellular parasites. The structural
                                                                             regions of wider separation between PVM and PPM, confirming
and molecular data presented here assigns a functional sig-
                                                                             that it would serve a label for the accessible PV space (Fig. 3a,
nificance to a macroscopic membrane domain.
                                                                             Supplementary Fig. 2).
                                                                                Co-expression and two-color imaging of EXP2-mNG and PV-
Results                                                                      mRuby3 demonstrated a clear-cut colocalization of both labels
Regions of close PVM-PPM apposition exist. Ultra-thin sections               around the periphery of the parasite (Fig. 3b). The mean Pearson-
of chemically fixed, resin-embedded parasitized red cells were                correlation coefficient for the analyzed sample is 0.78 [0.75, 0.80]
examined in the electron microscope (EM) to determine the                    (mean [95% CI], N = 38 cells) (Fig. 3c) as a mathematical
separation distance between PVM and PPM. Since transport                     measure for the degree of signal overlap, with numbers from −1
across the PV is most active in the trophozoite stage, i.e. the stage        (perfectly anti-correlated), 0 (not correlated) to 1 (perfectly
when parasites have begun to accumulate hemozoin and grow the                correlated).
fastest but have not begun to divide13, only this stage was con-                Thus, EXP2 distribution can be correlated with regions of the
sidered. An example image is shown in (Fig. 1a). The distribution            wide, mRuby3 accessible lumen. EXP2 is bound to the PVM,
of separations between PVM and PPM was found to be bimodal,                  while PV-mRuby3 is detected in the PV-lumen in between the
indicating two distinct structural regions: regions of “close                PVM and PPM, on average 20–40 nm from the PVM. Within the
membrane apposition”, separated by ~9 nm, and regions of ‘PV                 limits of optical microscopy, they colocalize. Therefore, protein
lumen’ with a wider mean separation of 20–40 nm. To control for              export, nutrient import, and presumably aqueous waste export
possible artifacts introduced by chemical fixation, infected red              occur in the regions of the PV lumen.
cells were also prepared by a quick-freeze, freeze-fracture method
that preserved cells in their most lifelike state. Still, these two
                                                                             PfNCR1 anti-localizes with EXP2 and the PV lumen. Sites of
distinct types of regions could be clearly discerned (Fig. 1b). In
                                                                             close membrane contact are implicated in direct transfer of lipids
conclusion, both regions are narrow enough that they could be
                                                                             via intervening or included proteins that localize to those
bridged by protein complexes that could interconnect the PVM
                                                                             domains11. In the PPM PfNCR1 has been found to be essential
and PPM membranes, and thus are candidates for membrane
                                                                             for the maintenance of lipid homeostasis10. However, its human
contact sites11.
                                                                             homolog, Niemann-Pick C1 (hNPC1) relies on a co-factor
                                                                             hNPC2, to transport lipids18; no such co-factor has been identi-
EXP2 localizes in domains of the PVM. A functionally char-                   fied in Plasmodium spp., suggesting that PfNCR1 may work dif-
acterized marker of the PVM, EXP26, was used to investigate the              ferently. Thus, localizing PfNCR1 with respect to the separation-
domain structure of the PVM. To test domain formation in fixed                distances of the membranes of the PV is indicative in order to
but label-free, unmodified parasites (NF54), an immuno-                       determine if PfNCR1 can be expected to transport lipids by
fluorescence assay using EXP2 antibodies was performed. EXP2                  interacting with a soluble cofactor from the PV lumen, or whether
was found in patches, interrupted by stretches of PVM devoid of              it interacts directly with the PVM at sites of close membrane
anti-EXP2 label (Fig. 2a). To test if these regions of EXP2 were             apposition.

2                NATURE COMMUNICATIONS | (2020)11:3825 | https://doi.org/10.1038/s41467-020-17506-9 | www.nature.com/naturecommunications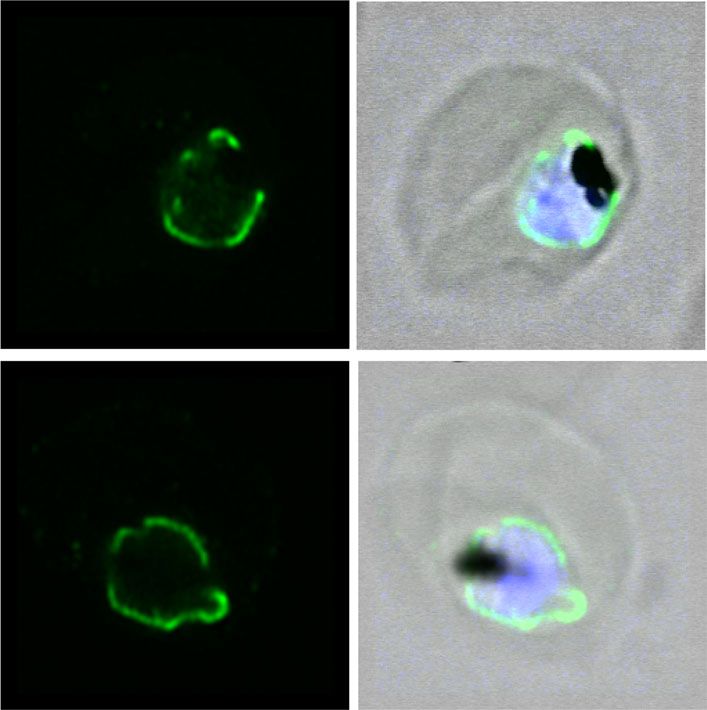
NATURE COMMUNICATIONS | https://doi.org/10.1038/s41467-020-17506-9                                                                                          ARTICLE

                        a
                                                                                                                   2.5

                                Red blood cell                                                                      2

                                                                                               Length of PV (Pm)
                                                                                                                   1.5

                                                                                                                    1
                                             Parasite

                                                                                                                   0.5

                                                                                                                    0
                                                                                                                         0   10 20 30 40 50 60         70
                                                                                                                             PVM – PPM distance (nm)

                        b

Fig. 1 The PV exhibits two structurally distinct regions. a (left) Thin section electron micrograph of a Plasmodium falciparum (NF54attb) infected red blood
cell. The inset highlights the PVM and PPM. (right) Histogram of the PVM-PPM distance collected from single sections of seven parasites in six images in
regions where both membranes are cut at a right angle. The histogram y-axis is scaled to reflect length of the sampled PV: 29.4 µm PV were sampled in
total. The distribution can be fit to a two-component mixture model (see methods) with mean 1 = 8.7 nm [8.3 nm, 9.1 nm] (mean [95% CI]) and mean 2 =
26.9 nm [26.6 nm, 27.3 nm]. b Freeze fracture of NF54attb. A region of PV lumen is visible in the left of the image and a region of close membrane
apposition is visible in the right side. a, b Scale bars: 100 nm. White arrows heads to the PVM, black arrow heads to the PPM. Source data are provided as a
Source Data file.

   To determine the distribution of PfNCR1 relative to the                         One function of proteins at MCS can be maintenance of
domains defined by EXP2 and the PV lumen, an endogenous                          membrane distance11. To determine if PfNCR1 is involved in the
EXP2-mRuby3 fusion was engineered into a parasite expressing                    maintenance of membrane distance, PVM-PPM distance was
an endogenous PfNCR1-GFP fusion protein, allowing both                          recorded in PfNCR1 knock-down parasites. Compared to the
proteins to be monitored by live fluorescence while preserving                   control, the knock-down shows large overlap of both means and
their native timing and expression levels. Two-color imaging                    confidence intervals describing membrane distance. While there
showed that localization of the two labels is anti-correlated                   was more region with larger membrane distance in the knock-
around the periphery of the parasite (Fig. 4a). The mean                        down sample, this observation was found to be not significant
Pearson-correlation coefficient of this sample is −0.18 [−0.08,                  (Supplementary Fig. 5).
−0.28] (mean [95% CI], N = 39 cells), giving a mathematical                        From the observed anti-localization of the lumenal vs.
measure for the anti-correlation of both signals (Fig. 4b).                     hydrophobic transporter labels and the localization of PfNCR1
Positive values of the coefficient are caused by small domains,                  in electron micrographs, PfNCR1 is most likely localized to
approaching the resolution limit of light microscopy (~130 nm                   regions of close membrane apposition. The lack of effect of
in x–y direction and ~400 nm in z) with signals co-localizing at                PfNCR1 knock-down on the PV structure shows that
the border of domains. In contrast, larger domains having fewer                 PfNCR1 seems not to be playing a major role in the regulation
domain borders have more negative coefficients (see the                          of membrane distance.
sequence in Fig. 4a left to right). Anti-correlation was also
observed in parasites where the PV-mRuby3 lumenal reporter                      Discussion
was expressed in the PfNCR1-GFP background (Supplementary                       In studying how the malaria parasite modifies its protective
Fig. 3). For direct localization of PfNCR1 relative to PVM-PPM                  membrane barriers to import and export materials that it needs to
distance, the immuno-gold labeled PfNCR1-GFP dataset from                       survive and grow, we found that the host cell–parasite interface
Istvan et al.10 was reanalyzed. In this dataset PfNCR1 is                       (HPI) is a unique intercellular junction with clearly definable
enriched 40.0×[14.6×, 61.4×] (mean [95% CI], N = 1118 54                        regions of protein composition and variable separation, consisting
nm long membrane segments) in the closely apposed regions                       of a parasite vacuolar membrane, the lumen of the vacuole (that is
compared to the PV regions with wider PVM-PPM distance                          the parasite’s extracellular space), and the plasma membrane of
(Supplementary Fig. 4).                                                         the parasite. Different classes of molecules, hydrophobic and

NATURE COMMUNICATIONS | (2020)11:3825 | https://doi.org/10.1038/s41467-020-17506-9 | www.nature.com/naturecommunications                                          3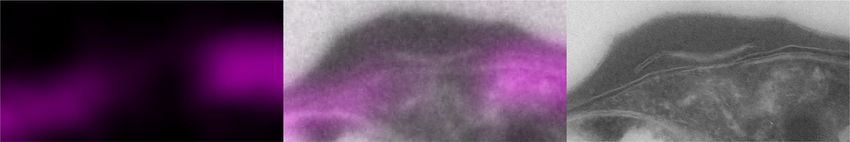
ARTICLE                                                                   NATURE COMMUNICATIONS | https://doi.org/10.1038/s41467-020-17506-9

                       a                                                      b

           c
                                        Spherical
                                        ‘maximum                                                 60°N
                                         intensity’                             Mapping
                                        projection                                        30°N

                                                                                                   120°W   60°W    0°     60°E     120°E      180°E
                                                                                          0°

                                                                                          30°S

                                                                                                 60°S

                        d                                                     e

Fig. 2 EXP2 is distributed in domains on the PVM. a Single confocal slices of an indirect immunofluorescence assay of NF54 showing EXP2 (green), DAPI
(blue) and bright field (gray). b Single confocal slices of a live cell image of EXP2-mNeonGreen. EXP2-mNeonGreen (green), bright field (gray). (A&B)
Scale bar: 1 µm. c Principle of the spherical intensity projection and mapping for the 2-dimensional analysis of the 3-dimensional dataset (see methods for
details). d, e Mollweide projection of the images in a, b, respectively.

hydrophilic, are transported through this one continuous,                      visible amount of the lumenal marker PV-mRuby3. In contrast,
spheroidal interface with distinct regions. This segregation of                we found that the parasite lipid transporter PfNCR1 was speci-
function is accomplished by the creation of MCS like those                     fically excluded from these regions and instead accumulated in
between cellular organelles19,20. Electron microscopy resolved the             the intervening regions of close PVM-PPM apposition. Taking all
PVM and the PPM, allowing quantification of their separation-                   this data into account, we propose that the PV has evolved to
distances, and confirming the visual impression that the PVM                    become laterally segregated into regions for hydrophilic transport,
and the PPM form distinct domains, characterized by a bimodal                  and separate closer-contact regions for hydrophobic transport. It
distribution of space between the two membranes. Using two                     will be necessary to functionally characterize and localize other
complimentary techniques, indirect immunofluorescence and                       proteins at the HPI to further bolster this hypothesis.
live-cell microscopy of fluorescently tagged EXP2, this solute-                    The distances between the PPM and PVM for both domains
transporter was detected in µm-sized domains that correlate                    could be bridged by proteins, potentially qualifying both regions
spatially with domains where the PVM and the PPM are sepa-                     as MCS11. However, in neither domain of the HPI were bridging
rated enough from each other for the vacuole to accumulate a                   proteins observed in our deep-etch EMs, nor were they observed

4                  NATURE COMMUNICATIONS | (2020)11:3825 | https://doi.org/10.1038/s41467-020-17506-9 | www.nature.com/naturecommunications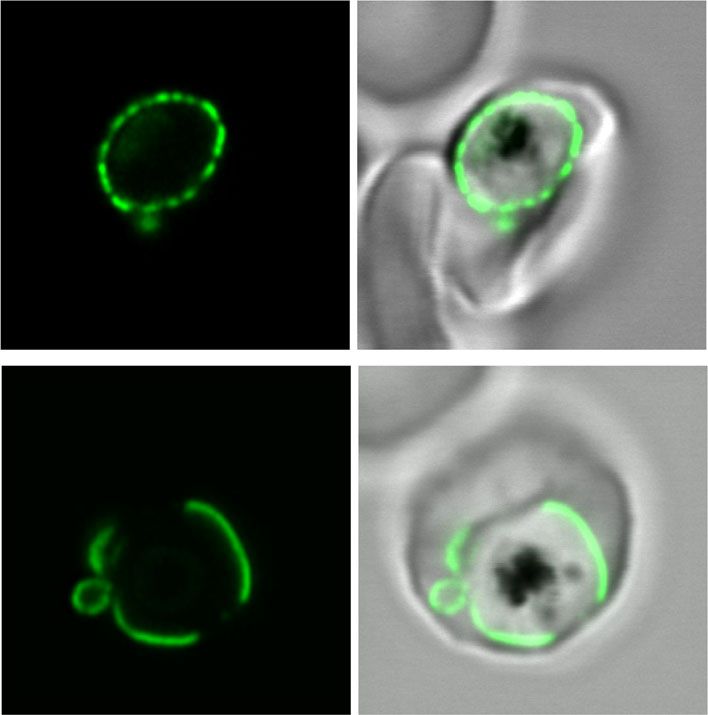
NATURE COMMUNICATIONS | https://doi.org/10.1038/s41467-020-17506-9                                                                                    ARTICLE

          a

      b

                                                  c                 25
                                                  Number of cells

                                                                    20
                                                                    15
                                                                    10
                                                                     5
                                                                     0
                                                                      –1   –0.8 –0.6 –0.4 –0.2    0    0.2   0.4      0.6   0.8   1
                                                                                    Pearson correlation coefficient

Fig. 3 Colocalization of vacuolar space with EXP2. a Detail of correlative light electron microscopy of EXP2-mNeonGreen—PV-mRuby3 parasites showing
the presence of PV-mRuby3 in the PV lumen and absence in the apposed membrane region (arrowhead) (see Fig. SI 2 for the full image, more details and
mNeonGreen channel). (magenta, left) mRuby3 signal in the Tokuyasu cryo-section. (middle) Overlay of confocal and electron microscopy image. (right)
Higher resolution electron microscopy image of the region. Scale bar: 100 nm. b Center confocal slice and Mollweide projections of EXP2-mNeonGreen—
PV-mRuby3 parasites. EXP2-mNeonGreen (green, top), PV-mRuby3 (magenta, middle), merge (bottom). Samples chosen represent examples of relatively
low (0.76), average (0.80) and high (0.89) Pearson correlation coefficients of the maps. White arrowheads show tubulovesicular network51 that has a
relatively higher density of EXP2. Scale bars: 1 µm. The dotted line labels the equator, corresponds to the confocal slice. c Histogram of Pearson correlation
coefficients of trophozoite stage EXP2-mNeonGreen—PV-mRuby3 parasites (N = 38 cells). Regions that extend from the parasite to form the
tubulovesicular network were excluded for the correlation analysis. Source data are provided as a Source data file.

in our thin-section EMs. However, when the PV is induced to                                        organelle-organelle MSC, i.e. 10–80 nm11. PfNCR1, a lipid
swell experimentally, e.g., when PVM protein export is con-                                        transporter, localizes to these sites of unusually close membrane
ditionally impaired, leading to protein accumulation6,21,22, it                                    apposition. While it can be inferred that lipid transport is taking
expands inhomogenously into irregular protuberances, suggesting                                    place at these sites, it is unclear how PfNCR1 goes about
that some sort of adhesion normally exists between the PPM and                                     exchanging its substrate, likely cholesterol or another lipid, with
the PVM that prevents it from swelling uniformly. Still to be                                      the PVM. It has been demonstrated that the large extra-
determined is whether these adhesions concentrate in the tightly                                   membranous domain of PfNCR1 is localized in between PPM
apposed regions or the more open regions. EXP2-mNG is                                              and PVM. The closely apposed membranes are within the pro-
included in the distended regions of the PVM when protein                                          tein’s hypothesized radius10, so it may well hand over lipids
export is impaired (Supplementary Fig. 6), indicating that the                                     directly25, or exchange lipids with the help of a membrane-bound
EXP2-containing domains form the less strongly connected                                           cofactor. Our data suggests that PfNCR1 is not necessary for the
region. Recently, EXP1, a PVM protein that colocalizes with                                        creation of the contact sites and thus has no defining role in the
EXP223,24, has been shown as important for peripheral EXP2                                         PV structure. Curiously, the domain structure of the PVM,
localization around the parasite and function of EXP2 as a                                         exemplified by the EXP2 distribution shown here, is quite
nutrient-permeable channel16,24. It remains to be seen how EXP1                                    dynamic and variable (cf., Supplementary Movie 1, demonstrat-
is affecting EXP2 localization and function.                                                       ing remarkable flexibility in the PV), suggesting active mechan-
   In contrast, and in keeping with the detrimental effect of water                                isms of protein localization driven by active processes, e.g.
on lipid transport, sites of close PVM-PPM apposition seem to be                                   cytoskeletal rearrangements coupled to the PVM by contact sites,
devoid of PV lumen altogether. This is an extremely close                                          or on-going exocytosis and solute export modifying the PV
apposition, at the lower end of the membrane distances found at                                    lumen. Additionally, proteins may target to their respective

NATURE COMMUNICATIONS | (2020)11:3825 | https://doi.org/10.1038/s41467-020-17506-9 | www.nature.com/naturecommunications                                            5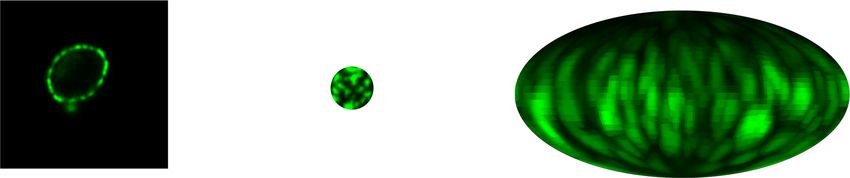
ARTICLE NATURE COMMUNICATIONS | https://doi.org/10.1038/s41467-020-17506-9
a
b 1.0 c
Red blood cell
Pearson correlation
0.5 plasma membrane
coefficient
0.0 EXP2 Parasitophorous vacuole
membrane
–0.5
PfNCR1 Plasmodium plasma
PV-mRuby3 membrane
–1.0
EXP2-mNeonGreen EXP2-mRuby3
PV-mRuby3 PfNCR1-GFP
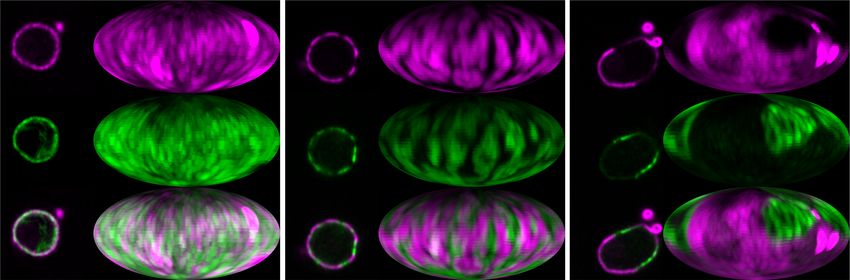
Fig. 4 Anti-colocalization of EXP2 and PfNCR1. a Center confocal slice and Mollweide projections of PfNCR1-GFP—EXP2-mRuby3 parasites. EXP2-
mRuby3 (top, magenta), PfNCR1-GFP (middle, green), merge (bottom). Samples chosen represent examples of relatively low (0.48), average (−0.09) and
high (−0.55) anti-correlation according to the Pearson correlation coefficients of the maps. The dotted line labels the equator, corresponds to the confocal
slice. Scale bar: 1 µm. b Pearson correlation coefficients of EXP2-mNeonGreen—PV-mRuby3 parasites (N = 38 cells, see Fig. 3) in comparison to PfNCR1-
GFP—EXP2-mRuby3 (N = 39 cells). Regions that extend from the parasite to form the tubulovesicular network were excluded for the correlation analysis.
Bars: mean ± 95% CI. Both distributions are significantly different: P = 1.2 × 10⁻²⁹ (t-test, two tailed). c Localization of EXP2 correlates with the existence of
a relatively large PV lumen. The PV lumen can store proteins for export and accessory proteins to facilitate protein export. The lipid transporter PfNCR1
localizes to regions of close PPM-PVM apposition. Functionally, PfNCR1 may be able to directly contact the PVM to exchange lipids and sites of membrane
apposition may be sites for the general exchange of lipophilic material, a functional hallmark of membrane contact sites. Source data are provided as a
Source data file.
regions by various other mechanisms, such as interacting with correspond to the nonideal demixing revealed by FRET33.
structural proteins, sensing of membrane distance, as found with Recently a fungal vacuole was reported to exhibit temperature-
other contact sites11, or protein exclusion, as found at gap junc- dependent lipid phase demixing34 but no function has yet been
tions12. On longer time scales, over the parasite life cycle inside an ascribed to these domains. The specific role of lipid asymmetry
RBC, domain arrangement and size changes (Supplementary and composition, and its role in domain formation and main-
Movie 2). While we focused on the trophozoite stage parasite, it tenance, in the face of lipid transport, remain to be investigated
will be insightful to learn more about the early and late PVM- for any MCS or membrane domain. The HPI offers a larger
PPM coordination. platform for these studies that may benefit both cell biological
The structure-function relationship described here (Fig. 4c) can and medical investigations.
potentially guide the study of other functions at the HPI, such as
the inhomogeneously distributed PVM proteins noted Methods
previously26,27. A mechanism for the transport of PVM resident Cell culture. Plasmodium falciparum was cultured in T25 Nunclon Delta closed
proteins from the PPM to the PVM is still lacking as PTEX is not cap culture flasks (Thermo Fisher, Waltham, MA) in RPMI 1640 supplemented
involved in this process28. The regions of close apposition are a with 25 mM HEPES, 0.1 mM hypoxanthine, 25 μg/ml gentamicin (all Thermo
Fisher), 0.5% Albumax II (Gibco, Gaithersberg, MD), and 4.5 mg/ml glucose
promising place to look for machinery that would allow transfer (MilliporeSigma, St. Louis, MO) at 37 °C in a 5% CO2, 5% O2 atmosphere at 5%
of such proteins. hematocrit below 5% parasitemia. Red blood cells were obtained from anonymized
The size of these domains are similar to those created in lipid healthy donors in a protocol approved by the National Institutes of Health Insti-
phase demixing seen in model membranes29. However, cellular tutional Review Board.
membranes are complex mixtures that for the most part fail to NF54 obtained through BEI Resources (MRA-1000), NIAID, NIH as part of the
Human Microbiome Project. The parasite lines EXP2-mNeonGreen14, EXP2-
demix at physiological temperatures and remain almost entirely mNeonGreen—PV-mRuby315, NF54attb35 (originally obtained from the authors of
liquid-disordered30. Moreover, cholesterol-rich domains are not ref. 35) were described previously.
detected by surface imaging using mass spectroscopy31. However,
molecular dynamic simulations have revealed nanoscopic Molecular biology. For generation of an endogenous EXP2-mRuby3 fusion, the
microdomains of hexagonally packed saturated lipids32 that may blasticidin-S deaminase (BSD) cassette between SalI and BglII in the plasmid
6 NATURE COMMUNICATIONS | (2020)11:3825 | https://doi.org/10.1038/s41467-020-17506-9 | www.nature.com/naturecommunicationsNATURE COMMUNICATIONS | https://doi.org/10.1038/s41467-020-17506-9 ARTICLE
pGDB36 was isolated by digestion and gel purification and inserted between the tissue culture flask in which a window was cut and a cover slide was glued on using
same restriction sites in the plasmid pyPM2GT-EXP2-mNeonGreen14 with a T4 silicone, similar to the procedure outlined in ref. 38. Light exposure was kept
Quick Ligation kit (NEB), replacing the yDHODH cassette. A synonymous minimal to avoid accumulation of phototoxicity.
mutation in the EagI site within the BSD coding sequence was then introduced to
inactivate this site using a QuikChange Lightning Multi Site Directed Mutagenesis
Map projection and correlation analysis. PVM, PV lumen and PPM are not
kit (Agilent, Santa Clara, CA) and the primer BSDinact (Supplementary Table 1).
resolvable from each other with a light microscope but appear as a single surface.
The mRuby3 coding sequence was then PCR amplified from plasmid pLN-
To avoid thresholding for the correlation analysis of the light microscopy data, the
HSP101-SP-mRuby315 with primers E2mRubyF and E2mRubyR (Supplementary
3-dimensional dataset was reduced to two dimensions projecting the maximum
Table 1) and inserted between AvrII and EagI using an In-Fusion cloning kit
fluorescence intensity from the calculated center of the parasite onto a sphere in 1°
(clontech), replacing the mNeonGreen coding sequence and resulting in the
intervals in all directions. This information can then be used to draw an angular
plasmid pbPM2GT-EXP2-mRuby3. This plasmid was linearized at AflII and co-
map of the signal. A Mollweide projection was chosen as it represents an equal-area
transfected with the pAIO-EXP2-CT-gRNA14 into a parasite line bearing a C- projection when assuming a spherical parasite. Maps obtained this way are similar
terminal GFP fusion to the endogenous pfncr1 gene10 and selection with 2.5 µg/ml
to how the night sky can be represented in a map39. The Pearson correlation
blasticidin-S was applied 24 h after transfection. For expression of PV-targeted
coefficient was then calculated on the maps. The maps also provide an informative
mRuby3, the plasmid pLN-HSP101-SP-mRuby3 was co-transfected with pINT37
visual impression of the 3D dataset in print.
into the PfNCR1-GFP background and selection with 2.5 µg/ml blasticidin-S was
Analysis was done using custom scripts in MATLAB 2018b (MathWorks,
applied 24 h after transfection.
Natick MA). Briefly, the center of the cell was determined from the center of mass
To generate an endogenous EXP2-mNeonGreen fusion in the HSP101DDD
of a mask created from pixels in between the 1st and the 2nd level of a 2-level
background, the plasmid pyPM2GT-EXP2-mNeonGreen was co-transfected with
threshold using the “multithresh” function. The voxel was scaled according to the
pAIO-EXP2-CT-gRNA into NF54attB: HSP101DDD6. Selection was applied with 2
voxel sizes given by the microscope and the z-dimension was corrected for the
µM DSM1 24 h post transfection and parasites were cloned by limiting dilution
refractive index mismatch between the immersion (Zeiss immersol 518 F, n =
when they returned from selection.
1.518) and the sample40. The sample index was entered as n = 1.383 as referenced
To generate a parasite line with endogenous EXP2-mNeonGreen and in ref. 41. Each voxel was then assigned an altitude and azimuth with respect to this
PTEX150-mRuby3 fusions, the mRuby3 coding sequence was PCR amplified from
center using the “acos” and “atan2” functions respectively. The altitude and
plasmid pLN-HSP101-SP-mRuby315 with primers P150mRubyF and P150mRubyR
azimuth were then used to create a mask with a 1° resolution (equivalent to 17.5
(Supplementary Table 1) and inserted between AvrII and EagI in plasmid
nm at a distance of 1 µm from the center). The maximum of masked intensity was
pPM2GT-HSP101-3xFlag6. Homology flanks targeting the 3′ end of PTEX150 were
then recorded as angular intensity value for the altitude and azimuth. Finally, the
then PCR amplified from plasmid pyPM2GT-PTEX150-3xHA-GFP116 with
angular intensity values were mapped using a Mollweide projection onto a 1024 ×
primers P150FLF and P150FLR (Supplementary Table 1) and inserted between
2048 pixel sized image. For each pixel with coordinates xi and yi corresponding
XhoI and AvrII, resulting in the plasmid pPM2GT-PTEX150-mRuby3. This
angles were calculated:
plasmid was linearized at AflII and co-transfected with pAIO-PTEX150-CT-
gRNA6 into the parasite line EXP2-mNeonGreen14. Selection was applied with 10 ps ¼ 1024;
nM WR99210 24 h post transfection and clonal lines were isolated by limiting R ¼ ps=ð2*sqrtð2ÞÞ;
dilution, resulting in the line NF54attB::EXP2-mNeonGreen+PTEX150-mRuby3.
All primers are listed in Supplementary Table 1.
y ¼ ððyi ðps=2ÞÞ=ðps=2ÞÞ*ðR*sqrtð2ÞÞ;
th ¼ asinðy=ðR*sqrtð2ÞÞÞ;
Immunofluorescence assay. Immunofluorescence assays (IFAs) were performed
as described previously6. Briefly, cells taken directly from the culture and left to Latitudeðyi; :Þ ¼ realðasinðð2*th þ sinð2*thÞÞ=piÞ*180=piÞ;
settle for 10 min on Concanavalin A (Vector Laboratories, Burlingame, CA) coated and
cover slides in culture medium at 37 °C. Excess cells were taken off with three
gentle washes using 37 °C cell culture medium. Cells were fixed for 15 min at 37 °C x ¼ ððxi psÞ=psÞ*ð2*R*sqrtð2ÞÞ;
in freshly prepared 4% paraformaldehyde, 0.0075% glutaraldehyde (both from Longitudeðyi; xiÞ ¼ realððpi*xÞ=ð2*R*sqrtð2Þ*cosðthÞÞ*180=piÞ;
electron microscopy sciences), in phosphate buffered saline (PBS) (Gibco). After
three washes in PBS cells were permeabilized in freshly prepared PBS containing
0.2% Triton X-100 (MilliporeSigma). The sample was then blocked in PBS + 3% Area coverage of the signal was determined by segmenting the individual maps
Bovine Serum Albumin (BSA) (MilliporeSigma). Cells were incubated in primary with the ‘multithresh’ function for 2 levels, counting everything above the first
Monoclonal antibody 7.7 (anti-EXP-2), obtained from The European Malaria threshold as signal.
Reagent Repository (http://www.malariaresearch.eu, 1:500) for 1 hr at room tem- Correlation coefficients (r) were correlated using the Pearson correlation
perature. The sample was washed five times in PBS. The secondary antibody coefficient from the intensities of channel 1 (XL) and channel 2 (YL):
(Donkey-anti-mouse conjugated with Alexa Fluor 488, A21202 from Invitrogen, lot N ¼ lengthðXLÞ;
1113537, 1:150) was applied for 20 min, then washed off 5 times with PBS. The
sample was mounted in ProLong AntiFade Gold with DAPI (Invitrogen). mX ¼ meanðXLÞ;
mY ¼ meanðYLÞ;
Light microscopy. Images were obtained on a Zeiss 880 with Airyscan module r ¼ ðsumðXL:*YLÞ N*mX*mYÞ=ðsqrtðsumðXL:*XLÞ N*mX*mXÞ
using a 63×1.4NA Zeiss Plan-Apochromat, 37 °C immersion oil (Zeiss, Oberko- *sqrtðsumðYL:*YLÞ N*mY*mYÞÞ;
chen, DE). Images were collected using Zen black (Zeiss) in the Airyscan mode,
following the programs recommendation for the optimal pixel size and slice
thickness, pixel dwell times were kept at 1–2 µs. Live parasites were transferred into Regions showing the tubulovesicular network, identified as PVM extending out
a hybridization chamber (HybriWell HBW20, Grace Bio-Labs, Bend, OR) for from the parasite into the RBC cytosol, have enriched EXP2 signal compared to the
observation on the microscope15. The stage was heated to physiological tempera- peripheral PV and were manually masked out when calculating the correlation
coefficient.
ture using a stage incubator (Tokai Hit INU, Fujinomiya-shi, Japan) (set tem-
The 95% confidence interval of the correlation coefficient and statistical
peratures: top 37 °C, stage 36 °C, objective 39 °C) to reach 35–36 °C at the coverslip.
significance was calculated in Prism (Graphpad, San Diego, CA) after a Fisher
Trophozoites, i.e. non-segmented cells with hemozoin, were chosen from a bright
transform of the data, the resulting confidence interval was then back transformed.
field image. For colocalization imaging following parameters were chosen: Imaging
on EXP2-mNeonGreen—PV-mRuby lines was done using a “band pass 495–550
nm + long pass 570 nm” emission filter, switching excitation at each line between Electron microscopy on thin sections. For the determination of the PVM-PPM
488 nm at 0.1% and 561 nm at 1% power. For experiments with GFP as fluorescent distance in Fig. 1, erythrocyte cultures infected with NF54attb parasites were
tag the line switch strategy, while minimizing movement artefacts, lead to blead enriched for late stages using a LD column in a QuadroMACs magnetic separator
through from the mRuby3 to the GFP channel as the mRuby3 signal was very (Miltenyi Biotech, Cologne, DE), then fixed with 2% glutaraldehyde in 100 mM
abundant and mRuby3 can be minimally excited with 488 nm making it visible NaCl, 30 mM Hepes buffer pH 7.2, and 2 mM CaCl2. During a 1–2 day long
alongside the relatively weak GFP signal in the GFP channel. This required aldehyde fixation, the cultures settled into soft pellets, after which they were post-
switching filters after completing z-stacks in each individual channel. Parameters fixed for 30 min as pellets in 0.25% OsO4 plus 0.25% potassium ferrocyanide
chosen to image PfNCR1-GFP—EXP2-mRuby3 are for the GFP channel excitation: dissolved in 0.1 M cacodylate buffer containing 2 mM CaCl2. Thereafter, they were
488 nm at 2% power, emission: “band pass 420–488 nm + band pass 495–550 nm”, washed in 0.1 M cacodylate buffer+2 mM CaCl2, and poststained by sequential 30
and the mRuby3 channel excitation: 561 nm 0.2%, emission: bandpass “495–550 min treatments with 0.5% tannic acid in 0.1 M cacodylate buffer + 2 mM CaCl2
nm+ long pass 570 nm”. The images were processed in Zen black using Airyscan followed by 0.5% uranyl acetate in 50 mM acetate buffer pH 5.2. Immediately
processing in automatic settings. thereafter, they were dehydrated with increasing concentrations of ethanol, and
The whole cycle time lapse movie (Supplementary Movie 2) was made on a embedded in epoxy resin by standard techniques: exchange through propylene
Zeiss LSM 800 using a 63 × 1.4NA Zeiss Plan-Apochromat equipped with a heating oxide, then increasing concentrations of the epoxy, and final vacuum-embedding
box to maintain 37 °C. Parasites were cultured in a gased (5% CO2, 5% O2) T25 and polymerization at 70 °C. Thereafter, semi-thin sections were made vertically
NATURE COMMUNICATIONS | (2020)11:3825 | https://doi.org/10.1038/s41467-020-17506-9 | www.nature.com/naturecommunications 7ARTICLE NATURE COMMUNICATIONS | https://doi.org/10.1038/s41467-020-17506-9
through the pellets at 0.5 µm and stained with toluidine blue, to determine optimal PA), picked-up with a 1:1 mixture of 2% methylcellulose (25 centipoises, Milli-
areas for further examination. These were then sectioned at 80 nm, stained for 5 poreSigma) and 2.3 M sucrose (USB Corporation, Cleveland, OH)46. Sections were
min with 50 mM lead citrate dissolved in 0.1 M citrate buffer pH 5.2, and examined 5–10 min washed in PBS prior to light microscopy imaging using the Zeiss LSM
at 80 KV in a JEOL 1400 electron microscope equipped with a 4Kx6K digital 880 Airyscan module (see the section on light microscopy). Samples were then
camera (Advanced Microscopy Techniques Corp, Woburn). In digital versions of embedded in 4% uranyl acetate/2% methylcellulose mixture (ratio 1:9)47 for elec-
the final electron micrographs, PPM and PVM were segmented by hand, using tron microscopy. Thin sections were examined on a JEM-1200EX (JEOL USA)
ImageJ42, drawing a line where each membrane was clearly visible. Sections where transmission electron microscope (accelerating voltage 80 KeV) equipped with an
the membranes were cut obliquely were not considered. The minimal distance of A.M.T. 6-megapixel digital camera (Advanced Microscopy Techniques, Woburn,
the two membrane traces was determined using a MATLAB script. MA). EC-CLEM48 was used to align light and electron microscopy image in a non-
From the resulting bimodal histogram, the means and relative contribution of rigid grid to accommodate sample warping. Electron micrographs with up to
the two PV regions were determined by a fit to a two-component mixture model. ×2500 direct magnification (7.4 nm pixel size) were used for the alignment to the
The frequency data was plotted as a cumulative distribution function after log light microscopy image (pixel size following the “optimal” pixel size settings of the
transformation to avoid fitting negative (unphysical) membrane distances. The log Airyscan module is 42.6 nm).
normal cumulative distribution function was fit, using the following model, with
Matlab (2019b, The MathWorks, Inc.):
Freeze fracture replica. Late stage NF54attb infected red blood cells were isolated
using a magnetic separator as for the thin sections. Cell were gently pelleted at
f ðxÞ ¼ a*normcdf ðx; mu1; sigma1Þ þ ð1 aÞ*normcdf ðx; mu2; sigma2Þ
~200 g in a clinical centrifuge, then layered as a thick slurry on a tiny 3 × 3 mm
class coverslip mounted on a lung cushion, in preparation for quick-freezing with
where a is the relative contribution of each mixture component, mu1 and mu2
the liquid helium cooled copper-block slammer49. Thereafter, they were transferred
represent the means, and sigma1 and sigma 2 the standard deviations of each term,
to a Balzers 400 freeze-fracture apparatus, where they were fractured through their
respectively; x is membrane distance and f(x) the cumulative distribution function.
well-frozen surfaces, deep-etched for 2 min at −104 °C, and then rotary-replicated
The domain of a is between 0 and 1 while the domains of mu1 is between 0 and 3.2
with 4 nm of platinum deposited from a 20° angle. Thereafter they were backed
in the log transformed data (i.e. 1 and 24.5 nm back-transformed), and mu2
with 10 nm of carbon deposited from 90°, removed from the Balzers, thawed, and
between 2.7 and 5 (i.e. 15 and 148 nm back-transformed).
the platinum replica was floated on 25% SDS to partially remove organic material
from underneath it50. After washing, the replica was picked up on an EM grid.
Bootstrapping statistics of histograms. Assuming the analyzed images are Thereafter, these replicas were examined in the electron microscope in the same
representative of the population, confidence intervals of derived parameters can be manner as the thin sections, above.
determined by bootstrapping43,44, i.e. randomly assembling new datasets from the
existing dataset and calculating statistics of the new bootstrapped datasets. This
allows comparison of histogram data within an experiment. The two-component Reporting summary. Further information on research design is available in the Nature
mixture model was fit to each bootstrapped distribution. From the resulting Research Reporting Summary linked to this article.
parameters the means and 95% confidence intervals (central 95% of the parameter
distribution) were determined.
The data of the PfNCR1 immuno-gold EM was taken from 26 images (of 24 Data availability
cells) in which 88 gold particles at the PV (18 nm diameter) were identified near Data supporting the findings of this manuscript are available from the corresponding
(18 nm from the gold surface, i.e. primary and secondary antibody length) authors upon reasonable request. A reporting summary for this Article is available as
recognizable PPM, and with recognizable PVM. All measurable membrane a Supplementary Information file. The source data underlying histograms, plots, averages
distances in the dataset were recorded. To compare parameter aall of all PVM-PPM with error are provided as a Source Data file. Source data are provided with this paper.
distances present in the dataset with agold of the gold particle distribution, the An example image is provided with the scripts.
membrane distance distribution was divided into 54 nm long PV segments
(corresponds to the range in which a PfNCR1 protein could be located from the
center of a gold particle, i.e. length of 2x primary + 2x secondary antibody + gold), Code availability
1118 segments total (60.3 µm PV length) in the dataset, and bootstrapped with MATLAB (Mathworks) scripts as described in the methods are available at https://
replacement 10,000×. The data of all available membrane distances describes all the github.com/gartenm/piebald.
regions in which a gold particle could be found. Hence, mu1, mu2, sigma1 and
sigma2 of the bootstrap calculation of all distances can be used to determine Received: 17 December 2019; Accepted: 30 June 2020;
parameter agoldin the gold particle distribution. This is achieved by fixing the
parameters to the found values in the bootstrap calculation of distances near gold
particles.
The enrichment of PfNCR1 was calculated as (agold (1 − aall))/(aall (1 − agold)).
Images of regions of single slices of randomly chosen cells were acquired to
compare the PfNCR1 knock-down (34 images) with its control (46 images). Region
to region differences are assumed to introduce variance in the sampling of References
membrane distances in electron micrographs. Hence, statistics was calculated by a 1. Ward, G. E., Miller, L. H. & Dvorak, J. A. The origin of parasitophorous
bootstrap with replacement 10,000× of the images in the individual dataset. The vacuole membrane lipids in malaria-infected erythrocytes. J. Cell Sci. 106,
significance of the difference in the relative contribution parameter a was 237–248 (1993).
determined by pooling the knock-down with the control dataset and bootstrapping 2. Suss-Toby, E., Zimmerberg, J. & Ward, G. E. Toxoplasma invasion: the
with replacement into two random distributions with the size of the original parasitophorous vacuole is formed from host cell plasma membrane and
distributions. This results in 2 a parameters a1 and a2 from the two mixed pinches off via a fission pore. Proc. Natl Acad. Sci. USA 93, 8413–8418 (1996).
distributions. The difference of a1 and a2 was used determine the 95% confidence 3. Desai, S. A., Krogstad, D. J. & McCleskey, E. W. A nutrient-permeable channel
interval for a significant difference in between the knock-down and control dataset. on the intraerythrocytic malaria parasite. Nature 362, 643–646 (1993).
4. Sherling, E. S. & Ooij, C. V. Host cell remodeling by pathogens: the
EM of immuno-gold labeled PfNCR-GFP and PfNCR1 knock-down. Samples exomembrane system in Plasmodium-infected erythrocytes. FEMS Microbiol.
were prepared for the initial characterization of PfNCR1 in Istvan et al.10 and Rev. 40, 701–721 (2016).
reused in this publication. The existing immuno-gold image dataset was thus 5. Deitsch, K. W. & Dzikowski, R. Variant gene expression and antigenic
analyzed. The dataset was imaged with no hypothesis regarding PVM-PPM dis- variation by malaria parasites. Annu. Rev. Microbiol. 71, 625–641 (2017).
tance as outlined in10. Additional images were acquired of the PfNCR1 knock- 6. Garten, M. et al. EXP2 is a nutrient-permeable channel in the vacuolar
down and control sample using a Thermo Fisher Technai T20 transmission elec- membrane of Plasmodium and is essential for protein export via PTEX. Nat.
tron microscope operated at 200 kV. Images were collected using an AMT Microbiol. 3, 1090 (2018).
NanoSprint1200 (Advanced Microscopy Techniques, Woburn, MA), a CMOS 7. Ho, C.-M. et al. Malaria parasite translocon structure and mechanism of
TEM camera. effector export. Nature 561, 70–75 (2018).
8. Martin, R. E., Ginsburg, H. & Kirk, K. Membrane transport proteins of the
Correlative light electron microscopy. EXP2-mNeonGreen—PV-mRuby3 para- malaria parasite. Mol. Microbiol. 74, 519–528 (2009).
sites were isolated on a 65% percoll (MilliporeSigma) interface. Cells were fixed 9. Kirk, K. & Lehane, A. M. Membrane transport in the malaria parasite and its
using 4% formaldehyde + 0.4% glutaraldehyde in 1x PHEM (pH 6.9) (Electron host erythrocyte. Biochem. J. 457, 1–18 (2014).
microscopy sciences)45. Gelatin-embedded samples were infiltrated with 2.3 M 10. Istvan, E. S. et al. Plasmodium Niemann-Pick type C1-related protein is a
sucrose (in 0.1 M phosphate buffer) and put at 4 °C for three days on a rotating druggable target required for parasite membrane homeostasis. eLife 8, e40529
wheel, mounted onto sample pins and frozen in liquid nitrogen. Subsequently, the (2019).
samples were ultrathin cryo-sectioned (50–60 nm) with a FC7/UC7-ultra- 11. Scorrano, L. et al. Coming together to define membrane contact sites. Nat.
microtome (Leica, Vienna, AT) and with a 35° diamond knife (Diatome, Hatfield Commun. 10, 1287 (2019).
8 NATURE COMMUNICATIONS | (2020)11:3825 | https://doi.org/10.1038/s41467-020-17506-9 | www.nature.com/naturecommunicationsNATURE COMMUNICATIONS | https://doi.org/10.1038/s41467-020-17506-9 ARTICLE
12. Goodenough, D. A. & Paul, D. L. Gap junctions. Cold Spring Harb. Perspect. 39. Bennett, C. L. et al. Nine-year Wilkinson microwave anisotropy probe
Biol. 1, a002576 (2009). (WMAP) observations: final maps and results. Astrophys. J. Suppl. Ser. 208, 20
13. Hanssen, E. et al. Soft X-ray microscopy analysis of cell volume and (2013).
hemoglobin content in erythrocytes infected with asexual and sexual stages of 40. Bezlyepkina, N., Gracià, R. S., Shchelokovskyy, P., Lipowsky, R. & Dimova, R.
Plasmodium falciparum. J. Struct. Biol. 177, 224–232 (2012). Phase diagram and tie-line determination for the ternary mixture DOPC/
14. Glushakova, S. et al. Exploitation of a newly-identified entry pathway into the eSM/Cholesterol. Biophys. J. 104, 1456–1464 (2013).
malaria parasite-infected erythrocyte to inhibit parasite egress. Sci. Rep. 7, 41. Park, Y. et al. Refractive index maps and membrane dynamics of human red
12250 (2017). blood cells parasitized by Plasmodium falciparum. Proc. Natl Acad. Sci. USA
15. Glushakova, S. et al. Rounding precedes rupture and breakdown of vacuolar 105, 13730–13735 (2008).
membranes minutes before malaria parasite egress from erythrocytes. Cell. 42. Schindelin, J. et al. Fiji: an open-source platform for biological-image analysis.
Microbiol. 20, e12868 (2018). Nat. Methods 9, 676–682 (2012).
16. Nessel, T. et al. EXP1 is required for organisation of EXP2 in the 43. Hesterberg, T. C. What teachers should know about the bootstrap:
intraerythrocytic malaria parasite vacuole. Cell. Microbiol. 22, e13168 resampling in the undergraduate statistics curriculum. Am. Stat. 69, 371–386
(2020). (2015).
17. Bos, E. et al. Vitrification of Tokuyasu-style immuno-labelled sections for 44. Calmettes, G., Drummond, G. B. & Vowler, S. L. Making do with what we
correlative cryo light microscopy and cryo electron tomography. J. Struct. Biol. have: use your bootstraps. J. Physiol. 590, 3403–3406 (2012).
186, 273–282 (2014). 45. Schliwa, M., Euteneuer, U., Bulinski, J. C. & Izant, J. G. Calcium lability of
18. Li, X., Saha, P., Li, J., Blobel, G. & Pfeffer, S. R. Clues to the mechanism of cytoplasmic microtubules and its modulation by microtubule-associated
cholesterol transfer from the structure of NPC1 middle lumenal domain proteins. Proc. Natl Acad. Sci. USA 78, 1037–1041 (1981).
bound to NPC2. Proc. Natl Acad. Sci. USA 113, 10079–10084 (2016). 46. Liou, W., Geuze, H. J. & Slot, J. W. Improving structural integrity of
19. Saheki, Y. & De Camilli, P. Endoplasmic reticulum–plasma membrane contact cryosections for immunogold labeling. Histochem. Cell Biol. 106, 41–58
sites. Annu. Rev. Biochem. 86, 659–684 (2017). (1996).
20. Wu, H., Carvalho, P. & Voeltz, G. K. Here, there, and everywhere: the 47. Griffiths, G. Fine Structure Immunocytochemistry. (Springer-Verlag, Berlin,
importance of ER membrane contact sites. Science 361, eaan5835 Heidelberg, 1993).
(2018). 48. Paul-Gilloteaux, P. et al. eC-CLEM: flexible multidimensional registration
21. Charnaud, S. C. et al. Spatial organization of protein export in malaria parasite software for correlative microscopies. Nat. Methods 14, 102–103 (2017).
blood stages. Traffic 19, 605–623 (2018). 49. Heuser, J. Protocol for 3-D visualization of molecules on mica via the
22. Kalanon, M. et al. The Plasmodium translocon of exported proteins quick-freeze, deep-etch technique. J. Electron Microsc. Tech. 13, 244–263
component EXP2 is critical for establishing a patent malaria infection in mice. (1989).
Cell. Microbiol. 18, 399–412 (2016). 50. Fujimoto, K. SDS-digested freeze-fracture replica labeling electron microscopy
23. Riglar, D. T. et al. Spatial association with PTEX complexes defines regions for to study the two-dimensional distribution of integral membrane proteins and
effector export into Plasmodium falciparum-infected erythrocytes. Nat. phospholipids in biomembranes: practical procedure, interpretation and
Commun. 4, 1415 (2013). application. Histochem. Cell Biol. 107, 87–96 (1997).
24. Mesén-Ramírez, P. et al. EXP1 is critical for nutrient uptake across the 51. Lauer, S. A., Rathod, P. K., Ghori, N. & Haldar, K. A membrane network for
parasitophorous vacuole membrane of malaria parasites. PLoS Biol. 17, nutrient import in red cells infected with the malaria parasite. Science 276,
e3000473 (2019). 1122–1125 (1997).
25. Horenkamp, F. A., Valverde, D. P., Nunnari, J. & Reinisch, K. M. Molecular
basis for sterol transport by StART-like lipid transfer domains. EMBO J. 37,
e98002 (2018). Acknowledgements
26. Spielmann, T., Gardiner, D. L., Beck, H.-P., Trenholme, K. R. & Kemp, D. J. We thank Svetlana Glushakova for critical discussions, Paul Blank for particularly useful
Organization of ETRAMPs and EXP-1 at the parasite–host cell interface of discussions and help with the statistical analyses, Jennifer Petersen for help with electron
malaria parasites. Mol. Microbiol. 59, 779–794 (2006). microscopy, Rumiana Dimova for pointing out the refractive index correction, Wandy
27. Spielmann, T., Montagna, G. N., Hecht, L. & Matuschewski, K. Molecular Beatty for PfNCR1 EM. This work was supported by the Division of Intramural Research
make-up of the Plasmodium parasitophorous vacuolar membrane. Int. J. Med. of the Eunice Kennedy Shriver National Institute of Child Health and Human Devel-
Microbiol. 302, 179–186 (2012). opment, National Institutes of Health and National Institutes of Health grant HL133453
28. Tribensky, A., Graf, A. W., Diehl, M., Fleck, W. & Przyborski, J. M. Trafficking to J.R.B.
of PfExp1 to the parasitophorous vacuolar membrane of Plasmodium
falciparum is independent of protein folding and the PTEX translocon. Cell.
Microbiol. 19, e12710 (2016). Author contributions
29. García-Sáez, A. J. & Schwille, P. Stability of lipid domains. FEBS Lett. 584, M.G., J.Z., D.E.G., and J.R.B. conceived and designed experiments. J.R.B. generated and
1653–1658 (2010). analyzed the parasite strains, performed light microscopy of the DHFR strain, generated
30. Polozov, I. V., Bezrukov, L., Gawrisch, K. & Zimmerberg, J. Progressive the samples for the freeze fracture. M.G. performed all other light microscopy, EM of the
ordering with decreasing temperature of the phospholipids of influenza virus. PfNCR1 knock-down and control, the IFA, analyzed all microscopy data. R.R. prepared
Nat. Chem. Biol. 4, 248–255 (2008). the freeze-fractures. E.S.I. prepared PfNCR1 immuno-gold and knock-down samples.
31. Wilson, R. L. et al. Hemagglutinin clusters in the plasma membrane are not T.T.-H. embedded and cut the thin-sections for EM, J.H. imaged freeze-fractures and
enriched with cholesterol and sphingolipids. Biophys. J. 108, 1652–1659 thin sections. C.K.E.B. processed the sample for CLEM, imaged the sample in EM. All
(2015). authors discussed and edited the paper.
32. Sodt, A. J., Pastor, R. W. & Lyman, E. Hexagonal substructure and hydrogen
bonding in liquid-ordered phases containing palmitoyl sphingomyelin.
Biophys. J. 109, 948–955 (2015). Competing interests
33. Enoki, T. A., Heberle, F. A. & Feigenson, G. W. FRET detects the size of The authors declare no competing interests.
nanodomains for coexisting liquid-disordered and liquid-ordered phases.
Biophys. J. 114, 1921–1935 (2018).
34. Rayermann, S. P., Rayermann, G. E., Cornell, C. E., Merz, A. J. & Keller, S. L.
Hallmarks of reversible separation of living, unperturbed cell membranes into Additional information
two liquid phases. Biophys. J. 113, 2425–2432 (2017). Supplementary information is available for this paper at https://doi.org/10.1038/s41467-
35. Adjalley, S. H. et al. Quantitative assessment of Plasmodium falciparum sexual 020-17506-9.
development reveals potent transmission-blocking activity by methylene blue.
Proc. Natl Acad. Sci. USA 108, 1214–1223 (2011). Correspondence and requests for materials should be addressed to D.E.G. or J.Z.
36. Muralidharan, V., Oksman, A., Iwamoto, M., Wandless, T. J. & Goldberg, D. E.
Asparagine repeat function in a Plasmodium falciparum protein assessed via a Peer review information Nature Communications thanks the anonymous reviewer(s) for
regulatable fluorescent affinity tag. Proc. Natl Acad. Sci. 108, 4411–4416 (2011). their contribution to the peer review of this work. Peer reviewer reports are available.
37. Nkrumah, L. J. et al. Efficient site-specific integration in Plasmodium
falciparum chromosomes mediated by mycobacteriophage Bxb1 integrase. Reprints and permission information is available at http://www.nature.com/reprints
Nat. Methods 3, 615–621 (2006).
38. Grüring, C. et al. Development and host cell modifications of Plasmodium Publisher’s note Springer Nature remains neutral with regard to jurisdictional claims in
falciparum blood stages in four dimensions. Nat. Commun. 2, 165 (2011). published maps and institutional affiliations.
NATURE COMMUNICATIONS | (2020)11:3825 | https://doi.org/10.1038/s41467-020-17506-9 | www.nature.com/naturecommunications 9ARTICLE NATURE COMMUNICATIONS | https://doi.org/10.1038/s41467-020-17506-9
Open Access This article is licensed under a Creative Commons
Attribution 4.0 International License, which permits use, sharing,
adaptation, distribution and reproduction in any medium or format, as long as you give
appropriate credit to the original author(s) and the source, provide a link to the Creative
Commons license, and indicate if changes were made. The images or other third party
material in this article are included in the article’s Creative Commons license, unless
indicated otherwise in a credit line to the material. If material is not included in the
article’s Creative Commons license and your intended use is not permitted by statutory
regulation or exceeds the permitted use, you will need to obtain permission directly from
the copyright holder. To view a copy of this license, visit http://creativecommons.org/
licenses/by/4.0/.
This is a U.S. government work and not under copyright protection in the U.S.; foreign
copyright protection may apply 2020
10 NATURE COMMUNICATIONS | (2020)11:3825 | https://doi.org/10.1038/s41467-020-17506-9 | www.nature.com/naturecommunicationsYou can also read