Phospholipase pPLAIIIa Increases Germination Rate and Resistance to Turnip Crinkle Virus when Overexpressed1 OPEN
←
→
Page content transcription
If your browser does not render page correctly, please read the page content below
Phospholipase pPLAIIIa Increases Germination Rate and
Resistance to Turnip Crinkle Virus
when Overexpressed1[OPEN]
Jin Hoon Jang,a Ngoc Quy Nguyen,a Bertrand Légeret,b Fred Beisson,b Yu-Jin Kim,c Hee-Jung Sim,d,e and
Ok Ran Lee a,2,3
a
  Department of Applied Plant Science, College of Agriculture and Life Science, Chonnam National University,
Gwangju 61186, Republic of Korea
b
  Biosciences and Biotechnologies Institute of Aix-Marseille, Commissariat à l’Énergie Atomique et aux Énergies
Alternatives, Centre National de la Recherche Scientifique and Aix-Marseille University, Commissariat à
l’Énergie Atomique et aux Énergies Alternatives Cadarache, 13108 Saint-Paul-lez-Durance, France
c
  Department of Life Science and Environmental Biochemistry, Pusan National University, Miryang, 50463,
Republic of Korea
d
  Gyeongnam Department of Environmental Toxicology and Chemistry, Korea Institute of Toxicology, Jinju-si,
52834, Republic of Korea
e
  Center for Genome Engineering, Institute for Basic Science, Daejeon 34126, Republic of Korea
ORCID IDs: 0000-0003-0306-5283 (J.H.J.); 0000-0001-9995-7387 (F.B.); 0000-0003-2562-615X (Y.-J.K.); 0000-0002-5205-0080 (H.-J.S.);
0000-0002-6928-5863 (O.R.L.).

Patatin-related phospholipase As (pPLAs) are major hydrolases acting on acyl-lipids and play important roles in various plant
developmental processes. pPLAIII group members, which lack a canonical catalytic Ser motif, have been less studied than other
pPLAs. We report here the characterization of pPLAIIIa in Arabidopsis (Arabidopsis thaliana) based on the biochemical and
physiological characterization of pPLAIIIa knockouts, complementants, and overexpressors, as well as heterologous expression
of the protein. In vitro activity assays on the purified recombinant protein showed that despite lack of canonical phospholipase
motifs, pPLAIIIa had a phospholipase A activity on a wide variety of phospholipids. Overexpression of pPLAIIIa in Arabidopsis
resulted in a decrease in many lipid molecular species, but the composition in major lipid classes was not affected. Fluorescence
tagging indicated that pPLAIIIa localizes to the plasma membrane. Although Arabidopsis pplaIIIa knockout mutants showed
some phenotypes comparable to other pPLAIIIs, such as reduced trichome length and increased hypocotyl length, control of seed
size and germination were identified as distinctive pPLAIIIa-mediated functions. Expression of some PLD genes was strongly
reduced in the pplaIIIa mutants. Overexpression of pPLAIIIa caused increased resistance to turnip crinkle virus, which associated
with a 2-fold higher salicylic acid/jasmonic acid ratio and an increased expression of the defense gene pathogenesis-related protein1.
These results therefore show that pPLAIIIa has functions that overlap with those of other pPLAIIIs but also distinctive functions, such
as the control of seed germination. This study also provides new insights into the pathways downstream of pPLAIIIa.

   Lipases are a diverse group of hydrolases that break                       cellular biology, such as signal transduction, cell growth
down acyl-lipids. Most of them hydrolyze the carboxyl                         regulation, and membrane remodeling in response to
ester bond between a fatty acid and the glycerol backbone,                    environmental stresses and lipid metabolism (Wang,
but lipase sequences diverge widely, and even the loose                       2001; Meijer and Munnik, 2003; Ryu, 2004; Matos and
GXSXG esterase consensus for the catalytic Ser is not al-                     Pham-Thi, 2009; Scherer et al., 2010). Phospholipases of
ways present. Based on their preferred substrate, in vitro                    A-type (PLA) hydrolyze the carboxyl ester bond specif-
lipases are usually classified into triacylglycerol lipases,                   ically at the sn-1 or sn-2 position of glycerophospholipids
phospholipases, galactolipases, and others. However,                          or in some cases at both positions. Plant PLA2 families
many lipases often act in vitro on a variety of lipid classes,                are classified into two groups: low-molecular–weight
and the determination of their physiological role is                          PLA2s (PLA2a, PLA2b, PLA2g, and PLA2d) and patatin-
not trivial. Genome analysis of Arabidopsis (Arabidopsis                      related PLAs (pPLAs), the latter of which are homologous
thaliana) has indicated that there are as many genes                          to the potato (Solanum tuberosum) tuber storage protein
annotated as potentially involved in lipid breakdown                          patatin. The pPLAs act on glycerogalactolipids as well
as there are involved in lipid biosynthesis (Li-Beisson                       as glycerophospholipids to release free fatty acids (FFAs)
et al., 2013). Elucidation of the cellular function of the                    and the corresponding lysolipids (Lee et al., 2010; Scherer
many putative plant lipases is thus a major challenge.                        et al., 2010).
   By hydrolyzing membrane phosphoglycerolipids,                                 In Arabidopsis, the 10 members of the pPLA family
phospholipases participate in many aspects of plant                           have been classified into three groups based on gene
1482 Plant PhysiologyÒ, November 2020, Vol. 184, pp. 1482–1498, www.plantphysiol.org Ó 2020 American Society of Plant Biologists. All Rights Reserved.

                                    Downloaded on February 2, 2021. - Published by https://plantphysiol.org
                                   Copyright (c) 2020 American Society of Plant Biologists. All rights reserved.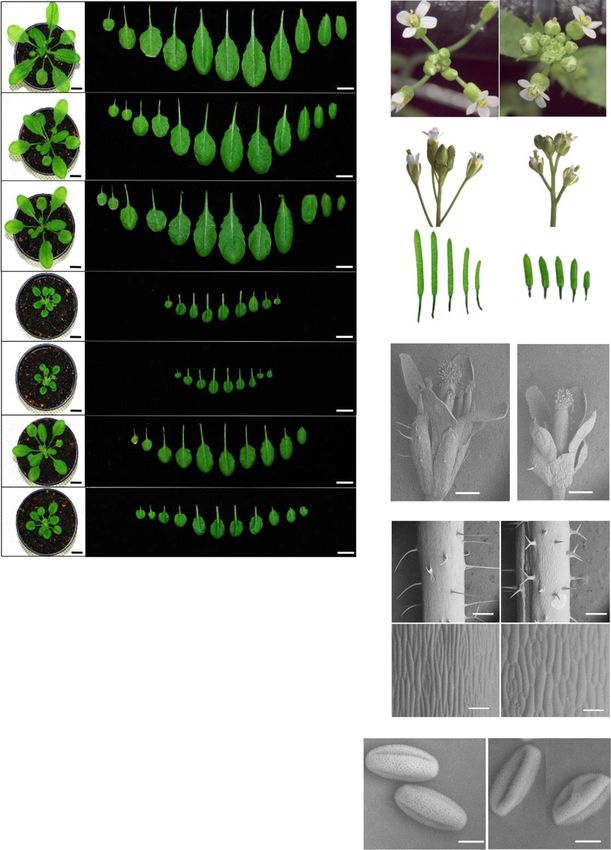
pPLAIIIa Affects Germination Rate

structure and amino acid sequence similarity: pPLAI,                       characterized overexpression and KO mutants in Ara-
pPLAII (pPLAIIa, pPLAIIb, pPLAIIg, pPLAIId, and                            bidopsis at physiological and molecular levels, and
pPLAII«), and pPLAIII (pPLAIIIa, pPLAIIIb, pPLAIIIg,                       performed lipidomic analyses.
and pPLAIIId; Holk et al., 2002; Scherer et al., 2010).
Both pPLAI and pPLAIIs are involved in plant responses
to pathogens, auxin signaling, and phosphate defi-
                                                                           RESULTS
ciency. Although the recently characterized pPLAIIIs
lack the canonical catalytic Ser-containing motif GXSXG                    Despite Lacking Canonical Motifs, pPLAIIIa has Retained
(Holk et al., 2002; Scherer et al., 2010), some pPLAIIId                   Lipase Activity
and pPLAIIIb possess a lipase activity with broad sub-
strate specificity (Li et al., 2011, 2013; Lin et al., 2011). In               Arabidopsis pPLAIIIa (At2g39220) was represented
Arabidopsis, pPLAIIId is involved in plant response to                     by a single gene encoding a protein of 499 amino acids
auxin (Labusch et al., 2013). Moreover, in rice (Oryza                     with a predicted pI of 6.24 and a molecular mass of 54.5
sativa), OspPLAIIIa overexpression and knockout (KO)                       kD. Like all Arabidopsis pPLAIII proteins, pPLAIIIa
have an opposite effect on the expression of the growth                    lacked the Ser of the putative Ser-Asp catalytic dyad
repressor SLENDER1 in the gibberellin signaling path-                      because Ser present in the canonical GxSxG motif was
way (Liu et al., 2015). Overexpressors (OE) of pPLAIIIs                    replaced with G (Fig. 1A). However, the second residue
display similar stunted growth patterns with additional                    of the putative catalytic Ser-Asp dyad, Asp, was present
functions, such as reduced cellulose content in pPLAIIIb-                  in the DGG motif. In addition, it can be noted that the
OE (Li et al., 2011) or lignin in PgpPLAIIIb-OE and                        phosphate or anion binding element DSGGXXG was
pPLAIIIa-OE (Jang et al., 2019; Jang and Lee, 2020a,                       not completely conserved in the pPLAIIIa protein be-
2020b), and increased seed oil in pPLAIIId-OE (Li et al.,                  cause the second Gly was replaced with Ser.
2013, 2015). Activation tagging of pPLAIIId (STURDY;                          Arabidopsis pPLAIIIa thus lacked the canonical
Huang et al., 2001) also results in decreased longitudinal                 phospholipase motif for the catalytic Ser found in other
cell elongation and stunted growth, as observed in                         characterized pPLAIIIs and one could question whether
pPLAIIIb-OE. The recessive rice mutant dep3 with                           this protein really possessed phospholipase activity.
OspPLAIIId deficiency displays a dense and erect phe-                       The recombinant pPLAIIIa protein His-tagged at the
notype with short, wide epidermal cells (Qiao et al.,                      C-terminal end was therefore expressed in Escherichia
2011). A comparative proteomic analysis of pPLAIIId-                       coli and purified (Supplemental Fig. S1). In vitro en-
OE and wild type has shown that one protein signifi-                        zymatic assays showed that the His-tagged pPLAIIIa
cantly differs between the OE and wild-type line, and                      had an acyl-ester hydrolase activity on each of the four
it was identified as MICROTUBULE-ASSOCIATED                                 major Arabidopsis phospholipid classes, with a slightly
PROTEIN18 (Zheng et al., 2014). Many physiological                         higher activity on phosphatidic acid (PA) than on phos-
functions have been thus associated with pPLAIIIs in                       phatidylcholine (PC), phosphatidylethanolamine (PE), or
Arabidopsis or other plants, but the molecular path-                       phosphatidylglycerol (PG; Fig. 1C).
ways involved mostly remain to be elucidated.                                 Taken together, these results show that pPLAIIIa is a
   To further shed light on the function of pPLAIIIa, we                   noncanonical phospholipase A that hydrolyzes various
studied the activity of the recombinant protein in vitro,                  phospholipids in vitro.

   1
     This work was supported by the National Research Foundation of
                                                                           Spatial and Temporal Expression Patterns of pPLAIIIa
Korea, the Ministry of Science, Information and Communication
Technology, and Future Planning (Basic Science Research Program               To determine the expression pattern of pPLAIIIa in
grant no. 2019R1A2C1004140), the New Breeding Technologies
                                                                           Arabidopsis, we generated PropPLAIIIa::GUS trans-
Development Program of the Rural Development Administration,
Republic of Korea (project no. PJ01532502), the European Regional
                                                                           formants using 2,087 bp upstream from ATG with 15-
Development Fund, the Région Sud, the French Ministry of Research,         bp coding sequence (total 2,105 bp). The GUS reporter
and the Commissariat à l’Énergie Atomique et aux Énergies                  gene was expressed in most organs including inflores-
Alternatives.                                                              cences, flowers, siliques, stems, and leaves (Fig. 2) but
   2
     Author for contact: mpizlee@jnu.ac.kr.                                displayed further distinct spatial or temporal expres-
   3
     Senior author.                                                        sion patterns compared to other pPLAIIIs promoters
   The author responsible for distribution of materials integral to the    (Dong et al., 2014). pPLAIIIa was highly expressed in
findings presented in this article in accordance with the policy de-        roots, with greater restriction in the vasculature and
scribed in the Instructions for Authors (www.plantphysiol.org) is: Ok      meristematic zones of the lateral roots (Fig. 2, A and
Ran Lee (mpizlee@jnu.ac.kr).
                                                                           C–F). In germinating seeds, GUS activity was observed
   O.R.L. conceived the project and designed the experiments; J.H.J.,
N.Q.N., and Y.-J.K. performed the experiments, except for the lipido-
                                                                           in embryo cotyledons and vasculature of roots during
mics experiment, which was performed by B.L., and hormone anal-            testa rupture and radical emergence (Fig. 2, C and D).
ysis, which was performed by H.-J.S., O.R.L., and F.B.; J.H.J. analyzed    Vasculature expression in sepals and petals was also
the data and wrote the article.                                            observed in whole flower organs (Fig. 2B). In cotyle-
   [OPEN]
         Articles can be viewed without a subscription.                    dons and true leaves, stomata expression was restricted
   www.plantphysiol.org/cgi/doi/10.1104/pp.20.00630                        in the inner wall of the guard cell region (Fig. 2G).
Plant Physiol. Vol. 184, 2020                                                                                                          1483

                                 Downloaded on February 2, 2021. - Published by https://plantphysiol.org
                                Copyright (c) 2020 American Society of Plant Biologists. All rights reserved.
Jang et al.

Figure 1. Distinctive conserved motifs of
pPLAIIIa and its lipase activity. A, Align-
ment of pPLAIIIa with other pPLAIIIs and
two pPLAIIs from Arabidopsis. Amino
acid sequences were analyzed using the
pairwise sequence alignment program
ClustalW (http://www.clustal.org/clustal2/).
Multiple sequence alignment was per-
formed using the program BioEdit (v.7.1.9;
https://bioedit.software.informer.com/7.1/).
B, Immunoblot analysis of recombinant
pPLAIIIa protein using anti-63 His tag
antibody on E. coli purified recombinant
proteins. C, In vitro enzymatic assay of
recombinant pPLAIIIa protein using a NEFA
kit. pPLAIIIa fusion protein and 0.5 mM of
each substrate (16:0-18:1 PA, PC, PE, and
PG) were incubated at 30°C for 60 min. Data
represent the mean 6 SE of four independent
biological replicates. Data were analyzed
by one-way ANOVA. Means with different
lowercase letters represent significantly dif-
ferent (P , 0.05), according to Scheffe’s test.

PropPLAIIIa::GUS was expressed highly in hypocotyls                           (Fig. 3E) showed that pPLAIIIa was overexpressed
elongating in the darkness compared with those grown                          very strongly in line 6 (440-fold), line 7 (420-fold),
in the light (Fig. 2H). Cross-sectional images of stems                       and line 13 (800-fold), and moderately in line 8 (5-fold).
indicate strong expression of pPLAIIIa in the xylem and                       No transcripts were detected for two transfer DNA
phloem (Fig. 2I). Strong expression was also observed                         insertion lines in pPLAIIIa, indicating that they were
in the hydathodes of young leaves and trichomes                               KO mutants (Fig. 3E). Transcript expression levels
(Fig. 2J). Overall, GUS expression was observed in all                        corresponded to protein levels (Fig. 3B). Comple-
organs, with more restriction in the vasculature.                             mentation lines (pPLAIIIa-COM) generated by cross-
                                                                              ing each OE line in the KO line 1 background
                                                                              (SAIL830G12) still displayed overexpression of pPLAIIIa
KO, OE, and Subcellular Localization of                                       but compromised where line 7 overexpressed 87-fold
Arabidopsis pPLAIIIa                                                          and line 13, 94-fold. This complementation result
                                                                              could be caused by overexpressing using the 35S
  To study the function of pPLAIIIa, we performed                             promoter. Interestingly, transcripts for the closely
gain- and loss-of-function experiments in Arabidopsis.                        related pPLAIIIb (72% identity with pPLAIIIa),
We first isolated homozygous transfer DNA–insertion                            pPLAIIIg (56%), and pPLAIIId (34%; Supplemental
mutants for pPLAIIIa (Fig. 3A). In addition, the full-length                  Fig. S2) were slightly modulated by the expression
genomic DNA sequence of Arabidopsis pPLAIIIa was                              level of pPLAIIIa (Supplemental Fig. S3). In seedling
overexpressed in Arabidopsis under the control of the                         stages (Fig. 3F), the hypocotyl length of the pplaIIIa
35S promoter with yellow fluorescence protein (YFP)-                           mutants was longer than that of controls, but OE
or monomeric red fluorescent protein (mRFP)-tagging                            lines were shorter than controls (Fig. 3G). The root
at the C-terminal end. Immunoblotting using mRFP                              lengths were only shorter in two of the OE lines and
antibody detected expected size bands only visible in                         unaltered in the KO mutant lines (Fig. 3H). Both OE
OE lines but not in KO lines (Fig. 3B). Both C-terminal                       lines 6 and 7 could be considered as ectopic lines
YFP and mRFP tagging showed that pPLAIIIa local-                              with similar levels of expression, and OE line 13 was
ized to plasma membranes (PMs) in root cells (Fig. 3, C                       the most highly expressing line. However, OE line 8
and D). The fluorescence signal of PM was separated                            was the most moderate line that was perfectly com-
from the cell wall, indicating its signal is not wall-                        plemented in KO line 1 (Fig. 3, G and H). From the
associated (Fig. 3D). Quantification of pPLAIIIa tran-                         seedling stages, all OE lines displayed stunted and
script levels in four independent homozygous OE lines                         dwarf phenotypes with thicker cotyledons (Fig. 3F),
1484                                                                                                                  Plant Physiol. Vol. 184, 2020

                                       Downloaded on February 2, 2021. - Published by https://plantphysiol.org
                                      Copyright (c) 2020 American Society of Plant Biologists. All rights reserved.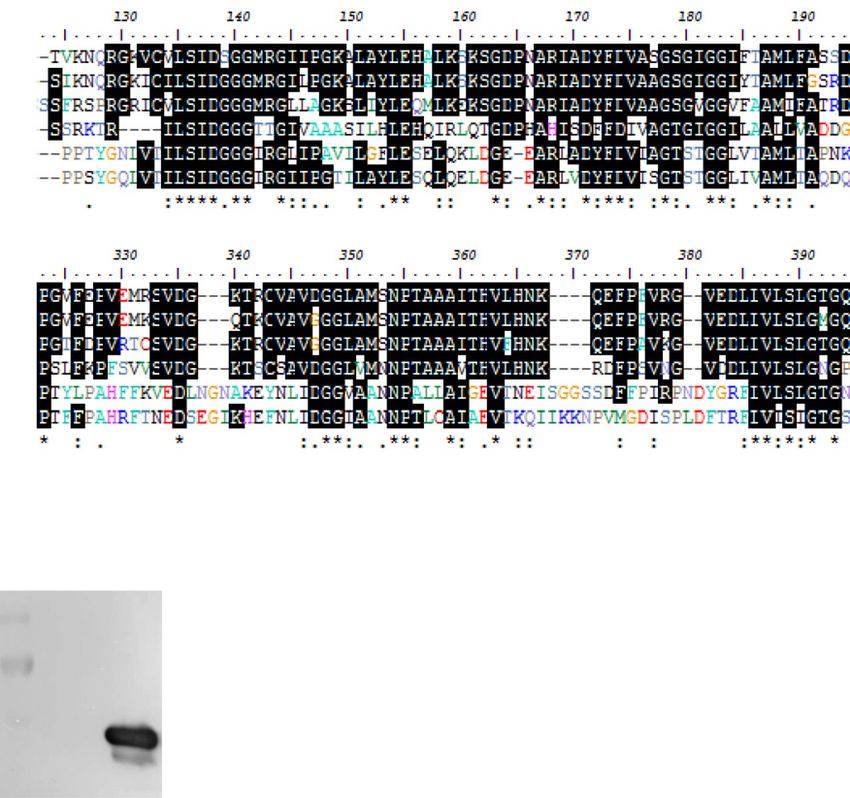
pPLAIIIa Affects Germination Rate

          Figure 2. Spatial and temporal gene expression patterns of pPLAIIIa in Arabidopsis. Histochemical analysis of GUS expression
          harboring PropPLAIIIa::GUS at different developmental stages. A to J, GUS expression in a fully grown plant (A), a floral organ (B),
          a 1-d-old seedling (C), 2-d-old seedlings (D), 4-d-old seedlings (E), the vasculature of the roots and the meristematic zone of the
          lateral root (F), the inner cell wall of a guard cell (G), the light- and dark-dependent expression in 6-d-old seedlings (H), the
          vasculature of the apical and basal stem (I), and the mature cauline leaf (J). All images were brightness-adjusted. Scale bars 5 100 mm.

which were also confirmed in the subsequent growth                                mutant and two strong pPLAIIIa-OE lines, and 115
stages.                                                                          molecular species of acyl-lipids (including phospho-
                                                                                 lipids, galactolipids, and sulfolipids) were analyzed by
                                                                                 liquid chromatography tandem mass spectrometry
Lipidomics Reveal a Wide Range of Acyl-Lipids Are                                (LC-MS/MS; Fig. 4; Supplemental Figs. S4 and S5).
Decreased in pPLAIIIa-OE on a Seedling-Weight Basis                                 In the pplaIIIa KO mutant, analysis of the lipid mo-
                                                                                 lecular species did not reveal significant differences,
  To determine which lipid molecular species may be                              including in the phospholipid species potentially lo-
affected in the knockout or overexpressor plants, to-                            calized to the PM (Fig. 4C; Supplemental Fig. S4). In OE
tal lipids were extracted from seedlings of a pplaIIIa                           lines, total acyl-lipids were reduced ;25% on a seedling
Plant Physiol. Vol. 184, 2020                                                                                                                        1485

                                 Downloaded on February 2, 2021. - Published by https://plantphysiol.org
                                Copyright (c) 2020 American Society of Plant Biologists. All rights reserved.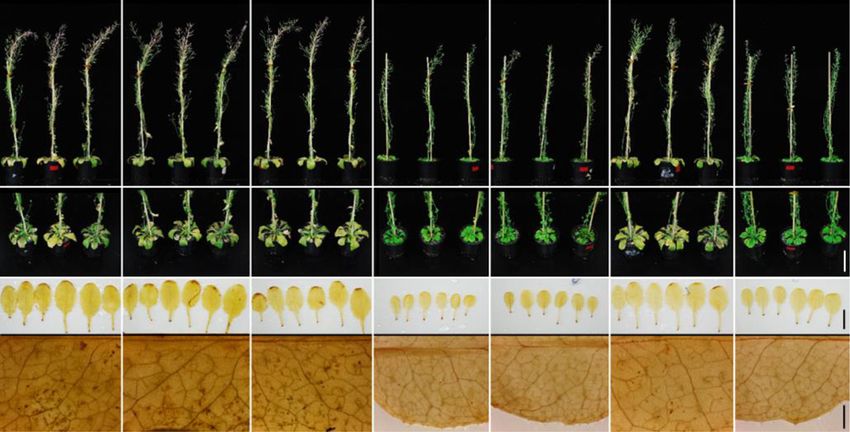
Jang et al.

          Figure 3. KO, OE, and complementation lines for pPLAIIIa in Arabidopsis. A, The transfer DNA insertion sites in two Arabidopsis
          pplallla KO mutants and a diagram showing the OE construct of pPLAIIIa (pPLAIIIa-OE) under the control of the 35S promoter
          with YFP or mRFP fusion at the C terminus. B, Immunoblotting of mRFP-tagged pPLAIIIa from Col-0, vector control, KO, and OE
          plants. After SDS-PAGE separation, protein was immunoblotted with anti-mRFPantibody. C, Subcellular localization of pPLAIIIa-
          YFP in the PM merged with FM4-64. Scale bars 5 10 mm. D, Plasmolysis of root epidermal cells of the pPLAIIIa-mRFP with 0.2 M
          of NaCl for 1 min. Scale bars 5 10 mm. E, Transcript levels of pPLAIIIa genes in the controls, KO, OE, and complementation
          (COM) lines as measured by RT-qPCR. n 5 3. F, Phenotypes of 4-d-old seedlings. Scale bar 5 1 cm. G and H, The hypocotyl length

1486                                                                                                                  Plant Physiol. Vol. 184, 2020

                                   Downloaded on February 2, 2021. - Published by https://plantphysiol.org
                                  Copyright (c) 2020 American Society of Plant Biologists. All rights reserved.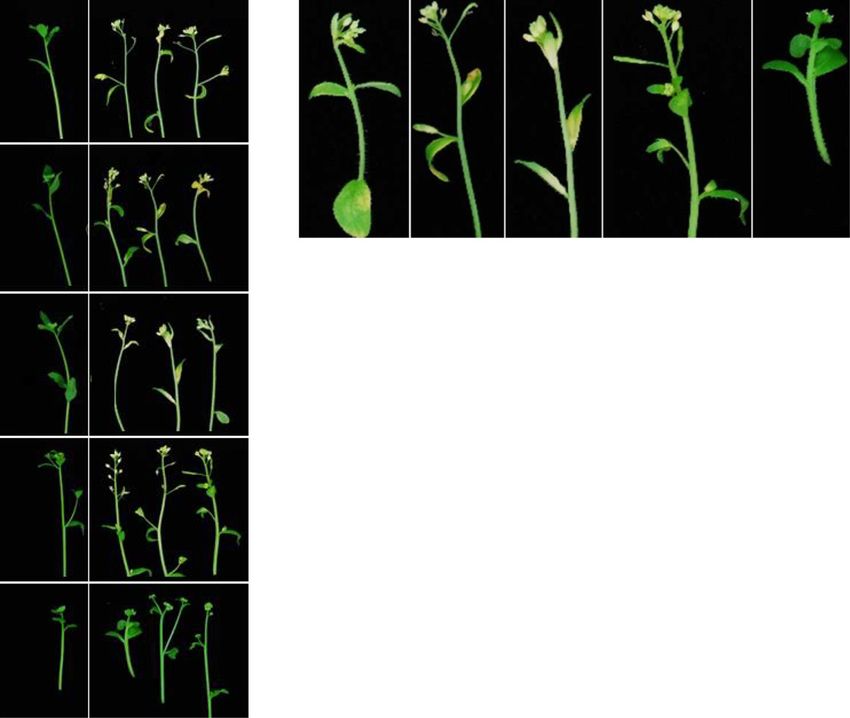
pPLAIIIa Affects Germination Rate

fresh weight (FW) basis in both lines compared to                               (Fig. 5, F and G), hypocotyls (Fig. 3G), roots (Fig. 3H),
the vector control (Fig. 4A). Significant decreases                              and petioles (Supplemental Fig. S6).
were observed in many lipid classes (Fig. 4B). This                                At the cellular level, when pPLAIIIa was overex-
included major phospholipid classes, such as the                                pressed, longitudinal elongation patterns from cells
mostly extraplastidial PC and PE and the plastidial/                            were reduced as observed in stems (Fig. 5H) and
mitochondrial PG, the minor phospholipid class PA,                              flowers (Fig. 5F; Supplemental Fig. S7A); conversely,
and some purely plastidial lipid classes such as the                            stem cells expanded transversely (Fig. 5I). However, the
galactolipid monogalactosyldiacylglycerol (MGDG)                                number of cells per stem cross section was similar in
and digalactosyldiacylglycerol (DGDG), and the sul-                             wild-type, KO, OE, and COM lines (Fig. 5J). Here, OE
folipid class sulfoquinovosyldiacylglycerol (SQDG).                             line 8 was again solely complemented in the KO back-
For plastidial lipids, both “prokaryotic” species (C18/                         ground, and OE line 13 displayed partial complemen-
C16, i.e. C34) and “eukaryotic” species (C18/C18, i.e.                          tation in stem thickness (Fig. 5I). The effect of pPLAIIIa
C36) were affected (Fig. 4C). The reduction was almost                          overexpression on cell size and shape was also ob-
evenly distributed among all glycerolipid classes, and                          served on trichomes (Supplemental Fig. S7, B and C)
the lipid class composition was thus not significantly                           and pollen grains (Fig. 5K). Trichomes are predomi-
affected in the two OE lines (Supplemental Fig. S5). In                         nantly three-branched on the adaxial surfaces of the
the OE lines, a reduction was seen in most of the major                         rosette and cauline leaves of wild type (Higginson et al.,
molecular species (Fig. 4C) and the minor ones also                             2003). The overall trichome size was strongly reduced
(Supplemental Fig. S4). The PA class appeared to be                             in pPLAIIIa-OE (Supplemental Fig. S7, B and C), and a
particularly impacted with almost all molecular species                         greater number of two-branched trichomes were ob-
of PA reduced by 30% to 50% (Fig. 4C). Lysolipids were                          served compared with that in control (Supplemental
not significantly changed, except for the lysoMGDG                               Fig. S7B). While overexpression of pPLAIIIa had a
and lysoPG species, which were significantly reduced                             strong effect on the sizes of many organs, silencing of
in both OE lines. No accumulation of a particular FFA                           the gene did not produce drastic effects in Arabidopsis
species (Fig. 4C) or of total FFAs (Fig. 4B) was measured                       plants. However, some differences occurred in KO
in the OE lines.                                                                mutants compared with Col-0, including an increase in
   In conclusion, lipidomic analyses show that total                            length of hypocotyls (Fig. 3, F and G) and petioles
lipid amount per FW and the composition in glycer-                              (Supplemental Fig. S6). This observation suggests the
olipid molecular species remained unchanged in the                              possible involvement of pPLAIIIa in hormonal growth
pplaIIIa KO mutant. In OE lines, FFAs did not accu-                             control by auxin, ethylene, and gibberellin that is
mulate, and composition in glycerolipid classes was not                         essential for hypocotyl and petiole elongation (de Wit
significantly changed in either of the OE lines.                                 et al., 2016; Yang and Li, 2017) in wild-type plants.

pPLAIIIa Expression Level Affects the Size and Shape of                         pPLAIIIa-OE Is Involved in the Control of Seed Size
Many Cells and Organs                                                           and Germination

   Transversely expanded cell morphology with altered                              An exception to the reduction in organ size in OE
longitudinal cell elongation has been previously                                lines occurred in seeds, which increased in width
reported after the overexpression of pPLAIIIb and                               without alteration in length (Fig. 6, A and B). Consis-
pPLAIIId (Huang et al., 2001; Li et al., 2011, 2013; Dong                       tently, seed weight increased 23% in pPLAIIIa-OE (line
et al., 2014). We thus investigated the possible role of                        13) and decreased 10% in KO mutants (Fig. 6C), thus
pPLAIIIa in Arabidopsis growth and development by                               showing that pPLAIIIa is involved in seed development
performing a detailed phenotypic analysis of several                            in wild-type plants. In highly overexpressing OE lines,
organs in OE and KO lines for pPLAIIIa. Overall, OE                             it was clear that the increased seed weights were at the
plants were, on average, 9 cm shorter in strongly                               expense of seed number per silique (Fig. 6D).
expressing lines compared with the controls (Fig. 5A).                             The fact that seed weights decreased in KO mutants
The size of the rosette leaves decreased, and the number                        prompted us to check seed germination rates (Zhong
of leaves decreased with increasing pPLAIIIa expres-                            et al., 2016) and kinetics. After 20 h in the light, KO
sion (Fig. 5, B and C). In three strong pPLAIIIa-OE lines                       mutants showed 19% lower germination rates than the
(lines 6, 7, and 13), leaves were 1.7-fold thicker and                          control, and the OE line showed a 10% greater germi-
contained more water (3%) on average (Fig. 5, D and E).                         nation rate on average (Fig. 6E). However, all KO seeds
A reduction in organ size in pPLAIIIa-OE lines was also                         germinated by 30 h, which indicated that the germi-
clearly seen in other organs such as flowers and siliques                        nation rate was not affected, but that germination was

          Figure 3. (Continued.)
          (G) and root length (H) of the controls, for the KO, OE, and COM lines. n 5 19 to 43. In E, G, and H, data represent the mean 6 SE
          (SE) of independent replicates. Asterisks indicate significant difference compared with the controls using Student’s t test (*P , 0.05
          and **P , 0.01). Col-0 and an empty vector line were used as control for mutant and OE lines, respectively.

Plant Physiol. Vol. 184, 2020                                                                                                                      1487

                                 Downloaded on February 2, 2021. - Published by https://plantphysiol.org
                                Copyright (c) 2020 American Society of Plant Biologists. All rights reserved.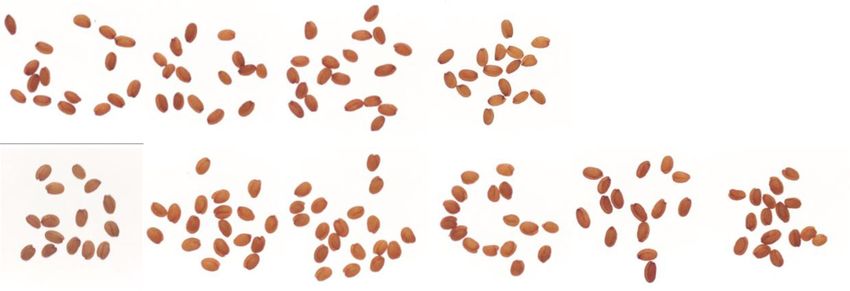
Jang et al.

          Figure 4. Total lipid content and abundance of lipid molecular species in OE and KO lines. A to C, Total lipid content (A), total
          content of each lipid class (B), and major lipid molecular species content (C) in OE and KO lines. Each molecular species of acyl-
          lipid was identified and quantified using UPLC-MS/MS in the KO mutant and OE lines compared with the controls. Values were
          normalized by FW of rosette leaves analyzed. Data represent the mean 6 SE of three (controls) to six (KO and OEs) independent
          biological replicates. Asterisks indicate significant differences using Student’s t test (*P , 0.05 and **P , 0.01) compared with the
          controls. Molecular species are indicated as the total number of carbon atoms in acyl chains: the total number of double bonds.

1488                                                                                                                       Plant Physiol. Vol. 184, 2020

                                    Downloaded on February 2, 2021. - Published by https://plantphysiol.org
                                   Copyright (c) 2020 American Society of Plant Biologists. All rights reserved.
pPLAIIIa Affects Germination Rate
delayed compared to that in wild type. Treatment with (DAB) staining (Fig. 8B). DAB is oxidized by H2O2 in the
gibberellic acid (GA)3 did not alter the germination presence of heme-containing proteins to generate a dark-
substantially (Fig. 6F). Because antagonism between brown precipitate (Thordal-Christensen et al., 1997). In
abscisic acid (ABA) and GA plays a key role in con- OE lines, leaves were greener in 8-week-old plants, when
trolling seed germination (Koornneef et al., 2002), we the leaves of wild-type plants had already become
quantified ABA in dry seeds. ABA content increased in chlorotic (Fig. 8A). All plant leaves were green up to 28 d,
the mutant compared to the wild type (Fig. 6G). Alto- but the levels of H2O2 were lower when pPLAIIIa was
gether, the data suggest that the KO of pPLAIIIa delays highly expressed, as observed in the OE lines compared
the initial germination rate by changing endogenous with the wild type (Fig. 8B) after DAB staining. To
GA and ABA biosynthesis. confirm that the delayed senescence was caused by
pPLAIIIa, we analyzed the expression of a representa-
tive downstream gene, SENESCENCE-ASSOCIATED
Transcript Levels of Ethylene and GA Biosynthesis Genes GENE12 (SAG12), which encodes a Cys protease
Increased during pPLAIIIa-OE Seed Imbibition (Lohman et al., 1994) upregulated during senescence.
Expression of SAG12 was 10-fold lower in four strong
The antagonistic effects of ethylene and ABA in the OE lines (Fig. 8C), which shows that high expression of
regulation of seed germination have also been exten- pPLAIIIa retards senescence. By contrast, expression of
sively studied (for review, see Corbineau et al., 2014). SAG13, which may be induced by stress or cell death,
Increased ethylene production is associated with an was only slightly increased in two of the four OE lines
accumulation of ACC oxidase (ACO) transcripts analyzed (Fig. 8D).
(Corbineau et al., 2014). ACO1 and ACO2 are the major
ACOs involved in ethylene synthesis. ACO1, ACO2,
and ACO4, which exhibit ACO activity (Gómez-Lim OE of pPLAIIIa Confers Turnip Crinkle Virus Resistance
et al., 1993; Linkies et al., 2009; Park et al., 2018), were by Altering Salicylic Acid and Jasmonic Acid Contents
all upregulated in OE lines, whereas ACO1 and ACO4
expression decreased in KO lines (Fig. 7A). Numerous OE of phospholipase activity by SOBER1 reduces PA
data also suggest that ethylene stimulates seed germi- levels and suppresses plant immunity to the bacterial
nation by affecting GA biosynthesis (Corbineau et al., effector AvrBsT (Kirik and Mudgett, 2009). However, a
2014). To uncover a possible role of bioactive GA bi- plant immunity study focusing on virus relative to the
osynthesis, we analyzed expression of four GA oxi- level of PA has not been previously reported. Consid-
dase genes. GA20ox and GA3ox encode enzymes that ering that plant viruses are pathogens associated with
catalyze bioactive gibberellin biosynthesis, whereas major threats, resistance to turnip crinkle virus (TCV) in
GA2ox1 and GA2ox2 are involved in the conversion Arabidopsis, which is one of the few manipulative
of bioactive gibberellins into an inactive form. Two plant-virus systems, was tested in mutant and OE lines
GA2oxs were upregulated 1.4-fold in KO lines, whereas (Fig. 9). Formation of the hypersensitive response (HR)
GA20ox1 was upregulated 1.3-fold and GA2ox2 was was visible in TCV-inoculated plant leaves 3-d post-
downregulated 0.6-fold in the OE lines (Fig. 7B). These inoculation (DPI; Fig. 9, A and B) and in inflores-
data explain that the faster germination in OE lines cences at 12 DPI (Supplemental Fig. S8A), with the most
might be due to more active forms of GA and increased severe effects in the KO mutant. Only highly expressing
levels of ethylene. pPLAIIIa-OE (line 13) displayed an intact inflores-
cence (Fig. 9B). These phenotypes were consistent
with the corresponding patterns of TCV gene expres-
OE of pPLAIIIa Delayed Senescence by Reducing ROS sion, whereby the relative gene expression dramatically
decreased in OE line 13 and increased in the KO mutant
Suppression of the PA-generating PLDa1 leads to (Fig. 9C; Supplemental Fig. S8B). After TCV infection,
reduced superoxide synthesis, and addition of exoge- several defense genes, such as pathogenesis-related
nous PA to leaves promotes reactive oxygen species protein1 (PR1), PR2, and PR5, are expressed, and sali-
(ROS) production (Sang et al., 2001). Besides, in several cylic acid (SA) accumulates (Kachroo et al., 2000). To
plant systems, minor lipid PA content has been studied determine whether this mechanism could be involved
in relation to stress responses (Wang et al., 2006) in higher virus resistance of pPLAIIIa-OE, the gene ex-
through the modulation of ROS (Hong et al., 2008). pression patterns of two representative SA and jas-
Therefore, we decided to monitor hydrogen peroxide monic acid (JA) pathway genes were analyzed using
(H2O2) levels in 8-week-old mutant and OE lines leaves at 3 DPI (Fig. 9, D and E). PR1 was upregulated in
(Fig. 8A) using 3,3-diaminobenzidine tetrahydrochloride both OE lines, whereas PDF1.2 expression significantly
Figure 4. (Continued.)
Dashes (e.g. 18:3-1 and 18:3-2) indicate two species with the same mass and fragmentation pattern but with different retention
times. For MGMG, DGDG, SQDG, PG, PC, and PE classes, only the three or four major species are shown. Minor species for
these lipid classes are shown in Supplemental Figure S4.
Plant Physiol. Vol. 184, 2020 1489
Downloaded on February 2, 2021. - Published by https://plantphysiol.org
Copyright (c) 2020 American Society of Plant Biologists. All rights reserved.Jang et al.
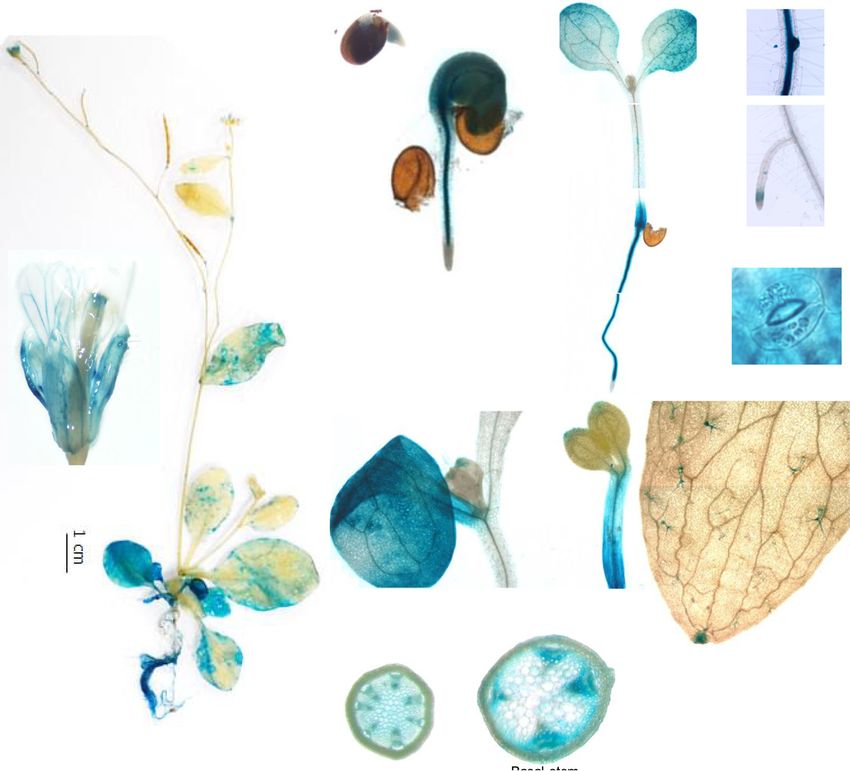
Figure 5. Overexpression of pPLAIIIa alters the size and shape of many cells and organs. A and C to E, Statistical analysis of plant
height (A), leaf surface area (C), leaf thickness (D), and leaf water content (E) in 4-week-old plants. Mean 6 SE of three independent
replicates. Asterisks indicate significant difference using Student’s t test (*P , 0.05 and **P , 0.01) compared with the controls. B,
The aerial part of each 4-week-old plant with all individual leaves. The leaves are arranged from cotyledons (left) to the youngest
leaves (right). Scale bars 5 1 cm. F, Floral organs and siliques in the pPLAIIIa-OE line (13) and Col-0. Scale bars 5 0.2 mm (top),
2 mm (middle), and 5 mm (lower). G, Flower in the Col-0 and OE lines. Scale bars 5 500 mm. H, Stems in the Col-0 and OE lines.
Scale bars 5 500 mm (upper) and 100 mm (lower). I, The area (millimeters squared) of cross-sectioned stems. J, Cell number of
each sectioned stems. Data represent the mean 6 SD of 10 independent replicates. Asterisks indicate significant difference using
Student’s t test (**P , 0.01) compared with the controls. K, Pollen structures in Col-0, KO, and OE lines. Scale bars 5 10 mm.
All surface images were captured using a low-vacuum scanning electron microscope (model no. JSM-IT300; JEOL Korea) at a
10.8-mm working distance and 20.0 kV.
1490 Plant Physiol. Vol. 184, 2020
Downloaded on February 2, 2021. - Published by https://plantphysiol.org
Copyright (c) 2020 American Society of Plant Biologists. All rights reserved.pPLAIIIa Affects Germination Rate
Figure 6. pPLAIIIa expression associates with increased germination rate and seed size. A and B, Mature seeds (A) and size (B) of
control, KO, OE, and COM lines. Scale bar 5 1 mm. Average n 5 50 for seed size. C, The hundred-seed weight of control, KO,
and OE lines. Average n 5 10. D, Seed number per silique (n 5 10). E and F, Germination rates of control, KO, and OE lines after
20-h germination under light conditions. n 5 120. F, The germination rate after treatment with 1 mM of GA3. G, ABA content was
analyzed using UPLC. Mean 6 SE (SE) of three independent replicates. Asterisks indicate significant difference using Student’s t test
(*P , 0.05 and **P , 0.) compared with the controls. 1/2 MS, One-half stregth Murashige and Skoog.
Plant Physiol. Vol. 184, 2020 1491
Downloaded on February 2, 2021. - Published by https://plantphysiol.org
Copyright (c) 2020 American Society of Plant Biologists. All rights reserved.Jang et al.
Figure 7. The mRNA levels of ethylene and GA
biosynthesis genes in pPLAIIIa-OE lines. A and
B, Gene expression patterns of ACOs (A) and of
gibberellin oxidases (GA2ox1, GA2ox2, GA3ox1,
and GA20ox1; B) from control, KO, and OE seeds
imbibed for 20 h. Mean 6 SE (SE) of three inde-
pendent replicates. Asterisks indicate significant
difference using Student’s t test (*P , 0.05 and
**P , 0.01) compared with the controls.
decreased in OE line 13. The 2-fold increase in PR1 gene the controls (Fig. 9G). Thus, differential cellular levels of
expression in the KO mutant and OE lines may be SA and JA seem to be coordinately involved in TCV
explained by two endogenous antagonistic plant hor- resistance due to the function of pPLAIIIa.
mones. SA content was higher in the KO mutant and
OE line 13 compared with the controls (Fig. 9F). This
finding indicates that both SA level and PR1 gene ex-
DISCUSSION
pression are modulated by the threshold level of rela-
tive pPLAIIIa expression or activity in response to While the molecular and biochemical functions of
developmental and environmental cues. However, the pPLAIIIb and pPLAIIId have been characterized in Ara-
endogenous JA level was two times higher in the mu- bidopsis (Li et al., 2011, 2013), pPLAIIIa has only been
tant and 25% lower in OE lines compared with that in studied in rice (Liu et al., 2015). Here, we characterized
Figure 8. pPLAIIIa-OE lines remain green longer with reduced H2O2. A, Eight-week-old plants of the control, KO, and pPLAIIIa-
OE lines. Scale bar 5 5 cm. B, The sixth or seventh leaves were detached from 4-week-old plants and used for DAB staining. Scale
bars 5 1 cm. C and D, Relative gene expression patterns of two senescence marker genes, SAG12 (C) and SAG13 (D). Mean 6 SE
(SE) of three independent replicates. Asterisks indicate significant difference using Student’s t test (*P , 0.05 and **P , 0.01)
compared with the controls.
1492 Plant Physiol. Vol. 184, 2020
Downloaded on February 2, 2021. - Published by https://plantphysiol.org
Copyright (c) 2020 American Society of Plant Biologists. All rights reserved.pPLAIIIa Affects Germination Rate
Figure 9. Increased SA in pPLAIIIa-OE enhances TCV resistance by changing transcript levels of PR1 and PDF1.2. A, Inflores-
cences of each line 12 DPI of mock and TCV. B, Magnified images of TCV infected plants from each line. Scale bars 5 2 cm. C to E,
The relative gene expression of TCV, PR1, and PDF1.2 in the inoculated leaves of TCV- and mock-infected plants. The inoculated
leaves were monitored for the presence or absence of the HR, and RNA was extracted from inoculated leaves on 0 (1 h), 1, 2, and 3
DPI. Expression of PR1 and PDF1.2 was analyzed from the leaves at 1 DPI only. F and G, Hormone contents of SA and JA as
measured by UPLC in rosette leaves of 5-week-old plants in control, KO, and OE lines. C to G, Four-week-old seedlings were
used for the analysis. Mean 6 SE (SE) of three independent replicates. Asterisks indicate significant difference using Student’s t test
(*P , 0.05 and **P , 0.01) compared with the controls.
Plant Physiol. Vol. 184, 2020 1493
Downloaded on February 2, 2021. - Published by https://plantphysiol.org
Copyright (c) 2020 American Society of Plant Biologists. All rights reserved.Jang et al.
pPLAIIIa KO and OE lines in Arabidopsis at the bio- directly on phospholipid molecular species and indi-
chemical, morphological, and physiological levels. Phe- rectly on plastidial lipid species such as galactolipids,
notypes that confirm and extend those reported in rice sulfolipids, or PG. Concerning the major plastidial
were observed, such as reduced longitudinal growth lipids MGDG and DGDG, it should be noted that in OE
and enlarged seed width and a strong relative decrease lines the decrease in their molecular species impacts
in the contents of PA as well as most other polar glyc- similarly both prokaryotic and eukaryotic species (Fig. 4C;
erolipid classes. But we also provide evidence for Supplemental Fig. S4) and does not affect the mol %
the association of pPLAIIIa with new processes, such as fraction (Supplemental Fig. S5) of these classes. It is
seed germination and virus resistance, and we give new thus likely that the pPLAIIIa activity in extraplastidial
molecular insights into pPLAIIIa signaling via regulation membranes of OEs has an indirect effect on the overall
of expression of PLD genes. content in chloroplast membranes, but does not com-
promise lipid homeostasis in these organelles.
In vitro assays on the partially purified pPLAIIIa
Lipid Substrates of pPLAIIIa In Vivo showed that the protein hydrolyzed various phospho-
lipids, with a slightly higher activity on PA (Fig. 1B).
OE of Arabidopsis pPLAIIIb increases all lipid spe- This seems to be consistent with a decrease in all
cies analyzed: phospholipids, including PE, PC, phospholipid classes with a stronger reduction in PA
phosphatidylinositol (PI), phosphatidylserin, PA, and molecular species in OE lines (Fig. 4C). Measurement of
PG; and galactolipids, including MGDG and DGDG total phospholipase activities in plant extracts did not
(Li et al., 2011). Similarly, overexpression of Arabi- yield further insight into pPLAIIIa in vivo activity, as
dopsis pPLAIIId also tends to increase the levels of lipid no difference could be detected between wild-type and
species, including seed lipid reserves (Dong et al., 2014; OE lines using four different phospholipid substrates
Li et al., 2015). These counterintuitive results showing (Supplemental Fig. S9). This result was possibly due to
increased lipid content in plants overexpressing lipid- highly active phospholipases other than pPLAIIIa, or to
degrading enzymes may be explained by the fact that the presence of inhibitors of pPLAIIIa activity in the
pPLAIIIb may normally act in acyl editing mechanisms extract.
involved in lipid biosynthesis. Acyl editing mecha- In vitro activity assays and lipidomic analyses show
nisms involve the removal by phospholipases of spe- that pPLAIIIa protein is therefore probably a nonspe-
cific fatty acids from membrane phospholipids (for cific phospholipase A acting on a variety of phospho-
example, PC) to yield lysophospholipids and a pool of lipids in the PM, with a possible slight preference
acyl-CoAs enriched in specific fatty acids that are used for PA.
for synthesis of other lipids such as storage lipids (Bates
et al., 2012). Increasing the pool of acyl editing-involved
lysophospholipids through overexpression of specific PA Levels and PLD Expression
phospholipases may create an imbalance in membrane
lipid composition. This imbalance may in turn trigger PA accumulates at significant levels at the PM in
an increased flux of de novo fatty acid and membrane Arabidopsis (Platre et al., 2018). The possibility that PA
lipid synthesis and eventually result in an overall ac- is one of the phospholipid classes targeted by pPLAIIIa
cumulation of lipids. in wild-type plants is supported by the slight preference
By contrast, Arabidopsis pPLAIIIa-OE displayed re- of pPLAIIIa for PA in in vitro assays (Fig. 1C) and the
duced levels of many molecular lipid species compared strong reduction of almost all PA lipid species observed
to wild type (Fig. 4; Supplemental Fig. S4). Thus, it in Arabidopsis pPLAIIIa-OE (Fig. 4). These results on
seems that pPLAIIIa overexpression does not act on the Arabidopsis and the previous observation in rice that a
same mechanisms that are altered by pPLAIIIb and preferential decrease in PA occurs when OspPLAIIIa is
pPLAIIId overexpression (possibly acyl editing cycles, overexpressed (Liu et al., 2015) thus support the view
as discussed before). This idea is consistent with the fact that PA is one of the possible substrates of pPLAIIIa in
that lysophospholipids, which are key players in acyl wild-type plants of both organisms. However, it should
editing mechanisms, accumulate in pPLAIIIb-OE and be stressed that hydrolysis of other phospholipid clas-
pPLAIIId-OE but not in pPLAIIIa-OE. Interestingly, ses by Arabidopsis pPLAIIIa in vivo cannot be ruled
despite the decrease in many lipid species in the out, because lipid species from other phospholipid
OE lines, FFAs did not accumulate in these lines classes are also reduced in OE lines (Fig. 4).
compared to wild type, which showed that the FA Intriguingly, no increases in PA molecular species
breakdown machinery was not overwhelmed by the were detected in pplaIIIa mutants in rice (Liu et al., 2015)
overexpression of pPLAIIIa. Therefore, the phenotypes or Arabidopsis (Fig. 4). Because PA is mostly generated
observed in the OE lines are not likely caused by an ex- by the activation of PLD (Sang et al., 2001), we checked
cess of FFAs. Some of these phenotypes may result from the expression of several PLD isoforms in the Arabi-
the decrease in one or several of the many molecular dopsis pplaIIIa KO mutants. Interestingly, the expres-
lipid species significantly affected in both OE lines (Fig. 4; sion of the major PLD isoforms PLDa1, PLDz1, and
Supplemental Fig. S4). The fact that the Arabidopsis PLDz2 decreased significantly compared to the controls
protein localizes to the PM suggests that pPLAIIIa acts in the mutant seedlings (Supplemental Fig. S10). Taken
1494 Plant Physiol. Vol. 184, 2020
Downloaded on February 2, 2021. - Published by https://plantphysiol.org
Copyright (c) 2020 American Society of Plant Biologists. All rights reserved.pPLAIIIa Affects Germination Rate
together, these data thus suggest that pPLAIIIa hy- of pPLAIIIa reduced the level of JA content (Fig. 9G).
drolyzes PA in Arabidopsis wild-type plants and that Thus, it will be interesting to further investigate how
absence of this activity in the pplaIIIa KO results in pPLAIIIa-mediated lowered JA affects the trichome
decreased expression of several PLD genes to possibly branching patterning.
maintain PA levels in the PM. Other PA-producing
pathways, such as DAG phosphorylation, could also
be involved and may warrant further investigation. Role of pPLAIIIa in Seed Germination
However, in OE lines, the situation is clearly more
complex than a simple counterbalance of PA levels by Overexpression of rice pPLAIIIa in rice (Liu et al.,
modulation of PLD expression. Indeed, in OEs there 2015) and Arabidopsis pPLAIIId in camelina (Li et al.,
was an increase in expression of PLD genes only in the 2015) thickened seed widths, but the length of seeds
stronger OE line, while other ones showed even a de- was reduced or not changed significantly. The recessive
crease in PLD expression. Complexity of the response rice mutant dep3, where part of the pPLAIIId gene is
observed in OEs may be enhanced by the fact that deleted, shows smaller and rounder seeds but greater
pPLAIIIa is also active on other PM phospholipids than grain yields than control (Qiao et al., 2011). Seed sizes
PA, which may activate membrane homeostasis and weights can affect germination, but no study has
mechanisms and interfere with lipid signaling. yet been reported from pPLA gene families. Here, we
show that alteration of seed morphology and weight
can delay germination among pPLAs (Fig. 6). The
Role of pPLAIIIa in Cell Elongation and Plant Growth importance of the plant hormone GA in promoting
seed germination is well known, and ABA can act
OE of pPLAIIIb results in shorter leaves, petioles, antagonistically. Ethylene also regulates germination
hypocotyls, primary roots, and root hairs compared and dormancy of many species via complex hormo-
with the wild type (Li et al., 2011), which is partly nal signaling networks (Corbineau et al., 2014).
reminiscent of the phenotypic characteristics of The knockout pplaIIIa mutant contained more ABA
pPLAIIIa-OE in Arabidopsis (Figs. 3, F–H, and 5; and increased gene expression of GA2ox1, which is
Supplemental Figs. S5 and S6). Conversely, the re- involved in GA inactivation (Fig. 7B). The over-
cessive rice mutant dep3 defective in OspPLAIIId expression of pPLAIIIa displayed more transcripts of
displays a taller plant stature (Qiao et al., 2011). GA oxidases, which catalyze bioactive GA (Fig. 7B).
Generally, short and stunted morphology is observed Ethylene stimulates seed germination by affecting
in pPLAIIId-OE in camelina (Camelina sativa; Li et al., GA biosynthesis or signaling. Thus, the alternation of
2015), pPLAIIId-OE in Arabidopsis and Brassica napus pPLAIIIa delays initial germination speed, possibly
(Dong et al., 2014), pPLAIIIb-OE in Arabidopsis (Li by modulating active and nonactive forms of GA,
et al., 2011), OSAG78-OE (OnpPLAIIId-OE) in Arabi- and increasing ethylene biosynthesis.
dopsis (Lin et al., 2011), OspPLAIII-OE in rice (Liu
et al., 2015), and PgpPLAIIIb in Arabidopsis and
poplar (Populus alba 3 Populus glandulosa; Jang et al., Reduced PA and JA Levels May Explain the Low Level of
2019; Jang and Lee, 2020a). Because pPLAIIIb-OE ROS in pPLAIIIa-OE
and pPLAIIId-OE show accumulation of lysolipids and
FFAs, which have deleterious effects on cell membranes, Characteristic features of leaf senescence are the or-
it is tempting to think that the stunted phenotypes of dered disassembly of the altered photosynthetic appa-
pPLAIII-OEs are caused by the accumulation of pPLAIII ratus and the loss of chlorophyll (Yoshida 2003).
products, which are deleterious to cellular activities. Expression of a well-studied senescence-response gene,
However, our data show clearly that pPLAIIIa-OE have SAG12, markedly decreased in all pPLAIIIa-OE lines
stunted phenotypes in the absence of accumulation of (Fig. 8C); the higher the expression of pPLAIIIa, the
FFAs or lysolipids. These results thus suggest that greater the reduction in SAG12 transcripts. Suppression
pPLAIIIs, at least pPLAIIIa, are involved in plant growth of PLDa leads to reduced superoxide synthesis via
and development through the modulation of minor reduction in the minor phospholipid class PA (Sang
membrane lipid species (such as PA for pPLAIIIa) rather et al., 2001). In addition, the formation of PA leads to
than via large changes in FFAs. Modified PA levels by the production of other lipid messengers, such as JA
pPLAIIIa may indirectly regulate cell elongation and (Wang et al., 2000). Thus, reduced content of PA
plant growth, for example by affecting subcellular lo- (Fig. 4C) and JA (Fig. 9G) due to the overexpression of
calization of regulatory proteins (Yao et al., 2013). pPLAIIIa could be one possible reason for the reduc-
Trichomes are the outermost epidermal cells, which tion in H2O2. Mostly reduced transcript levels of PLD
develop on almost all aerial structures of Arabidopsis. genes in pPLAIIIaOE lines (Supplemental Fig. S10)
The pPLAIIIa-induced changes in trichome branching should support this notion. Although PLDa1 was
(Supplemental Fig. S7B) and pollen structure (Fig. 5K) slightly upregulated, other PLDs were all down-
might also be caused by altered patterns of epidermal regulated. Alternation of lipid species by the reduction
cell elongation. Endogenous JA content is involved in of lysolipids and FFAs (Fig. 4) and hormonal signal-
trichome patterning (Yoshida et al., 2009). Overexpression ing, such as auxin, ethylene, and GAs (Figs. 6 and 7),
Plant Physiol. Vol. 184, 2020 1495
Downloaded on February 2, 2021. - Published by https://plantphysiol.org
Copyright (c) 2020 American Society of Plant Biologists. All rights reserved.Jang et al.
could also affect the level of ROS (Corbineau et al., GUS Histochemical Analysis
2014). Histochemical GUS staining was performed by incubating Prop-
PLAIIIa::GUS transformants in staining buffer following Kim et al. (2014).
Seedlings were photographed under a microscope (Axio Observer D1; Zeiss).
A Higher SA to JA Ratio May Increase the Resistance of
Observation of Reporter Gene Expression
pPLAIIIa-OE to TCV
Fluorescence was observed by confocal laser scanning microscopy (model no.
Some evidence suggests that at least one member of TCS SP5 AOBS/Tandem; Leica). YFP and mRFP were detected using 514/.530
the pPLAI and pPLAII subclasses is involved in plant nm, and 543/560-nm to 615-nm excitation/emission filter sets, respectively.
defenses. pplaI mutants are more sensitive to Botrytis The images were acquired at the Korea Basic Science Institute, Gwangju. Korea.
cinerea infection without altering JA levels (Yang et al.,
2007), whereas pPLAIIa-deficient mutants are more Gene Expression Analysis by Reverse Transcription
resistant to Botrytis spp. or avirulent Pseudomonas Quantitative PCR
syringae infection (La Camera et al., 2005). Among three
Total RNA extraction, quantification of total RNA, synthesis of comple-
isoforms, pPLAIIIa, pPLAIIIb, and pPLAIIId, only
mentary DNA (cDNA), and reverse transcription quantitative PCR (RT-qPCR)
pPLAIIIb is upregulated upon Botrytis spp. and P. were performed following Jang and Lee (2020a, 2020b). Three independent
syringae infection (La Camera et al., 2005). However, experiments were performed for each primer set (Supplemental Table S1).
there is no clear evidence of the involvement of pPLAIII
genes in plant innate immunity. Here we found that
Lipid Extraction and Lipidomic Analysis
higher expression of pPLAIIIa confers TCV resistance
via the regulation of SA and JA (Fig. 9). Increased levels Total lipids were extracted using the following hot isopropanol method.
of SA with decreased levels of JA may play crucial roles. Briefly, 3-week–old Arabidopsis rosettes were cut, immediately weighed, and
placed in 2 mL of boiling isopropanol (85°C) containing 0.01% (w/v) butylated
In Col-0 and the vector control, the ratio of SA/JA was hydroxytoluene. After 10-min heating, samples were cooled down to room
;0.9 and 1, respectively. In KO mutants, this ratio re- temperature, and 1 mg of each internal standard was added (PE 17:0/17:0,
duced to 0.8 whereas it increased 1.4- to 2-fold in two MGDG 18:0/18:0, and TAG 17:0/17:0/17:0). Samples were then ground for
pPLAIIIa-OE lines, 8 and 13, respectively (Fig. 9, F and 1 min using an Ultra-Turrax T25 apparatus (IKA Labortechnik), and 3 mL of
G), which indicates a 2-fold higher SA level compared methyl tert-butyl ether was added. After vortexing for 30 s, 1 mL of water was
added and the mixture was shaken vigorously for 30 min and allowed to phase-
to the JA level in TCV resistance. During TCV infection, separate by centrifugation at 3,000g for 2 min. The uppermost (organic) phase
the HR is reportedly mediated by increased expression was collected, and 1 mL of methyl tert-butyl ether was added to the remaining
of defense genes, such as pathogenesis-related genes, lower phase. The mixture was shaken for 30 s and allowed to phase-separate by
and the accumulation of SA, phytoalexin, and cama- centrifugation. The upper phase was then combined with the previous organic
phase, and the solvent of the total lipid extract was evaporated to dryness under
lexin (Dempsey et al., 1993; Kachroo et al., 2000). The a gentle stream of nitrogen gas. The total lipid extract was resuspended in
2.5-fold increase in PR1 expression and ;50% reduction 200 mL of acetonitrile/isopropanol/ammonium formate (65:30:5, v/v/v, final
in PDF1.2 expression mediated by SA might have in- concentration of ammonium formate was 10 mM) and kept at 220°C until use.
creased TCV virus resistance. Quality control (QC) samples were prepared for data quantification by pooling
aliquots of the lipid extract samples from Col-0 plants to make a QC stock so-
lution. QC samples were evaporated to dryness under a gentle stream of
nitrogen gas and resuspended in 200 mL of the same acetonitrile/isopropanol/
ammonium formate mixture used for samples. A QC sample contained, in
MATERIALS AND METHODS addition to the three internal standards coming from samples, the following
quantification standards added in the molar proportions: PG (17:0/17:0), 4; PA
Plant Materials and Growth Conditions (17:0/17:0), 1; PE (17:0/17:0) 2; PC (17:0/17:0), 4; PI (17:0/14:1), 1; MGDG
(18:0/16:0), 28; DGDG (18:0/16:0), 12; SQDG (16:0/18:3), 2; LysoPG (17:1), 1;
Arabidopsis (Arabidopsis thaliana; Col-0) was used as the wild-type plant. LysoPE (17:1), 1; LysoPC (17:0), 1; and FFA (17:0), 1 (purity of standards was
The pplaIIIa knockout mutants (KO 1: SAIL830G12 and KO 2: SALK_040363) determined before use by LC-MS/MS analysis). Samples and QC samples were
were purchased from the stock center (http://www.arabidopsis.org/). Seeds subjected to ultra-performance liquid chromatography (UPLC)-MS/MS anal-
were maintained as reported in Jang and Lee (2020a, 2020b). yses using an Ultimate RS 3000 UPLC system (Dionex) connected to a quad-
rupole-time-of-flight 5600 mass spectrometer (AB Sciex). Samples were run in
negative mode. Lipids were separated using a C8 2.1 3 150 mm, 2.6-mm column
Transgene Constructs and Arabidopsis Transformation (Kinetex) and a binary gradient of solution A (60v:40v water/acetonitrile) and
solution B (90v:10v isopropanol/acetonitrile). Elution was achieved through a
The modified pCAMBIA1390 vector containing the CaMV 35S promoter, gradient of solution B from 27% to 97%, as compared to solvent A within 20 min
YFP, and/or mRFP was used (Lee et al., 2010) to express pPLAIIIa. The full at a speed of 0.3 mL min21, and then at 97% for 5 min. Solution B was then
pPLAIIIa genomic fragment was amplified using primers containing SalI and decreased to a 27% enrichment during 7 min for column reequilibration. Rel-
AvrII sites (Supplemental Table S1). Enzyme-digested PCR products were ative quantification of lipid molecular species in samples was achieved with the
cloned into the vector (Pro-35s: pPLAIIIa-YFP/mRFP). The promoter::GUS fu- software MULTIQUANT (AB Sciex) using intensity values obtained by
sion construct was generated based on the obtained upstream intergenic region extracting masses of the different lipids previously identified, and by normal-
of pPLAIIIa. The promoter region was amplified using primers as follows: 59- izing based on rosette FW and the internal standard (to control for lipid ex-
TC CTG CAG ATC ATC AAT GTA GTC GAA-39 (forward) and 59-TC GTC traction). In samples, absolute amounts of lipid molecular species (picomole per
GAC TTG CAT CGT AGT TAA CAT-39 (reverse). The amplified PCR product milligram FW) in each lipid class were estimated using intensities of the cor-
was subsequently cloned into a pCAM1390 vector containing a gusA reporter responding quantification standards of the QC samples (normalized by the
gene. All transgene-confirmed constructs were transformed into Arabidopsis internal standard). For lysoMGDGs and lysoDGDGs, estimates were based on
using Agrobacterium tumefaciens C58C1 (pMP90; Bechtold and Pelletier, 1998). one of the lysolipid standards (LPE). The estimated absolute amounts of lipid
Col-0 and the empty vector line were used as controls for the pplaIIIa mutant molecular species were used to calculate total amounts in each lipid class, total
and pPLAIIIa-OE, respectively. lipid amounts, and lipid class compositions in each line.
1496 Plant Physiol. Vol. 184, 2020
Downloaded on February 2, 2021. - Published by https://plantphysiol.org
Copyright (c) 2020 American Society of Plant Biologists. All rights reserved.pPLAIIIa Affects Germination Rate
Protein Purification/Extraction, and Immunoblotting Supplemental Data
The full-length cDNA of pPLAIIIa was cloned into the pET28a vector with The following materials are available as supplemental data.
the 63His. The BL21 (DE3) bacteria expressing pPLAIIIa-His fusion protein
Supplemental Figure S1. SDS-PAGE of recombinant pPLAIIIa protein.
were induced with 1 mM of isopropyl 1-thio-b-D-galactopyranoside, and the
fusion protein was purified. The bacterial pellet was resuspended in lysis buffer Supplemental Figure S2. Phylogenetic tree of PLA family proteins in
(50 mM of NaH2PO4, 300 mM of NaCl, 10 mM of imidazole 1% [v/v] Triton Arabidopsis.
X-100, adjusted pH to 8.0) containing 1 mg mL21 of lysozyme and 1 mM of
Supplemental Figure S3. Transcript levels of other pPLAIII genes are mod-
phenylmethanesulfonyl fluoride. The suspension was sonicated. After centrif-
ulated by the activity of pPLAIIIa.
ugation at 10,000g for 20 min, the supernatant was mixed with Ni-NTA agarose
resin (10% [w/v]; Qiagen). The fusion proteins bound to agarose beads were Supplemental Figure S4. Abundance of minor lipid molecular species in
washed with washing buffer (50 mM of NaH2PO4, 300 mM of NaCl, and 20 mM MGDG, DGDG, SQDG, PG, PC, and PE lipid classes.
of imidazole, adjusted pH to 8.0), and pPLAIIIa proteins were eluted with
elution buffer (50 mM of NaH2PO4, 300 mM of NaCl, and 250 mM of imidazole, Supplemental Figure S5. Lipid class composition based on absolute
adjusted pH to 8.0). The proteins from 7-d-old seedlings were extracted using amounts of lipid molecular species estimated by LC-MS/MS.
extraction buffer (120 mM of Tris-HCl at pH 7.5, 100 mM of EDTA, 5% [v/v] Supplemental Figure S6. pPLAIIIa expression levels affect petiole length.
glycerol, 2% [w/v] SDS, 1% [v/v] Triton X-100, 300 mM of NaCl, 1 mM of di-
thiothreitol, and 1 mM of phenylmethanesulfonyl fluoride) after sonication and Supplemental Figure S7. OE of pPLAIIIa affects the direction of cell elon-
centrifugation in the same condition as for the above protein purification. The gation in filament and style and trichome length.
amount of purified protein was measured with the Bradford method (Bradford, Supplemental Figure S8. Phenotypic differences in KO mutant and OE
1976). The immunoblotted membranes were preblotted with 5% (v/v) skim lines against TCV infection.
milk for 30 min and incubated with 63-His tag antibody, horseradish peroxi-
dase (MA1-135; Invitrogen) for 14 h at 4°C. Anti-RFP polyclonal antibody and Supplemental Figure S9. Lipase activity assay using total protein from
goat anti-Rabbit IgG (H1L) horseradish peroxidase were used as primary and Col-0, KO, and OE plants.
secondary antibody, respectively, for pPLAIIIa-mRFP detection. Bands were
Supplemental Figure S10. Relative gene expression patterns of PLDa1,
visualized by exposing to the HR-A x-ray film after treatment with enhanced
PLDz1, and PLDz2 in KO mutant and OE lines.
chemiluminescence substrate (Thermo Fisher Scientific).
Supplemental Table S1. Primers used in confirmation of DNA insertion
and PCR
In Vitro Enzymatic Assays
Phospholipids (each 16:0-18:1 PA, PC, PE, and PG) were purchased from
Avanti Polar Lipids. Acyl hydrolyzing activities were assayed in a reaction ACKNOWLEDGMENTS
mixture (25 mM of HEPES at pH 7.5, 10 mM of CaCl2, and 10 mM of MgCl2). Each
0.5 mM of lipids was used as substrate and 0.1 mg of purified protein was added We thank Rae-Dong Jeong (Chonnam National University) for advice on
to the mixture in a final volume of 100 mL. The reaction samples were incubated how to analyze TCV infection.
at 30°C for 60 min. The released nonesterified free fatty acids (NEFA) products Received May 15, 2020; accepted August 15, 2020; published August 28, 2020.
were measured with a NEFA-HR colorimetric kit (Wako Pure Chemicals,
http://www.wako-chem.co.jp/english/) using an Epoch microplate spectro-
photometer (BioTek) at 546 nm. LITERATURE CITED
Bates PD, Fatihi A, Snapp AR, Carlsson AS, Browse J, Lu C (2012) Acyl
3,39-Diaminobenzidine Staining editing and headgroup exchange are the major mechanisms that direct
For the in situ detection of H2O2, leaves were detached and stained with 3,39- polyunsaturated fatty acid flux into triacylglycerols. Plant Physiol 160:
diaminobenzidine (DAB) solution for 4 to 5 h. DAB solution was generated by 1530–1539
dissolving 1 mg mL21 of DAB in sterile water and adjusting to pH 3.0 with 0.2 M Bechtold N, Pelletier G (1998) In planta Agrobacterium-mediated transfor-
of HCl. Additionally, 25 mL of TWEEN 20 (0.05% [v/v]) and 2.5 mL of 200 mM of mation of adult Arabidopsis thaliana plants by vacuum infiltration.
Na2HPO4 were added. This process generated 10 mM of Na2HPO4 DAB staining Methods Mol Biol 82: 259–266
solution and increased the pH. Bradford MM (1976) A rapid and sensitive method for the quantitation of
microgram quantities of protein utilizing the principle of protein-dye
binding. Anal Biochem 72: 248–254
TCV Infection and HR Response Analysis Corbineau F, Xia Q, Bailly C, El-Maarouf-Bouteau H (2014) Ethylene, a
key factor in the regulation of seed dormancy. Front Plant Sci 5: 539
Transcripts synthesized in vitro from a cloned cDNA of the TCV genome
Dempsey DA, Wobbe KK, Klessig DF (1993) Resistance and susceptible
using T7 RNA polymerase were used for viral infections as described in
responses of Arabidopsis thaliana to turnip crinkle virus. Phytopathology
Dempsey et al. (1993). Resistance and susceptibility were confirmed by RT-
83: 1021–1029
qPCR.
de Wit M, Galvão VC, Fankhauser C (2016) Light-mediated hormonal reg-
ulation of plant growth and development. Annu Rev Plant Biol 67: 513–537
Phytohormone Analysis Dong Y, Li M, Zhang P, Wang X, Fan C, Zhou Y (2014) Patatin-related
phospholipase pPLAIIId influences auxin-responsive cell morphology
Samples were extracted twice with ethyl acetate. The extracts were combined, and organ size in Arabidopsis and Brassica napus. BMC Plant Biol 14: 332
evaporated, and dissolved in 70% methanol. Isotope-labeled standards (2H4-SA Gómez-Lim MA, Valdés-López V, Cruz-Hernandez A, Saucedo-Arias LJ
and 2H6-JA) were used as internal standards. UPLC (Waters) coupled with a (1993) Isolation and characterization of a gene involved in ethylene bi-
quadrupole-time-of-flight instrument (Waters) was used for the analysis. The osynthesis from Arabidopsis thaliana. Gene 134: 217–221
chromatographic separation was carried out on a C18 column. The mobile Higginson T, Li SF, Parish RW (2003) AtMYB103 regulates tapetum and
phases consisted of solvent A (0.1% [v/v] formic acid) and solvent B (acetoni- trichome development in Arabidopsis thaliana. Plant J 35: 177–192
trile). MS analysis was conducted in the negative ion mode with electrospray Holk A, Rietz S, Zahn M, Quader H, Scherer GFE (2002) Molecular
ionization. identification of cytosolic, patatin-related phospholipases A from Ara-
bidopsis with potential functions in plant signal transduction. Plant
Accession Numbers Physiol 130: 90–101
Hong JK, Yun BW, Kang JG, Raja MU, Kwon E, Sorhagen K, Chu C,
Arabidopsis Genome Initiative locus identifiers (http://www.arabidopsis. Wang Y, Loake GJ (2008) Nitric oxide function and signalling in plant
org) for the genes described in this study are depicted in Supplemental Table S1. disease resistance. J Exp Bot 59: 147–154
Plant Physiol. Vol. 184, 2020 1497
Downloaded on February 2, 2021. - Published by https://plantphysiol.org
Copyright (c) 2020 American Society of Plant Biologists. All rights reserved.You can also read