A biophysical insight of camptothecin biodistribution: towards a molecular understanding of its pharmacokinetic issues
←
→
Page content transcription
If your browser does not render page correctly, please read the page content below
Preprints (www.preprints.org) | NOT PEER-REVIEWED | Posted: 20 May 2021 doi:10.20944/preprints202105.0480.v1

 Article

 A biophysical insight of camptothecin biodistribution: towards
 a molecular understanding of its pharmacokinetic issues
 Andreia Almeida 1, 2, 3, †, Eduarda Fernandes 4, †, Bruno Sarmento 1, 2, 5 and Marlene Lúcio 4, 6,*

 1 INEB - Instituto Nacional de Engenharia Biomédica, Universidade do Porto, Rua Alfredo Allen, 208, 4200-
 135, Porto, Portugal
 2 i3S – Instituto de Investigação e Inovação em Saúde, Universidade do Porto, Rua Alfredo Allen, 208, 4200-

 135, Porto, Portugal
 3 Instituto de Ciências Biomédicas Abel Salazar, Universidade do Porto, Rua Jorge Viterbo Ferreira, 228, 4050-

 313, Porto, Portugal; e-mail@e-mail.com
 4 CF-UM-UP, Centro de Física das Universidades do Minho e Porto, Departamento de Física da Universidade

 do Minho, Campus de Gualtar, 4710-057 Braga, Portugal
 5 CESPU, Instituto de Investigação e Formação Avançada em Ciências e Tecnologias da Saúde, Rua Central

 da Gandra, 137, 4585-116, Gandra, Portugal
 6 CBMA, Centro de Biologia Molecular e Ambiental, Departamento de Biologia, Universidade do Minho,

 Campus de Gualtar, 4710-057 Braga, Portugal
 * Correspondence: Marlene Lúcio, mlucio@fisica.uminho.pt
 † Equal contribution

 Abstract: Camptothecin (CPT) is a potent anticancer drug, and its putative oral administration is
 envisioned although difficult due to physiological barriers that must be overcome. A comprehensive
 biophysical analysis of CPT interaction with biointerface models can be used to predict some
 pharmacokinetic issues after oral administration of this or other drugs. To that end, different models
 were used to mimic the phospholipid composition of normal, cancer, and blood-brain barrier
 endothelial cell membranes. The logD values obtained indicate that the drug is well distributed
 across membranes. CPT-membrane interaction studies also confirm the drug’s location at the
 membrane cooperative and interfacial regions. The drug can also permeate membranes at more
 ordered phases by altering phospholipid packing. The similar logD values obtained in membrane
 models mimicking cancer or normal cells imply that CPT has limited selectivity to its target.
 Furthermore, CPT binds strongly to serum albumin, leaving only 8.05% of free drug available to be
 distributed to the tissues. The strong interaction with plasma proteins, allied to the large distribution
 (VDSS=5.75 ± 0.932 L·Kg-1) and tendency to bioaccumulate in off-target tissues, were predicted to be
 pharmacokinetic issues of CPT, implying the need to develop drug delivery systems to improve its
 biodistribution.

 Keywords: camptothecin; drug distribution; drug-membrane interaction; biophysical profiling;
 biomimetic models; partition coefficient; ADMET/PK prediction; small and wide-angle X-ray
 diffraction; fluorescence spectroscopy; human serum albumin (HSA)

 1. Introduction
 Camptothecin (CPT) is an alkaloid isolated from the Chinese tree Camptotheca acuminata
 and it is a promising agent against cancer [1]. CPT is a pH dependent molecule and can
 exist in two different forms: the lactone form, stable at pH < 5.5 and biologically active or
 the carboxylate form, stable at pH > 9. CPT inhibits the topoisomerase I, which is a nuclear
 enzyme implied in the DNA replication, by binding the topoisomerase I-DNA complex,
 avoiding the replication process and, consequently, leading to the cell death [2,3]. Its
 mechanism of action only occurs in the S-phase of the cell cycle. Interestingly, cancer cells
 spend more time in the S-phase compared to healthy cells, which means that CPT is more
 likely to bind to cancer cells and therefore, exert its mechanism of action. This selectivity
 is one of the characteristics that makes CPT a potential drug for cancer treatment.

 © 2021 by the author(s). Distributed under a Creative Commons CC BY license.
Preprints (www.preprints.org) | NOT PEER-REVIEWED | Posted: 20 May 2021 doi:10.20944/preprints202105.0480.v1

 2 of 25

 However, CPT has some disadvantages that make its effectiveness less than expected, as
 the case of the pH-dependency and the poor water solubility.
 CPT at physiologic pH is hydrolysed and the molecule is partially converted into the
 carboxylate form, where the ring is opened and, thus biologically inactive. The lactone
 active form is present in the biological fluids at a very low concentration. It is described
 that after 2 h in contact with human blood, only 5% of the CPT lactone form remains [3],
 which makes its effectiveness against cancer impossible. In addition, in the human
 plasma, the carboxylate form is the most abundant microspecie, which has great affinity
 to the human serum albumin (HSA). Once CPT and HSA are bound, it is no longer
 possible to convert the molecule into its lactone form [4]. However, the stability of CPT
 can be improved once the molecule bounds to membranes, which avoids its hydrolysis
 [5]. Thus, it is very important to understand the interaction of CPT when in contact with
 cellular membranes, proteins or biological fluids to predict its behaviour for further in
 vitro and in vivo studies.
 The pharmacokinetic (PK) parameters of a drug is dependent on its freely or bound form
 present in the biological fluids, as well as, the therapeutic efficacy is tightly related to the
 affinity to plasma proteins [6]. However, drug design goes beyond drug-protein
 interactions. The membrane location and orientation, and the membrane affinity and
 distribution dictated by the partition coefficient (Log P) and distribution coefficient (Log
 D) of a drug are parameters used to predict the transport, distribution, accumulation and
 the therapeutic effects of compounds in vivo [7]. Thus, the determination of the drug
 ADMET profile (absorption, distribution, metabolism, elimination and toxicity) through
 the study of molecular interactions play a key role on the drug PK [8,9]. Model membranes
 constituted by 1,2-dioleoyl-sn-glycero-3-phosphatidyl-choline (DOPC), 1,2-dioleoyl-sn-
 glycero-3-phospho-L-serine (DOPS), 1,2-di-oleoyl-sn-glycero-3-phosphoethanolamine
 (DOPE), sphingomyelin (SM) or cholesterol (CHOL) are widely used lipids to mimic the
 performance of biological membranes in vitro since they represent some of the main lipid
 components of the biological membranes [10]. Additionally, while using computational
 in silico models, it is possible to determine these PK key factors and evaluate if a molecule
 is worth to progress for in vitro and/or in vivo studies [11,12].
 The interaction of CPT with membrane models and with plasma proteins has already been
 addressed in previously reported studies [13-15]. However, the reports in literature are
 sparse, use few techniques and do not provide a comprehensive overview of the
 molecular interactions established between the drug and biological interfaces throughout
 its physiological path. In the literature it is possible to find a few studies of binding of CPT
 to membranes of DMPC, DMPG, DOPC or DOPG and CPT binding to HSA or bovine
 serum albumin (BSA) [16-18]. The purpose of this research is to give a more complete
 overview of the interactions between CPT and biointerfaces after a putative oral
 administration of this drug and simultaneously provide researchers with an example of
 in vitro profiling of a known drug, used as model, that can be applied to predict/explain
 some aspects of the biological behaviour of other drugs in vivo. Therefore, the current
 study is intended to go further than the reported CPT/membrane interaction studies by
 evaluating the distribution of CPT in more complex membrane models mimetic of cancer
 or normal cells and endothelial membranes of the blood brain barrier (BBB). These
 different membrane models will permit using more accurate in vitro membrane
 distribution values to be used together with theoretical models and predict drug
 distribution at therapeutic targets as well as at off-target sites. Moreover, this study also
 focuses on the biophysical aspects of the interaction of CPT with membrane models,
 which to our knowledge have not been addressed, such as the location/orientation of CPT
 within the membrane, CPT effect on the membrane fluidity and the effect of the drug on
 the membrane structure and phospholipid packing at different lipid phases. To achieve
 the aims proposed a detailed study of the CPT physicochemical properties was conducted
 and several biophysical techniques were employed, such as dynamic light scattering
 (DLS), derivative UV-Vis spectroscopy, fluorescence spectroscopy, intrinsic and extrinsic
Preprints (www.preprints.org) | NOT PEER-REVIEWED | Posted: 20 May 2021 doi:10.20944/preprints202105.0480.v1

 3 of 25

 fluorescence quenching or synchrotron small and wide-angle X-ray scattering (SAXS and
 WAXS).
 Since CPT is used as a model drug, the results obtained can help to understand what the
 drug's possible responses will be when after administration it is exposed to different
 biointerfaces. This approach allowed to accurately predict some challenges of CPT
 biodistribution and to purpose drug delivery strategies to overcome these challenges.
 Therefore, the results here presented can be used by researchers as an example of an in
 vitro profile to predict the behaviour of drugs in vivo, at early stages of formulation
 developing avoiding the unnecessary use of cells and/or animals in agreement with the
 EU principles (Directive 2010/63/EU).

 2. Materials and Methods
 2.1. Materials
 Camptothecin (CPT) was acquired from Hangzhou ROYAL Import & Export Co., Ltd. The
 lipids 1,2-dioleoyl-sn-glycero-3-phosphocholine (DOPC), 1,2-dioleoyl-sn-glycero-3-
 phospho-L-serine (DOPS), 1,2-di-oleoyl-sn-glycero-3-phosphoethanolamine (DOPE),
 Cardiolipin (CL), the lipid labelled probe 1,2-dipalmitoyl-sn-glycero-3-
 phosphoethanolamine-N-(7-nitro-2-1,3-benzoxadiazol-4-yl) (NBD-PE) and the brain
 polar lipids (BPL) were obtained from Avanti Polar Lipids, Inc. (Instruchemie, Delfzijl,
 The Netherlands). Egg Phosphatidylcholine (EPC), Sphingomyelin (SM) and cholesterol
 (CHOL) were purchased to Sigma-Aldrich Química, S.L. (Sintra, Portugal). All reagents
 were the highest purity available and were used without further purification. Membrane
 models of cancer cells were prepared in acetate buffer (pH 5.8) and membrane models of
 normal cells were prepared in HEPES buffer (pH 7.4). All other solutions were prepared
 with water from a Milli-Q plus system with specific conductivity less than 0.1 µS cm −1.

 2.2. In silico predictors of drug-profiling
 Relevant drug physical-chemical properties (e.g., number of hydrogen bonds, polar (PSA)
 and van der Waals (VWSA) surface area, solubility, LogD and LogP, and ionization) were
 calculated using in the module MarvinSketch® from Chemaxon® software. From these
 physicochemical properties and based on reported molecular descriptors, a drug-
 profiling was established to give insights about formulation design challenges for CPT
 delivery [19].

 2.3. Membrane models preparation
 Single-lipid liposomal membrane models composed of DMPC, or lipid mixture liposomal
 membrane models mimetic of breast cancer cell membrane - DOPC (25%), CHOL (15%),
 EPC (31.8%), DOPS (17%), DOPE (8%), Cardiolipin (2.5%) and SM (0.7%) – mimetic of cell
 membrane – DOPC (45%), DOPE (20%), DOPS (20%), CHOL (10%) and SM (10%) – and,
 blood brain barrier (BBB) membrane constituted by the BPL – phosphocholine (PC)
 (12.6%), phosphatidyl ethanolamine (PE) (33.1%), PI (4.1%), phosphatidyl serine (PS)
 (18.5%) and PA (0.8%) were prepared by the classical thin film hydration method [20].
 Briefly, lipids were co-dissolved in chloroform:methanol (8:2, v/v) and the solvents were
 evaporated under a stream of nitrogen in a rotary evaporator (Buchi R-200; Sigma-Aldrich
 Corp., Buchs, Switzerland). The resultant dried lipid film was hydrated with buffer at
 temperature of 40 ± 0.1 °C and lipid colloidal dispersions were formed by alternating
 vortex and thermostatic bath (40 ± 0.1 °C). Subsequently, unilamellar lipid model systems
 were obtained from extruding (Lipex® extruder, Tranferra Nanosciences, Burnaby,
 Canada) colloidal dispersions through polycarbonate filters with a pore diameter of 100
 nm (Millipore SAS, France).
Preprints (www.preprints.org) | NOT PEER-REVIEWED | Posted: 20 May 2021 doi:10.20944/preprints202105.0480.v1 4 of 25 For the location studies, NBD-PE labelled lipid model systems were used, prepared by the lipid film hydration method above described followed by extrusion. In the lipid film preparation process, the probe was co-dried with the lipid in a ratio of 300:1 (lipid:probe) to prevent changes in the structure of the membrane [21]. 2.4. Drug distribution coefficient in membrane/aqueous systems studied by derivative spectroscopy The distribution coefficient (LogD) of CPT between membrane and aqueous buffered solution (pH 5.8 for breast cancer cell membrane model and pH 7.4 for cell membrane model and BBB membrane model) was determined by fluorescence spectroscopy and derivative UV/Vis spectroscopy. For each model, two groups of suspensions were prepared: the samples and references. The samples contained a fixed concentration of CPT (2×10⁻⁵M) and increasing concentrations of lipid suspension (0 to 1×10⁻³ M for absorbance or 3×10⁻³ M for fluorescence). The references were identically prepared in absence of CPT. Then, all the suspensions were incubated during 30 minutes at 37.0 ± 0.1 °C. After incubation, the absorption spectra of samples and references were plotted in the 230-500 nm range, on a Perkin-Elmer Lambda 45 UV-Vis, accordingly to a well-established protocol [22] at 37.0 ± 0.1 °C. The fluorescence spectra were also measured on a Perkin- Elmer LS-50B spectrofluorimeter. The emission spectra were obtained in 380-480 nm range with λexcitation=250 nm and the excitation spectra were recorded in 220-400 nm range with λemission=430 nm. The excitation and emission slits were adjusted to 6 nm. The second and third derivative spectra of the absorbance UV-Vis spectra was determined to improve the resolution of spectral bands and to eliminate the spectral interferences due to light scattered by the lipid suspensions and. Representing the λmax or λmin values of the 1st, 2nd or 3rd derivative spectra as a function of the concentration of lipid model systems ([Membrane]) a non-linear regression was obtained from which it was possible to determine the distribution coefficient (D): d nS m d nS a D Membrane V m d n ST d n S a d d n n (1) d n d n 1 D Membrane V m where ST, Sa and Sm stands respectively for total (T) absorbance of the drug in membrane (m) and aqueous media (a). The membrane model systems’ concentration, [Membrane] expressed in mol·L-1, is multiplied by the lipid molar volume in L·mol-1 (Vm) of each membrane model to obtain a dimensionless value of D, from which logD is calculated. Because CPT is a fluorescent compound with spectral variations due to its distribution between the lipid/aqueous phases (e.g., λ shifts), logD of CPT can also be calculated using fluorescence spectroscopy [23]. The fluorescence emission intensity, I, can be used to calculate the distribution D, and the correspondent logD, through Equation 2: IT I a I m I a D Membrane V m (2) 1 D Membrane V m where the fluorescence emission intensity (IT) of CPT distributed in lipid accounts for the fluorescence emission intensity contributions of the drug distributed in the membrane (Im) and aqueous (Ia) phases which can be related to D and then logD values [23]. 2.5. Drug location in membrane/aqueous systems studied by steady-state fluorescence quenching Cancer cell membrane model was labelled with NBD-PE probe. The fluorescence of the fluorophore was monitored by steady-state fluorescence studies to predict CPT location at membrane level. Increasing concentrations of CPT (0 – 4.0×10⁻⁵ M) and a fixed
Preprints (www.preprints.org) | NOT PEER-REVIEWED | Posted: 20 May 2021 doi:10.20944/preprints202105.0480.v1 5 of 25 concentration of the labelled cancer membrane model system (3.0×10⁻² M) were used. Steady-State fluorescence emission (Perkin-Elmer LS-50B spectrofluorimeter) was obtained using λexcitation= 360 nm (maximum excitation of CPT). Fluorescence excitation (300-400 nm) and emission spectra (500-600 nm) were recorded using slits of 9 and an integration time of 10 s was used. The extent of fluorescence quenching induced by CPT in NBD-PE probe was evaluated by Stern-Volmer constant (KSV) obtained by fitting data to the Stern-Volmer linear plots: I0 1 K SV CPT m (3) I where I and I0 are the steady-state fluorescence, respectively, in the presence or in the absence of CPT. [CPT]m is the membrane concentration of CPT calculated as described elsewhere [24]: K d CPT T CPT (4) m K d V m 1 V m where Kd is the distribution coefficient of CPT in the membrane model system (calculated as described in equation 1), [CPT]T is the total concentration of CPT and Vm is the membrane volume fraction. The efficacy of CPT to quench the fluorescence of the probe was evaluated by the bimolecular constant (Kq) [25]: K SV Kq (5) 0 All fluorescence intensity data were corrected from absorption and inner filter effect [25]. 2.6. Plasma protein binding evaluation using steady-state fluorescence quenching: The fluorescence excitation and emission spectra of increasing CPT concentrations (0 to 3 ×10⁻⁴ M) with a constant HSA concentration (2.0×10⁻⁶ M) were acquired at 37.0 ± 0.1 °C (Perkin-Elmer LS-50B), with excitation at 280 nm and emission at 342 nm, each with 5 nm slits. The following binding isotherm equation can be used to explain the quenching of HSA fluorescence caused by increasing CPT concentrations [26]: y máx n % Quenching (6) K 1 diss CPT where ymax is the maximum fluorescence quenching reported, n is the number of binding sites of HSA to CPT and Kdiss is the dissociation constant (i.e., the inverse of binding constant, Kbind). In addition, the following equation expresses the relationship between the Kdiss value and the Gibbs free energy (∆G) of complex binding: G bind R T ln(K bind ) (7)
Preprints (www.preprints.org) | NOT PEER-REVIEWED | Posted: 20 May 2021 doi:10.20944/preprints202105.0480.v1 6 of 25 where R is the ideal gas constant and T is the temperature in Kelvin (K). 2.7. Small- and wide-angle X-ray scattering studies at the Synchrotron: Membrane model systems (DMPC) in the presence or absence of CPT were put into 1.5 mm diameter X-ray clear glass capillaries for X-ray scattering studies (Hilgenberg, Malsfeld, Germany). Capillaries were sealed with a flame and kept at 4 °C. SAXS and WAXS experiments were carried out at the Austrian SAXS/WAXS beamline at the synchrotron light source ELETTRA (Trieste, Italy), using monochromatic synchrotron radiation with a wavelength of 1.54 nm and an X-ray energy of 8 keV. SAXS and WAXS patterns were captured at locations that covered the normal diffraction spacing spectrum (s = 2 sin / , where is the wavelength and 2 is the scattering angle) of interest using a 2D Pilatus3 1M and a 2D Pilatus 100K detector device, respectively, with a pixel size of 172 µm. The lamellar peaks of silver behenate (SAXS) and p-bromo benzoic acid (WAXS) were used as criteria to calibrate the diffraction spacings. Static exposures were taken below and above the main transition temperature as controlled by a thermostated water bath (stability ± 0.1 °C; Unistat CC, Huber, Offenburg, Germany) to obtain the diffraction patterns of normal lipid phases ( ’, ripple phase and ) and the effect of CPT in those phases. The data was analyzed in the same way as it had been in previous studies [27]. The data was analyzed in the same way as it had been in previous studies [27]. 2.8. Studies on Dynamic and Electrophoretic Light Scattering Dynamic Light Scattering (DLS) was used to assess the influence of CPT addition in the main phase transition temperature and cooperativity (B) of the DMPC membrane model system [27,28]. As a result, the light scattered (Mean Count Rate, MCR) by membrane system (5.0×10⁻² M) in the absence and presence of CPT (2.0×10⁻² M) was measured as a function of temperature (T) between 30 and 55 °C (with 1°C intervals and 2 min of equilibration time). A sigmoidal function based on a modified Boltzmann equation was used to fit the results [27,28]: b2 b1 m2 T m1 T MCR b1 m1 T (8) B 1 1 T Tm 1 10 where m1 and m2 are the slopes obtained by fitting the data linearly before and after Tm, respectively, and b1 and b2 are the corresponding y-intercepts. All DLS and ELS experiments were carried out in a Zetasizer Nano ZS with disposable polystyrene cells and a dipcell (ZEN1002) for the ELS studies. 2.9. Modelling biodistribution using in vitro parameters The logD value obtained can be used with in silico descriptors to predict many biodistribution parameters using mathematical methods. As a result, the value of logD was used to predict CPT bioaccumulation (as expressed by the bioaccumulation constant, Kbioaccumulation), which is associated to tissue blood flow (Q) and its volume (V) [29]: Q K bioaccumulation (9) V log D To determine if the drug is stored in adipose tissue, the adipose store index (ASI) of CPT was calculated using the following equation [30]: ASI 1.81 log D log D 0.40 (10)
Preprints (www.preprints.org) | NOT PEER-REVIEWED | Posted: 20 May 2021 doi:10.20944/preprints202105.0480.v1 7 of 25 Furthermore, the obtained distribution coefficient in the BPL model system – logD(BBB) – can be compared to logBB, according to Waterbeem and Kansy [31]. The logarithm of the ratio of drug concentrations in brain and blood is known as logBB, and it represents the drug's relative affinity variations between plasma proteins and brain tissue [32]: log BB 0.388 log DBBB 0.00618 V m 1.359 (11) where is the membrane model system's molar volume, determined from the individual lipid volumes [26,27]. The Steady-State Volume Distribution (VDSS) is one of the most useful pharmacokinetic criteria for describing a drug's biodistribution [33]. The effect of the PPB, permeability, partitioning, and active transport on the drug's physiological distribution is translated by this predictor. Based on human clinical pharmacokinetic evidence of a wide set of drugs (670 drugs), the first physiological statistical model of VDSS for predicting the biodistribution of neutral and basic drugs was proposed [34]: V E V f VDSS V P 1 R E fu V P R E R u (12) L VP L f ut where VP and VE are the plasma and extracellular fluid volumes with corresponding value in human of 0.0436 and 0.0151 L·Kg-1; RE/I represents the ratio of extravascular and intravascular proteins, and is strictly referred to the distribution of albumin, assuming an approximate value of 1.4; VR is defined as the physical volume into which the drug distributes minus the extracellular space (0.380 L·Kg-1); fu and fut are, respectively, the unbound drug fraction in plasma and the unbound fraction in tissues [34]. The fu values can be obtained by the following equation [35]: PPB fu 1 (13) 100 where PPB is the percentage of PPB and can be obtained from the in vitro values of Kbind [35]: 100 PPB (14) 1 1 C P K bind where CP is the physiological plasma protein concentration (750 µM) [35]. Lastly, fut can be obtained by the following equation [34]: log f ut 0.0289 0.1739 log D 0.8324 f i (7.4 ) 1.0400 log f u (15) where fi(7.4) is the fraction of ionized drug at pH 7.4 which has been calculated considering the pH hydrolysis and conversion of CPT from lactone neutral form to the anionic form carboxylate reported [36]. 2.10. Statistical analysis of data All data were expressed as mean ± standard deviation of 3 independent experiments. Multiple comparisons were performed using a two-way variance analysis (ANOVA) with
Preprints (www.preprints.org) | NOT PEER-REVIEWED | Posted: 20 May 2021 doi:10.20944/preprints202105.0480.v1

 8 of 25

 a Sidak’s multiple comparisons test or one-way ANOVA with the Student–Newman–
 Keuls as a post-test. Values of * P 5, and H acceptors > 10 [37]. Since CPT does not follow any
 parameters of the Lipinski rule, it is thus expected to have good permeability. Moreover,
 CPT demonstrated to have low polarizability (PSA = 79.73 Å2), which is correlated with a
 good permeability profile at the cell membranes [38]. However, when its lipophilicity is
 observed, we can conclude that CPT is moderate lipophilic (0 < logP < 3) [39] and presents
 poor aqueous solubility (0.0559 mg·mL-1). These factors, despite not being contemplated
 by the Lipinski rule, do not facilitate the permeability of the compound, which is in
 agreement with other published work [40]. Also, the permeability of a compound can be
 related with the concentration used. Indeed, CPT permeability is dependent of the
 concentration, being more permeable at lower concentrations (5 µM) and, even so, its
 Papp is relatively low (3×10⁻⁵ cm·s-1) [40]. Moreover, from the in silico evaluation of the
 physicochemical properties of a molecule it is not possible to predict if the molecule will
 suffer hydrolysis, as in the case of CPT. Since CPT is pH-dependent and not stable at
 neutral pH, it can easily suffer hydrolysis and, at physiologic pH, be converted in the
 carboxylate form, which is more aqueous soluble, less permeable and it is not biological
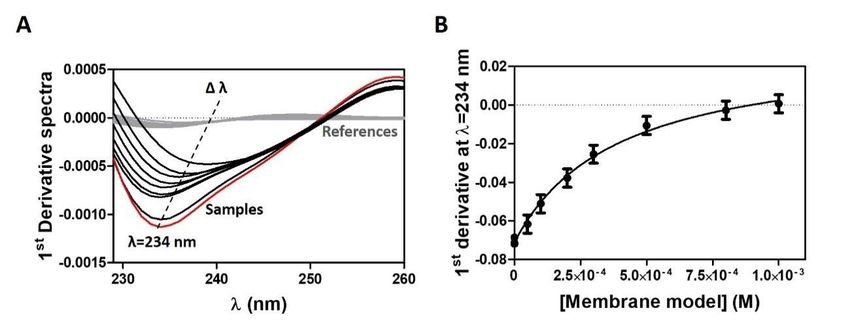
Preprints (www.preprints.org) | NOT PEER-REVIEWED | Posted: 20 May 2021 doi:10.20944/preprints202105.0480.v1

 9 of 25

 active to bind the topoisomerase I. None of these aspects could be predicted only from the
 in silico evaluation of CPT. Indeed, if we would only rely on in silico calculations CPT
 would be classified by the BCS as Class II. However, as previously described, this
 prediction does not take into consideration the stability of the molecule and the pH-
 dependency, thus, the BCS classification of CPT should be the one officially adopted, that
 is, a class IV compound [41].
 Regarding the CPT ionization character, the obtained in silico pKa values (Table 1) are
 similar to the pKa values found for CPT analogues (pKa = 2.32 and 9.15) [42,43].
 From the analysis made for CPT it is possible to conclude that using only in silico
 approaches is not always a straightforward or reliable method to predict biodistribution.
 Recent developments in biodistribution prediction and PK profiling recommend the use
 of in vitro approaches, complemented by in silico analysis and models, to predict tissue
 distribution using physicochemical properties [34,44-46]. Therefore, it is important to
 evaluate other parameters, like the interaction with biological membranes, in order to
 predict the molecule behaviour in the biological fluids. These predictions can be further
 improved by considering in vitro data and binding of drugs to plasma proteins [34,44-46].
 Therefore, in the following sections in vitro studies of the interactions of CPT with models
 of biointerfaces will be conjugated with in silico properties and theoretical models to
 evaluate CPT biodistribution. This approach may be very helpful when formulating new
 oral delivery dosage forms of CPT, aiming to understand how to maintain drug’s stability
 and biological function, at the same time improving its aqueous solubility and mucus
 diffusion.

 3.2. Distribution and location of CPT in a membrane/aqueous system
 The distribution coefficient (logD) between lipid and aqueous phases, which allows
 estimation of drug lipophilicity and distribution in hydrophobic and hydrophilic
 microenvironments, is the first physicochemical property that provides strong evidence
 to support drug distribution in body tissues [47].
 Accordingly, the logD of CPT was determined in cancer cell membrane models, cell
 membrane models, and BBB membrane models in order to simulate the various
 membrane barriers encountered by this drug during its biological distribution. The study
 in cancer cell membrane models was carried out at a pH of 5.8 to mimic the acidic
 microenvironment of tumours (pH 5.6 to 6.8), which is a hallmark of malignant cancer
 cells and is caused by glycolysis in cancer cells, hypoxia, and insufficient blood perfusion
 [48]. The studies in cell membrane models were carried out at pH 7.4 representative of
 blood and healthy tissues. Figure 2 shows an example of absorbance spectra and the
 subsequent derivative method for data analysis.

 Figure 2. (A) First derivative of CPT (2x10⁻⁵) absorption spectra with increasing concentrations of
 cancer membrane models (0 to 1.0 x10 -3 M) in Acetate buffer pH = 5.8. In red is represented the
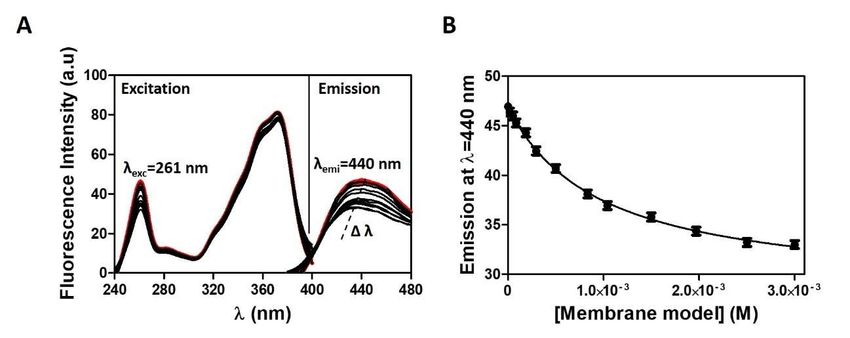
Preprints (www.preprints.org) | NOT PEER-REVIEWED | Posted: 20 May 2021 doi:10.20944/preprints202105.0480.v1

 10 of 25

 absorption spectra of CPT in the absence of the cancer membrane models. With the addition of
 increasing concentrations of membrane model (samples represented in black) there is a shift in λ
 values. In grey are represented the derivative spectra of the references containing only membrane
 models. (B) Nonlinear fitting of derivative absorbance values at λ = 234 nm as a function of
 membrane model concentration.

 The first derivative spectra were calculated from the CPT absorbance spectra
 experimentally obtained for increasing concentrations of the membrane model (Figure
 2A), as this eliminates the effect of Rayleigh dispersion, which is higher for shorter
 wavelengths [23]. The use of first derivative spectra eliminates light scattering interference
 and improves spectral resolution, revealing more details about the CPT–lipid interaction.
 Indeed, at the derivative minimum, a shift of λ (of about 25 nm) is visible, indicating CPT
 distribution into lower polarity environments (distribution of CPT into the lipid phase)
 [23], with a decrease in the intensity of the bands as the lipid concentration increases.
 There is also an isosbestic point observed, indicating the presence of a balance between
 two CPT forms (interacting with the lipid medium and free in aqueous buffered medium)
 and the elimination of light-scattering interference [23]. Data were plotted against the
 respective membrane model concentration (Figure 2B) using maximum or minimum
 values from derivative spectra (e.g., 234 nm), and the resulting data points were fitted to
 Equation (1) (Figure 2B).
 The determination of logD in membrane/aqueous phase by fluorescence methods is more
 advantageous over UV-Vis spectrophotometric methods, since the light scattering caused
 by the lipid media is negligible and was subtracted from each sample spectrum to cancel
 out any contribution (Figure 3A). With exception of the BBB membrane model, where the
 higher membrane scattering invalidated the use of fluorescence method, it was possible
 to plot the maximum emission values against the respective membrane model
 concentration (Figure 3B) without having to derive the spectra, and the resulting data
 points were fitted to Equation 2.

 Figure 3. (A) Fluorescence emission spectra of CPT (2x10⁻⁵) with increasing concentrations of cancer
 membrane models (0 to 3.0 x10⁻³ M) in Acetate buffer pH = 5.8. In red is represented the absorption
 spectra of CPT in the absence of the cancer membrane models. With the addition of increasing
 concentrations of membrane model (samples represented in black) there is a shift in λ values. (B)
 Correspondent nonlinear fitting (Equation 1) of fluorescence emission values at λmax = 440 nm as a
 function of membrane model concentration.

 D values were calculated based on both absorbance or fluorescence nonlinear fittings and
 used to express membrane distribution of CPT as log D values (Table 2).
Preprints (www.preprints.org) | NOT PEER-REVIEWED | Posted: 20 May 2021 doi:10.20944/preprints202105.0480.v1

 11 of 25

 Table 2. Distribution coefficients of CPT obtained in a biphasic membrane/aqueous system.
 Membrane
 pH Composition Method Log D
 Model
 DOPC (25%), CHOL Derivative UV–Vis
 Cancer cells (15%), EPC (31.8%), DOPS 3.14 ± 0.13ns
 spectroscopy
 membranes 5.8 (17%), DOPE (8%),
 Cardiolipin (2.5%), SM Fluorescence
 3.01 ± 0.31ns
 (0.7%) spectroscopy
 Derivative UV–Vis
 DOPC (45%), DOPE 2.78 ± 0.28ns
 spectroscopy
 (20%), DOPS (20%),
 Fluorescence
 CHOL (10%), SM (10%) 2.63 ± 0.15ns
 Normal cells spectroscopy
 membranes 7.4 DMPC or DMPG[16,49] 2.00 ± 0.16***
 Fluorescence
 DOPC[50] 1.55 ± 0.05***
 anisotropy
 DOPG[50] 1.97 ± 0.05***
 Fluorescence
 Octanol: water[18,50,51] 1.73 ± 0.08***
 spectroscopy
 BBB
 PC (12.6%), PE (33.1%), PI
 endothelial Derivative
 7.4 (4.1%), PS (18.5%) and PA 3.64 ± 0.15***
 membrane spectroscopy
 (0.8%)

 ns: Comparisons between derivative UV-Vis spectroscopy and fluorescence spectroscopy or between
 cancer cell and normal cells model used in this work were performed using two-way ANOVA with
 the Sidak’s multiple comparisons test and indicate no statistical significance.
 ***: Comparisons between BBB and normal cells model used in this work or between normal cells
 model used in this work and normal cells model reported in the literature were performed using
 one-way ANOVA and indicate statistical significance (p
Preprints (www.preprints.org) | NOT PEER-REVIEWED | Posted: 20 May 2021 doi:10.20944/preprints202105.0480.v1

 12 of 25

 accumulation index (equation 11), that accounts for the distribution of the CPT in the brain
 tissues, was calculated, using the logD values in BBB endothelial membrane, to be
 LogBB=2.76 ± 0.06, which suggests potential BBB permeability [54].
 The lipophilicity of drugs is typically expressed as a partition of the drug in the
 octanol/water system, and the reported logP value (value of drug distribution at a pH
 value where the drug is in its neutral form) of CPT in the octanol/water system was 1.73
 ± 0.08 [18,50,51] (Table 2), whereas the in silico calculated logD (at pH 7.4 or 5.8) and logP
 values in the octanol/water system using Chemaxon® software was 1.52 (Table 1), i.e.
 significantly lower than the distribution logD values determined in vitro in the
 membrane/aqueous system (Table 2).
 The fact that octanol does not mimic the amphiphilic nature of membranes is a significant
 disadvantage of theoretical models based on octanol/water biphasic systems. [47,55,56].
 Contrastingly, because they mimic the hydrophobic core and polar surface of
 biomembranes, lipid/water systems have been developed as improved cell membrane
 models and are used to represent drug distribution in biological media. [57].
 Hydrophobic, H-bonding, dipole-dipole, and electrostatic interactions between drug and
 membrane are considered using biomimetic membrane models, whereas the
 octanol/water system can only model nonpolar interactions [58,59]. Since interactions
 between the drug and the polar headgroups of membrane lipids are not considered when
 octanol is used, it is understandable that CPT partitioning in octanol/water systems
 yielded lower values than partitioning in membrane/water systems. The use of
 membrane/water systems rather than octanol/water systems is especially important for
 amphoteric compounds or highly ionized drugs that are charged at physiological pH, and
 it has been observed that, aside from non-ionic drugs, partitioning values in octanol/water
 systems do not correlate well with experimental values. [60,61].
 When the results for the different mimetic systems of normal membrane cells are
 compared, the CPT distribution between the membrane and the aqueous medium varies
 significantly depending on the lipid composition and biophysical properties (Table 2).
 Changes in average area per lipid affect lipid packing density, which is determined by the
 competition between lipid headgroup repulsion and hydrophobic attraction [10]. Because
 they have headgroups and tails with similar cross-sectional area, major membrane lipids
 containing PC and PS have a cylindrical shape. Due to its large headgroup, SM has an
 inverted-cone shape; thus, SM lipids preferentially adopt the non-lamellar arrangement
 [10]. Due to their small headgroups, PE, cardiolipin, and cholesterol have a cone shape
 and prefer inverted nonlamellar arrangements. Membrane lipids typically self-assemble
 and form thermodynamically stable aggregates. As a result, any changes in this balance
 are expected to have an impact on the optimal area per lipid (i.e., their packing) and
 membrane shape [10] Changes in lipid composition can affect the curvature and due to
 differences in molecular shapes and volumes of lipids can ultimately affect permeability
 of the membrane and alter the distribution of drug in membrane/aqueous systems [10].
 Therefore, it is acceptable that CPT presents higher distributions in membrane models
 containing non lamellar assemblies of lipids (e.g., DOPE, cardiolipin) that can confer more
 permeable non-lamellar regions [62] than less complex models of lamellar packing like
 DOPC or DMPC.
 Following the quantification of CPT distribution between the lipid and aqueous phases of
 the membrane model system, it is important to determine where the drug is most likely
 to be located within the lipid phase of the membrane. Since drug distribution was not
 significantly different in normal or cancer mimetic membrane models, we chose cancer
 mimetic membrane models to investigate drug location and assess if the drug is more
 superficially embedded in the phospholipid headgroups or more profoundly buried in
 the hydrophobic microenvironment of the phospholipid acyl chains. The CPT location in
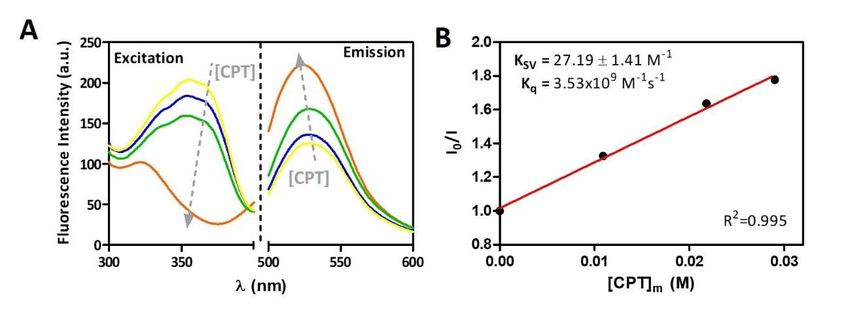
Preprints (www.preprints.org) | NOT PEER-REVIEWED | Posted: 20 May 2021 doi:10.20944/preprints202105.0480.v1

 13 of 25

 membrane was evaluated by measuring the steady-state fluorescence of the probe NBD-
 PE incorporated into cancer cell membrane models in the absence and presence of
 increasing concentrations of CPT. NBD-PE was used as a molecular ruler as previous
 reports have shown that contrary to other NBD based probes the fluorescent probe group
 does not project into the external aqueous phase [63] and it is well-known that NBD-PE
 locate at the membrane interface approximately between 19 and 20 Å from the centre of
 the bilayer [64]. CPT is a fluorescent compound that emits between 400 and 550 nm (λmax
 of 431 nm) when excited at 360 nm, whereas NBD-PE is a fluorescent probe that emits
 between 500 and 600 nm (λmax of 530 nm) when excited at 465 nm. Fluorescence
 resonance energy transfer (FRET) was used to infer CPT location because it occurs when
 donor molecules (CPT) emit at shorter wavelengths that overlap with the acceptor's
 absorption spectrum (NBD-PE) [65]. FRET is only sensitive for very short distances (1.5 to
 6 nm) between each donor/acceptor pair [65]. As a result of the occurrence of FRET, it was
 possible to conclude that the donor CPT was located close to the acceptor NBD
 chromophores, which ultimately suggests that CPT was inserted at the membrane and
 close to the membrane interface, similar to NBD-PE. Figure 4A demonstrates the presence
 of FRET between CPT and NBD-PE.

 Figure 4. (A) Fluorescence excitation spectra of CPT ([CPT]T of 0 to 4x10⁻⁵ M) added to cancer
 membrane models (3.0×10⁻² M) labelled with NBD-PE probe and correspondent emission spectra of
 the probe (λ exc=360 nm). (B) Stern-volmer plot of fluorescence quenching as a function of
 membrane concentrations of CPT calculated according to equation 6.

 The excitation wavelength was set to 360 nm, which is the maximum excitation
 wavelength for CPT. The fluorescence excitation of the donor (CPT) is decreasing in the
 spectra presented, and the emission intensity of the acceptor (NBD-PE) is increasing,
 indicating that an energy transfer is occurring from CPT to NBD-PE (Figure 4A). This
 means that when CPT is excited, the fluorescence emitted by CPT can excite the NBD-PE
 probe, which acts as the acceptor emitting fluorescence. The transfer efficiency can be
 determined by steady-state measurements of the extent of donor quenching due to the
 acceptor [26]. The extent of donor fluorescence quenching can in turn be calculated using
 a Stern-Volmer plot (Figure 4B) according to equation 3. After determining the logD values
 of CPT in the membrane model, the effective concentrations of the drug in the membrane
 model system – [CPT]m – were calculated using equation 4. The Stern-Volmer linear plot
 (Figure 4B) can be used to calculate the Stern-Volmer constant (KSV = 27.19 ± 1.41 M-1) as
 well as the bimolecular quenching constant (Kq = 3.53x10⁹ M-1s-1) which reflects quenching
 efficiency or fluorophore accessibility to the quencher (equation 5). The obtained Kq value,
 is close to the reported diffusion-controlled quenching in lipid membranes, which
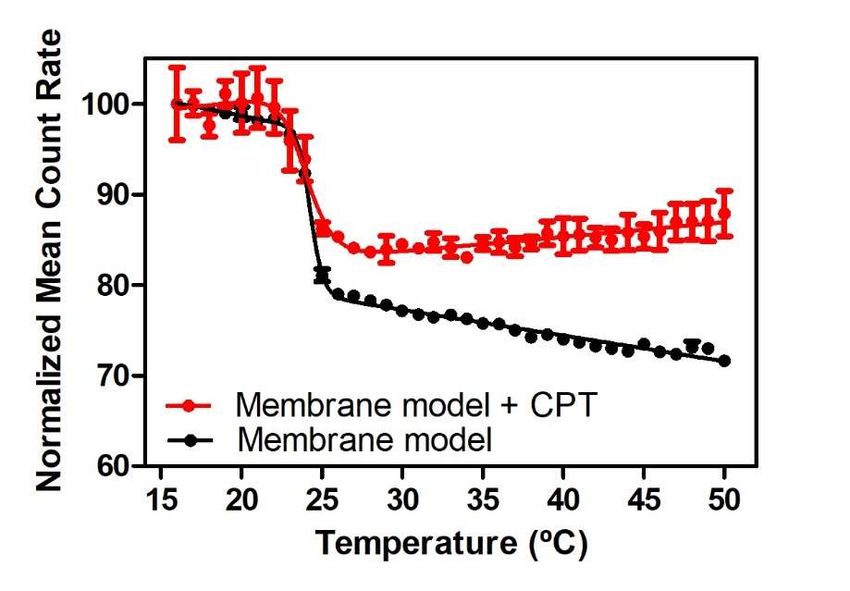
Preprints (www.preprints.org) | NOT PEER-REVIEWED | Posted: 20 May 2021 doi:10.20944/preprints202105.0480.v1 14 of 25 typically results in values of Kq near 1.1 x 10⁹ M–1s–1 [26]. This also confirms that CPT is inserted at the membrane and close to the membrane interface. 3.3. The CPT effect on membrane biophysical properties Aside from investigating how CPT distributes inside a membrane model, it is also critical to investigate how this drug may influence the biophysical integrity of such models. Changes in parameters like membrane fluidity and phospholipid order and/or packing play a key role in the conservation of membrane dynamics, which serves the most essential cellular functions, and changes in these parameters caused by drugs may provide useful details on their therapeutic abilities and potential toxic effects at the membrane level [9,27]. Previous logD studies have focused on model systems comprising relevant lipid mixtures to mimic drug distribution in different cell membranes (Table 2). However, we chose a pure DMPC model for studying membrane biophysical properties since it adopts the fluid lamellar phase across a broad range of hydrations and temperatures and allows simulating both organized and disordered phases found in membrane domains. Model membranes like this, which are made up of a specific class of purified lipids, are often used in vitro to mimic the behaviour of biological membranes [66]. These simple membrane models are a robust and repeatable platform with physical properties close to those of most cells, allowing for clear and quantitative study of phenomena in a membrane setting [66]. While these models are simplified in comparison to the mimetic models used in distribution experiments, they are a viable alternative for in vitro characterization of CPT effects in both more ordered (gel phase, Lβ) and disordered (fluid phase, Lα) membrane phases. There are distinct ordered phases that can disperse light of varying intensities during the lipid phase transition [67]. As a result, within a temperature range and utilizing DLS, the average number of photons dispersed (mean count rate, MCR) by the lipid membrane system can be monitored [67]. This method of calculation yields a sigmoidal profile, as seen in Figure 5, which presents the results of MCR obtained with DMPC membrane model in the presence and absence of CPT fitted by equation 8. This equation can be used to calculate the parameters B and Tm, which describe the transition of lipid bilayers from the Lβ to the Lα phase. Figure 5. Normalized MCR of DMPC membrane models in absence () and in the presence of CPT () as a function of temperature. Each point corresponds to the mean value ± standard deviation of three experiments. Continuous lines are the best fits according to equation 8.
Preprints (www.preprints.org) | NOT PEER-REVIEWED | Posted: 20 May 2021 doi:10.20944/preprints202105.0480.v1

 15 of 25

 Tm of DMPC membrane models was determined to be 24.29 ± 0.05 °C in agreement with
 the transition temperature reported for this phospholipid membrane [68]. The transition
 between the gel and the fluid phase of DMPC presented a B of 670.4 ± 62.21 indicating a
 cooperative transition, as expected for the pure lipid system. The addition of CPT to the
 membrane mimetic system has little effect on Tm (24.06 ± 0.16 °C) meaning that does not
 provoke a membrane fluidization but does induce a significant decrease of B to 303.9 ±
 42.78 (P
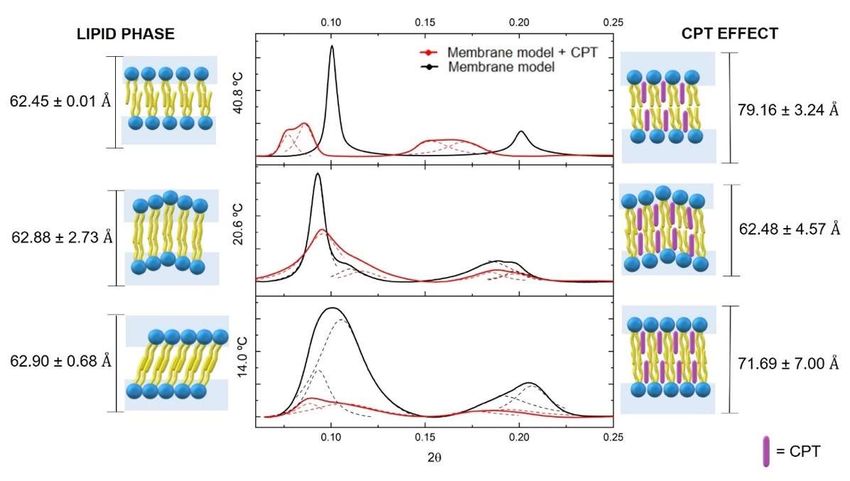
Preprints (www.preprints.org) | NOT PEER-REVIEWED | Posted: 20 May 2021 doi:10.20944/preprints202105.0480.v1

 16 of 25

 Fully hydrated DMPC bilayer alone is characterized at the Lβ’ phase by presenting a
 tilted bilayer with a ratio distance between Bragg peaks characteristic of lamellar packing
 (1:2:3). The Bragg peaks spacing was used to calculate a dL of 62.90 ± 0.68 Å and a
 correlation length of 547.00 ± 89.35 Å.
 When the drug was inserted into the bilayer, there was a significant decrease in
 correlation length (258.00 ± 42.02 Å) and an increase in dL (71.69 ± 7.00 Å). The membrane
 insertion of CPT into the bilayer at C1-C8 level was determined using location and
 transition temperature studies. Thus, the increase in bilayer thickness could be attributed
 to the proposed CPT location causing a change in the area requirement of the headgroups,
 allowing the chains to lose their tilt and be oriented upright. This stretched position of the
 acyl chains may account for some of the increase in dL values. Indeed, when the
 hydrocarbon chains of the fatty acids that comprise the phospholipids are rigidly packed,
 C-C bonds are in an all-trans conformation, allowing the hydrocarbon chains to be
 accommodated in a minimum volume. The hydrocarbon chains are organized in CH2
 groups with distances of 1.26 Å, while the distance between the C-C bonds in the terminal
 CH3 group is 1.46 Å, giving a chain length of 19.1 Å considering the 14 C atoms of myristic
 acid of DMPC. This length corresponds to hydrocarbon stretched chain, however at the
 Lβ’ phase fully hydrated DMPC have hydrocarbon chains that are tilted by approximately
 32.3° relative to the bilayer plane [70]. Given that the chains are tilted, the thickness of the
 bilayer will be 19.1 Å × cos (32.3°) = 16.1 Å, and the difference in thickness between the
 stretched and tilted hydrocarbon chains is given by 19.1 Å – 16.1 Å = 3.0 Å /monolayer, i.e.,
 6.0 Å /bilayer. This means that the loss of tilt caused by CPT insertion within the lipid
 membrane would result in a dL increase of 6.0 Å. However, the addition of CPT resulted
 in an 8.8 Å dL increase, indicating that, in addition to changing the lipid packing from
 pseudohexagonal (tilted) to hexagonal packing by loss of tilt angle, CPT may also induce
 an increase in the water layer, which will be confirmed later by WAXS measurements.
 At the Pβ phase, phospholipids in DMPC system in the absence of CPT also lost their
 tilt, however with the undulated ripple effect, two dL values are observed with an average
 value of 62.88 ± 2.73 Å and a correlation length of 855 ± 134.68 Å. The rippled undulated
 phase is maintained after CPT insertion, with an average dL value of 62.48 ± 4.57, which
 is similar to that found in the lipid membrane without the drug. The lack of changes in
 the dL values of this phase can be explained by the fact that the phospholipids in the ripple
 lipid phase are less tightly packed than in the gel phase, giving a planar drug like CPT a
 better chance of penetrating the bilayer without disrupting the hydrocarbon chains'
 characteristic packing. Nonetheless, despite maintaining the dL and lipid packing, the
 presence of CPT in the lipid bilayer can be identified by a significant decrease in the
 correlation length to 431.00 ± 36.72 Å, indicating a noticeable breakdown of the
 multilamellar correlation and indicating a disruption effect of this drug on the membrane
 structure.
 The phospholipids are less ordered in the Lα phase, and the relaxation of
 hydrocarbon chains promotes phospholipid separation. As a result, the incorporation of
 CPT is facilitated, and the dL (from 62.45 ± 0.01 Å to 79.16 ± 3.24 Å) and the correlation
 length (from 1549.00 ± 275.08 Å to 664.00 ± 263.68 Å) change significantly. At the fluid
 phase, the increase in the dL values cannot be justified by the packing change causing
 elongation of the hydrocarbon chain; thus, drug insertion is expected to cause an increase
 in the hydration layer rather than an increase in the bilayer thickness. Furthermore, the
 drug causes a significant decrease in correlation length during this phase as well. The
 overall effect of the drug decreasing correlation length observed in all lipid phases
 indicates a disrupting effect in the global molecular organization of the multilayer stack
 of lipid bilayer.
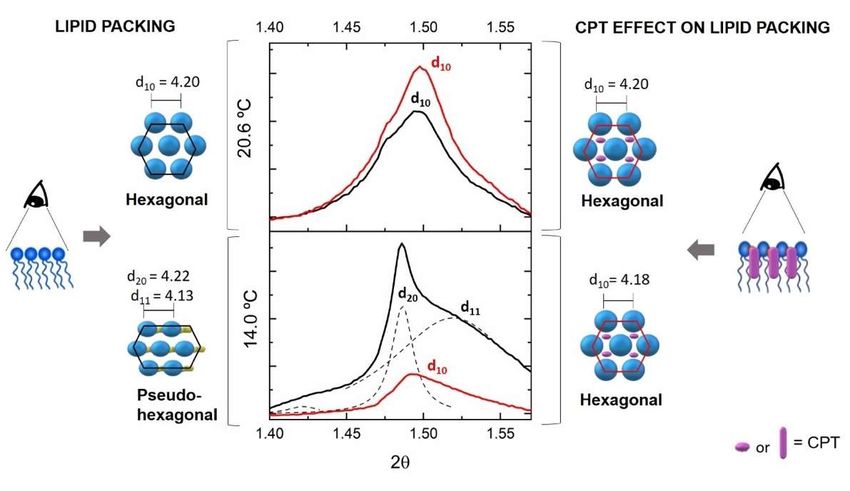
Preprints (www.preprints.org) | NOT PEER-REVIEWED | Posted: 20 May 2021 doi:10.20944/preprints202105.0480.v1

 17 of 25

 Figure 7. Wide angle X-ray diffraction (WAXS) patterns of DMPC (black) or DMPC containing CPT
 (red) measured in the Lβ′ (14.0 °C) and Pβ (20.6 °C) phases of DMPC. Solid lines give the best fit of
 the Lorentzian’ s analysis model (dashed lines) to the scattered intensities. A model of drug–
 membrane interaction is proposed for each diffractogram together with the resultant ds values.

 The WAXS pattern is shown in Figure 7 only for the Lβ’ and Pβ phases, because the
 freedom degree of the headgroups is so high at the Lα phase that WAXS produces overly
 broad diffractograms and there are no defined ds for this phase. The WAXS pattern of
 DMPC without drug in the Lβ’, exhibits the characteristic double Bragg peak correspond
 to two ds values (d20 = 4.22 Å and d11 = 4.13 Å) caused by tilted phospholipids packed in
 a pseudohexagonal chain lattice. The addition of CPT results in a single Bragg peak, which
 confirms the loss of tilt effect observed by SAXS studies resulting in a change in the lipid
 packing to a hexagonal chain lattice, as well as a non-significant decrease of ds (d10 = 4.18
 Å).
 As observed in SAXS, the incorporation of CPT in the DMPC Pβ phase is facilitated and
 did not change the lattice parameters of the DMPC headgroups, yielding a ds value of 4.20
 Å in both the presence and absence of CPT.
 Overall, these findings suggest that CPT influences the biophysical properties of lipid
 membranes, particularly in the more ordered domains mimicked by the Lβ’ phase. Drug
 incorporation within the membrane phospholipids of these ordered phases causes loss of
 tilt angle, changes in lipid packing from pseudohexagonal to hexagonal lattice, and
 increased hydration of the headgroup region. Given that cell membrane ordered domains
 and lipid packing are critical for the functioning of several integrated proteins and
 receptors, these biophysical effects of CPT may imply membrane impairment and cell
 toxicity [9]. This fact justifies the need to encapsulate CPT in nanocarrier systems to avoid
 membrane impairment caused by free drug distribution. Indeed, our previous research
 showed that incorporating CPT into a nanocarrier system like SLN could preserve the
 membrane's chain packing parameters [71].

 3.3. Plasma Protein binding of CPT and prediction of biodistribution parameters
 CPT biodistribution is highly dependent not only on its interaction with cell membranes,
 but also on its freely and bound forms present in systemic circulation. In this regard,
 serum proteins such as HSA function as vehicles for transporting endogenous
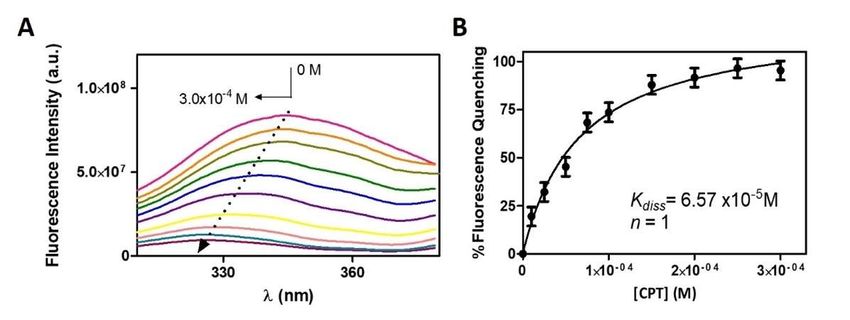
Preprints (www.preprints.org) | NOT PEER-REVIEWED | Posted: 20 May 2021 doi:10.20944/preprints202105.0480.v1

 18 of 25

 compounds, thereby limiting the unbound fraction available for subsequent tissue
 distribution. As a result, studying drug affinity to HSA is also important for
 understanding its biodistribution and overall pharmacokinetic behaviour.
 The fluorescence of HSA is mainly due to the presence of two intrinsic fluorophores,
 tryptophan and tyrosine residues, and changes in HSA fluorescence are associated with
 its interaction or binding to a variety of quenchers. Monitoring HSA fluorescence in the
 absence and in the presence of a drug is a common method for determining the drug’s
 affinity for this plasmatic protein.
 The fluorescence emission spectra of HSA solutions in the presence of increased amounts
 of CPT are shown in Figure 8.

 Figure 8. (A) Fluorescence spectra of HSA (2.0×10⁻⁶ M) in the presence of increasing CPT
 concentrations (0 to 3.0×10⁻⁴ M) at 37 °C. (B) Binding isotherm plot of CPT-HSA. The non-linear fit
 to the experimental data was made using equation 7 and allowed to determine the dissociation
 constant (Kdiss) and the number of binding sites (n).

 As the CPT concentration increased, there was a clear decrease in the intensity of the HSA
 fluorescence emission (fluorescence quenching). A shift in the maximum emission band
 to shorter wavelengths is also visible as a result of the fluorescence quenching. Both
 observations point to a strong interaction between CPT and HSA, with the possibility of
 a complex formation. Emission spectral shifts can be interpreted as a change in the
 surrounding hydrophobicity of the chromophore because fluorescence emission is highly
 dependent on the local microenvironment. Typically, hypsochromic shifts (or blue shifts)
 are associated with decreased polarity, indicating that HSA complexation with CPT has
 resulted in the formation of a hydrophobic environment around the tryptophan and
 tyrosine residues.
 Similar observations were noticed by Yang et al. when they studied the binding of CPT to
 bovine serum albumin (BSA). In the same study the authors collected information
 provided by several methodologies about the drug-membrane binding and concluded
 that the formation of the CPT-BSA complex occurs mainly through electrostatic
 interactions and hydrogen bonds. To the fluorescence quenching data, a non-linear fitting
 was applied (equation 6) from which it was possible to determine that CPT binds to a
 single HSA site (n=1) with a binding constant (Kbind=1.52 ± 0.26 × 10⁴ M-1) and a negative
 value of Gibbs free energy (ΔGbind=-5.93 ± 0.10 kcal·mol-1) suggesting that drug and serum
 protein associate spontaneously (equation 7). The HSA–CPT binding constant falls within
 the range of previously published binding constants of CPT in carboxylate or lactone form
 for the interaction of HSA with CPT (5.5 × 10³ to 1.2 × 10⁶ M-1) [13] and is also close to the
 binding constant reported by Li et al. for the interaction of CPT with BSA (Kbind=3.72 × 10⁴
 M-1) [17]. Based on Kbind values, a PPB of 91.95% (equation 14) was calculated indicating
 that the majority of CPT is bound to HSA, leaving only 8.05% of the free drug available
Preprints (www.preprints.org) | NOT PEER-REVIEWED | Posted: 20 May 2021 doi:10.20944/preprints202105.0480.v1

 19 of 25

 for distribution to the tissues. The magnitude of these values indicates that CPT and HSA
 have a strong interaction [26].
 Additional biodistribution parameters of CPT were also determined using the values of
 PPB to HSA and logD values (Table 2 normal cells) obtained. The unbound CPT fraction
 in plasma and tissues were respectively determined as fu=0.081 (equation 13) and fut=0.0054
 (equation 15). These parameters were used to obtain VDSS=5.75 ± 0.93 L·Kg-1 (equation 12).

 4. Discussion
 CPT is expected to communicate with a variety of biological interfaces immediately after
 oral administration, raising obstacles to its biodistribution [9,72]. Relying on in silico
 calculations like the Rule of 5 stated by Lipinski for orally administered drugs it would be
 possible to conclude that CPT presents favorable oral absorption [37]. Moreover, as the
 PSA value of CPT is less than 140 Å2 (PSACPT=79.73 Å2) the molecule accomplishes one of
 the prerequisites to be absorbed in GIT [38]. Still, following the BCS scheme of drug
 classification, CPT shows characteristically a poor aqueous solubility and permeability
 that commonly leads to a poor oral absorption. Additionally, along the GIT the drug will
 experience a pH gradient that will cause its hydrolysis originating an anionic carboxylate
 form. It is well described in the literature that non-ionized drugs are more readily
 absorbed along the GIT [29,73], thus the anionic form of the drug will reduce its membrane
 permeability consequently reducing its absorption. The contradictory results in the
 absorption potential of CPT highlight the fallibility of using solely in silico molecular
 calculations as tools to predict ADMET profile of drugs. ADMET modeling used for PK
 drug prediction relies heavily on the logP parameter estimated from theoretical
 distribution of drugs in octanol/water systems, along with charge/ionization. However, in
 the case of polar ionizable drugs, like CPT, a simple theoretical computational calculated
 logP in octanol/system would not represent the interactions that the drug can establish
 with polar membrane headgroups. We therefore propose that reliable modeling should
 not only be based on in silico computational predictions but should instead be combined
 with in vitro logD experimental determination studies in the membrane/water systems, as
 this model more closely represents the polar and non-polar membrane environment and
 better translates the binding established with polar drugs. Accordingly, CPT presented a
 logD value of 2.89 ± 0.23 concerning its distribution in membrane models mimetic of
 normal cells which is typical of moderate lipophilic molecules (0< logD < 3). The moderate
 lipophilic CPT profile can also lead to non-specific binding to mucin hydrophobic
 domains, potentially reducing its diffusion in GIT mucus [74]. Thus, its encapsulation into
 drug delivery systems (DDS) can be a good approach to improve CPT aqueous solubility,
 maintain the stability of the molecule across the GIT and, protect the drug from mucin
 interaction and improve the drug delivery after crossing the mucous layer. logD values
 are also important deciding the more adequate type of DDS has it has been found strong
 relations between drug lipophilicity and DDS hydrolipidic balance [75]. Based on the logD
 determined CPT is compatible with micelles and albumin nanoparticles.
 After considering GIT absorption it is important to consider other physiological barriers
 like plasma proteins. As the drug enters the systemic circulation, it may be exposed to
 plasma proteins, where their primary purpose is to transport exogenous molecules across
 the body. If the drug-plasma protein interaction is not balanced and reversible,
 biodistribution problems may be triggered due to the either too low or too high affinity of
 a drug to plasma proteins like HSA [76]. From the fluorescence quenching assay, a binding
 constant of 1.52 ± 0.26 × 10⁴ M-1 was determined which is indicative of a strong interaction
 between CPT and HSA [26]. Additionally, a PPB value was calculated as 91.95%, meaning
 that a major part of CPT in solution is bounded to HSA, leaving only 8.05% of free CPT
 available to be distributed into the tissues. When free CPT leaves systemic circulation,
 mutual associations with various biological interfaces continue to occur until CPT reaches
 the therapeutic target. The logD obtained in membrane model of normal cells, suggests
You can also read