Quantifying Parkinson's Disease Motor Severity Under Uncertainty Using MDS-UPDRS Videos
←
→
Page content transcription
If your browser does not render page correctly, please read the page content below
Quantifying Parkinson’s Disease Motor Severity Under
        Uncertainty Using MDS-UPDRS Videos

    Mandy Lua , Qingyu Zhaob , Kathleen L. Postonc , Edith V. Sullivanb ,
Adolf Pfefferbaumb,d , Marian Shahidc , Maya Katzc , Leila Montaser Kouhsaric ,
    Kevin Schulmane , Arnold Milsteine , Juan Carlos Nieblesa , Victor W.
         Hendersonf,c , Li Fei-Feia , Kilian M. Pohlb,d , Ehsan Adelia,b,∗
       a Department   of Computer Science, Stanford University, Stanford, CA 94305
b Department   of Psychiatry & Behavioral Sciences, Stanford University, Stanford, CA 94305
c Department of Neurology & Neurological Sciences, Stanford University, Stanford, CA 94305
          d Center for Health Sciences, SRI International, Menlo Park, CA 94025
             e Department of Medicine, Stanford University, Stanford, CA 94305
f Department of Epidemiology & Population Health, Stanford University, Stanford, CA 94305

Abstract

Parkinson’s disease (PD) is a brain disorder that primarily affects motor function,
leading to slow movement, tremor, and stiffness, as well as postural instability
and difficulty with walking/balance. The severity of PD motor impairments
is clinically assessed by part III of the Movement Disorder Society Unified
Parkinson’s Disease Rating Scale (MDS-UPDRS), a universally-accepted rating
scale. However, experts often disagree on the exact scoring of individuals. In
the presence of label noise, training a machine learning model using only scores
from a single rater may introduce bias, while training models with multiple noisy
ratings is a challenging task due to the inter-rater variabilities. In this paper,
we introduce an ordinal focal neural network to estimate the MDS-UPDRS
scores from input videos, to leverage the ordinal nature of MDS-UPDRS scores
and combat class imbalance. To handle multiple noisy labels per exam, the
training of the network is regularized via rater confusion estimation (RCE),
which encodes the rating habits and skills of raters via a confusion matrix.
We apply our pipeline to estimate MDS-UPDRS test scores from their video

   ∗ Correspondingauthor
    Email address: eadeli@stanford.edu (Ehsan Adeli)

Preprint submitted to Medical Image Analysis                                 June 28, 2021
recordings including gait (with multiple Raters, R = 3) and finger tapping
     scores (single rater). On a sizable clinical dataset for the gait test (N = 55),
     we obtained a classification accuracy of 72% with majority vote as ground-
     truth, and an accuracy of ∼84% of our model predicting at least one of the
     raters’ scores. Our work demonstrates how computer-assisted technologies can
     be used to track patients and their motor impairments, even when there is
     uncertainty in the clinical ratings. The latest version of the code will be available
     at https://github.com/mlu355/PD-Motor-Severity-Estimation.
     Keywords: Movement Disorder Society Unified Parkinson’s Disease Rating
     Scale, Uncertainty, Gait Analysis, Finger Tapping, Computer Vision.

     1. Introduction

        Parkinson’s disease (PD) is the second most prevalent neurodegenerative
     disease (Lang and Lozano, 1998; Ellis et al., 2011). It affects motor function and
     commonly causes slowing of movements (bradykinesia) and stiffness (rigidity).
 5   PD is caused by a gradual decline in dopamine production, resulting in progressive
     deterioration of selective brain neurons (Lang and Lozano, 1998; Mao et al.,
     2020; Napier et al., 2020). The degeneration of dopamine-containing cells in
     the basal ganglia regions provoke visible signs of gait disturbances and postural
     instabilities (Benatru et al., 2008). Early PD diagnosis and tracking of its signs
10   are crucial for the development and maintenance of treatment plans (Venuto
     et al., 2016).
        In recent years, several methods were investigated for automatic quantification
     of gait-related PD signs (e.g., gait disturbances and postural instability) using
     expensive and intrusive wearable sensors (Hobert et al., 2019; Hssayeni et al., 2019;
15   Daneault et al., 2021; Marcante et al., 2021). Alternatively, video technology
     offers a contactless, scalable, non-intrusive platform for identifying, quantifying,
     and tracking movement disturbances. Using deep learning algorithms (LeCun
     et al., 2015) and high performance computing technologies, video processing
     techniques can now accurately quantify human movements (Kanazawa et al.,

                                              2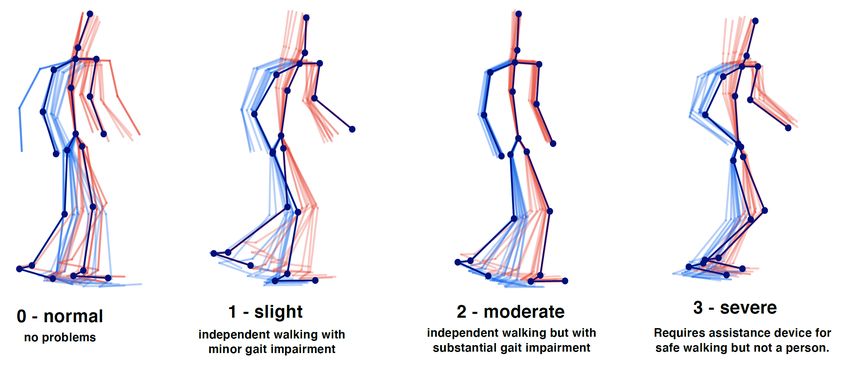
20   2018; Chiu et al., 2019; Kocabas et al., 2020; Adeli et al., 2020). These approaches
     have yet to be applied to the clinical setting, such as for PD diagnosis.
        The Movement Disorder Society-Unified Parkinson’s Disease Rating Scale
     (MDS-UPDRS) (Goetz et al., 2008) defines the most commonly used clinical
     scoring scheme (Martínez-Martín et al., 2015) to measure the severity and
25   progression of PD. We argue that video of participants performing these guided
     tests can be used for automatic quantification of PD severity. MDS-UPDRS
     contains several tests measuring different aspects of movement, including a gait
     test and a finger tapping test. The MDS-UPDRS gait test requires a participant
     to walk approximately 10 meters away from and toward an examiner. Trained
30   specialists assess the participant’s posture with respect to movement and balance
     (e.g., ‘stride amplitude/speed,’ ‘height of foot lift,’ ‘heel strike during walking,’
     ‘turning,’ and ‘arm swing’) by observation. The score ranges from 0 indicating no
     motor impairments to 4 for patients unable to move independently (see Fig. 1).
     For the MDS-UPDRS finger tapping tests, the participants are asked to tap
35   their index finger to their thumb 10 times as quickly and as big as possible. It is
     used to measure the motor speed and amplitude of the index finger as a subtle
     and indirect estimate of cortical motor areas integrity. The finger tapping test is
     a good indicator of PD since it evaluates bradykinesia, focusing on decrement
     in rate, amplitude, or both with repetitive action. MDS-UPDRS tests provide
40   principled and well-defined platforms for quantifying PD motor severity.
        Videos of these tests can be automatically processed to quantify movement-
     linked disease markers. Although there exist a few video-based methods for
     assessing gait for PD diagnosis (Cho et al., 2009; Xue et al., 2018; Han et al.,
     2006; Sabo et al., 2020; Fabbri et al., 2020; Stricker et al., 2021), no prior work
45   quantifies movement-linked impairments for assessing PD severity on universally-
     accepted scales (such as MDS-UPDRS). In a preliminary work (Lu et al., 2020),
     we used videos of participants performing the maneuvers of the MDS-UPDRS
     and defined a new task and a principled benchmark by estimating the standard
     clinical scores. However, one of the major challenges was the possible subjective
50   opinions of clinical raters (rating participants using the MDS-UPDRS scale),

                                              3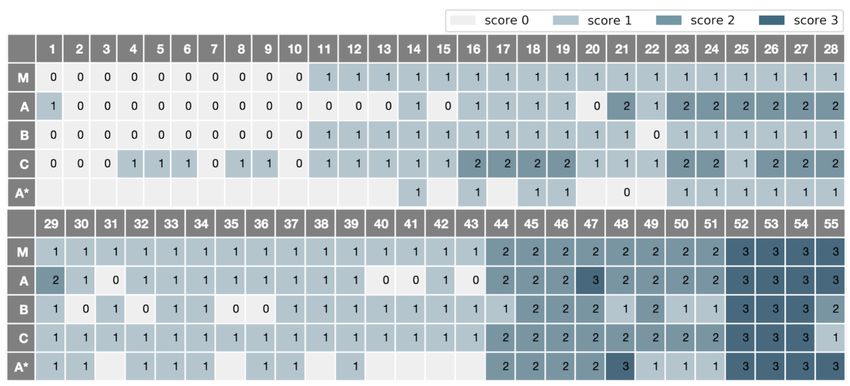
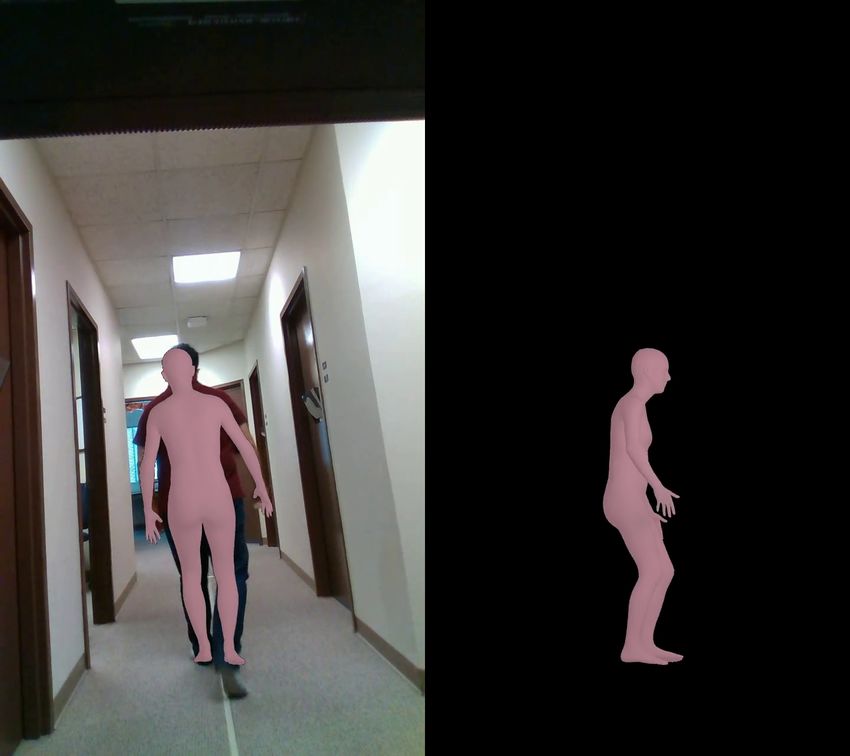
1 – Slight                  2 – Moderate                       3 – Severe
        0 – Normal       (independent walking with   (independent walking but with    (requires assistance device for
        (no problems)      minor gait impairments)     substantial gait impairment)   safe walking but not a person)

                                                         Top 4 joints contributing to
                                                      MDS-UPDRS Gait Score estimation

     Figure 1: Progressive PD impairments demonstrated by 3D gait (poses fade over time; left/right
     distinguished by color) with MDS-UPDRS gait score shown below each skeleton. Participants
     are taken from our clinical dataset. Scores 0 to 2 progressively decrease in mobility with
     reduced arm swing and range of pedal motion (i.e.reduced stride amplitude and footlift) while
     3 becomes imbalanced with almost frozen gait. The average movements are the outputs of our
     proposed pipeline. The top four joints which contributed to gait score estimation are indicated.

     which may in turn bias the model to rating habits or subjective opinion of a
     single rater.
         To avoid such challenges, we propose a method to leverage ratings from
     multiple expert neurologists (3 used herein) to build a robust score estimation
55   model agnostic to single rater habits or preferences. Incorporating ratings from
     multiple raters introduces a source of uncertainty and noise (Tanno et al., 2019;
     Nair et al., 2020; Wang et al., 2020; Arteta et al., 2016; Kwon et al., 2019),
     for which different methods have been presented in the literature. One of the
     main approaches has been to estimate the skills of raters (or data annotators)
60   while teaching the model to classify the data. The extra knowledge of the rater
     skills or habits can be crucial information for discovering how confident the
     ratings from a rater for each input sample should be considered (Long and Hua,
     2015). Therefore, accurately modeling the uncertainty (or noise) induced by
     the ratings of each rater can be useful for improving the accuracy of the final
65   model as well as understanding the quality of the scoring. We have incorporated

                                                     4
rating uncertainty concepts into our preliminary work presented at MICCAI
2020 (Lu et al., 2020). Borrowing concepts from (Tanno et al., 2019), we propose
a Rater Confusion Estimation (RCE) framework that jointly learns the rater
scoring noise and MDS-UPDRS score estimation with the ordinal focal neural
70 network. We do this by creating a learnable confusion matrix (CM) for each
rater and optimize for it while classifying the input videos using our ordinal
focal strategy (to comply with the ordinal nature of MDS-UPDRS scores and
combat small dataset size). We regularize our model within this joint training
framework to encourage the estimated raters’ noise to be maximally unreliable,
75 i.e., considering the raters to be maximally uncertain to learn a robust classifier.
The model hence learns to discard the unreliable ratings.
Our classification model is applied to the skeletons of the participants ex-
tracted from the video. Skeleton extraction uses off-the-shelf models pretrained
on large public datasets. The estimation of the MDS-UPDRS scores will only
80 be performed on low-dimensional skeletons (49 keypoints/joints in 3D space for
gait and 21 hand keypoints), which anonymizes the data and makes it agnostic
to the clinical environment and video background.
In summary, this paper is a novel extension of our earlier work (Lu et al.,
2020) with respect to six points: (1) Addition of more participants in the study,
85 primarily of class 0, scored by expert neurologists in place of the public dataset.
(2) Novel assessment of clinical inter-rater reliability for the MDS-UPDRS gait
test with ratings from three different expert raters. (3) Supplementing our
model with the RCE framework to incorporate uncertainty induced by rater
disagreements. We added an explicit simplex projection to the RCE training
90 step and used our revised ordinal focal loss function. (4) Visualization of saliency
with respect to the contribution of individual body joints to score estimation
of MDS-UPDRS scores (green circles in Fig. 1). This approach examines the
validity of salient features from the input keypoints by our model to estimate
gait or finger tapping scores. (5) Modification of our ordinal-focal (OF) loss
95 function by incorporating a new weighting scheme. (6) Finally, in addition to
the MDS-UPDRS gait test, we extend our method to the widely-used finger
5tapping test, which examines fine motor control of the upper extremities. We
present the first automatic vision-based method to predict MDS-UPDRS finger
tapping scores.
100 2. Related Work
PD Severity Estimation. Prior work aiming to objectively assess PD severity or
progression are either based on neuroimages (Adeli et al., 2016; Bharti et al., 2019;
Sivaranjini and Sujatha, 2020) or largely rely on quantifying motor impairments
via wearable sensors that are expensive, unwieldy, and sometimes intrusive
105 (Hobert et al., 2019; Hssayeni et al., 2019). Video-based technologies based
on deep learning now offer non-intrusive and scalable ways to quantify human
movements (Kanazawa et al., 2018; Chiu et al., 2019). Their application to the
clinical setting, such as PD severity estimation, is under-explored. Video-based
approaches for PD assessment, e.g., (Cho et al., 2009; Xue et al., 2018; Han et al.,
110 2006; Sabo et al., 2020; Fabbri et al., 2020; Stricker et al., 2021), have mainly
focused on diagnosis of PD (a binary classification) rather than quantifying
motor impairment severity in a principled or standardized way.
Cognitive Assessment from Motor Movement. General cognitive assessment from
motor movement with vision-based approaches has included the use of deep neural
115 models to predict cognitive dysfunctions such as Executive Function Disorder
and Alzheimer’s disease (Babu et al., 2019; Gattupalli et al., 2017; Chandra
et al., 2015). Upper-body gesture recognition from the Praxis test (Chandra
et al., 2015; Heilman et al., 1982), a gesture-based diagnostic for neurological
pathologies such as Alzheimer’s disease which measures the ability of patients
120 with no motor or sensory deficit to plan and perform skilled movements, is used
in (Negin et al., 2018) to perform automatic cognitive assessment. This method
demonstrated promise in automatically performing cognitive assessment from
gestures with various methods such as CNN and coarse skeleton features in
large upper-body or hand movements. We extended this to finer finger pinching
6125 movements and to the MDS-UPDRS test using recent developments in fine hand
keypoint detection (Simon et al., 2017).
Similarly to gait, prior work has used wearables such as accelerometers to
predict the finger tapping MDS-UPDRS test (Stamatakis et al., 2013). (Lee
et al., 2016) developed a smartphone-based finger tapping application to assess
130 bradykinesia. Vision-based approaches include early attempts to develop features
to represent finger tapping motion involving a polygon masking approach (Criss
and McNames, 2011). A concurrent work (Li et al., 2021) developed a complex
action recognition approach for assessing finger tapping motor impairments. In
another work, (Lin et al., 2020) developed three features to assess bradykinesia
135 in single RGB videos using the MDS-UPDRS hand movement test.
Label Uncertainty. Label noise can greatly affect the efficacy of machine and
deep learning models, especially in medical applications, which often have small
datasets, require domain expertise and suffer from high inter-rater and intra-
rater variability (Karimi et al., 2020). Many techniques have been explored to
140 handle this variability, such as label cleaning (Pham et al., 2019) and changes
in network architecture changes (Dgani et al., 2018). Numerous studies have
proposed to keep the initial dataset, modeling, and training methods intact
while only changing the loss function, such as in (Ghosh et al., 2017; Wang
et al., 2019; Izadinia et al., 2015). Specifically focusing on the case with scores
145 from multiple medical experts, Tanno et al. (Tanno et al., 2019) proposed an
annotator confusion estimation method, which learns rater confusion matrices
jointly with the correct label during training.
The literature review by Karimi et al. (Karimi et al., 2020) performed a
comparison on three medical imaging datasets with different types of label noise.
150 It demonstrated that the medical image analysis community does not share a
standard set of guidelines or shared practice regarding how to handle label noise,
and “recent progress on handling label noise in deep learning has gone largely
unnoticed by the medical image analysis community.” They showed that in the
multiple annotator setting (like ours), the rater confusion (Tanno et al., 2019)
7155 and Improved Mean Absolute Error (iMAE) (Wang et al., 2019) methods achieve
highest performance.
3. Materials and Methods
3.1. Participants
We collected video recordings of MDS-UPDRS exams from 55 participants
160 which were scored by three different board-certified movement disorders neu-
rologists (referred to by raters A, B, and C). The PD patients met UK Brain
Bank diagnostic criteria (Clarke et al., 2016). All procedures were approved
by the Stanford Institutional Review Board and written informed consent was
obtained from all participants in this study, which prohibits public release. This
165 dataset is an extension of the one in (Lu et al., 2020), which was confined to
30 gait videos rated by Expert A. We refer to the old ratings by A*. Rater A
re-scored all 55 exams after over 1 year. All raters rated the gait videos based
on the MDS-UPDRS section 3.10. The ground-truth score of a video (0, 1, 2, or
3) was determined based on the majority vote among the three raters, with ties
170 randomly broken. The inter-rater agreement is further visualized in Fig. 2. Since
A* ratings were performed before additional videos were added, videos not scored
are left blank in the table. Videos of PD participants were recorded during the
off-medication state, defined according to previously published protocols (Poston
et al., 2016). We first extracted the sections of the video documenting the gait
175 examination, in which participants were instructed to walk directly toward and
away from the camera twice. The gait clips range from 5 seconds to 54 seconds
with 30 frames per second. Score distribution and related information of the 55
gait exams are provided in Table 1.
We further extracted the sections of the participant videos documenting the
180 finger tapping examination, in which participants were instructed to tap the
index finger on the thumb 10 times as quickly and as big as possible. Each
hand was rated separately in evaluating speed, amplitude, hesitations, halts, and
decrementing amplitude. These videos were scored by a single rater based on
8Figure 2: Gait Scores of Raters A, B, C, A* and their Majority Vote (M).
the MDS-UPDRS section 3.4. The finger tapping clips range from 4 seconds to
185 30 seconds with 30 frames per second. Our dataset includes 34 exams each for
right and left finger tapping, for a total of 68 exams with 5 of score 0, 21 with
score 1, 22 with score 2, 17 with score 3 and 3 with score 4. Details of these
participants are also provided in Table 1.
In both gait and finger tapping experiments, participants who cannot perform
190 the test at all or without assistance are scored 4. We combined scores 3 and 4 due
to limited number of videos scored 4. As can be seen in Table 1, participants are
relatively age- and sex-matched across scores in the finger tapping experiment.
In the gait experiments, older participants are more likely to be scored higher on
the scale (more severe). Due to patient privacy constraints we are not allowed
195 to release the videos or the dataset.
3.2. Estimation of MDS-UPDRS Scores from Videos
As shown in Fig. 3, a monocular video of the participant walking in the scene
forms the input. Our method consists of two main steps: 3D skeleton extraction
and motor score estimation.
9Table 1: Clinical dataset used in this study. Ground-truth for each video is determined by the
majority vote of raters (ties randomly broken). Walking time denotes the length of the gait
exam in seconds and Finger tapping time refers to the length of the finger tapping exam.
MDS-UPDRS Score All 0 1 2 3
N 55 10 33 8 4
Gait
Sex (F/M) % 49/51 70/30 42/58 50/50 50/50
Age (mean ± std) 61.2± 14.9 46.9± 16.3 62.2± 13.1 68.1± 8.3 75.8± 1.3
Walking Time (sec) 20.9±13.7 7.3± 2.04 20.7± 12.5 30.0± 11.2 38.0 ± 10.8
Left Hand Right Hand
N 34 3 11 10 10
Sex (F/M) % 41/59 67/33 36/64 50/50 30/70
Age (mean ± std) 69.7± 7.3 73.2± 10.1 66.7± 7.6 69.8± 7.1 71.9± 4.3
Finger Tapping Time (sec) 12.9± 5.0 9.5± 2.9 13.4±3.3 13.5±6.3 12.6±5.2
N 34 2 10 12 10
Sex (F/M) % 41/59 0/100 60/40 58/42 10/90
Age (mean ± std) 69.7± 7.3 70.5± 11.5 68.7± 5.2 69.5± 8.5 70.8± 6.1
Finger Tapping Time (sec) 10.2±3.2 8.5±2.9 9.2±2.8 10.1±2.8 11.6±3.4
200 3.2.1. Skeleton Extraction
Gait We extract the 3D skeleton from the gait videos with VIBE (Video Inference
for human Body pose and shape Estimation) (Kocabas et al., 2020). This is
an extension of SPIN (SMPL oPtimization IN the loop) that we previously
used in (Lu et al., 2020), a state-of-the-art neural method for estimating 3D
205 human skeleton and shape from 2D monocular images of an input video. It
is initialized with pretrained SMPL (Loper et al., 2015). The pipeline first
recovers the 3D body mesh using Human Mesh Recovery (HMR) (Kanazawa
et al., 2018) pretrained on the large publicly-available Human3.6M (Ionescu
et al., 2013) and MPI-INF-3DHP (Mehta et al., 2017) datasets, providing over
210 150k training images with 3D joint annotations, as well as large-scale datasets
with 2D annotations (e.g., COCO (Lin et al., 2017) and MPII (Andriluka et al.,
2014)). In summary, this process reduces the videos to 3D human meshes and
regresses them to skeletons with 49 predefined joints, as in (Ionescu et al., 2013).
Hand We additionally extract 2D hand skeleton from the finger tapping videos
215 with the OpenPose hand keypoint detection system (Simon et al., 2017), which
produces 21 keypoints for each of the right and left hands. This system uses
103D Pose Sequence OF-DDNet
Joint Collection 3D fast
Distances slow
Coordinates motion
(JCD) motion
3x 1D Conv 3x 1D Conv 3x 1D Conv
Concatenate
CNN
Ordinal + Focal
Supervision
VIBE
3D Body Mesh and Pose
Estimation MDS-UPDRS Score (0, 1, 2, 3)
Figure 3: The proposed framework: we first extract the identified participants’ 3D body mesh
and subsequently the skeletons via VIBE. Based on this 3D skeleton sequence, our proposed
OF-DDNet estimates the MDS-UPDRS gait score.
a training process called multiview bootstrapping with multiple cameras to
produce fine-grained detectors for hand keypoints with greater robustness to
noise and occlusion. A keypoint detector is first initialized to produce noisy
220 scores in multiple views of the hand, which are triangulated in 3D and the
reprojected to be used iteratively as new scores during training. We select
this hand detection model for our finger tapping experiment because it is a
single-view image-based hand keypoint detector comparable to methods that use
depth sensors. It produces numerous and precise hand keypoints that are crucial
225 to representing fine hand movements and hence quantify PD motor impairments.
3.2.2. Score Estimation from Skeletons Based on Single Rater Scores
We first review our model, OF-DDNet, proposed in our prior work (Lu et al.,
2020). The model architecture is based on the Double-Feature Double-Motion
Network (DD-Net) (Yang et al., 2019). OF-DDNet uses features extracted from
230 skeletons (for both gait and finger tapping exams) to estimate the MDS-UPDRS
scores, whose ground-truth is determined by one single rater.
Feature Construction We transform the skeleton data and their movement
over time in a video clip into a series of features as the input to the classification
11model. We use two types of features to address the variance of 3D Cartesian
joints to both location and viewpoint: (1) Joint Collection Distances (JCD)
and (2) two-scale motion features. Let Jjt be the 3D Cartesian coordinates of
the j th joint at frame t, where j ∈ {1, ..., n} and t ∈ {1, ..., T }. JCD is then
defined as a location-viewpoint invariant feature that represents the Euclidean
t
distances between joints as a matrix M , where Mjk = kJjt − Jkt k for joints j
and k at frame t. Since M is a symmetric matrix, only the upper triangular
matrix is preserved and flattened to a dimension of n2 for n joints. A two-scale
motion feature is introduced for global scale invariance which measures temporal
difference between nearby frames. To capture varying scales of global motion,
t
we calculate slow motion (Mslow ) and fast motion (Mft ast )
t
Mslow = S t+1 − S t , t ∈ {1, 2, 3, ..., T − 1},
(1)
Mft ast = S t+2 − S t , t ∈ {1, 3, 5, ..., T − 2},
where S t = {J1t , J2t , ...Jnt } denotes the set of joints for the tth frame. The JCD
and two-scale motion features are embedded into latent vectors at each frame
through a series of convolutions to learn joint correlation and reduce the effect of
235 skeleton noise. Then, for the it h video clip, the embeddings are concatenated and
run through a series of 1D temporal convolutions and pooling layers, culminating
with a softmax activation on the final layer to output a probability for each
of the C classes pi = [pi,1 , . . . , pi,C ]> (see Fig. 3). Due to our relatively small
clinical dataset compared to large deep learning datasets, we choose a lightweight
240 architecture with temporal CNNs to prevent overfitting.
Hybrid Ordinal-Focal (OF) Loss We leverage the ordinal nature of MDS-
UPDRS scores to combat the natural class imbalance in clinical dataset by
proposing a hybrid ordinal (O) focal (F ) loss.
One of the use cases of the focal loss (Lin et al., 2017) has been to combat class
245 imbalance. It was initially proposed for binary classification, but it is naturally ex-
tensible to multi-class classification (e.g., C > 2 classes). Let yi = [yi,1 , . . . , yi,C ]
be the one-hot-encoding label for the score of the ith training sample. The
PC
focal loss is then defined as F (yi , pi ) = c=1 −α(1 − pi,c )γ yi,c log(pi,c ). The
12modulating factor (1 − pi,c )γ is small for easy negatives where the model has
250 high certainty and close to 1 for misclassified examples. This combats class
imbalance by down-weighting learning for easy negatives, while preserving ba-
sic cross-entropy loss for misclassified examples. We set the default focusing
parameter of γ = 2 and weighting factor α = 0.25 as suggested by (Lin et al.,
2017).
255 To leverage the intrinsic order in the MDS-UPDRS scores, we propose to use
an ordinal loss, which penalizes predictions more if they are violating the order.
Let yi = arg maxc {yi,c } be the actual score for the ith video (yi ∈ {0, 1, 2, 3}),
and let ŷi ∈ {0, 1, 2, 3} be the estimated score. We calculate the absolute distance
wi = |yi − ŷi | and incorporate this with categorical cross-entropy to generate our
PC
260 ordinal loss O(yi , pi ) = − 1+w
C
i
c=1 yi,c log(pi,c ).
Finally, ordinal and focal losses can be naturally combined by factorizing
them with scaling factor β for the ordinal component as
C
X
γ 1 + wi
OF (yi , pi ) = − α(1 − pi,c ) + β yi,c log(pi,c ). (2)
c=1
C
3.2.3. Multiple Rater Scores
In the presence of uncertainty in the label (score) space (MDS-UPDRS Gait
265 scores provided by three different raters), we propose an extension to the OF
loss. We introduce a rater confusion data-weighting and loss scheme inspired by
(Tanno et al., 2019). In this framework, we learn both the OF-DDNet model
parameters and scoring patterns of each rater, akin to a rater profile. Each
scoring profile is encoded as a confusion matrix (CM) utilized by the Rater
270 Confusion Estimation (RCE) technique described in the following.
(r)
Assume we have noisy scores {yi } from R different raters, where r ∈
{1, . . . , R} (R is the total number of raters). We construct a confusion matrix
(r)
A(r) for rater r, where the (c0 , c) entry of the matrix is the probability p(yi =
c0 |yi = c), i.e., the probability that rater r corrupts the ground-truth score yi = c
(r)
to yi = c0 . Note, this probability is independent of the input image and solely
characterizes the systematic bias of rater r in scoring videos. Assuming pi is
13Input Skeleton pi RCE Prediction Loss
1 1 0 0 0 1 1
OF-DDNet 0 0 1 0 0 0 0
xi Gait Classifier 0
A(1) pi(1) OF(pi(1), yi(1))
0 0 1 1 0 0
θ 0 0 0 0 0 0 0
0.5 0.2 0 0 1 0.5
0.5 0 1 0 0 0.5
A(2) pi(2) OF(pi(2), yi(2))
0 0 0 1 0 0
0 0.8 0 0 0 0
0.3 0 0 1 1 0.3
Raters Scores
A yi(1) A(3)
0 0.6 0.2 0 0 0
pi(3) OF(pi(3), yi(3))
0 0.2 0.7 0 0 0
B yi(2)
yi(3) 0.7 0.2 0.1 0 0 0.7
C
Figure 4: The OF-DDNet training pipeline with Rater Confusion Estimation (RCE). We
implemented this scheme for the gait MDS-UPDRS score estimation with 3 raters. Given a
series of input skeletons, OF-DDNet generates prediction pi for the input. This prediction is
multiplied by each rater CM A(r) to produce a prediction for each rater. The total loss is the
(r) (r)
sum of the individual losses between each (pi , yi ) pair of the rth rater.
the true class probability vector for the ith video estimated by our model, the
(r)
RCE-weighted prediction pi = A(r) pi is then the estimated class probability
vector weighted by the confusion matrix of rater r (see Fig. 4 for details). As
such, the true scores and confusion matrices are jointly optimized with our OF
loss function
N X
R R
(r) (r)
X X
OF pi , yi +λ tr A(r) , (3)
i=1 r=1 r=1
As suggested in (Tanno et al., 2019), when {A(r) } are initialized as identity
PR
matrices, a trace regularization λ r=1 tr A(r) can be used in practice to find
the maximal amount of confusion to best explain the noisy observations.
To implement the optimization defined in Eq. (3), we have to ensure that each
275 column of A(r) defines a conditional probability that sums up to 1. We propose
to satisfy this constraint by projecting the columns of A(r) onto a simplex in
each optimization iteration via an explicit projection operation, similar to the
projection operation in (Cabral et al., 2011). To this end, before calculating our
loss for each training step, we set
14(r)
(r) Aij
Aij := PC (r)
. (4)
k=1 Akj
280 4. Experiments
We preprocess our dataset by first subclipping each video into shorter samples
and then normalizing joints per clip after skeleton extraction. The gait exams
are subclipped into samples of 100 frames each, creating multiple subclips from
each single exam video. The finger tapping clips preserve the end of the exam,
285 due to the nature of the exam requiring counting and observation of pauses or
slowing over time. The finger tapping subclips start at multiples of 80 frames
offset from the beginning of the exam and finish at the end of the exam. Due to
clips containing overlapping components, we add Gaussian noise to each subclip
distributed as N (0, 0.02).
290 During training, the ground-truth score of each subclip is the same as the
score of the exam. During evaluation, the predicted score of an exam is the
majority vote among its subclips. This subclipping and subvoting mechanism
adds robustness to the overall system and allows us to augment the dataset for
proper training of the OF-DDNet. To account for the limited dataset size, all
295 evaluations in this study were performed using a participant-based leave-one-out
cross-fold-validation on all samples. The clips and subclips for each exam are
never separated by the train/test split.
Note, we used pretrained skeleton estimation models provided by VIBE
(Kocabas et al., 2020) and OpenPose (Simon et al., 2017). However, due to the
300 lack of joint-level 3D annotations, we cannot directly evaluate their performance
for skeleton estimation from our videos. We evaluate the validity of the extracted
skeletons qualitatively as well as through estimating the MDS-UPDRS scores.
The extracted skeletons resulted in classification models (for our method and all
of the baselines) significantly better than chance (p-value < 0.05 using Wilcoxon
305 signed rank test (Wilcoxon, 1992)).
Setup. Optimal hyperparameters for both models were obtained by performing
15a grid search using inner leave-one-out cross validation and the Adam optimizer
(β1 = 0.9, β2 = 0.999) (Kingma and Ba, 2014). Note that the clips for each
subject are never separated by the train/test split. Leave-one-out cross-validation
310 is performed on a per-subject level, wherein all video clips of exactly one subject
are used for testing and removed from the training fold at each iteration. Best
performance was achieved at 300 epochs, batch size of 128, filter size of 32 and
an annealing learning rate from 1−3 to 1−6 . All models were developed with
Keras 2.2.4 (Gulli and Pal, 2017) and ran on an Nvidia Tesla K80 GPU with
315 12GB memory. Each training run in both experiments took approximately 1 to
2 hours.
Evaluation Metrics. For evaluation, we report per-class and macro average
F1 , area under ROC curve (AUC), precision (Pre), recall (Rec), and balanced
accuracy (bAcc). To assess whether the bAcc is significantly higher than chance,
320 we ran a null classifier 10,000 times, which randomly assigned each sample one
of the 4 scores (a probability of 25%). The null distribution was then built for
the bACC and one-tailed p-values were derived based on the true bAcc of our
model. One-tailed p < 0.05 is used as the significance threshold.
For the gait experiment with multiple raters, the ground-truth score of each
325 exam is the majority vote of the raters. In addition to the above metrics, we
use Cohen’s κ coefficient (κ) to measure the agreement between prediction and
ground truth. κ is considered a more robust measure compared to the simple
percent agreement measure because it considers the possibility that agreement
occurs by chance. Lastly, we measure the pairwise Cohen’s κ between the scores
330 provided by two different raters to asses inter-rater reliability (McHugh, 2012).
4.1. Gait Score Estimation Results - Multiple Rater Scores
For this experiment, three different raters scored the videos. We ran our
OF-DDNet in conjunction with RCE (explained in Sec. 3.2.3). The Rater
Confusion Estimation requires the initialization of the rater CMs as learnable
335 parameters; this was implemented as a final layer on the output of softmax in
order to store the CMs as learnable variables.
16F1 AUC Precision Recall
0
0.8 0.8 0.8 0.8 1
2
3
0.6 0.6 0.6 0.6 Avg
0.4 0.4 0.4 0.4
Figure 5: Per-class MDS-UPDRS gait score estimation performance of our method.
0.6 0.4 0 0
0
0.75
0.60
Ground truth
0.21 0.64 0.091 0.061
1
0.45
0 0.12 0.88 0
2
0.30
0 0 0.25 0.75
0.15
3
0.00
0 1 2 3
Predicted
Figure 6: Confusion matrix of our final model for estimation MDS-UPDRS gait scores.
Our method achieves a κ of 0.49 (Table 2) and macro-average AUC of 0.83,
F1 -score of 0.66, precision of 0.63, and balanced accuracy (average recall) of 72%
(see per-class performance metrics in Fig. 5). Furthermore, the classification
340 performed significantly better than the null classifier based on permutation
testing (one-tailed p < 0.0001).
As seen in the confusion matrix (Fig. 6), all errors are within one score
deviation of the ground-truth (based on majority vote), with the exception of a
small portion of score 1 misclassified as score 3. This indicates that our model
345 successfully forms predictions within a range very similar to the raters themselves.
This claim is also supported by Fig. 7, where possible ratings for each participant
are defined as scores that at least one rater provided for the participant. 46
out of 55 participants were given a score by the model that was also assigned
173 Avg Rating
Possible Rating
Predicted Rating
MDS-UPDRS 2
1
0
0 10 20 30 40 50
Participant
Figure 7: MDS-UPDRS gait score as a function of study participants. Orange dots indicate
predicted scores by our method. Possible rating refers to all ratings the specific participant
has received from the three raters. The participants are sorted in an increasing average rating
order.
by a physician, with only 9 participants not assigned a score that matches a
350 physician rating. This translates to a 83.7% accuracy that our method rates the
participants’ gait exam within the range of actual physician ratings. Classwise,
the percent of model predictions within the range of actual physician ratings for
classes 0, 1, 2, 3 are respectively 90.9%, 84.8%, 62.5%, and 100% using majority
vote as the ground-truth. This demonstrates that most of our model predictions
355 can be considered acceptable scores. Furthermore, we observe from Fig. 5 and
Fig. 6 that scores 0 and 1 have the lowest percent accuracy as the model tends
to misclassify them as each other. Score 1 has the greatest spread of errors as it
has the largest number of participants. The only misclassified exam with score 3
is assigned a different score by all three raters (see participant 55 in Fig. 2).
360 Comparison with Baseline Methods and Ablations We compare our re-
sults with several baselines in Table 2. Majority vote of all ratings per exam is
taken as ground truth, and all methods use categorical cross-entropy loss unless
otherwise specified. We first perform ablations of our method, OF-DDNet with
18RCE, to handle multiple rating scores:
365 1) Our method without ordinal loss (i.e., focal loss with CE);
2) Our method without focal loss (i.e., ordinal CE loss);
3) Our method without ordinal-focal loss (i.e., simple multi-class CE loss);
4) For this comparison, we examine the effect our simplex projection explained
in Sec. 3.2.3. We implement RCE with an implicit normalization of the
370 A(r) matrices. Instead of our simplex projection (Eq. (4)), we modify the
(r) 1
loss function in Eq. (3) by multiplying the A(r) and pi by the PC (r)
k=1 Akj
factor. This operation will incorporate the normalized values in the loss,
but does not replace the values in the A(r) matrices. Since we are no
longer explicitly setting A(r) , the columns are no longer guaranteed to sum
375 to one and may diverge during training;
5) As an alliterative approach to our proposed RCE OF-DDNet, we examine
probabilistic techniques to model uncertainty by representing each label as
a probability distribution instead of as a one-hot vector, as traditionally
used in cross-entropy loss functions. This technique has been used to
380 combat label noise and has been shown to be effective in cases of multiple
raters with high uncertainty (Nguyen et al., 2014). The score for each gait
exam xi is represented as a vector Li ∈ RC for C classes, where L(c) is the
percent of raters who provided a score of c for xi for c ∈ {0, . . . , C − 1}.
This is an extension of CE-loss, which models the uncertainty in the scores
385 and encourages the model to minimize the distance between the estimated
distribution and the score distribution. We refer to this method as ‘Soft
Scores,’ trained by a CE loss with the DD-Net architecture;
6) Soft Scores trained by KL divergence loss (instead of CE) with the DD-Net
architecture;
390 7) Finally, we use the majority vote across all ratings for each exam to train
the following models, starting with the original OF-DDNet without RCE;
19Table 2: Comparison with baseline and ablated methods. ∗ indicates statistical difference at
(p < 0.05) compared with our method, measured by the Wilcoxon signed rank test (Wilcoxon,
1992). Best results are in bold and second best are underlined. See text for details about
compared methods.
Method κ AUC F1 Pre Rec
Ours 0.49 0.83 0.66 0.63 0.72
1) Ours w/o Ordinal 0.46 0.83 0.67 0.69 0.72
2) Ours w/o Focal 0.46 0.84 0.66 0.64 0.70
3) Ours w/o OF loss∗ 0.45 0.80 0.66 0.67 0.65
∗
4) RCE w/ implicit norm 0.41 0.77 0.63 0.65 0.61
5) Soft scores∗ 0.32 0.75 0.56 0.57 0.56
∗
6) Soft scores (KL) 0.42 0.72 0.62 0.65 0.62
7) Majority Vote (OF)∗ 0.33 0.73 0.58 0.59 0.58
∗
8) Majority Vote 0.32 0.75 0.56 0.57 0.56
9) Baseline OF-CNN∗ 0.26 0.72 0.57 0.60 0.54
∗
10) Baseline CNN 0.24 0.71 0.55 0.61 0.49
11) DeepRank∗ ((Pang et al., 2017)) 0.27 0.70 0.56 0.53 0.58
∗
12) SVM 0.21 0.56 0.44 0.49 0.40
8) The baseline DD-Net with CE ;
9) 1D CNN modeled after DD-Net architecture sans double features and
embedding layer using input of raw 3D joints from VIBE;
395 10) the same as (1) but with our OF loss;
11) DeepRank (Pang et al., 2017), a ranking CNN which cannot be combined
with focal loss;
12) Support Vector Machine (SVM) using the raw 3D joints.
The results of our proposed RCE and OF-DDNet model along with our listed
400 baselines and ablations are summarized in Table 2. First, our method with
20or without ordinal loss outperform all other methods. Based on the Wilcoxon
signed rank test (Wilcoxon, 1992) (p < 0.05), our proposed method achieves
significantly better performance than several other methods and consistently
outperforms the remaining methods in the table. All metrics were performed
405 on a per subject level except the AUC and the Wilcoxon signed rank test.
The latter were performed on video clips, for which our model outputs class
probabilities as needed for calculating the AUC. The statistical test results are
thus more representative of the data used for training and evaluation of the
models. Remarkably, our method also outperforms human raters by showing
410 higher agreement with majority vote compared to inter-rater agreement with
regard to average pairwise κ, F1 -score, precision and (bAcc)/recall. Our κ of
0.49 is much higher than the κ of all rater pairs, which are 0.38, 0.39, and 0.30
(see Table 3). In addition, RCE improves performance over non-RCE methods
by a heavy margin, with the exception of the KL Loss. This suggests that rater
415 confusion estimation works very well for modeling the uncertainty in the scores.
We note that a DD-Net model with soft scores achieves higher performance with
KL-Divergence than with Categorical Cross Entropy loss. All methods utilizing
the score distribution achieve higher performance than majority vote methods,
which aggregate the scores into a single rating score before training. Adding focal
420 (Method 1) loss to baseline DD-Net improves κ, F1 -score, AUC, and precision;
however, adding ordinal (Method 2 in the Table) loss to baseline DD-Net results
in higher F1 and equivalent AUC, but lower κ, precision and recall than the
baseline RCE. Ordinal loss could be clashing with the baked in ordinality of the
rater CMs, which already contain probabilities increasing with distance to the
425 true score. DD-Net outperforms baseline CNN and SVM, and adding OF loss to
baseline CNN produces a slight improvement in metrics. DeepRank (Method
11) had high confidence on predictions and poor performance on sparse classes,
suggesting an overfitting problem that encourages the use of a simple ordinal
loss for our small dataset.
430 Age Effects. As seen in Table 1, the gait experiment involved participants
with increasing average age as the MDS-UPDRS gait scores increased. To
21Subjects with MDS-UPDRS=1
80
70
60
Age 50
40
30
20
0.0 1.0 2.0 3.0
Predicted Label
Figure 8: Participants with ground-truth MDS-UPDRS scores of 1 plotted with their predicted
score by our method and their age. The orange dots show the age of each participant.
ANOVA test returned a p-value=0.22, confirming insignificant difference between the 4 groups
concerning the participants’ age.
investigate the age effects on our estimation model (OF-DDNet with RCE), we
conducted two statistical tests. The first test is an ANOVA (Analysis of Variance)
(Anscombe, 1948) on all the participants in the group with ground-truth MDS-
435 UPDRS score 1 (the largest group) and assesses whether their age is associated
with the predicted score by our model. Fig. 8 shows the age distribution of
these participants, some of which were incorrectly estimated as scores 0, 2, or 3.
The ANOVA test on these 4 groups returned a p-value of 0.22, which indicates
that there is no significant age differences across the groups. The second test is
440 a general linear model regressing the predicted label from MDS-UPDRS with
age being a covariate. The resulting p-value associated with age is 0.21. The
insignificant results of these two tests verify that our model is not biased by
age, even though the dataset was skewed with respect to age across the four
MDS-UPDRS groups.
445 Model Interpretation. To understand which body joints contributed the
most in correctly estimating the MDS-UPDRS gait scores, we provide saliency
22Saliency
0.2
0.3
0.4
0.5
0.6
0.7
0.8
0.9
1.0
0 - normal 1 - slight 2 - moderate 3 - severe
Figure 9: Saliency for the same participants as in Fig.1 visualized on the input joints, measured
as normalized gradient update. Saliency is highest at the ankles, heels, and toes, with values
sometimes high at the arms and knees.
visualizations based on the size of the gradient updates to our model. Saliency
is calculated as the average gradient update size per joint normalized to a scale
from 0 to 1. Fig. 9 shows the saliency of 4 participants, whose gait trajectories
450 are visualized in Fig. 1). Heels, ankles and toes have highest saliency overall,
with moderate values around the arms and torso. Examiners are directed by
the MDS-UPDRS rubric to pay attention to "stride amplitude, stride speed,
height of foot lift, heel strike during walking, turning, and arm swing". The
position of the saliency matches the body parts that clinicians are instructed
455 to pay attention to by the MDS-UPDRS exam, namely the feet (particularly
heels) and arms. Our saliency analysis thus expresses significant promise in an
interpretable fashion that our method is using the correct features to perform
prediction. In the specific cases shown in Fig. 9, the participant with Score 0
has highest saliency at the right heel and right arm. In the Score 1 example,
460 the participant’s feet have moderate saliency, particularly the left ankle. The
arms and upper torso also represent moderate saliency, with very high saliency
at the right elbow. This is corroborated by the video exam, as this patient
has a stationary right arm with no bend. On the other hand, the left arm has
a moderate arm swing, thus the high saliency in only the right arm matches
465 clinical expectations. The participant with Score 2 has right toes and left knee
23with highest saliency. The initial clips did not have high saliency at the knee,
but after the patient turned and started walking back, saliency at the left knee
greatly intensified. In the score 3 sample, the model places very high saliency at
both ankles. This participant’s ankles do not bend at all when walking, which is
470 one of the primary indicators of severe gait impairment and should be scored as
3.
We additionally produce and visualize the learned confusion matrices of the
mean CM estimates for each rater in Fig. 10. Recall that the confusion matrix
A(r) for rater r is the probability that r rates the ground-truth score yi = c as
(r)
475 yi = c0 . This probability characterizes the systematic bias of rater r. All raters
have strongest confidence on the diagonal, showing a clear pattern of partial
consensus with our “ground-truth” learned by our model. Rater C has the highest
incidence with ground-truth for score 0 and 2, Rater A has the highest such
incidence for score 1, and Rater B for score 2. This shows our raters each having
480 highest co-incidence with ground-truth for specific classes. Rater B shows a trend
of “overestimating” the gait score for 1 and 2 compared to our ground-truth, while
rater C tends to “underestimate.” Rater A also “underestimates” with highest
confusion between classes 0 and 1. Furthermore, Score 1 consistently has the
lowest accordance with the ground-truth in the confusion matrices for all three
485 raters. Due to the nature of our ground-truth scores representing the majority
vote, we note that these characterizations are not indicative of the quality of the
scores, but rather their consensus with the majority vote among our clinicians.
Thus, “over” and “under” estimation represent equally valid conservative opinions
which either maximize for sensitivity or specificity.
490 4.2. Finger Tapping Score Estimation Results - Single Rater Scores
For this experiment, only one rater scores the videos, so we run our OF-DDNet
without RCE. The results of our finger tapping score estimation and baselines
are listed in Table 4. Our method, OF-DDNet, achieves a macro-average AUC
of 0.69, F1 -score of 0.47, precision of 0.47, and balanced accuracy (average recall)
495 of 48%. We compare this to three baselines, Baseline DD-Net (Yang et al., 2019)
24A B C
0 0.69 0.25 0.036 0.023 0 0.75 0.2 0.027 0.018 0 0.84 0.094 0.038 0.026 0.8
1 0.25 0.64 0.077 0.039 1 0.049 0.54 0.39 0.022 1 0.32 0.43 0.052 0.19 0.6
0.4
2 0.03 0.24 0.7 0.03 2 0.045 0.08 0.54 0.33 2 0.024 0.24 0.71 0.021
0.2
3 0.025 0.048 0.16 0.76 3 0.024 0.027 0.024 0.93 3 0.021 0.027 0.025 0.93
0 1 2 3 0 1 2 3 0 1 2 3
Figure 10: Visualization of the confusion matrices of the learned CM estimates for each rater
(Raters A, B, C) averaged over all folds.
Table 3: Inter-rater Agreement Metrics.
Rater 1 Rater 2 κ Agr. (%) F1 Pre Rec
A B 0.38 47.3 0.51 0.64 0.49
A C 0.39 56.4 0.59 0.73 0.58
B C 0.30 56.4 0.62 0.72 0.68
Average 0.35 53.4 0.57 0.70 0.58
without OF loss, Baseline Temporal CNN (denoted by TCNN, 1D CNN on the
joint 3D coordinates in time), and a support vector machine (SVM) with fixed
size input clips of 100 frames each (Weston et al., 1999). OF-DDNet significantly
outperforms the baselines by the Wilcoxon signed rank test (Wilcoxon, 1992)
500 (p < 0.05) performed on video clips. Both DD-Net-based methods achieve higher
metrics than TCNN and SVM. The per-class finger tapping score predictions of
our method, visualized in Fig. 11, show that MDS-UPDRS scores 1 to 3 have
fairly balanced metrics, while score 0 has high AUC but low recall, which is
caused by the small number of samples with score 0 (N = 5). Nevertheless,
505 the balanced accuracy, which takes into account the imbalanced number of
samples across scores, is significantly better than chance (null classifier) based
on permutation testing (one-tailed p = 0.003).
25Table 4: Comparison of MDS-UPDRS finger tapping score estimation. ∗ indicates statistical
difference at (p < 0.05) compared with our method, measured by the Wilcoxon signed rank
test (Wilcoxon, 1992). Best results are in bold.
Method F1 AUC Pre bAcc
Ours (OF-DDNet) 0.47 0.69 0.47 0.48
∗
DD-Net (Yang et al., 2019) 0.41 0.68 0.41 0.41
TCNN∗ 0.39 0.64 0.39 0.40
∗
SVM 0.35 0.59 0.35 0.36
F1 AUC Precision Recall
0.6 0.6 0.6
0.8 0
1
0.5 0.5 2
0.5
0.6 3
Avg
0.4 0.4 0.4
0.4
Figure 11: Per-class MDS-UPDRS finger tapping score estimation performance of our method.
Model Interpretation. We similarly present saliency visualizations for the
finger tapping test in Fig. 12. Saliency is measured as normalized gradient update
510 on the input joints of four subjects with different scores. Saliency is highest at the
thumb and index finger for all classes, which aligns with what the MDS-UPDRS
rubric instructs examiners to observe, namely the speed, amplitude, hesitations,
halts, and decrementing amplitude of the tapping between thumb and index
finger.
515 5. Discussion
In this work, we demonstrated a method to predict MDS-UPDRS gait scores
despite multiple noisy scores and the possibility of extension to other types of
PD motor severity evaluation, such as the finger tapping test. Despite high
noise from inter-rater scores (see Table 3), our method achieved compelling
260 – Normal 1 – Slight 2 – Mild 3 – Moderate
Figure 12: Saliency measured as normalized gradient update for the finger-tapping test on the
input joints of four subjects with MDS-UPDRS finger tapping score shown. Thumb joints are
connected with red edges. Saliency is highest at the thumb and index finger.
520 results on the gait model by utilizing the full distribution of ratings for a dataset
with multiple scores. As this is both a highly challenging and common problem
in machine learning, computer vision, and particularly medical applications,
demonstrating the high efficacy of this solution could be helpful in modeling
uncertainty in clinical ratings.
525 There is inherent subjectivity in the MDS-UPDRS scale (Evers et al., 2019)
despite attempts to standardize the exam through objective criterion (e.g.,
stride amplitude/speed, heel strike, arm swing). Physicians often disagree on
ambiguous cases and lean toward one score versus another based on subtle cues.
Our results are consistent with the markers that examiners are directed by the
530 MDS-UPDRS rubric to pay attention to, namely the feet (particularly heels)
and arms in the gait test and the index finger and thumb of the finger tapping
test. Our saliency analysis makes our results more interpretable and shows that
our method is using the correct features to perform prediction. As corroborated
in the results of our method, OF-DDNet with RCE, the most difficult classes to
535 categorize in clinical practice are scores 1 and 2 since the MDS-UPDRS defines its
distinction from score 1 solely by “minor” versus “substantial” gait impairment,
shown in Fig. 1. This was also verified by a test-retest reliability analysis
between A* and A (scoring and rescoring of the rater A of those participants
27that we have scores for both ratings), which resulted in a Pearson correlation of
540 r = 0.69 and an intraclass correlation of ICC = 0.60. The test-retest yielded
(κ = 0.38, F1 = 0.4, precision = 0.52, recall = 0.50). Taking either set of ratings
to determine the “true” class (represented as either precision or recall) produces
bAcc around only 50.0%. In comparison, our method strongly classified the data
and is superior according to these metrics against the majority vote, showing
545 the reliability of our estimation (Table 2).
Scoring the motor MDS-UPDRS exam is known to have high inter-observer
variability, which we empirically evaluated to discover average Cohen’s Kappa
coefficient 0.35 and an agreement of 53.4%. Our method achieved a Cohen’s
kappa of 0.49 in comparison, much higher than between all rater pairs. Crucially,
550 this demonstrates our method’s ability to synthesize score distributions and rater
confusion estimation and generalize past the noise to find the salient patterns
shared by all raters.
Our saliency visualizations provided further evidence that our model is using
valid salient features from the input keypoints to make predictions. These
555 predictions often match the features that clinicians use to rate participants, such
as a concentration of attention in the heels, ankles, and toe areas of the feet, as
well as conditional consideration of arm swing, bend in the knees, and overall
stiffness in the torso. For different classes and participants, our model was able
to identify unique salient features for each class and for unique participants
560 We see from Table 2 that performance improves with increased information
from multiple raters. Combining all scores into a majority vote during training
omits information about the distribution of ratings and thereby resulted in the
lowest performance. When multiple rater information was more wholly retained
in the form of soft scores (Table 2, methods 4 and 5), this improved results over
565 the aggregated labels. Further preserving multiple rater data by modeling rater
confusion as explained in Sec. 3.2.3 with dual training of the estimated score
distribution and the rater confusion matrices (via RCE) produced our highest
performing model. In comparison, when trained on scores from a single rater,
as in our previous work (Lu et al., 2020), ratings may be systematically biased
28570 due to rating habits or subjective opinion of a single rater. This may enable a
model to learn the habits of a single rater very well, but risks generalizability
when compared with the ‘true score’ across multiple raters. The level of inter-
observer variability depends significantly on factors such as the application,
observer expertise, and attention (Lampert et al., 2016). Our results suggest that
575 when scores from multiple experts are available, methods that model observer
confusion as part of the training process generally perform better than methods
that aggregate the scores in a separate step prior to training. Our results also
showed significant gains from using scores provided by multiple experts. This is
demonstrated by the higher performance of the Rater Confusion Estimation and
580 Soft Label models (1, 2, 3, 4, 5, 6) over the pre-aggregated Majority Vote models
(6, 7) (see Table 2). There is opportunity for further exploration of other loss
configurations, such as KL divergence, which exhibited comparable performance
to softmax. In this work, we chose CE for simplicity due to known formulations
with the losses we used (e.g., focal loss) and easier side-by-side comparison to
585 other methods.
Furthermore, as in (Lu et al., 2020), we again show the effectiveness of our
redefined hybrid ordinal-focal loss on the additional finger tapping experiment
for tempering the effects of a small, imbalanced dataset and leveraging the
ordinal nature of the MDS-UPDRS. A score of 0 is especially difficult for our
590 model to classify, which corroborates clinical rating in which score 0 may be
frequently labeled as score 1 if there are subtle but visible disturbances. The
finger tapping test demonstrates the extensibility of our method to other aspects
of the MDS-UPDRS exam besides the gait test.
This study addresses several limitations in our previous work (Lu et al., 2020).
595 Our previous dataset had a shortage of score 0 participants in our clinical dataset,
so we included examples of non-PD gait from the public CASIA dataset. The
data was obfuscated by converting to normalized skeletons, which has similar
characteristics across both datasets, so should theoretically adequately represent
score 0. However, we mentioned that expanding the clinical dataset by recruiting
600 more participants from underrepresented classes would strengthen the results
29You can also read