Fiscal Devaluations in EMU - Number 12/11 Economic Analysis First version, June 28, 2012 This version, September 9, 2013
←
→
Page content transcription
If your browser does not render page correctly, please read the page content below
Working Papers
Number 12/11

Fiscal Devaluations in EMU
Economic Analysis
First version, June 28, 2012
This version, September 9, 2013
12/11 Working Papers
                                                                                                          First version, June 28, 2012
                                                                                                          This version, September 9, 2013

Fiscal Devaluations in EMU*
J.E. Boscáa, R. Doménecha,b,† and J. Ferria

Forthcoming in Hacienda Pública Española/Review of Public Economics

Abstract
We use a small open economy general equilibrium model to analyse the effects of a fiscal
devaluation in an EMU country. The model has been calibrated for the Spanish economy, which
is a good example of the advantages of a change in the tax mix given that its tax system shows a
positive bias in the ratio of social security contributions over consumption taxes. The preliminary
empirical evidence for European countries shows that this bias was negatively correlated with
the current account balance in the expansionary years leading up to the 2009 crisis, a period
when many EMU members accumulated large external imbalances. Our simulation results point
to significant positive effects of a fiscal devaluation on GDP and employment similar to the ones
that could be obtained with an exchange rate devaluation. However, although the effects in terms
of GDP and employment are similar, the composition effects of fiscal and nominal devaluations are
not alike. In both cases, there is an improvement in net exports, but the effects on domestic and
external demand are quite different.

Keywords: tax mix, fiscal devaluation, nominal devaluation.

JEL: E62, E47, F31.

*: Financial support from Fundación Rafael del Pino and CICYT grant ECO2011-29050 is gratefully acknowledged
Part of this research was conducted while Boscá was visiting the School of Economics at University of
Kent and Ferri the Business School at the University of Glasgow. The hospitality of these institutions is greatly
appreciated. All remaining errors are our own responsibility.
†: Corresponding author: BBVA. Castellana, 81. 28046, Madrid. Spain. Tel.: +34 915373672. E-mail address
r.domenech@bbva.com.
a: University of Valencia, Spain.
b: BBVA Research, Spain.

                                                                                                                                 Page 2
F ISCAL D EVALUATIONS IN EMU 2
1. Introduction
The Spanish economy, as many other European countries, has been affected by an intense
economic crisis since 2009. The Great Recession has especially hit the labour market with
the unemployment rate rocketing to values in excess of 27 per cent. Amidst this very ad-
verse situation the Spanish government has to accomplish with the task of consolidating
its budget, with no margin for manoeuvre to stimulate economic activity with expansion-
ary fiscal policies. Although significant structural reforms have recently been approved,
i.e. labour market and financial system reforms, these may take some time to produce
complete results. In addition, Spain cannot perform a nominal currency devaluation, as it
used to do before its membership to the Eurozone.
In this situation, is it possible to generate a temporary economic stimulus? Fahri,
Gopinath and Itskhoki (2011) have shown that, when the exchange rate cannot be deval-
ued, a particular tax combination can replicate the real effects attained under a nominal
exchange rate devaluation. This is the idea behind the so called fiscal devaluation, that is,
an increase of consumption taxes with an appropriate reduction of employers’ social con-
tributions, such that the fiscal budget remains unchanged. Therefore, although this policy
has no effects upon public deficit, it produces a decrease in terms of trade (price of exports
over the price of imports) that is expected to generate positive output and employment
effects1 . In fact, fiscal devaluations are a particular case of changes in the tax structure,
which previous contributions have shown to have considerable effects on economic activ-
ity2 .
Fiscal devaluation analysis has gained stamina in recent years. Lipinska and von
Thadden (2009), Franco (2011) and Farhi, Gopinath and Itskhoki (2011) provide quanti-
tative evaluations of the effects of a tax change from direct to indirect taxes in general
equilibrium models, whereas Franco (2011) and de Mooij and Keen (2012) provide empiri-
cal estimations on the effects on net exports, the former using an SVAR for the Portuguese
economy and, the latter by means of a dynamic panel of 30 OECD countries from 1965
to 2009. Also consistent with these results, using an experimental economy, Riedl and
Winden (2012) find that a shift from wages to consumption taxes improves economic per-
formance, given the producers’ reluctance to incur production costs up-front when facing
product price uncertainty.
In this paper we simulate the effects of a fiscal devaluation in a currency area, using
1 See also the IMF Fiscal Monitor (2011) for a detailed description of the conditions under which a fiscal deval-
uation is more likely to generate an economic stimulus, and a theoretical and empirical review of some previous
episodes of fiscal devaluations.
2 Since a survey of this literature is beyond the aim of this paper, see among others Nickell (2006), Doménech
and García (2008), Causa, 2008, Coenen, McAdam and Straub (2008), Boscá, Doménech and Ferri (2009) or OECD
(2011).F ISCAL D EVALUATIONS IN EMU 3
REMS, a small open economy general equilibrium model that has been calibrated for the
Spanish economy, given that it is a good example in the EMU of a tax system that shows
a positive bias in the ratio of social security contributions over consumption taxes3 . To
compare the effects of a fiscal devaluation in a currency area with that of a standard nomi-
nal currency devaluation, we modify our general equilibrium model as if a counterfactual
country had its own currency with the same calibrated parameters for the rest of the equa-
tions describing the equilibrium, with the exception of the monetary policy rule and the
uncovered interest rate parity.
The paper is structured as follows. In section 2 we provide an empirical motivation
for performing our simulation exercise, showing that the ratio of social security contri-
butions to indirect taxes was negatively correlated with the current account balance from
1995 to 2009. Section 3 briefly presents the model. Section 4 shows our main results. We
find that there is an equivalence between a fiscal devaluation, i.e., a change in the mix
between consumption tax and social security contributions, and a standard monetary de-
valuation through the nominal exchange rate. Results point to significant positive effects
of a fiscal devaluation on GDP and employment consistent with a real exchange devalua-
tion, if a country like Spain had the capacity to manage its own monetary policy. Finally,
section 5 concludes.
2. Empirical motivation
Despite the fact that EMU members share their currency, there are large differences be-
tween consumption (τ c ) and labour taxes, particularly in the case of social security contri-
butions (τ sc ), where differences are even larger. This is also the case for other European
countries, as shown in Figure 1, where we observe that the implicit tax rate in consump-
tion ranged from 15 to almost 35 per cent in 20074 , whereas the implicit tax rate in social
security ranged from 1.5 to 31 per cent5 . In fact, there is a negative correlation between
these implicit tax rates, implying that the tax rate mix, measured by the ratio of implicit
tax rates on social security over consumption (τ sc /τ c ) changed significantly among this
sample of countries, from a maximum value of 1.82 in Greece to 0.04 in Denmark.
3 For a complete description of the model, see Boscá et al. (2010) and Boscá et al. (2011).
4 We focus on one year to offer a clear picture of the differences among countries. We choose the year 2007
because it represents the last year previous to the economic crisis and when differences in current account imbal-
ances were also larger.
5 Implicit tax rates have been taken from Eurostat (2013). The tax rate on consumption is defined as all con-
sumption taxes divided by the final consumption expenditure of private households in the economic territory.
The social security contributions rate is defined as the sum of employees’ and employers’ social contributions
levied on employed labour income divided by the total compensation of employees working in the economic ter-
ritory. Given that the convergence process may take time, in Figure 1 we focus only on the first 15 members of
the European Union, after the enlargement in 1995.F ISCAL D EVALUATIONS IN EMU 4
32
FR
28 EL DE
IT BE
Implicit tax rate in social security
24 ES AT NL
FI
20 LU
16 PT
SE
12 UK IE
8
4
DK
0
15 19 23 27 31 35
Implicit tax rate in consumption
Figure 1: Implicit tax rates in consumption and social security, EU15, 2007.
0,11
LU
SE
0,07 DE
NL
FI
0,03 AT
Current account / GDP
DK BE
IT
-0,01 FR
UK
-0,05 IE
-0,09 PT
ES
-0,13
EL
-0,17
0,5 0,7 0,9 1,1 1,3 1,5 1,7 1,9
Social security contributions/Consumption tax
Figure 2: Ratio of implicit tax rates on social security over consumption and the
current account over GDP, EU15, 2007.F ISCAL D EVALUATIONS IN EMU 5
The reduction of the tax mix τ sc /τ c is referred to as a fiscal devaluation since, at least
in the short term, it can make home exports cheaper relative to foreign exports, inducing
an improvement in net exports and boosting output and employment. In this section we
offer some evidence that shows that the ratio of implicit tax rates on social security over
consumption was negatively correlated with the surplus of the current account in terms
of GDP, particularly in the years previous to the Great Recession, where large external
imbalances where accumulated.
Table 1 presents some econometric results. Columns (1) to (4) show the pool esti-
mations of regressing the current account (as a percentage of GDP) on τ sc /τ c and a set of
different control variables. The sample considered covers the period from 1995 to 2009 for
EU15. All the models also include a country dummy for Denmark, Ireland, Portugal and
the UK6 . As we can see in column (1), the coefficient of τ sc /τ c is negative and statistically
significant. Columns (2) to (4) confirm that τ sc /τ c is statistically robust to the inclusion of
(1− τ l )
other explanatory variables, such as the tax wedge (1 − (1+τ c )(1+τ sc ) ) or the log of GDP
per capita. Finally, in column (5) we present the estimates corresponding to a cross-section
sample of EU27 countries for 2007. Results in column (5) also confirm the negative coef-
ficient for the variable τ sc /τ c7 . Related to previous estimates, Figure 2 displays the evi-
dence for 2007 pointing out that the lower the ratio of social security contributions over
consumption taxes the larger the surplus of the current account over GDP8 .
According to these results, and taking as reference the year 2007, if a country like
Spain had reduced social security contributions by 1% of GDP and had increased con-
sumption taxes revenues by the same amount (implying a change in its τ sc /τ c ratio from
1.52 to 1.29), it would have improved the current account by between 1.4 and 2.8 pp of
GDP. These results are consistent with de Mooij and Keen (2011), who find that a shift of
one percent of GDP from social security contributions to VAT taxes in the short term in-
crease net exports between 1 and 4 percent of GDP. However, the number of contributions
that have approached this question through simulated economies obtain smaller effects,
as summarized by the IMF (2011).
6 This is a dummy that takes the value 1 for these four countries and 0 for the rest. The coefficient of the ratio
of social security contributions over consumption taxes is also negative when this dummy, which significantly
improves the fit of the regression, is excluded in columns (1) to (4) of Table 1.
7 Sample countries in column (5) also includes all enlargement countries from 2004 onwards, with the excep-
tion of Poland, although results are robust when considering only EMU countries.
8 As in columns (1) to (4), Figure 2 also controls for the country dummy for Denmark, Ireland, Portugal and the
UK. That is, in this figure we represent the orthogonal components of the current account over GDP and τ sc /τ c
to the country dummy, after adding the corresponding sample averages. The Frisch-Waugh theorem states that
the multiple regression coefficient of τ sc /τ c (which corresponds to the negative slope of the line in Figure 2) can
be obtained by first netting out the effects of the dummy variable from both the dependent variable and τ sc /τ c .F ISCAL D EVALUATIONS IN EMU 6
TABLE 1 − TAX MIX AND C URRENT A CCOUNT
(1) (2) (3) (4) (5)
Constant 0.15 0.20 −0.36 −0.50 −0.198
(18.8) (6.13) (−4.02) (−3.97) (1.63)
τ sc /τ c −0.11 −0.12 −0.09 −0.08 −0.06
(−16.0) (−11.9) (−13.1) (−7.51) (−3.41)
(1 + τ c )/(1 − τ l − τ sc ) −0.08 0.06 0.09
(1.99) (1.21) (2.16)
GDP per capita (log) 0.05 0.06 0.01
(5.72) (5.73) (3.03)
Country dummy −0.12 − 0.13 −0.10 −0.09 −0.09
(−18.5) (−14.6) (−17.0) (−10.1) (−4.90)
N. observations 219 211 219 211 27
R2 0.63 0.64 0.67 0.69 0.78
Dependent variable: Current Account as percentage of GDP. t-statistics in parenthesis.
3. The dynamic model
We use a small open economy general equilibrium model to simulate the effects of a fiscal
devaluation in Spain. To this aim we use the model developed by Boscá et al. (2010 and
2011). In this section we just outline its main characteristics, however, greater detail on the
model’s set-up can be found in the Appendix.
REMS is a small open economy dynamic general equilibrium model that features
the main characteristics of the Spanish economy and it builds upon the existing literature
on macroeconomic models9 . The model is primarily intended to serve as a simulation
tool for the Spanish economy, with a focus on the economic impact of alternative policy
measures over the medium term. The small open economy assumption implies that a
number of foreign variables are given from the perspective of the national economy and
that the magnitude of spillover effects on other countries is small. This modelling choice
seems to us to be a fair compromise between realism and tractability.
REMS is a New Neoclassical-Keynesian synthesis model. Equations in the model
are explicitly derived from intertemporal optimization by representative households and
firms under technological, budgetary and institutional constraints. Thus, economic deci-
sions are solidly micro-founded and any ad-hoc dynamics have been avoided. Behaviour
is predominantly forward-looking and short-term dynamics are embedded into a neoclas-
sical growth model that determines economic developments over the long run. However,
9 Many central banks and international institutions have elaborated D(S)GE models. These include, inter alia,
QUEST III for the EU (Ratto et al., 2009), SIGMA for the US (Erceg et al., 2006), the BEQM for the UK (Harrison et
al., 2005), the TOTEM for Canada (Murchison et al., 2004), AINO for Finland (Kilponen et al., 2004), or the models
devised by Smets and Wouters (2003) for EMU, Lindé et al. (2004) for Sweden and Cadiou et al. (2001) for 14
OECD countries. Two models of the Spanish economy different to REMS are BEMOD and MEDEA, respectively
developed by Andrés et al. (2006) and Burriel et al. (2010).F ISCAL D EVALUATIONS IN EMU 7
as markets do not generally work in a competitive fashion, the levels of employment and
economic activity will be lower than those that would prevail in a competitive setting.
In the short term, REMS incorporates nominal, real and financial frictions. Real fric-
tions include adjustment costs in consumption (via the incorporation into the model of
consumption habits and rule-of-thumb households) and investment into physical capital.
The model also allows for slow adjustment of wages, and price rigidities, which are speci-
fied through a Calvo-type Phillips curve. All these modelling choices are fairly in line with
other existing models for the Spanish economy. The main contribution of REMS to this re-
newed vintage of D(S)GE models is the specification of the labour market according to the
search paradigm. This approach has proved successful in providing micro-foundations for
equilibrium unemployment in the long run and accounting for both the extensive and in-
tensive margins of employment at business-cycle frequencies. It is therefore best suited to
the assessment of welfare policies having an impact on the labour market (see also Stähler
and Thomas, 2012)
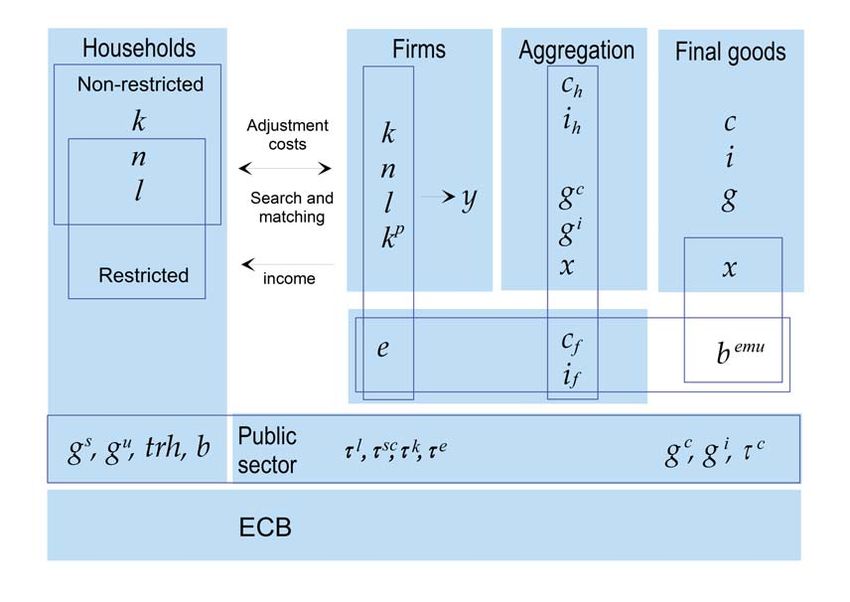
Figure 3 sketches with more detail the main ingredients of the simulation model. In
a decentralized economy optimizing (non-restricted) households, firms, policymakers and
the external sector actively interact each period by trading one final good y, j differentiated
intermediate goods, government bonds (b), three primary production factors (total labor
nl, private capital, k, and public capital, k p ) and one intermediate input (energy, e).
In addition to optimizing or Ricardian households, there are restricted individuals
(rule-of-thumb consumers) that do not have access to financial markets, so that they are
liquidity constrained by their current income. Households are the owners of the available
production factors and all the firms operating in the economy. Thus, they rent physi-
cal capital (Ricardian households) and labour services (both Ricardian and rule-of-thumb
households) out to firms, for which they receive rental rates (r) and wages (w).
Each household is made up of working-age members who may be active or inac-
tive. In turn, active workers participating in the labour market may either be employed or
unemployed. Unemployed workers are actively searching for a job. Firm investment in
vacant posts is endogenously determined and so are job inflows. Finally, job destruction is
taken as exogenous. Job creation is costly in terms of time and real resources. Thus, pure
economic rents arise from each job match over which the worker and the firm negotiate
in an efficient-bargaining manner, determining hours per worker (l) and wages (w). Al-
though optimizing and rule-of-thumb households have a different reservation wage, they
delegate a trade union to bargain with firms over wages and hours and to distribute em-
ployment according to their shares in the working-age population (see Boscá, Doménech
and Ferri, 2011).
All households in the economy pay taxes and receive transfers from the govern-F ISCAL D EVALUATIONS IN EMU 8
Figure 3: Agents, markets and variables in the REMS model.
ment. Each period the government faces a budget constraint where overall expenditure
(public consumption, gc , public investment, gi , unemployment benefits, gu , and other so-
cial transfers, gs ) is financed by debt issuance (b) and various distortionary taxes (labour
income taxes, τ l , capital income taxes, τ k , social security contributions, τ sc , consumption
taxes, τ c , and energy taxes, τ e ). Intertemporal sustainability of the fiscal balance is ensured
by a conventional policy reaction function, whereby a lump-sum transfer, trh, accommo-
dates the deviation of the debt-to-GDP ratio from its target level.
Monetary policy is managed by the European Central Bank (ECB) via a Taylor rule,
which allows for some smoothing of the interest rate response to inflation and output gap
(see below).
The intermediate sector is composed of monopolistically competitive firms which
produce intermediate varieties employing capital, labour and energy. The final goods
sector combines varietes of differentiated intermediate inputs to produce export goods
(x), as well as home produced consumption and investment goods (ch and ih ) which are
imperfect substitutes for goods produced abroad (c f and i f ). Thus, total consumption (c)
and investment (i) are defined as c = ch + c f and i = ih + i f . Net foreign assets (bemu ) areF ISCAL D EVALUATIONS IN EMU 9
regarded as a stock variable resulting from the accumulation of current account flows.
The model is parameterised using Spanish data for the period 1985:3 to 2009:4. To
this end, a database (REMSDB10 ) has been elaborated that satisfies the estimation and
calibration requirements of the model and is suitable for generating a baseline scenario for
REMS.
4. Results
The model described in the previous section is used here to simulate the advantages of a
change in the tax mix in favour of increasing consumption taxes and reducing social secu-
rity contributions. We illustrate it in two steps. First, we show the effects on GDP of a rise
in every one of the different tax figures. Second, we find the equivalence between a fiscal
devaluation, i.e., a change in the mix between consumption tax and social security contri-
butions, and a more standard competitive devaluation taking place through the exchange
rate.11
4.1 The effects of increasing taxes
As an indication of the different distortions originated by the set of taxes in the Spanish
economy, we first perform an exercise consisting of permanently increasing the tax rates.
The exercise is designed such as government revenues increase ex-ante by 1 percentage
point of GDP. Figure 4 shows the accumulated effects on GDP after two years, in terms of
its percentage deviation with respect to the steady state). This figure clearly shows that
after two years the negative effect of rising taxes is greater for capital or social security
taxes than for consumption taxes. This is the typical result in the theory of tax incidence in
a dynamic framework. Capital taxation has important distortionary effects on economic
activity (see, for example, Cooley, 1992 or Baylor, 2005). Higher capital taxes reduce the
capital return net of taxes on impact, depressing investment and lowering the capital to
labour ratio. In the long run, lower values for the capital stock and output negatively affect
households consumption, given the steady-state reductions in wages and employment.
Also in the REMS model increasing payroll or labour taxes is more harmful for economic
activity than increasing indirect consumption taxes.
To compare the incidence of consumption taxes and social security contributions,
let us define the tax wedge (τ) as the difference between the effective consumption wage
10 See Boscá et al., 2007, for further details.
11 In this paper we focus on the effects of fiscal devaluation on employment and output. Using a similar small
open economy model with equilibrium unemployment calibrated for the French economy, Langot, Patureauz
and Sopraseuth (2012) focus on the welfare effects of fiscal devaluations.F ISCAL D EVALUATIONS IN EMU 10
received by workers and the total effective cost paid by firms,
(1 − τ l )
τ = 1− (1)
(1 + τ c )(1 + τ sc )
According to (1) given that the tax base of consumption is higher than the tax base
of social security contributions, to maintain ex-ante revenue neutrality it is necessary to in-
crease the tax rate on consumption less than the tax rate on social security contributions.
This means that the tax wedge increases more using payroll taxes and, thus, generates
larger distortionary effects (see a similar argument in Langot et al., 2012). In addition to
this argument based on the tax base, the different effects of labour and consumption taxes
can be explained by means of their influence on the behaviour of agents. Increasing pay-
roll taxes has a direct negative effect on the value to firms of employing an additional
worker and this desincentives the posting of vacancies, directly translating into lower
wages and a reduction of hours worked. However, increasing consumption tax rates de-
presses consumption, consequently increasing the marginal utility of consumption, and
making workers willing to negotiate lower wages, but contrary to payroll taxes stimu-
lating negotiated hours. For this reason increasing consumption taxes is less harmful for
output and employment than increasing social security contributions. Finally, comparing
tax movements of direct labour taxes and social security contributions the effects on the
economy may be ambiguous depending on the elasticity of labour demand and supply.
An increase in labour taxes can be seen as an inward shift of the labour supply schedule,
while increasing payroll taxes may be equivalent to a negative shift in labour demand. Al-
though employment is harmed in both cases, the effect on wages is different and in general
equilibrium the final effect on output and employment of both measures can be different
depending on the structural characteristics of the economy. In the case of our model, as
can be appreciated in Figure 4, the negative effect of rising social security contributions is
greater than the effect of rising labour taxes.
4.2 Modelling a fiscal devaluation
The empirical motivation presented in section 2 is very indicative of the existence of a pos-
itive gap in the ratio of social security contributions over consumption taxes in Spain, as
compared to the average European country. In this subsection we study the effects of nar-
rowing this gap, by simulating, with our model a, permanent reduction of 3.5 percentage
points in the effective rate of employers’ social security contributions τ sc . To maintain the
condition of ex-ante revenue neutrality the effective tax rate on consumption (τ c ) has been
increased by 2 percentage points. As explained in the introduction, this exercise has been
called a fiscal devaluation in the literature. As can be seen in Table 2, the results imply thatF ISCAL D EVALUATIONS IN EMU 11
Social
Consumption Labour security Capital
0,0
-0,2
-0,4
-0,6
-0,75
-0,8 -0,84
-1,0
-1,0
-1,22
-1,2
-1,4
Figure 4: Accumulated effects on GDP after 2 years (percentage deviation with respect to the steady state).
this replacement of social security contributions with VAT would have a cumulative effect
on full-time equivalent employment of 1.3 per cent on the average for the first two years
after the reform. This is equivalent to more than 200,000 jobs, while GDP would increase
by 0.74%.12 Additionally, the reduction of social security contributions increases exports
by 0.9%, whereas the increase of activity leads to a significantly lower increase of imports
of 0.4% , improving net exports, as suggested in section 2.
A detailed movement of the most relevant variables can be found in Figure (5)
where we show the impulse-response functions for key variables along the forty quar-
ters after the devaluation. According to the first plot, a different behaviour of investment
and consumption is behind the effect on GDP. Whereas the combination of lower social
security contributions and a higher tax on consumption boosts the investment from the
very beginning due to the increase in the Tobin’s q, it reduces consumption in the very
short run before recovering afterwards, following an increase in the expected future in-
come. Also from the second plot it is clear that the depreciation in the real exchange rate
that follows after a fiscal devaluation has a positive effect on the volume of exports that
reaches its maximum after two years. However, from the point of view of imports there
are two opposite effects at play. On the one hand, the depreciation in the real exchange
rate induces a substitution of imports by domestic production (substitution effect). On the
other hand, the increase in the domestic demand contributes to pushing imports up (an
income effect). Overall, the dynamics of the trade balance (not represented in the figure)
12 Similar results were obtained by BBVA Research (2009), where a previous version of REMS was used.F ISCAL D EVALUATIONS IN EMU 12
TABLE 2: Equivalence between exchange rate and fiscal devaluations
Fiscal devaluation Exchange rate devaluation
Variable Year 1 Year 2 Average Year 1 Year 1 Average
GDP 0.55 0.93 0.74 0.94 0.26 0.60
Employment 1.42 1.19 1.30 1.46 1.14 1.30
Exports 0.76 1.08 0.92 12.1 12.1 12.1
Imports 0.31 0.48 0.39 −12.2 −13.1 −12.6
Real Exchange Rate 0.59 0.83 0.70 9.18 9.16 9.17
Δr emu (pp)1 0 0 0 35 35 35
ΔVAT (pp)2 2.00 2.00 2.00 0 0 0
ΔSocial contributions (pp)2 −3.50 −3.50 −3.50 0 0 0
Notes: cumulated deviation in percentntage points with respect to the baseline, except for VAT and
social contributions. 1 Shock on the EMU interest rate to generate an increase in employment equiv-
alent to that obtained with a fiscal devaluation. 2 Exogenous change in the taxe rate.
displays the typical ’J-curve’, with an initial positive effect on impact, followed by a de-
terioration induced by the increase in import prices that disappears in the medium term.
Regarding the two last plots in the figure, as explained in the comments to Figure (4), the
fall in social security contributions provokes an increase in both vacancies (and hence in
employment) and hours per worker. The increase in consumption tax reinforces this last
effect, making the impact on total hours highly positive. This, in addition to the increase
in wages, augments labour income which is in part responsible for the positive effect in
aggregate demand and GDP.
Now we establish a comparison between the consequences of the fiscal devalua-
tion and the effects that an exchange rate devaluation may have on an economy similar to
Spain. The only differences between Spain and this virtual economy would be in the ex-
istence of its own national central bank that manages monetary policy and can influence
nominal exchange rates. Thus, we assume that the national central bank has complete
sovereignty over the interest rate and that the exchange rate is flexible. For this reason
we need to slightly modify some equations in our model. In the original model, mone-
tary policy is managed by the European Central Bank (ECB) via the following Taylor rule,
which allows for some smoothness of the interest rate response to the inflation and output
gap:
1 + rtemu 1 + rtemu
−1 π 1 + π emu
ln = ρ r
ln + ρ ( 1 − ρ r
) ln t
+ ρy (1 − ρr )Δ ln yemu
t (2)
1 + r emu 1 + r emu 1 + π emu
where all the variables with the superscript ”emu” refer to EMU aggregates Thus, rtemu
and π emu
t are the euro-zone (nominal) short-term interest rate and inflation as measured in
terms of the consumption price deflator and Δ ln yemu
t measures the relative deviation ofF ISCAL D EVALUATIONS IN EMU 13
GDP and private absorption External sector
1.4 1.2
GDP Imports
1.2 Consumption 1 Exports
Investment Real ex rate
1
0.8
0.8
0.6
0.6
0.4
0.4
0.2
0.2
0 0
-0.2 -0.2
0 10 20 30 40 0 10 20 30 40
Employment and wages Vacancies
3 14
Vacancies
12
2.5
10
2 8
Wages
1.5 6
4
Eq employment
1
2
0.5 0
0 10 20 30 40 0 10 20 30 40
Figure 5: Impulse-response after a fiscal devaluationF ISCAL D EVALUATIONS IN EMU 14
GDP growth from its trend. There is also some inertia in nominal interest rate setting. The
Spanish economy contributes to EMU inflation according to its economic size in the euro
zone, ω Sp :
sp
π emu
t = (1 − ω Sp )π remu
t + ω Sp π t (3)
where π remu
t is average inflation in the rest of the Eurozone. In addition, the disappearance
of national currencies since the inception of the monetary union means that the intra-euro-
area real exchange rate is given by the ratio of relative prices between the domestic econ-
omy and the remaining EMU members, so real appreciation / depreciation developments
are driven by the inflation differential of the Spanish economy vis-à-vis the euro area:
rert+1 1 + π emu
t +1
= sp (4)
rert 1 + π t +1
To simulate the effects of a nominal devaluation we consider, first, as though the
counterfactual economy had an independent central bank managing monetary policy.
Thus, we set ω Sp = 1, and the Taylor’s rule becomes
sp sp sp
1 + rt 1 + r t −1 1 + πt
+ ρπ (1 − ρr ) ln
sp
ln = ρr ln + ρy (1 − ρr )Δ ln yt (5)
1+r sp 1+r sp 1+π sp
Second, given that we have to consider a nominal exchange rate, we substitute equa-
tion (4) with an uncovered interest rate parity:
sp
sp rert+1 1 + π t+1
1 + rt = 1 + εt r emu (6)
rert 1 + π emu
t +1
where εt captures the exogenous shock on the foreign interest rate that we need to generate
the nominal exchange rate devaluation. To have a metric to compare the effects of the
fiscal and nominal devaluations we have implemented a shock εt that generates with the
nominal devaluation the same accumulated effect on employment after two years (1.3%).
According to the results in Table 2 an exchange rate depreciation of about 10% is
required to generate similar employment effects to those obtained with the fiscal devalu-
ation. As observed, the effects on GDP and employment are similar, although with less
persistence, whereas the effects on exports and imports are much more pronounced. This
suggests that, although the effects in terms of GDP and employment are similar, the com-
position effects of fiscal and nominal devaluations are different. In both cases, there is an
improvement in net exports, but the effects on domestic and external demand are quite
different.
Besides this composition effect, another difference between our nominal and fiscalF ISCAL D EVALUATIONS IN EMU 15
TABLE 3: Steady state results of the fiscal devaluation
Fiscal devaluation
Variable Steady state
GDP 0.55
Employment 0.58
Real Exchange Rate 0.46
Exports 0.59
Imports 0.13
ΔVAT (pp) 2.00
ΔSocial contributions (pp) −3.50
Cumulated deviation in percentage points with respect to the baseline, except for VAT and social contributions.
devaluations relates with the long term effects. Whereas the exchange rate devaluation
is neutral from a steady state point of view, the fiscal devaluation has non-zero effects
in the long run. This fact was already apparent in Figure (5). In Table 3 we show the
exact long term effects. The reason we find non-zero steady-state effects is related to our
design of the fiscal devaluation. Contrary to the ex-post revenue neutral exercise in Fahri
et al (2011) we have implemented an ex-ante revenue neutral fiscal devaluation that can
modify the steady state of the economy13 . Thus, although total tax revenue would be
constant if macroeconomic variables remained unaltered (ex-ante neutrality criterion), our
change in the tax mix is going to effectively reduce economic distortions in the economy.
This produces positive effects in macroeconomic variables, such as consumption, labour
or wages, estimulating total tax revenues in the long run (ex-post revenue effect).
Finally, in order to check the robustness of our results, we have repeated the analysis
of the effects of the fiscal devaluation considered in Table 2 under different specifications
of our model. The results of these exercises are shown in Table 4. For each exercise we
show average effects on employment and GDP after two years. To facilitate comparisons,
the first row only shows the results of our baseline.
In the second row we show the results for λr = 0.8, that is, when we increase the
share of rule-of-thumb consumers in the economy. The effects increase around 8 per cent
with respect to the baseline. Conversely, as the share of Ricardian consumers is smaller,
the effects of fiscal devaluation are also smaller, as row (3) shows.
In the fourth row we increase the bargaining power of workers (λw = 0.9). A higher
value of λw increases the sensitivity of wages to marginal labour productivity. In this case,
the effects on employment and GDP are higher than in the baseline.
13 This is also the approach in Langot et al (2012). This assumption is also more realistic from a policy-maker
point of view.F ISCAL D EVALUATIONS IN EMU 16
TABLE 4: Sensitivity analysis. Average effects after two years
Employment GDP
(1) Baseline ( 1 ) 1.30 0.74
(2) λr = 0.8 1.40 0.81
(3) λr = 0.0 1.13 0.61
(4) λw = 0.9 1.60 0.97
(5) σ x , σ c , σ i × 2 1.31 0.76
(6) s x , ω c , ω i × 0.5 1.32 0.75
(7) ρw = 0.9 2.13 0.98
(8) η = 1.5 1.94 1.21
(1) Baseline values: λr = 0.5, λw = 0.43, ρw = 0.75, η = 2.0
In the fifth row we multiply by 2 the elasticity of imports and exports to relative
prices. In row (6), we reduce the degree of openness of the economy, dividing the scale
factors in exports and imports equations (s x , ω c and ω i ) by 2. In both cases the results
show low sensitivity to these two sets of parameters.
In row (7) we show the case of a change in the coefficient of real wage inertia, from
our baseline of ρw = 0.75 to ρw = 0.9. We see our benchmark value of ρw = 0.75 as a
lower bound, given that it implies that wages adjust fully to negotiated wages after four
quarters. With a value of ρw = 0.9 full adjustment of wages would instead take ten quar-
ters. As was shown in Figure (5) a fiscal devaluation induces a wage increase, because the
reduction in social security contributions makes firms more willing to open new vacan-
cies and to pay higher wages. Our results in row (7) confirm that making effective wages
less dependent on negotiated wages increases the effects of the fiscal devaluation both on
employment and GDP, since wages react upwards more slowly to the change in the tax
structure. Hence, removing real rigidities from the wage setting process would reduce the
impact that a fiscal devaluation has on GDP and employment, in the same way that the
absence of nominal rigidities makes a nominal exchange rate devaluation ineffective.
In the last row we reduce the value of the parameter η from 2 to 1.5, implying that
the Frisch elasticity of labour supply, 1/η, increases from 0.5 to 0.67. As could be expected,
a higher elasticity of labour supply makes negotiated hours more sensitive to a reduction
in social security contributions, provoking a more intense effect of the fiscal devaluation
on total employment and output.
4.3 How feasible is it that a fiscal devaluation generates an economic stimulus?
The results presented in previous paragraphs point to significant positive effects on GDPF ISCAL D EVALUATIONS IN EMU 17
and employment of increasing VAT and simultaneously decreasing social contributions,
similar to those that could be obtained with a nominal exchange rate devaluation. How-
ever, although these results are robust to different parameter configurations in our model,
it is an open question if the proposed change in the tax mix may produce the desired re-
sults in the real economy. In this subsection we briefly discuss some important issues that
may influence the way a fiscal devaluation may work in reality.
First, it must be noted that the final outcome of a fiscal devaluation depends cru-
cially on the pass-through of VAT and payroll taxes to domestic prices. Increasing VAT
and reducing social security contributions creates a positive gap between import prices
and domestic prices. This change in relative prices is ultimately responsible for the gain
in competitiveness and consequently for improvements in output and employment. Ob-
viously, if the pass-through of VAT were complete, but the pass-through of payroll taxes
were zero, the gains of the fiscal devaluation would disappear. Although it is difficult to
accept such asymmetry, unfortunately, as far as we know, there is no empirical evidence
on this issue for Spain. Fahri et al. (2011) provide some review of (the few) existing works
for other countries. They conclude that, although pass-through from VAT to prices might
have been important, the scarce existing evidence does not shed light on the magnitude of
the pass-through from social security contributions.
Second, in political terms a fiscal devaluation has a very different conception than
a nominal devaluation. Devaluating the exchange rate is a measure that can be adopted
more than once in a short period of time (this has happened several times in many coun-
tries). However, a fiscal devaluation is only conceivable as a one-shot try to stimulate
the economy in the short and mid term. Thus, it is crucial that economic agents perceive
the measure as extraordinary, because if this is not the case labour supply decisions may
change and make it less operative. Additionally, in countries like Spain the pension sys-
tem is financed mainly through social security contributions and a measure like this would
require a significant transfer from VAT revenues to the pension system (at least to ensure
the same amount of revenues to the pension system as was the case previous to the fiscal
consolidaton).
Third, it must also be recognised that in the same vein that a nominal exchange rate
devaluation can generate a process of competitive devaluations, a fiscal devaluation can
also be adopted simultaneously by more than one country pertaining to the EMU. In fact,
Germany approved such a measure in 2007 increasing VAT by 3 percentage points and
cutting employer and employee payroll contributions by 2.3 percentage points. France
at the end of 2012, Greece and Portugal have also recently discussed the convenience of
this type of measure. A process of tax competition inside the EMU would reduce the
effectiveness of any fiscal devaluation. The extent of this reduction to the benefits of aF ISCAL D EVALUATIONS IN EMU 18
fiscal devaluation depends crucially both on the share of trade with the rest of the partner
countries and on the degree of competition in international product markets among these
countries.
Fourth, the design of the fiscal devaluation matters. We have already shown that
a higher value of the Frisch elasticity enhances the economic outcome of a fiscal devalu-
ation (see Table 4). Thus, if workers in the lower part of the wage distribution display a
higher elasticity of labour supply to wages, then cutting social security contributions for
the worst paid workers could be more effective in terms of employment and output, due
to the incentive of these workers to negotiate more hours for the same wage. Also, target-
ing the increase in VAT to tradable goods would reduce the relative price of non-tradables,
creating a shift in demand from tradable towards non-tradable goods. If non-tradables
were more labour intensive than tradables, this would reinforce the effect on employment
of the cut in social security contributions. Finally, the timing in the implementation of the
tax shift may also change the final effect of the measure. In our experiments we have as-
sumed a non-anticipated fiscal devaluation. But if, for instance, agents anticipate a future
increase in VAT, they would bring forward consumption, a decision that would reduce the
positive impact of the fiscal devaluation on net exports.
Fifth, it can be argued that increasing VAT rates could contribute to higher tax eva-
sion, but it is also true that lowering social security taxes could reduce tax fraud. Thus, the
theoretical effect is ambiguous and country specific, depending on the administration’s ca-
pacity to raise taxes and fight fiscal evasion. De Mooij and Keen (2012) conclude that, for
Spain, the bad design of the VAT system, marked by frequent exemptions and different
VAT rates, is more responsible than fraud for the low revenue from this tax. These authors
suggest that increasing the VAT base would be a more effective way of compensating for
the cut in social security contributions when designing the fiscal devaluation.
Sixth, there is a perception that VAT is a regressive tax, so increasing it could worsen
income distribution14 . Moreover, regarding particular VAT rates, some literature estab-
lishes the existence of a trade-off between efficiency and equity (see Ferri et al, 2009 or
Crawford et al, 2010, for an argument on the VAT rate on food). However, any distrib-
utional effect of increasing VAT rates could be counteracted by means of targeted social
benefits. In our baseline simulations ex-post total tax revenues increase by 0.25 percent of
GDP after two years, providing some margin to redirect public funds for social support of
the less favoured.
14 In a recent study the European Commission (see Taxation Papers, WP 36, 2013) has analyzed the redistribu-
tive effects across income groups of fiscal devaluations in several European countries. In the case of the Spanish
economy, microsimulation results show that the fiscal devaluation produces gains only for the richest 30 per
cent. Nevertheless, these results do not take into account the dynamic effects of fiscal devaluation on income and
employment, which could offset the negative effects on low income groups.F ISCAL D EVALUATIONS IN EMU 19
5. Conclusions
In this paper we have used a small open dynamic economy general equilibrium model
to analyse the effects of a fiscal devaluation in EMU. The model has been calibrated for
the Spanish economy, a country that is a good example of the advantages of a change in
the tax mix, given that its tax system shows a positive bias in the ratio of social security
contributions over consumption taxes. The results point to significant positive effects on
GDP and employment of increasing VAT by 2 pp and simultaneously decreasing social
contributions by 3.5 pp, similar to the ones that could be obtained with a exchange rate
devaluation of about 10%. However, although the effects in terms of GDP and employ-
ment are similar, the composition effects of fiscal and nominal devaluations are not alike.
In both cases, there is an improvement in net exports, but the effects on domestic and ex-
ternal demand are quite different. More generally, in the current circumstances in which
many European countries should reduce their levels of public deficit and debt, similar to
Cogan’s et al (2012) proposal, our results show that fiscal consolidations should be accom-
panied by changes in the tax mix in order to reduce distortions on saving, employment,
investment and capital accumulation, with beneficial effects on economic growth and wel-
fare.
6. References
Andrés, J., P. Burriel and A. Estrada (2006): “BEMOD: A DSGE Model for the Spanish Economy and
the Rest of the Euro Area”. Banco de España Research Paper, No. WP-0631.
Boscá, J. E. Bustos, A. Díaz, A. Doménech, R. Ferri J. Pérez, E. and L. Puch (2007): “The REMSDB
Macroeconomic Database of the Spanish Economy”. Working Paper WP-2007-04. Ministerio
de Economía y Hacienda.
Boscá, J. E., A. Díaz, R. Doménech, J. Ferri, L. Puch and E. Pérez (2010): “A Rational Expectations
Model for Simulation and Policy Evaluation of the Spanish Economy”. SERIEs: Journal of the
Spanish Economic Association, 1-2, 135-169.
Boscá, J.E., R. Doménech and J. Ferri (2009): “Tax Reforms and Labor-market Performance: An
Evaluation for Spain using REMS”. Moneda y Crédito, 228, 145-196.
Boscá, J. E., R. Doménech, J. Ferri and J. Varela (2011): The Spanish Economy: A General Equilibrium
Perspective. Palgrave MacMillan. London.
Boscá, J. E., R. Doménech and J. Ferri (2011): “Search, Nash Bargaining and Rule of Thumb Consumers”,
European Economic Review, 55(7), 927-942, 2011.
Burriel, P., J. Fernández-Villaverde and J.Rubio (2010): “MEDEA: A DSGE Model for the Spanish
Economy”. SERIEs: Journal of the Spanish Economic Association, 1-2, 175-243.
Baylor, M. (2005): "Ranking Tax Distortions in Dynamic General Equilibrium Models: A Survey".
Working Paper 2005-06. Ministère des Finances. Canada.
Cadiou, L., S. Dées, S. Guichard, A. Kadareja, J. P. Laffargue and Bronka Rzepkowski (2001): “Marmotte.
A multinational model by CEPII/CEPREMAP”. CEPII Working paper No. 2001-15.F ISCAL D EVALUATIONS IN EMU 20
Causa, O. (2008): “Explaining Differences in Hours Worked Among OECD Countries: An Empirical
Analysis”, OECD Economics Department Working Papers No. 596.
Coenen, G., McAdam, P. and R. Straub (2008): “Tax Reform and Labour-Market performance in
the Euro Area: A Simulation-based Analysis Using the New Area-Wide Model”. Journal of
Economic Dynamics and Control, 32, 2543-2583.
Cogan, J. F., J. B. Taylor, V. Wieland and M. H. Wolters (2012): “Fiscal Consolidation Strategy”. Dis-
cussion Paper No. 9041. CEPR.
Cooley, T. F. (1992): "Tax Distortions in a Neoclassical Monetary Economy". Journal of Economic The-
ory, 58, 290-316.
Crawford, I., Keen, M. and S. Smith (2010): ˇVAT and Excisesı in James Mirrlees and others (eds),
Dimensions of Tax Design: The Mirrlees Review, Oxford University Press for Institute for Fiscal
Studies.
de Mooij, R. and M. Keen (2012): “Fiscal Devaluations and Fiscal Consolidation: The VAT in Trobled
Times” in A. Alesina and F. Giavazzi (eds.), Fiscal Policy after the Financial Crisis. University of
Chicago Press (forthcoming).
Doménech, R. and J. R. García (2008): “Unemployment, Taxation and Public Expenditure in OECD
Economies”. European Journal of Political Economy, 24, 202–217.
Erceg, C. J., L. Guerrieri and C. Gust (2006): “SIGMA: A New Open Economy Model for Policy
Analysis”. International Journal of Central Banking, 2(1), 1-50.
European Commission (2013): “Study on the Impacts of Fiscal Devaluation”. Taxation Papers, Work-
ing Paper N. 36.
Eurostat (2011): Taxation trends in the European Union. Luxembourg.
Farhi, E., G. Gopinath and O. Itskhoki (2011): “Fiscal Devaluations”. NBER Working Paper No.
17662.
Ferri, J.; Moltó, M. L. and E. Uriel (2009): "Time Use and Food Taxation in Spain". FinanzArchiv /
Public Finance Analysis, 65, 313-334.
Franco, F. (2011): “Improving competitiveness through fiscal devaluation, the case of Portugal”.
Universidade Nova de Lisboa.
Harrison, R., K. Nikolov, M. Quinn, G. Ramsay, A. Scott and R. Thomas (2005): The Bank of England
Quarterly Model. Bank of England.
IMF (2011): “Fiscal Devaluationı: What Is It? and Does It Work?”, in IMF Fiscal Monitor. September.
Kilponen, J., A. Ripatti And J. Vilmunen (2004): “AINO: The Bank Of Finland’s New Dynamic Gen-
eral Equilibrium Odel Of The Finnish Economy”. Bank of Finland Bulletin, 3/2004, 71-77.
Langot, F., L. Patureauz and T. Sopraseuth (2012): “Optimal Fiscal Devaluation”. Mimeo. Cepremap.
Lindé, J., M. Nessén, and U. Söderström (2004): “Monetary Policy in an Estimated Open-Economy
Model with Imperfect Pass-Through”. Working Paper Series 167, Sveriges Riksbank.
Lipinska, A., and L. von Thadden (2009): “Monetary and Fiscal Policy Aspects of Indirect Tax
Changes in a Monetaty Union”. ECB Working Papers No. 1097.
Murchison, S., A. Rennison and Z. Zhu (2004): “A Structural Small Open-Economy Model for
Canada”. Working Papers 04-4, Bank of Canada.F ISCAL D EVALUATIONS IN EMU 21
Nickell, S. (2006): “Work and Taxes” in J. Agell and P.B. Sorensen (eds.), Tax Policy and Labour Market
Performance, Mass., MIT Press, 2006.
OECD (2011): Taxation and Employment, OECD Tax Policy Studies No. 21.
Ratto M, W. Roeger and J. in ’t Veld (2009): “QUEST III: An Estimated Open-Economy DSGE Model
of the Euro Area with Fiscal and Monetary Policy”, Economic Modelling, 26, 222-33.
Riedl, A. and F. van Winden (2012): “Input versus Output Taxation in an Experimental International
Economy”, European Economic Review (forthcoming).
Smets, F. and R. Wouters (2003): “An Estimated Dynamic Stochastic General Equilibrium Model of
the Euro Area”. Journal of the European Economic Association, 1(5), 1123-1175.
Stähler, N. and C. Thomas (2012): “FiMod – a DSGE model for Fiscal Policy Simulations”. Economic
Modelling, 29(2), 239-261.F ISCAL D EVALUATIONS IN EMU 22
Appendix: The model
1. Optimizing households
Ricardian households face the following maximization programme:
∞
(T − l1t )1−η ( T − l2t )1−η
max
cot ,not ,jto ,kot,
Et ∑β t
ln cot − ho cot−1 + not−1 φ1
1−η
+ (1 − not−1 )φ2
1−η
+ χm ln (mot )
t =0
bto ,bto,emu ,mot
(A.1)
subject to
rt (1 − τ kt ) + τ kt δ kot−1 + wt 1 − τ lt not−1 l1t + rrs 1 − not−1 l2t + 1 − τ lt gst − trht +
mot−1 bto−1 o,emu
emu bt−1
1+π ct + 1 + rt−1 1+π ct + (1 + rt−1 ) 1+π ct
n
o
Pc Pi bo,emu
−(1 + τ ct )cot Ptt − Ptt jto 1 + φ2 kot
j
− γ A γ N mot + bto + tφ =0
t −1 bt
(A.2)
γ A γ N kot = jto + (1 − δ)kot−1 (A.3)
γ N not = (1 − σ )not−1 + ρw
t s (1 − n t −1 )
o
(A.4)
cot ,not−1 and s(1 − not−1 ) represent, consumption, the employment rate and the unemploy-
ment rate of optimizing households; s is the (exogenous) share of the non-employed work-
ers actively searching for jobs; T, l1t and l2t are total endowment of time, hours worked per
employee and hours devoted to job search by the unemployed. l1t is determined jointly by
the firm and the worker as part of the same Nash bargaing that is used to determine wages
(see section 6 below). l2t is assumed to be a function of the overall economic activity, so
that individual households take it as given.
Future utility is discounted at a rate of β ∈ (0, 1). The parameter η defines the
Frisch elasticity of labour supply, which is equal to η1 . ho > 0 indicates that consumption
is subject to habits. The subjective value imputed to leisure by workers may vary across
employment statuses, and thus φ1 = φ2 in general.
The maximization of (A.1) is constrained as follows. Thebudget constraint (A.2)
describes the various sources and uses of income. The term wt 1 − τ l not−1 l1t captures
net labour income earned by the fraction ofemployed workers, where wt stands for ef-
fective hourly real wages. The product rrwt 1 − τ s 1 − not−1 l2t measures unemploy-
l
ment benefits accruing to the unemployed, where rr denotes the replacement rate. We con-F ISCAL D EVALUATIONS IN EMU 23
ρw ∗(1−ρw )
sider staggered wages according to the expression wt = wt−1 wt−1 where wt∗ stands for
the bargained wage (see below). Ricardian households hold four kinds of assets, namely
private physical capital (kot ), domestic and euro-zone bonds (bto and btow ) and money bal-
ances (Mto ). Barring money, the remaining assets yield some remuneration. As reflected
in rt kot−1 (1 − τ k ) + τ k δkot−1 , optimizing households pay capital income taxes less deprecia-
tion allowances after their earings on physical capital. Interest payments on domestic and
bo bow
foreign debt are respectively captured by rtn−1 1+t−π1c , and rtemu t −1 n
−1 1+π ct , where r and r
emu rep-
t
resent the nominal interest rates on domestic and EMU bonds, which differ because of a
risk premium (see further below). The remaining two sources of revenues are lump-sum
transfers, trht , and other government transfers, gst .
Pc
The household’s consumption is given by (1 + τ c ) Ptt cot , where τ c is the consump-
tion income tax. Investment into physical capital, which is affected by increasing marginal
Pi φ j
costs of installation, is captured by Ptt jto 1 + 2 k t . Note that the presence in the
t −1
model of the relative prices Ptc /Pt and Pti /Pt implies that a distinction is made between the
three deflators of consumption, investment and aggregate output.
The remaining constraints faced by Ricardian households concern the laws of mo-
tion for capital and employment. Each period the private capital stock kot depreciates at the
exogenous rate δ and is accumulated through investment, jto . Thus, it evolves according to
(A.3). Employment obeys the law of motion (A.4), where not−1 and s(1 − not−1 ) respectively
denote the share of employed and unemployed optimizing workers in the economy at the
end of period t − 1. Each period employment is destroyed at the exogenous rate σ and
new employment opportunities come at the rate ρw t , which represents the probability that
one unemployed worker will find a job. Although the job-finding rate ρw t is taken as given
by individual workers, it is endogenously determined at the aggregate level according to
the following Cobb-Douglas matching function:
χ 1− χ2
t s (1 − nt−1 ) = ϑ t ( vt , nt−1 ) = χ1 vt [ s (1 − nt−1 ) l2t ]
ρw 2
(A.5)
2. Rule-of-thumb households
RoT households do not have access to capital markets, so that they face the following
maximization programme:
∞
(T − l1t )1−η ( T − l2t )1−η
max
r r
Et
ct ,nt
∑β t
ln crt − hr crt−1 + nrt−1 φ1
1−η
+ (1 − nrt−1 )φ2
1−η
t =0
subject to the law of motion of employment (A.4) and the specific liquidity constraintF ISCAL D EVALUATIONS IN EMU 24
whereby each period’s consumption expenditure must be equal to current labour income
and government transfers, as reflected in:
Pc
wt 1 − τ lt nrt−1 l1t + rrs 1 − nrt−1 l2t + gst 1 − τ lt − trht − (1 + τ ct )crt t = 0 (A.6)
Pt
γ N nrt = (1 − σ )nrt−1 + ρw
t s (1 − n t −1 )
r
(A.7)
3. Aggregation
Aggregate consumption and employment can be defined as a weighted average of the
corresponding variables for each household type:
ct = (1 − λr ) cot + λr crt (A.8)
nt = (1 − λr ) not + λr nrt (A.9)
For the variables that exclusively concern Ricardian households, aggregation is per-
formed as:
k t = (1 − λr ) kot (A.10)
jt = (1 − λr ) jto (A.11)
bt = (1 − λr ) bto (A.12)
btemu = (1 − λr ) btoemu (A.13)
mt = (1 − λr ) mot (A.14)You can also read